
ABSTRACT
Cellular effects of ionizing radiation include oxidative damage to macromolecules, unfolded protein response (UPR) and metabolic imbalances. Oxidative stress and UPR have been shown to induce macroautophagy/autophagy in a context-dependent manner and are crucial factors in determining the fate of irradiated cells. However, an in-depth analysis of the relationship between radiation-induced damage and autophagy has not been explored. In the present study, we investigated the relationship between radiation-induced oxidative stress, UPR and autophagy in murine macrophage cells. A close association was observed between radiation-induced oxidative burst, UPR and induction of autophagy, with the possible involvement of EIF2AK3/PERK (eukaryotic translation initiation factor 2 alpha kinase 3) and ERN1/IRE1 (endoplasmic reticulum [ER] to nucleus signaling 1). Inhibitors of either UPR or autophagy reduced the cell survival indicating the importance of these processes after radiation exposure. Moreover, modulation of autophagy affected lethality in the whole body irradiated C57BL/6 mouse. These findings indicate that radiation-induced autophagy is a pro-survival response initiated by oxidative stress and mediated by EIF2AK3 and ERN1.
Abbreviations
ACTB: actin, beta; ATF6: activating transcription factor 6; ATG: autophagy-related; BafA1: bafilomycin A1; CQ: chloroquine; DBSA: 3,5-dibromosalicylaldehyde; EIF2AK3: eukaryotic translation initiation factor 2 alpha kinase 3; ERN1: endoplasmic reticulum (ER) to nucleus signaling 1; IR: ionizing radiation; MAP1LC3/LC3: microtubule-associated protein 1 light chain 3; 3-MA: 3-methyladenine; MTOR: mechanistic target of rapamycin kinase; NAC: N-acetyl-L-cysteine; PARP1: poly (ADP-ribose) polymerase family, member 1; 4-PBA: 4-phenylbutyrate; Rap: rapamycin; ROS: reactive oxygen species; UPR: unfolded protein response; XBP1: x-box binding protein 1
Introduction
Accumulating evidence suggests that acute exposure to ionising radiation, mainly low-linear energy transfer/LET causes macromolecular damage as well as reduced mitochondrial potential, leading to the generation of reactive oxygen species (ROS) and reactive nitrogen species. These events finally lead to activation of different signaling pathways including apoptosis, cell-growth and autophagic induction [Citation1–Citation4].
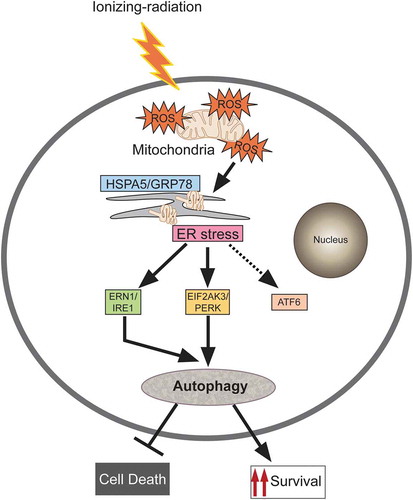
Figure 8. Proposed model for molecular signaling involved in radiation-induced autophagy. Radiation exposure results in the generation of numerous reactive oxygen species (ROS) mainly via mitochondrial potential disturbance. The formed ROS may cause damage to the macromolecules (primarily DNA, proteins and lipids) leading to protein misfolding and unfolding, resulting in ER stress. This stress is sensed through the UPR sensor HSPA5/GRP78 (which binds to the unfolded proteins) causing instigation of UPR through predominant activation of the EIF2AK3 and ERN1 branches of the UPR. The UPR results in the induction of autophagy in radiation-exposed conditions. This radiation-induced autophagy, which is dependent on ROS production and UPR for its induction, is a pro-survival stress response (which may be due to efficient recycling of damaged cellular cargos generated upon radiation exposure).
Autophagy is an evolutionarily conserved, lysosome-mediated degradation process. It helps in maintaining cellular homoeostasis upon various cellular traumas [Citation5–Citation10]. During macroautophagy (hereafter autophagy), a unique double-membrane autophagosome is formed, which engulfs cytoplasmic cargos and fuses with the lysosome to facilitate degradation of the sequestered cargo [Citation11]. The core proteins involved in autophagosome formation are known as autophagy-related (ATG) proteins [Citation12,Citation13].
Radiation exposure causes macromolecular damage both by direct interaction and indirectly through the generation of reactive oxygen/nitrogen species [Citation6]. Radiation-induced damage involves ROS generation leading to oxidative stress. In turn, oxidative stress may lead to various imbalances in the cell, including DNA damage, compromized mitochondrial functioning, protein misfolding, etc. In contrast to other stresses, autophagy induction following exposure of cells to radiation has received little attention [Citation6–Citation10]. Although, various studies have shown the induction of autophagy during radiation exposure, an in-depth analysis of the relationship has not been explored [Citation14–Citation19]. Recently, increasing doses of radiation have been shown to induce acidic vacuole formation, suggesting autophagy induction [Citation4,Citation6,Citation20]. Autophagy affects the survival of various cancer types when exposed to radiation [Citation17–Citation19,Citation21]. The endoplasmic reticulum (ER) is a crucial intracellular Ca2+ reservoir that serves as a platform for numerous cellular processes including translation, post-translational modification and proper folding. The ER is also the starting point for sorting and trafficking of proteins and lipids to various organelles and the cell surface. During ER stress, newly synthesized proteins are unable to fold properly, leading to a process collectively known as the unfolded protein response (UPR) [Citation22]. During the UPR, protein synthesis shuts down until removal of all unfolded proteins from the cell system. It has been well established that stress-induced ROS formation causes indirect macromolecular damage (to DNA, proteins and lipids) [Citation23,Citation24]. It also elicits an activation signal to boost the cytosolic calcium load released from ER [Citation7]. ROS generation thus causes activation of ER stress leading to the induction of UPR [Citation25–Citation27]. Although studies have shown a correlation between radiation, UPR and autophagy, the mechanisms are not very clear [Citation2,Citation3,Citation14,Citation15,Citation28]. Therefore, it is considered worthwhile to study the possible association between ROS, ER stress and autophagy following irradiation.
Because radiation-induced macromolecular damage is associated with ROS generation, we hypothesized that autophagy is induced to recycle damaged macromolecules (cargos) thereby protecting the cell against the radiation stress. Macrophages serve as an important line of defense under most of the stress conditions in our body. Therefore, in the present study, we have investigated the induction of autophagy following irradiation in murine macrophage cell line (RAW 264.7) as well as peritoneal macrophages ex vivo. Our results demonstrate a dose- and time-dependent induction of autophagy following radiation exposure, which was ROS-dependent and preceded by UPR, specifically through the activation of EIF2AK3/PERK (eukaryotic translation initiation factor 2 alpha kinase 3) and ERN1/IRE1 (endoplasmic reticulum [ER] to nucleus signaling 1) UPR pathways. Further, the induced autophagy facilitated the survival of irradiated cells by attenuating apoptotic cell death.
Results
Radiation induces autophagy in RAW 264.7 cells
Autophagy has been suggested to play a pro-survival role under various stress conditions [Citation29–Citation33]. To investigate the role of autophagy in radiation-induced cellular stress and cell death; we first determined dose-dependent lethality of RAW 264.7 cells exposed to IR (0 to 10 Gy) by analyzing growth inhibition. The LD50 was found to be approximately 2.5 Gy in these cells (). Unless specified otherwise, all further investigations to understand the relationship between radiation-induced cell death and autophagy were carried at an absorbed radiation dose of 2.5 Gy, 12 or 24 h post-irradiation. A time-dependent growth inhibition (relative cell number at 24 h after irradiation) was accompanied by loss of cell as well as metabolic viability, and a significant loss of clonogenic survival at 2.5 Gy ( and S1), clearly suggesting cell death. Next, we examined the induction of cell death by analyzing phosphatidyl externalization using multi-parametric flow cytometry with ANXA5/annexin V and propidium iodide (PI; apoptosis), as well as uptake of PI (necroptosis) (, upper left and right panel, respectively) and found 30% to 40% increase in ANXA5- and PI-positive cells (apoptosis and necroptosis) at 12 and 24 h post-irradiation. Radiation-induced apoptosis was confirmed by the enhanced CASP3 (caspase 3) cleavage (, lower panel).
Figure 1. Radiation induces autophagy in RAW 264.7 cells. (a) RAW 264.7 cells were exposed to different doses of IR ranging from 0 to 10 Gy, 24 h post-irradiation cells were counted, and relative growth was calculated with respect to unirradiated control cells. The graph represents growth of irradiated cells relative to unirradiated control. LD50 of these cells was found to be 2.5 Gy. Data is representative of 3 independent experiments. (b) RAW 264.7 cells were exposed to 2.5 Gy IR and processed for growth inhibition kinetics, cell viability and metabolic viability. Cells were counted for growth inhibition or processed by sulphorhodamine-B (SRB) or MTT for cell and metabolic viability respectively after 12 and 24 h. For the clonogenic assay, cells were exposed to 2.5 Gy radiation and were incubated at 37°C to form colonies. Upper left, and right panel represents growth inhibition and cell viability (by SRB assay) whereas lower left and right panel represent metabolic viability and clonogenicity. (c) Upper left panel: A bar graph showing results from ANXA5-PI assay in irradiated vs normal cells. Upper right panel: A bar graph showing mean fluorescence intensity of propidium iodide uptake in irradiated samples as compared to unirradiated control cells using flow cytometry at 12 and 24 h post-IR exposure. Lower Panel: Western blot analysis of cell lysate obtained at 12 and 24 h post-irradiation. Blots were probed with intrinsic apoptosis marker, cleaved CASP3, GAPDH was used as loading control. (d) Lysates from RAW 264.7 cells exposed to increasing IR doses ranging from 0–7.5 Gy were resolved by SDS-PAGE and blotted onto PVDF membranes, followed by immunoblotting with LC3- and SQSTM1-specific antibodies. Each blot is representative of 3 independent experiments. The graphs show quantitation of band intensities (relative to ACTB) from 3 independent experiments. (e) The kinetics of autophagy induction in RAW 264.7 cells was explored by Western blot analysis of LC3-II levels (relative to ACTB) in whole cell lysates. The graph shows quantification of band intensities (relative to ACTB) from 3 independent experiments. (f) In order to study autophagic flux, cells were irradiated, and BafA1 (100 nM) was added 2 h before harvesting. Samples were analyzed after 12 and 24 h. The graph shows quantification of band intensities (relative to ACTB) from 3 independent experiments. (g) EGFP-LC3 puncta were analyzed through confocal microscopy (63X magnification) in irradiated RAW 264.7 cells. Briefly, after 24 h post-transfection with pEGFP-LC3, RAW 264.7 cells were treated with 2.5 Gy ionizing radiation and images were captured 12 h post-irradiation. Puncta were counted using ImageJ from at least 3 fields per experiment. Arrows indicate puncta post-irradiation. Also, the difference in morphology of irradiated cells can be seen in the represented image. The graph on the right represents EGFP-LC3-positive puncta per cell after radiation exposure as compared to control (**P < 0.01, IR vs control). (h) Electron microscopy-based detection of autophagosome in RAW 264.7 cells. Electron micrographs of control and radiation-exposed cells were taken at 12 h post-irradiation. Arrowhead in the representative micrograph shows the autophagosome. Autophagosomes were counted manually from at least 3 fields per experiment. The graph on the right represents an average number of autophagosomes/cell after radiation exposure as compared to control (*P < 0.05, IR vs control). Molecular mass is represented by kDa (kilodalton).
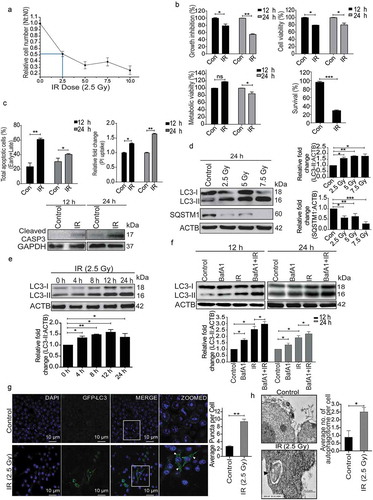
To understand the role of autophagy under radiation stress, we examined its status and functional relevance in irradiated RAW 264.7 cells by comparing the level of the autophagosomal membrane-bound form of MAP1LC3A/B (microtubule-associated protein 1 light chain 3 alpha/beta (referred to hereafter as LC3-II) relative to ACTB (actin, beta) [Citation34]. A dose-dependent increase in autophagy levels was observed in irradiated cells, which correlated well with a significant decrease in the autophagy substrate SQSTM1/p62 (sequestosome 1) with increasing dose of radiation suggesting the induction of autophagy (). Further, the kinetics of autophagy induction was studied by harvesting irradiated RAW 264.7 cells at different times post-exposure. The levels of LC3-II peaked at approximately 12 h post-irradiation and stabilized after that (). The autophagic flux was studied using the lysosomal proton-pump inhibitor bafilomycin A1 (BafA1), which further confirmed radiation-induced autophagy in these cells (). Cells of human origin (U2OS, human osteosarcoma) also exhibited a similar response after radiation exposure (Figure S2). Furthermore, we quantified the number of LC3 puncta post-irradiation in RAW 264.7 cells transiently transfected with a pEGFP-LC3 plasmid, 12 h post-irradiation, and observed a nearly 4–5 fold increase in EGFP-LC3 puncta formation as compared to non-irradiated control cells (). This observation was complemented by transmission electron microscopy quantifications, where significantly more autophagic vacuoles (autophagosomes) were observed 12 h post-irradiation (). Taken together, these results indicate the induction of autophagy as well as apoptosis in irradiated cells.
Radiation-induced autophagy is ROS dependent
Generation of reactive oxygen species (ROS) has been linked with the autophagy regulation [Citation1,Citation2,Citation35], and we, therefore, investigated whether radiation-induced autophagy in RAW 264.7 cells is ROS dependent. The kinetics of radiation-induced ROS was studied using flow cytometric analysis of DCFDA fluorescence and showed an initial burst immediately after irradiation (marked as 0 h) followed by a delayed ROS at approximately 12 h (). To scavenge radiation-induced ROS production, we determined the optimum dose of the antioxidant N-acetylcysteine (NAC) in RAW 264.7 cells (Figure S3). ROS production was significantly abolished by incubation with 30 mM freshly prepared NAC (pH 7.4) for 1 h prior to irradiation (). NAC treatment also attenuated irradiation-induced autophagy, as suggested by a decrease in the levels of lipidated LC3, indicating oxidative stress to be upstream of autophagy induction (). Interestingly, we also observed a reduction in the levels of LC3-I along with a decline in LC3-II in NAC treated cells post exposure. The drug alone group have also shown some reduction in LC3 lipidation probably due to the effect of these drugs on the basal levels of autophagy (Figure S4, upper panel). Taken together, these results suggest that radiation-induced ROS is involved in the induction of autophagy in RAW 264.7 cells.
Figure 2. Radiation induces oxidative stress in RAW 264.7 cells. (a) Kinetics of radiation-induced oxidative stress in RAW 264.7 cells. The line graph shows relative fold change in fluorescence intensity for intracellular ROS production with respect to non-irradiated control cells after DCFDA staining (10 µM) in response to radiation exposure (2.5 Gy). *P < 0.05, at 0 h and **P < 0.01, at the 12 h post-IR respectively. (b) Effect of ROS scavenger NAC (freshly prepared, given 1 h prior irradiation) on the IR-induced oxidative burst. The values shown are relative to unirradiated control (considered as zero). The 0 h time point represents samples processed immediately after radiation. (c) Radiation-induced changes in autophagy levels are ROS-dependent. Immunoblots of total protein lysates from control, IR and NAC+IR samples harvested at 12 h or 24 h post-irradiation and probed with the indicated specific antibodies. For LC3 blotting, Sigma-Aldrich, L7543 was used. Each blot is representative of 3 independent experiments. The graph shows quantitation of band intensities (relative to ACTB) from 3 independent experiments.
Radiation-induced autophagy induction is mediated through ER stress (the UPR)
Since ER signaling is one of the major processes involved in regulation of autophagy, we hypothesized that ER stress might play an important role in radiation-induced autophagy [Citation36–Citation38]. We explored the induction profile of the classical UPR marker, HSPA5/GRP78 (heat shock protein 5), post-irradiation and observed a time-dependent induction (), which resembled the pattern of LC3 lipidation () and oxidative burst ().
Figure 3. Radiation induces ER stress in RAW 264.7 cells. (a) Kinetics of UPR induction after radiation exposure was studied through the expression profile of the UPR marker, HSPA5. The experiment was performed at least 3 independent times. The graph shows quantification of band intensities (relative to ACTB) from 3 independent experiments. (b) Immunoblots of total protein isolated from control, IR and NAC+IR samples at 12 or 24 h post-irradiation for analysing HSPA5 expression. NAC treatment was given 1 h prior to radiation followed by IR exposure. Blots were probed with the indicated specific antibodies. Each blot is representative of 3 independent experiments. The graph shows quantification of band intensities (relative to GAPDH) from 3 independent experiments. (c) Western blot analysis of UPR marker HSPA5 in cell lysate obtained from RAW 264.7 cells irradiated in the presence of the UPR inhibitor 4-PBA (3.5 mM). The data shown are representative of at least 3 separate experiments. The graph shows quantification of band intensities (relative to GAPDH) from 3 independent experiments. (d) LC3 levels were analyzed in the samples treated with 4-PBA. The graph shows quantification of band intensities (relative to ACTB) from 3 independent experiments.
Available evidence suggests a link between oxidative stress and ER stress [Citation27,Citation39–Citation41]. To examine the relationship between radiation-induced ROS and UPR, we suppressed ROS with freshly prepared NAC and monitored the levels of HSPA5. NAC significantly reduced the levels of HSPA5 suggesting that radiation-induced UPR is ROS-dependent ().
In order to find out whether radiation-induced autophagy is UPR dependent, we suppressed UPR with its inhibitor 4-phenylbutyrate (4-PBA) and found a significant reduction in HSPA5 (). Reduction in the levels of radiation-induced LC3-II (more significant 12 h post-irradiation) in PBA-treated cells (), strongly suggests that the irradiation-induced autophagy is indeed UPR dependent and is linked to ROS. Decreased LC3 lipidation in cells treated with drug alone indicates the effect of these drugs on the basal levels of autophagy (Figure S4).
EIF2AK3 and ERN1 gets activated after radiation exposure and lead to autophagy induction
UPR is mediated by 3 major signaling pathways, namely ERN1, EIF2AK3 and ATF6 [Citation22,Citation25,Citation27,Citation35]. All these pathways have also been found to play a role in the induction of autophagy during diverse stress conditions [Citation36,Citation42]. However, specific UPR pathways activated in radiation-exposed condition are not well known. The UPR levels (HSPA5) started building post-radiation quickly, with p-EIF2AK3 being specifically activated very rapidly after irradiation (0 h) (). Furthermore, proteins like SQSTM1 and LC3 were also altered immediately after irradiation suggesting the possibility of p-EIF2AK3 mediated UPR linked to autophagy induction (Figure S5). As compared to early time points, the levels of both phosphorylated EIF2AK3 and ERN1 were elevated at 12 and 24 h post-IR exposure, while ATF6 remained unaltered, suggesting that EIF2AK3 and ERN1 are the major ER stress pathways involved in the activation of radiation-induced autophagy ().
Figure 4. Radiation-induced activation profile of specific UPR pathways. (a) Immunoblot analysis of radiation-induced changes in specific UPR branch proteins at the early time point (0–1 h post-irradiation); blots were probed with HSPA5, ERN1, ATF6, p-EIF2AK3 and total EIF2AK3 specific antibodies. The time point of 0 h was taken immediately after radiation. (b) Western blot analysis of ERN1, ATF6 and p-EIF2AK3 levels at 12 and 24 h post-irradiation. (c) Immunoblot analysis of radiation-induced changes in EIF2AK3 phosphorylation and autophagy levels (LC3-II), in the presence of the EIF2AK3 inhibitor GSK2606414 at 12 and 24 h post-irradiation. The graph shows quantification of band intensities (relative to ACTB). (d) Immunoblot analysis of radiation-induced changes in the cleavage of XBP1 and autophagy levels (LC3-II), in the presence of the ERN1 inhibitor DBSA at 12 and 24 h post-irradiation. The graph shows quantification of band intensities (relative to ACTB) from 3 independent experiments.
To examine the role of the EIF2AK3 pathway in radiation-induced autophagy in RAW 264.7 cells, we used GSK2606414, a specific pharmacological inhibitor of EIF2AK3 phosphorylation [Citation43], and investigated the levels of autophagy. Reduction in the levels of p-EIF2AK3 in irradiated cells treated with GSK2606414 was accompanied by a significant decrease in the levels of LC3-II, indicating the involvement of EIF2AK3 signaling in radiation-induced autophagy ()). To investigate the role of ERN1 in radiation-induced autophagy, we used 3,5-dibromosalicylaldehyde (an inhibitor of ERN1 endoribonuclease activity) [Citation44,Citation45]. A significant decrease in spliced XBP1 protein coupled with a reduction in the levels of LC3-II in irradiated cells strongly suggested that ERN1 was also involved in radiation-induced autophagy (). Taken together, these observations advocate that the radiation-induced autophagy is mediated through ER stress and is specifically dependent upon EIF2AK3 and ERN1 pathways.
Radiation-induced UPR mediated autophagy is pro-survival and anti-apoptotic
After establishing the induction of autophagy post-irradiation, we investigated its role in determining cell fate. The cellular and metabolic viability of irradiated RAW 264.7 cells were analyzed with the SRB and MTT assays, respectively, in the presence of autophagy inhibitors 3-MA (phosphatidylinositol 3-kinase [PtdIns3K] inhibitor, blocks the early steps of autophagy) and BafA1, late autophagy inhibitor (vacuolar-type H+-ATPase inhibitor; blocks lysosomal degradation) [Citation34]. Both, cell and metabolic viability of irradiated cells (examined via SRB and MTT assay respectively) were significantly reduced in the presence of these autophagy inhibitors (). As expected, both the inhibitors significantly reduced the clonogenic survival of irradiated cells (), whereas rapamycin (autophagy inducer) enhanced the clonogenic survival (). Cell death induced by some of the drugs used may be attributed to the blockage of the basal levels of autophagy.
Figure 5. Radiation-induced autophagy is pro-survival and anti-apoptotic. (a) Cells were irradiated in the presence of the autophagy inhibitor, 3-MA (0.5 mM). SRB data (cell viability, shown in upper graph, *P < 0.05, ***P < 0.001, at 12 and 24 h post-irradiation respectively) and MTT data (metabolic viability, shown in lower graph, *P < 0.05, at 12 and 24 h post-irradiation respectively) at 12 and 24 h post-irradiation shows the reduced viability of RAW 264.7 cells. (b) Cells were irradiated in the presence of the autophagy inhibitor, BafA1 (2.5 nM). Shown in the upper graph is cell viability (SRB) in the presence of BafA1 (*P < 0.05, ***P < 0.001, at 12 and 24 h post-irradiation respectively) whereas in the lower graph, metabolic viability in the presence of BafA1 is shown (**P < 0.01, at 12 and 24 h post-irradiation respectively). (c) The clonogenic assay was performed to study the cell survival in the presence of 3-MA and BafA1. The bar graph shows the survival fraction of cells irradiated in the presence of 3-MA (upper panel) or BafA1 (lower panel). (**P < 0.01, *P < 0.05, for 3-MA+IR vs IR and BafA1+ IR vs IR, respectively). (d) Cell survival studies in the presence of the autophagy inducer rapamycin. The clonogenic assay was performed in the presence of 25 nM rapamycin. The bar graph shows the survival percentage of cells treated with rapamycin in the absence or presence of radiation. (e) Left panel: A bar graph showing mean fluorescence intensity of propidium iodide uptake in irradiated samples in the presence of BafA1 as compared to unirradiated control cells using flow cytometry at 12 and 24 h post-IR exposure. ***P < 0.001, *P < 0.05, at 12 and 24 h post-irradiation respectively. Right panel: Western blot analysis of cell lysate obtained at 12 and 24 h post-irradiation from BafA1+ IR treated cells. Blots were probed with intrinsic apoptosis markers, cleaved PARP1 and cleaved CASP3; GAPDH was used as a loading control. (f) Effect of Atg7 and Ulk1 siRNA on the levels of autophagy. Cells were reverse transfected with Atg7- and Ulk1-specific siRNAs (50 nM) and incubated for 24 h. Next, cells were either starved for 3 h or exposed to radiation, harvested after 24 h and immunoblotted with specific antibodies against ATG7, ULK1 and LC3. The effect of si-Atg7 on autophagic flux was further studied in the presence of BafA1. (g) Effect of genetic downregulation of autophagy on cell viability. Cells were reverse transfected with si-Atg7 and Ulk1 and incubated for 24 h. Next, cells were either starved for 3 h or kept in complete medium and exposed to 2.5 Gy radiation. After 24 h post-irradiation, SRB assay was performed to study cell viability. *P < 0.05, for IR vs si-Atg7, Strv.+IR vs si-Atg7+ IR+Strv., *P < 0.05 IR vs si-Ulk1+ IR and ***P < 0.001 Strv.+IR vs si-Ulk1+ IR+Strv. respectively. Strv., starvation.
Next, we sought to clarify if the pro-survival role of autophagy is a consequence of the inhibition of radiation-induced apoptosis and necroptosis. Increase in PI uptake (suggestive of necroptosis, , left panel), as well as the levels of cleaved PARP1 (poly [ADP-ribose] polymerase family, member 1) and cleaved CASP3 (apoptosis; , right panel), indicate that loss of clonogenic survival following irradiation is indeed linked to apoptosis and necroptosis. Importantly, suppression of autophagy using siRNA against Atg7 and Ulk1 (both important for autophagosome biogenesis [Citation46–Citation50]) (), compromized the cell viability (), showing that autophagy can rescue the cells from radiation-induced lethality. The effectiveness of siRNA was confirmed by LC3B lipidation analysis under both starvation and radiation exposure conditions (). Furthermore, the autophagic flux in the presence of Atg7 siRNA was confirmed using BafA1 in irradiated cells. A significant increase in LC3-II was observed in the presence of BafA1 confirming that autophagic flux is induced during irradiation. This is not the case in cells depleted of ATG7, showing the autophagy-specific effect of irradiation (, right panel). These observations lend further support to our proposition that radiation-induced autophagy is pro-survival and anti-apoptotic in nature.
Pro-survival nature of radiation-induced autophagy is ROS and UPR dependent
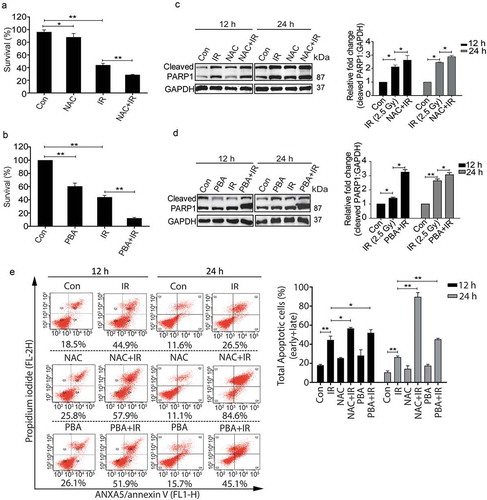
To further investigate whether the radiation-induced pro-survival role of autophagy is ROS-dependent and UPR mediated, irradiated RAW 264.7 cells pre-treated with freshly prepared NAC or 4-PBA were analyzed for clonogenic survival. Both NAC and PBA significantly reduced the clonogenicity post-irradiation ( respectively). Also, the levels of cleaved PARP1 were enhanced in the presence of these drugs after radiation () indicating that blocking ROS or ER stress which reduces autophagy induction ( and ), lead to enhanced apoptosis, which was supported by ANXA5-PI assay as well as the DNA ladder observed under these conditions ( and S6 respectively). The possibility of cell death induced due to the other off-target effects of these drugs can't be excluded. Taken together, these results further strengthen the notion that radiation-induced autophagy is ROS and UPR dependent. In addition, our data show that blocking either ROS or UPR may not be sufficient to reduce the radiation-induced cell death in RAW cells indicating autophagic induction as obligatory for cell survival in these conditions.
Figure 6. The pro-survival nature of radiation-induced autophagy is ROS and UPR dependent. (a) The clonogenic assay was performed after exposing cells to radiation in the presence of the ROS quencher NAC. The graph represents percent survival after irradiation compared to control. **P < 0.01, for IR and NAC-treated radiation control. (b) The clonogenic assay was performed after exposing cells to radiation in the presence of 4-PBA. The graph represents percent survival after irradiation compared to control. **P < 0.01, for IR and PBA-treated radiation control. (c) Western blot of cell lysates obtained 12 and 24 h post-irradiation from NAC alone, and NAC+IR treated cells was performed for the apoptotic marker, cleaved PARP1. Each blot is representative of 3 independent experiments. The graph shows quantitation of band intensities (relative to GAPDH) from 3 independent experiments. (d) Immunoblotting of PBA and PBA+IR treated samples at 12 and 24 h post-irradiation was performed to study apoptosis after ER stress inhibition. Each blot is representative of 3 independent experiments. The graph shows quantitation of band intensities (relative to GAPDH) from 3 independent experiments. (e) Apoptosis was analyzed using ANXA5/annexin V-PI staining followed by flow cytometry in RAW 264.7 cells treated with ROS and UPR inhibitors, NAC and PBA respectively. Numbers under each cytogram represents total apoptosis (early+late). The same has been represented by bar graph in the right panel. The experiment was performed in triplicates, and the values are represented with SD.
Autophagy activation provides a survival advantage to the irradiated animals
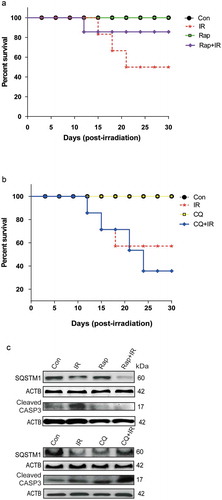
In order to investigate the in-vivo relevance of our in-vitro findings, we studied the effects of modulators of autophagy on the survival of whole body irradiated C57BL/6 female mice at an absorbed dose of 8 Gy, which is the LD50 dose for the animals used. The MTOR inhibitor and autophagy inducer rapamycin (Rap) provided the survival advantage in radiation-exposed animals (), whereas the autophagy inhibitor chloroquine (CQ) reduced animal survival (). Changes in the body weight, as well as splenic weight, also complemented the observations on animal survival under these conditions (Table S1 and Figure S7). The induction of autophagy in these animals was confirmed at the cellular level by reduced expression of SQSTM1 in peritoneal macrophages of mice irradiated in the presence of rapamycin (Figures S7 and ). Further, we also noted reduced levels of apoptosis (cleaved CASP3) in rapamycin-treated animals (, upper panel). In contrast, there was accumulation in the levels of SQSTM1 in animals irradiated in the presence of chloroquine as compared to those exposed to radiation alone. As expected, this was accompanied by an increase in the levels of cleaved CASP3 (, lower panel). Taken together, these results indicate a pro-survival role of radiation-induced autophagy both in vitro and in vivo.
Figure 7. Radiation-induced autophagy is pro-survival under in vivo conditions. (a) The effects of autophagy inducer Rapamycin (2 mg/kg body weight) on survival during the first 30 d after 8 Gy irradiation in mice. C57BL/6 mice were randomized into 4 groups: control, IR, Rap, Rap+IR. Rapamycin was administered via an intraperitoneal (i.p.) route in a single dose, 1 h prior to irradiation. Mice were observed for their body weight (Table S1), and lethality was scored daily for the first 30 d. Kaplan-Meier analysis was performed for mice receiving 8 Gy of total body irradiation. Each treatment group contained at least 6 animals. (b) The effect of the autophagy inhibitor chloroquine (10 mg/kg body weight) on animal survival was studied for the first 30 d after 8 Gy irradiation in mice. C57BL/6 mice were randomized into 4 groups: control, IR, CQ alone and CQ+IR. CQ was administered via intraperitoneal (i.p.) injection in a single dose, 1 h prior to irradiation. Mice were observed for their body weight (Table S1), and lethality was scored daily for the first 30 d. Kaplan-Meier analysis was performed for mice receiving 8 Gy of total body irradiation. Each treatment group contained at least 6 animals. (c) Immunoblotting of isolated mice peritoneal cavity cells from rapamycin and chloroquine (CQ) treated mice was performed after day 8 of irradiation. Each mouse was given 4% thioglycolate treatment 72 h prior to peritoneal cavity cell isolation. Cells were lysed, and blots were probed with SQSTM1 (as a marker of autophagy) and cleaved CASP3 (as a marker of apoptosis). A total of 3 animals were sacrificed from each group for western blotting. Each blot is representative of 2 independent experiments.
Discussion
In this study, we have shown that radiation induces ROS dependent autophagy in macrophages through UPR activation. Specific inhibition of EIF2AK3 and ERN1 pathways blocked autophagy, suggesting them as the key players for radiation-induced autophagy activation. Furthermore, the induction of autophagy resulted in a decline in cell death in both cellular as well as animal model system (summarised in ).
Ionizing radiation generates ROS and reactive nitrogen species (causing oxidative stress) causing macromolecular damage in the form of protein nitration, carbonylation and lipid peroxidation, besides many oxidative products of DNA [Citation1–Citation3,Citation23,Citation35,Citation38]. Accumulation of these macromolecular lesions results in cell death, while proper recycling is essential for cell survival. It has been well established that radiation-induced ROS generation causes activation of unfolded protein response (UPR) and ER stress [Citation5,Citation7,Citation24,Citation25]. Autophagy is activated during oxidative stress as well as endoplasmic reticulum stress and may be both protective and detrimental following radiation exposure [Citation5,Citation14,Citation15,Citation21,Citation28]. Cancer cells are known to activate pro-survival autophagy to develop resistance against chemo or radiotherapy [Citation51]. In line with this, the radiation-induced autophagy in macrophages was found to be pro-survival in nature (MTT, SRB and clonogenicity data). Apoptosis is one of the major cell death pathways activated post-irradiation, initiated by the accumulation of various types of macromolecular as well as organelle damages caused mainly by oxidative stress [Citation51,Citation52]. The survival advantage provided by radiation-induced autophagy may stem from the efficient recycling of damaged mitochondria preventing CYCS (cytochrome c, somatic) release (mitophagy), or due to the degradation of pro-apoptotic protein complexes [Citation53]. It will be interesting to understand the role of selective autophagy, e.g. mitophagy, lipophagy, ribophagy, aggrephagy etc. after radiation-induced stress conditions [Citation54].
ROS and ER stress are associated events induced by many cytotoxic agents including ionizing radiation. During stress, unfolded proteins accumulate in the ER, leading to the activation of distinct ER stress sensors and elevation in the levels of HSPA5. Endoplasmic reticulum stress has been shown to mediate radiation-induced autophagy by EIF2AK3-EIF2S1/eIF2alpha (eukaryotic translation initiation factor 2, subunit 1 alpha) in CASP3- and CASP7-deficient MCF-7 breast cancer cells [Citation15]. Notably, the time-dependent UPR induction (HSPA5 levels) correlated well with the secondary ROS as well as autophagy, which was attenuated by NAC, suggesting that ROS generation is an earlier event to ER stress and the radiation-induced UPR is ROS dependent. Reduction in the levels of LC3-II in the presence of 4-PBA (4-phenylbutyrate, a chemical chaperone and ER stress inhibitor) lent further support to the notion that radiation-induced autophagy is UPR dependent. Interestingly, NAC also reduced the levels of LC3-I, suggesting a possible effect of NAC on LC3 transcription and requires further investigations to understand its impact on the sustenance of autophagy. The activation of EIF2AK3 pathway is crucial for autophagic flux either through upregulation of ATG12 resulting in more LC3-II formation or through AMPK upregulation [Citation42,Citation55]. Results of the present study highlight the importance of EIF2AK3 and ERN1 pathways in the activation of radiation-induced autophagy. Our results are in line with the earlier studies suggesting the importance of EIF2AK3 and ERN1 during the induction of autophagy [Citation14,Citation15,Citation21]. Interestingly, specific inhibition of ERN1 resulted in reduced lipidation of LC3, not only in the presence of radiation but also in control conditions indicating the importance of this pathway during basal autophagy. However, this is in contrast to the reports showing ERN1 signaling mediated impairment of autophagy flux in Huntington model [Citation56]. The difference in the roles of the ERN1 pathway may be due to the difference in stress conditions. The early phosphorylation of EIF2AK3 (0 h sample, immediately after irradiation) and activation of both EIF2AK3, as well as ERN1 later (12 h and 24 h), are suggestive of a tight regulation of the activation of specific UPR signaling pathways in radiation-induced autophagy. The precise role of these pathways in radiation-induced autophagy needs to be explored further. The possibility of HSPA5 independent EIF2AK3 activation pathways responsible for its activation immediately after radiation may not be excluded.
Various signaling pathways are associated with autophagy induction including PtdIns3K-AKT1 and AMPK [Citation12]. During starvation, PtdIns3K-AKT1 is unable to activate MTOR thus making ATG1 ready to initiate the autophagic process [Citation5]. Similarly, cellular AMPK activation by a reduced ATP to AMP ratio inhibits MTOR activity and results in autophagy induction [Citation57,Citation58]. A fragile balance exists between autophagy and apoptosis. The anti-apoptotic protein BCL2 gets released from BECN1/Beclin 1 thus inhibiting apoptosis on autophagy induction [Citation59]. Further, STK11/LKB1 (serine/threonine kinase 11)-AMPK may activate CDKN1B/p27Kip1 (cyclin-dependent kinase inhibitor 1B), a CDK inhibitor leading to the cell cycle arrest, which prevents apoptosis and induces autophagy for cell survival [Citation60]. Our study shows that autophagy counteracts necroptosis in radiation-exposed conditions. It will be interesting to explore the molecular mechanism responsible for the balance between necroptosis and autophagy under radiation stress.
Although autophagy and apoptosis have been recognized as important components of cellular responses to oxidative and other stress, the association between radiation-induced autophagy and animal survival has not been studied thoroughly [Citation61]. Induction of autophagy (SQSTM1 clearance) with a concomitant decrease in apoptosis (reduced cleaved CASP3) in macrophages isolated from irradiated mice that were administered Rapamycin, lent support to the proposition that the induction of autophagy in critical cell components contributes to the survival of irradiated mice. It will be interesting to explore the effect of these autophagy modifiers in other cell types of the irradiated mice. Improved radio-protection after Rapamycin and enhanced radio-sensitization after chloroquine treatment indicate that autophagy is a potential target for the modification of systemic response to radiation that may be utilized for developing radiation countermeasure as well as improved tumor radiotherapy. In conclusion, our results suggest that radiation-induced autophagy is a pro-survival response initiated by oxidative stress and mediated by UPR, and emphasize that autophagy is a protection strategy deployed by the irradiated cells for survival.
Materials and methods
Cell lines and cell culture
RAW 264.7 cells were obtained from the American Type Culture Collection (American Type Culture Collection, TIB-71). The cells were maintained in high glucose DMEM medium (Sigma-Aldrich, D5648) supplemented with 10% (v:v) heat-inactivated fetal bovine serum (Gibco, 10270) at 37°C in a humidified atmosphere of 5% CO2 and 95% air. Cells were treated with various chemicals including 3-methyladenine (Sigma-Aldrich, M9281), sulphorhodamine-B (Sigma-Aldrich, S1402), trichloroacetic acid (MP Biomedicals, 0215259290), DCFDA (Sigma-Aldrich, D6883), BafA1 (Sigma-Aldrich, B1793), 4-phenylbutyrate (Sigma-Aldrich, P21005), N-acetyl-L-cysteine (Sigma-Aldrich, A9165), GSK2606414 (Cayman chemicals, 17376) and 3,5-dibromosalicylaldehyde (Sigma-Aldrich, 122130), PBS (Himedia, TS1006). Atg7- and Ulk1-specific siRNA were purchased from Dharmacon (L-020112-00-0005). The GFP-LC3 plasmid was purchased from Addgene (21073; deposited by Tamotsu Yoshimori, Osaka University). The incubation time and concentration of agents used is stated in the figure legends.
Animals
C57BL/6 female mice (10–12 wk old) were injected with FDA approved autophagy modulators; chloroquine (a late autophagy inhibitor) (Sigma-Aldrich, C6628) or rapamycin (Sigma-Aldrich, PZ0020). Chloroquine was reconstituted in PBS and administered 10 mg/kg dose via an intraperitoneal (i.p.) route. Rapamycin was reconstituted in DMSO at 20 mg/ml and further diluted in PBS containing 5% DMSO to get the desired 2 mg/kg body weight dose, which was administered through an intraperitoneal (i.p.) route. The autophagy modifiers were administered 1 h prior to irradiation until otherwise mentioned. All proper controls were included in the study.
Macrophage isolation, culture and polarization
Peritoneal macrophages were attracted to the mouse peritoneal cavity by injecting 4% thioglycolate (chemoattractant; Sigma-Aldrich, B2551) solution into the cavity. After 72 h of thioglycolate stimulus, mice were euthanized, and peritoneal cavity macrophages were isolated by flushing the peritoneal cavity with PBS with the help of a 25 G needle. Peritoneal cavity cells were given one wash with PBS, and 0.2 × 10⁶ cells per group were used to quantify the macrophage population in peritoneal fluid cells using an ADGRE1/F4/80-PE-Cy5.5-conjugated antibody.
Western blot analysis
RAW 264.7 cells and mice peritoneal macrophages were washed with ice-cold PBS and lysed in RIPA buffer with protease and phosphatase inhibitor cocktail (Thermo Scientific/Pierce Protease Inhibitor Mini Tablets, 88665) on the ice. Cell lysates were centrifuged at 4°C (21952 g, 20 min), and the protein supernatant was transferred into new microcentrifuge tubes. The concentration of the protein samples was determined with BCA Protein Assay Kit (Thermo Scientific/Pierce, PI23227); 20 µg of the total protein was resolved using 10%, 12% or 15% SDS-PAGE, followed by protein transfer onto PVDF membranes. The membranes were blocked in PBS containing 0.1% Tween 20 (Himedia, MB067) with 3% bovine serum albumin (Sisco Research Laboratories, 85171) at room temperature for 1 h. The following primary antibodies were used; SQSTM1/p62 (Sigma-Aldrich, P0067), PARP1 (Thermo Fisher scientific/Pierce, MA5-15031), ATF6 (Santa Cruz Biotechnology, sc-22799), phospho-EIF2AK3/PERK (Santa Cruz Biotechnology, sc-32577), EIF2AK3/PERK (Cell Signaling Technology, 3192), IRE1/ERN1 (Santa Cruz Biotechnology, sc-20790), Cleaved CASP3 (Cell Signaling Technology, 9664), CASP3 (Cell Signaling Technology, 9662), ACTB (Santa Cruz Biotechnology, sc-47778), GRP78/HSPA5 (Santa Cruz Biotechnology, sc-1050), XBP1 (Santa Cruz Biotechnology, sc-7160), ATG7 (Cell Signaling Technology, 8558), ULK1 (Cell Signaling Technology, 4776) and GAPDH (Santa Cruz Biotechnology, sc-25778). For LC3 lipidation analysis, LC3A/B (Cell Signaling Technology, 4108) antibody was used in most of the experiments; otherwise Sigma-Aldrich, L7543 was used. Secondary antibodies were used from Santa Cruz Biotechnology. Detection of the blots was performed using ECL reagents (Amersham Pharmacia Biotechnology, RPN2232). Only the blots having band intensities within the linear range were included. The blots were quantified using ImageJ software.
Irradiation procedure
RAW 264.7 cells were irradiated with Tele-Cobalt Facility, Bhabhatron II (Panacea Medical Technologies, Bengaluru, Karnataka, India) at 2.5 Gy (a dose rate of 1.62 Gy/min) over an appropriate field size of 35 cm x 35 cm and at 80 SSD in the irradiation center. 3-MA (0.5 mM), BafA1 (2.5 nM), NAC (30 mM) or 4-PBA (3.5 mM) were added into culture medium 1 h before irradiation. As aqueous solutions of cysteine oxidize to cystine on contact with air at neutral or alkaline pH, NAC was prepared fresh for every experiment and pH was adjusted to 7.4. After irradiation, cells were incubated at atmospheric conditions of 5% CO2 for the desired time points. For the 0 h time point, cells were processed immediately after radiation for the assay of interest.
For in vivo survival experiments, a group of at least 6 irradiated mice were followed up until 30 d in the presence of autophagy modulators. Mice in each group were exposed to whole-body radiation of 8 Gy from 60Co γ-ray irradiator having a dose rate of 1.25 Gy/min. For Western blotting and other assays, 3 mice from each group were sacrificed on the third and eighth day after irradiation. All experiments were complied with the Institutional regulations on animal welfare protocols and were approved by the Institute’s ethics committee of laboratory animals.
Transient transfection and microscopy
All DNA transfections were done using Lipofectamine 2000 (Invitrogen, 11668019), and cells were maintained in Opti-MEM medium (GIBCO, 31985062) devoid of serum and antibiotics. Four h post-transfection, the culture medium was replaced with fresh medium containing serum and antibiotics. Cells transfected with GFP-tagged proteins were observed at different time points, and photomicrographs were captured using a fluorescence microscope (Olympus, Center Valley, PA, USA) or confocal microscope (Zeiss LSM 710 ELYRA, Oberkochen, Germany). For siRNA transfection, cells were transfected with either Atg7 or Ulk1 siRNA (50 nM) using reverse transfection with RNAi max transfection reagent (Invitrogen, 13778075) in non-antibiotic 5% serum-supplemented opti-MEM media for 24 h. The next day, transfection media was replaced with high-glucose DMEM containing antibiotic and heat-inactivated serum and was processed for various assays including microscopy, western blotting or viability.
Transmission electron microscopy (TEM)
RAW 264.7 cells (2x10⁶) were seeded in 90-mm dishes and allowed to attach overnight. Next day, cells were exposed to 2.5 Gy radiation dose. After 12 h, cells were washed twice with ice-cold PBS and fixed overnight in ice-cold Karnovsky’s fixative (1% glutaraldehyde and 4% paraformaldehyde in 0.1 M phosphate buffer, pH 7.4) at 4°C. Cells were then rinsed twice with ice-cold PBS, post-fixed in 1% osmium tetraoxide with 0.1% potassium ferricyanide, dehydrated through a graded series of ethanol (30–90%) and embedded in Epon (Sigma-Aldrich, 45345). Semi-thin sections (300 nm) were cut using a Reichart Ultracut (Leica Microsystems Inc., Chicago, IL, USA), stained with 0.5% toluidine blue, and examined under a light microscope. Ultrathin sections (65 nm) were stained with 2% uranyl acetate and Reynold’s lead citrate and examined using an FEI transmission electron microscope (Holland). The electron microscopy was performed at All India Institute of Medical Sciences, Delhi, India.
Analysis of ROS
DCFDA is a fluorogenic dye that measures ROS (hydroxyl, peroxyl) activity within the cells. After diffusion into the cells, DCFDA is deacetylated by cellular esterases to a non-fluorescent compound. This compound is later oxidized by ROS into DCF, which is a highly fluorescent form.
The murine macrophage cells RAW 264.7 were irradiated with a dose of 2.5 Gy at the indicated time point (0, 4, 12 and 24 h). Media was removed, and fresh media without serum was added. Next, 10 µM DCFDA (Sigma-Aldrich, D6883) was added to each well. The cells were incubated for 30 min at 37°C in the dark and processed using a BD FACS LSR-II flow cytometer. For 0 h reading, cells were pretreated with 10 µM DCFDA for 20 min and irradiated; immediately after irradiation, cells were washed, scraped in PBS and used for flow cytometry.
Cell viability assays
The effect of autophagy modulators (both chemical and genomic) on the metabolic viability of RAW 264.7 cells was evaluated by the MTT [3-(4, 5-dimethylthiazol-2yl)-2, 5-diphenyl-2H tetrazolium bromide] (Sigma-Aldrich, M2128) assay. Briefly, approx. 3 × 10³ cells per well were seeded in 96-well microplates and were cultured for 12 h. The cells were then treated with the indicated concentrations of autophagy modulators for 12 and 24 h. Next, the medium in each well was replaced with 200 µl of fresh medium containing 0.5 mg/ml MTT. The cells were then incubated at 37°C for next 2 h, following which the medium was discarded, and 150 µl of DMSO was added to each well in order to dissolve formazan crystals. The optical density was read at 570 nm using an automated microplate reader (Bio-Tek, Winooski, USA). Experiments were carried out in triplicate, and the results are shown as mean ± SD of 3 independent experiments.
A similar protocol was followed for studying cell viability using sulphorhodamine-B (SRB) stain. After completion of indicated time points, cells were fixed in 10% (w:v) trichloroacetic acid for 45 min at 4°C followed by incubation with SRB for 30 min at 37°C. After completion of the desired incubation period, wells were washed to remove the excess stain by using 1% (v:v) acetic acid. The protein-bound dye was dissolved in 10 mM Tris base solution, pH 10. The optical density was read at 510 nm using an automated microplate reader.
Growth inhibition kinetics
In order to study relative growth inhibition kinetics, 0.1 × 10⁶ RAW 264.7 cells were seeded in 35-mm dish in triplicates and allowed to grow at 37°C in CO2 incubator. Next day, media was changed, and cells were irradiated with the desired dose. Cells were processed for counting using hemocytometer. Relative cell number (Nt:N0) was calculated with respect to the unirradiated control cells.
Colony-formation assay
Macro colony formation assay was performed to assess the effect of radiation-induced cell death in the presence of autophagy inhibitors. RAW 264.7 cells were seeded in triplicates. Cells were treated with the drugs, 1 h prior to radiation. Media was replaced 24 h post-irradiation, and cells were incubated at 37°C to form colonies. After 10 d, colonies were washed with PBS, fixed in methanol and stained with 1% crystal violet for 10 min. Excess stain was removed with PBS. Stained colonies made up of more than 50 cells were scored and manually counted.
ANXA5/annexin V and PI staining
Apoptosis was studied using flow cytometry, 12 and 24 h post-irradiation using the ANXA5-PI staining assay kit according to the manufacturer’s instructions (APOAF-Annexin V-FITC Apoptosis Detection Kit; Sigma-Aldrich, APOAF). Briefly, cells (1x10⁶) were resuspended in 200 µl of binding buffer containing 5 µl ANXA5-FITC and 10 µl propidium iodide. After 15 min of incubation at room temperature in the dark, samples were acquired using a BD FACSCalibur flow cytometer. A minimum of 10,000 cells per sample were acquired and analyzed using BD FACS Diva software (Becton and Dickinson, San Jose, CA, USA). The percentage of ANXA5-positive and -negative cells were estimated by applying appropriate gates and using regional statistical analysis (Flow Jo software). Both early apoptotic (ANXA5-positive, PI-negative) and late apoptotic (ANXA5-positive, PI-positive) cells were considered positive.
Statistical analysis
All experiments were performed at least 3 times unless mentioned. All data are presented as mean ± S.D. of the average from triplicates unless mentioned. Statistical analysis was performed by Student’s t-test (two-tailed) using the GraphPad Prism software for Windows (GraphPad Software, version 5.0, Inc., California Corporation). P < 0.05 was considered statistically significant.
Supplemental Material
Download Zip (3.9 MB)Acknowledgments
The authors thank Dr. A. K. Singh, former Director, INMAS and the current Director, INMAS, Dr. Tarun Sekhri, for their constant encouragement. We also thank Dr.N. K. Chaudhary, Kailash Manda, Dr. Ravi Soni, Dr. Anant Narayan Bhatt and Mrs. Namita Kalra from INMAS for their technical support and valuable suggestions. We thank Carina Knudson for graphical illustrations, Mr. Anurag Singh and Dr. T.C. Das from AIIMS for electron microscopy and Prof. K. Natarajan and Ms. Aayushi Singh from ACBR, University of Delhi for Chemidoc facility and Flow cytometry sample acquisition, respectively.
Disclosure statement
No potential conflict of interest was reported by the authors.
Supplementary material
Supplemental data for this article can be accessed here.
Additional information
Funding
Related Research Data
References
- Kiang JG, Garrison BR, Gorbunov NV. Radiation combined injury: DNA damage, apoptosis and autophagy. Adapt Med. 2010;2(1):1–10.
- Gorbunov NV, Kiang JG. Up-regulation of autophagy in small intestine Paneth cells in response to total-body gamma-irradiation. J Pathol. 2009 Oct;219(2):242–252. PubMed PMID: 19681094.
- Kiang JG, Smith JT, Agravante NG. Geldanamycin analog 17-DMAG inhibits iNOS and caspases in gamma-irradiated human T cells. Radiat Res. 2009 Sep;172(3):321–330. PubMed PMID: 19708781.
- Mikkelsen RB, Wardman P. Biological chemistry of reactive oxygen and nitrogen and radiation-induced signal transduction mechanisms. Oncogene. 2003 Sep 1;22(37):5734–5754. PubMed PMID: 12947383.
- Chaurasia M, Bhatt AN, Das A, et al. Radiation-induced autophagy: mechanisms and consequences. Free Radic Res. 2016;50(3):273–290. PubMed PMID: 26764568.
- Buytaert E, Dewaele M, Agostinis P. Molecular effectors of multiple cell death pathways initiated by photodynamic therapy. Biochim Biophys Acta. 2007 Sep;1776(1):86–107. PubMed PMID: 17693025.
- Farrukh MR, Nissar UA, Afnan Q, et al. Oxidative stress mediated Ca(2+) release manifests endoplasmic reticulum stress leading to unfolded protein response in UV-B irradiated human skin cells. J Dermatol Sci. 2014 Jul;75(1):24–35. PubMed PMID: 24794973.
- Nakai A, Yamaguchi O, Takeda T, et al. The role of autophagy in cardiomyocytes in the basal state and in response to hemodynamic stress. Nat Med. 2007 May;13(5):619–624. PubMed PMID: 17450150.
- Chen Y, Azad MB, Gibson SB. Superoxide is the major reactive oxygen species regulating autophagy. Cell Death Differ. 2009 Jul;16(7):1040–1052. PubMed PMID: 19407826.
- Fulda S, Gorman AM, Hori O, et al. Cellular stress responses: cell survival and cell death. Int J Cell Biol. 2010;2010:214074. PubMed PMID: 20182529; PubMed Central PMCID: PMCPMC2825543.
- Zhang Y, Qi H, Taylor R, et al. The role of autophagy in mitochondria maintenance: characterization of mitochondrial functions in autophagy-deficient S. cerevisiae strains. Autophagy. 2007 Jul-Aug;3(4):337–346. PubMed PMID: 17404498.
- Mizushima N. Autophagy: process and function. Genes Dev. 2007 Nov 15;21(22):2861–2873. PubMed PMID: 18006683.
- Marino G, Niso-Santano M, Baehrecke EH, et al. Self-consumption: the interplay of autophagy and apoptosis. Nat Rev Mol Cell Biol. 2014 Feb;15(2):81–94. PubMed PMID: 24401948; PubMed Central PMCID: PMCPMC3970201.
- Yang Z, Xu Y, Xu L, et al. Regulation of autophagy via PERK-eIF2alpha effectively relieve the radiation myelitis induced by iodine-125. PLoS One. 2013;8(11):e76819. PubMed PMID: 24223705; PubMed Central PMCID: PMCPMC3818370.
- Kim KW, Moretti L, Mitchell LR, et al. Endoplasmic reticulum stress mediates radiation-induced autophagy by perk-eIF2alpha in caspase-3/7-deficient cells. Oncogene. 2010 Jun 3;29(22):3241–3251. PubMed PMID: 20348950; PubMed Central PMCID: PMCPMC2953962.
- Kong EY, Cheng SH, Yu KN. Induction of autophagy and interleukin 6 secretion in bystander cells: metabolic cooperation for radiation-induced rescue effect? J Radiat Res. 2018 Mar 1;59(2):129–140. PubMed PMID: 29385614; PubMed Central PMCID: PMCPMC5951087.
- Wang F, Tang J, Li P, et al. Chloroquine enhances the radiosensitivity of bladder cancer cells by inhibiting autophagy and activating apoptosis. Cell Physiol Biochem. 2018;45(1):54–66. PubMed PMID: 29316551.
- Chen Y, Li X, Guo L, et al. Combining radiation with autophagy inhibition enhances suppression of tumor growth and angiogenesis in esophageal cancer. Mol Med Rep. 2015 Aug;12(2):1645–1652. PubMed PMID: 25891159; PubMed Central PMCID: PMCPMC4464360.
- Hu JL, He GY, Lan XL, et al. Inhibition of ATG12-mediated autophagy by miR-214 enhances radiosensitivity in colorectal cancer. Oncogenesis. 2018 Feb 20;7(2):16. PubMed PMID: 29459645; PubMed Central PMCID: PMCPMC5833763.
- Paglin S, Hollister T, Delohery T, et al. A novel response of cancer cells to radiation involves autophagy and formation of acidic vesicles. Cancer Res. 2001 Jan 15;61(2):439–444. PubMed PMID: 11212227.
- Sailaja GS, Bhoopathi P, Gorantla B, et al. The secreted protein acidic and rich in cysteine (SPARC) induces endoplasmic reticulum stress leading to autophagy-mediated apoptosis in neuroblastoma. Int J Oncol. 2013 Jan;42(1):188–196. PubMed PMID: 23123816; PubMed Central PMCID: PMCPMC3538858.
- Scriven P, Brown NJ, Pockley AG, et al. The unfolded protein response and cancer: a brighter future unfolding? J Mol Med (Berl). 2007 Apr;85(4):331–341. PubMed PMID: 17216204.
- Black HS. ROS: a step closer to elucidating their role in the etiology of light-induced skin disorders. J Invest Dermatol. 2004 Jun;122(6):xiii–xiv. PubMed PMID: 15175053.
- Briganti S, Picardo M. Antioxidant activity, lipid peroxidation and skin diseases. What’s new. J Eur Acad Dermatol Venereol. 2003 Nov;17(6):663–669. PubMed PMID: 14761133.
- Ding W, Yang L, Zhang M, et al. Reactive oxygen species-mediated endoplasmic reticulum stress contributes to aldosterone-induced apoptosis in tubular epithelial cells. Biochem Biophys Res Commun. 2012 Feb 17;418(3):451–456. PubMed PMID: 22281495.
- Ron D, Walter P. Signal integration in the endoplasmic reticulum unfolded protein response. Nat Rev Mol Cell Biol. 2007 Jul;8(7):519–529. PubMed PMID: 17565364.
- Malhotra JD, Kaufman RJ. Endoplasmic reticulum stress and oxidative stress: a vicious cycle or a double-edged sword? Antioxid Redox Signal. 2007 Dec;9(12):2277–2293. PubMed PMID: 17979528.
- Moretti L, Cha YI, Niermann KJ, et al. Switch between apoptosis and autophagy: radiation-induced endoplasmic reticulum stress? Cell Cycle. 2007 Apr 1;6(7):793–798. PubMed PMID: 17377498.
- Castino R, Davies J, Beaucourt S, et al. Autophagy is a prosurvival mechanism in cells expressing an autosomal dominant familial neurohypophyseal diabetes insipidus mutant vasopressin transgene. FASEB J. 2005 Jun;19(8):1021–1023. PubMed PMID: 15781609.
- Alnasser HA, Guan Q, Zhang F, et al. Requirement of clusterin expression for prosurvival autophagy in hypoxic kidney tubular epithelial cells. Am J Physiol Renal Physiol. 2016 Jan 15;310(2): F160–73. PubMed PMID: 26561650.
- Hsieh CH, Pai PY, Hsueh HW, et al. Complete induction of autophagy is essential for cardioprotection in sepsis. Ann Surg. 2011 Jun;253(6):1190–1200. PubMed PMID: 21412148.
- Li J, Qin Z, Liang Z. The prosurvival role of autophagy in Resveratrol-induced cytotoxicity in human U251 glioma cells. BMC Cancer. 2009 Jun 30;9:215. PubMed PMID: 19566920; PubMed Central PMCID: PMCPMC2717978.
- Dalby KN, Tekedereli I, Lopez-Berestein G, et al. Targeting the prodeath and prosurvival functions of autophagy as novel therapeutic strategies in cancer. Autophagy. 2010 Apr;6(3):322–329. PubMed PMID: 20224296; PubMed Central PMCID: PMCPMC2914492.
- Klionsky DJ, Abdalla FC, Abeliovich H, et al. Guidelines for the use and interpretation of assays for monitoring autophagy. Autophagy. 2012 Apr;8(4):445–544. PubMed PMID: 22966490; PubMed Central PMCID: PMCPMC3404883.
- Lin JH, Walter P, Yen TS. Endoplasmic reticulum stress in disease pathogenesis. Annu Rev Pathol. 2008;3:399–425. PubMed PMID: 18039139; PubMed Central PMCID: PMCPMC3653419.
- Ogata M, Hino S, Saito A, et al. Autophagy is activated for cell survival after endoplasmic reticulum stress. Mol Cell Biol. 2006 Dec;26(24):9220–9231. PubMed PMID: 17030611; PubMed Central PMCID: PMCPMC1698520.
- Yorimitsu T, Nair U, Yang Z, et al. Endoplasmic reticulum stress triggers autophagy. J Biol Chem. 2006 Oct 6;281(40):30299–30304. PubMed PMID: 16901900; PubMed Central PMCID: PMCPMC1828866.
- Li T, Su L, Zhong N, et al. Salinomycin induces cell death with autophagy through activation of endoplasmic reticulum stress in human cancer cells. Autophagy. 2013 Jul;9(7):1057–1068. PubMed PMID: 23670030; PubMed Central PMCID: PMCPMC3722315.
- Cao SS, Kaufman RJ. Endoplasmic reticulum stress and oxidative stress in cell fate decision and human disease. Antioxid Redox Signal. 2014 Jul 20;21(3):396–413. PubMed PMID: 24702237; PubMed Central PMCID: PMCPMC4076992.
- Xue X, Piao JH, Nakajima A, et al. Tumor necrosis factor alpha (TNFalpha) induces the unfolded protein response (UPR) in a reactive oxygen species (ROS)-dependent fashion, and the UPR counteracts ROS accumulation by TNFalpha. J Biol Chem. 2005 Oct 7;280(40):33917–33925. PubMed PMID: 16107336.
- Yen YP, Tsai KS, Chen YW, et al. Arsenic induces apoptosis in myoblasts through a reactive oxygen species-induced endoplasmic reticulum stress and mitochondrial dysfunction pathway. Arch Toxicol. 2012 Jun;86(6):923–933. PubMed PMID: 22622864.
- Kouroku Y, Fujita E, Tanida I, et al. ER stress (PERK/eIF2alpha phosphorylation) mediates the polyglutamine-induced LC3 conversion, an essential step for autophagy formation. Cell Death Differ. 2007 Feb;14(2):230–239. PubMed PMID: 16794605.
- Sun WT, Wang XC, Mak SK, et al. Activation of PERK branch of ER stress mediates homocysteine-induced BKCa channel dysfunction in coronary artery via FoxO3a-dependent regulation of atrogin-1. Oncotarget. 2017 Aug 1;8(31):51462–51477. PubMed PMID: 28881660; PubMed Central PMCID: PMCPMC5584261.
- Huo Y, Fan L, Yin S, et al. Involvement of unfolded protein response, p53 and Akt in modulation of porcine reproductive and respiratory syndrome virus-mediated JNK activation. Virology. 2013 Sep;444( 1–2):233–240. PubMed PMID: 23850458.
- Volkmann K, Lucas JL, Vuga D, et al. Potent and selective inhibitors of the inositol-requiring enzyme 1 endoribonuclease. J Biol Chem. 2011 Apr 8;286(14):12743–12755. PubMed PMID: 21303903; PubMed Central PMCID: PMCPMC3069474.
- Komatsu M, Waguri S, Ueno T, et al. Impairment of starvation-induced and constitutive autophagy in Atg7-deficient mice. J Cell Biol. 2005 May 9;169(3):425–434. PubMed PMID: 15866887; PubMed Central PMCID: PMCPMC2171928.
- Kuma A, Hatano M, Matsui M, et al. The role of autophagy during the early neonatal starvation period. Nature. 2004 Dec 23;432(7020):1032–1036. PubMed PMID: 15525940.
- Mizushima N, Noda T, Yoshimori T, et al. A protein conjugation system essential for autophagy. Nature. 1998 Sep 24;395(6700):395–398. PubMed PMID: 9759731.
- Komatsu M, Wang QJ, Holstein GR, et al. Essential role for autophagy protein Atg7 in the maintenance of axonal homeostasis and the prevention of axonal degeneration. Proc Natl Acad Sci U S A. 2007 Sep 4;104(36):14489–14494. PubMed PMID: 17726112; PubMed Central PMCID: PMCPMC1964831.
- Fan XY, Tian C, Wang H, et al. Activation of the AMPK-ULK1 pathway plays an important role in autophagy during prion infection. Sci Rep. 2015 Oct 1;5:14728. PubMed PMID: 26423766; PubMed Central PMCID: PMCPMC4589734.
- Yang ZJ, Chee CE, Huang S, et al. The role of autophagy in cancer: therapeutic implications. Mol Cancer Ther. 2011 Sep;10(9):1533–1541. PubMed PMID: 21878654; PubMed Central PMCID: PMCPMC3170456.
- Zong Y, Feng S, Cheng J, et al. Up-regulated ATF4 expression increases cell sensitivity to apoptosis in response to radiation. Cell Physiol Biochem. 2017;41(2):784–794. PubMed PMID: 28214891.
- Wang K, Klionsky DJ. Mitochondria removal by autophagy. Autophagy. 2011 Mar;7(3):297–300. PubMed PMID: 21252623; PubMed Central PMCID: PMCPMC3359476.
- Reggiori F, Komatsu M, Finley K, et al. Selective types of autophagy. Int J Cell Biol. 2012;2012:156272. PubMed PMID: 22956958; PubMed Central PMCID: PMCPMC3432363.
- Avivar-Valderas A, Bobrovnikova-Marjon E, Alan Diehl J, et al. Regulation of autophagy during ECM detachment is linked to a selective inhibition of mTORC1 by PERK. Oncogene. 2013 Oct 10;32(41):4932–4940. PubMed PMID: 23160380; PubMed Central PMCID: PMCPMC3600386.
- Lee H, Noh JY, Oh Y, et al. IRE1 plays an essential role in ER stress-mediated aggregation of mutant huntingtin via the inhibition of autophagy flux. Hum Mol Genet. 2012 Jan 1;21(1):101–114. PubMed PMID: 21954231.
- Inoki K, Zhu T, Guan KL. TSC2 mediates cellular energy response to control cell growth and survival. Cell. 2003 Nov 26;115(5):577–590. PubMed PMID: 14651849.
- Qin L, Wang Z, Tao L, et al. ER stress negatively regulates AKT/TSC/mTOR pathway to enhance autophagy. Autophagy. 2010 Feb;6(2):239–247. PubMed PMID: 20104019.
- Marquez RT, Xu L. Bcl-2:beclin1 complex: multiple, mechanisms regulating autophagy/apoptosis toggle switch. Am J Cancer Res. 2012;2(2):214–221. PubMed PMID: 22485198; PubMed Central PMCID: PMCPMC3304572.
- Liang J, Shao SH, Xu ZX, et al. The energy sensing LKB1-AMPK pathway regulates p27(kip1) phosphorylation mediating the decision to enter autophagy or apoptosis. Nat Cell Biol. 2007 Feb;9(2):218–224. PubMed PMID: 17237771.
- Stansborough RL, Bateman EH, Al-Dasooqi N, et al. Fractionated abdominal irradiation induces intestinal microvascular changes in an in vivo model of radiotherapy-induced gut toxicity. Support Care Cancer. 2017 Jun;25(6):1973–1983. PubMed PMID: 28175996.