
ABSTRACT
The EPG5 protein is a RAB7A effector involved in fusion specificity between autophagosomes and late endosomes or lysosomes during macroautophagy/autophagy. Mutations in the human EPG5 gene cause a rare and severe multisystem disorder called Vici syndrome. In this work, we show that zebrafish epg5-/- mutants from both heterozygous and incrossed homozygous matings are viable and can develop to the age of sexual maturity without conspicuous defects in external appearance. In agreement with the dysfunctional autophagy of Vici syndrome, western blot revealed higher levels of the Lc3-II autophagy marker in epg5-/- mutants with respect to wild type controls. Moreover, starvation elicited higher accumulation of Lc3-II in epg5-/- than in wild type larvae, together with a significant reduction of skeletal muscle birefringence. Accordingly, muscle ultrastructural analysis revealed accumulation of degradation-defective autolysosomes in starved epg5-/- mutants. By aging, epg5-/- mutants showed impaired motility and muscle thinning, together with accumulation of non-degradative autophagic vacuoles. Furthermore, epg5-/- adults displayed morphological alterations in gonads and heart. These findings point at the zebrafish epg5 mutant as a valuable model for EPG5-related disorders, thus providing a new tool for dissecting the contribution of EPG5 on the onset and progression of Vici syndrome as well as for the screening of autophagy-stimulating drugs.
Abbreviations
ATG: autophagy related; cDNA: complementary DNA; DIG: digoxigenin; dpf: days post-fertilization; EGFP: enhanced green fluorescent protein; EPG: ectopic P granules; GFP: green fluorescent protein; hpf: hours post-fertilization; IL1B: interleukin 1 beta; Lc3-II: lipidated Lc3; mpf: months post-fertilization; mRNA: messenger RNA; NMD: nonsense-mediated mRNA decay; PCR: polymerase chain reaction; qPCR: real time-polymerase chain reaction; RAB7A/RAB7: RAB7a, member RAS oncogene family; RACE: rapid amplification of cDNA ends; RFP: red fluorescent protein; RT-PCR: reverse transcriptase-polymerase chain reaction; SEM: standard error of the mean; sgRNA: guide RNA; UTR: untranslated region; WMISH: whole mount in situ hybridization; WT: wild type.
Introduction
EPG-5 (ectopic P granules 5) was initially identified, together with other 3 new proteins, EPG-2, EPG-3 and EPG-4, in the nematode Caenorhabditis elegans as a factor involved in the degradation of germline P granule components in somatic cells during embryogenesis [Citation1]. All EPG proteins are involved in starvation-induced autophagy, an evolutionarily conserved catabolic process, in which a cell degrades and recycles, through the lysosomes, long-lived proteins and dismantles damaged organelles in order to maintain cellular homeostasis. This process, which consists of a cascade of finely regulated steps and employs a specific subset of proteins, plays a central role also during embryonic development, cellular differentiation, normal physiology, survival during starvation and aging [Citation2,Citation3]. In particular, EPG5 was found to be required for the fusion of autophagosomes with late endosomes and lysosomes, a final step of the autophagy process [Citation4]. More recently, the analysis of EPG5 molecular functions revealed its interaction with RAB7 and vesicle-associated membrane protein 8, both localized on late endosomes/lysosomes. In addition, a complex formation between EPG5, microtubule-associated protein 1 light chain 3 beta (hereafter referred to as Lc3 in zebrafish) and syntaxin-17-synaptosomal-associated protein 29 has been proved in autophagosomes. Thus, EPG5 tethering activity allows assembly and stabilization of soluble NSF attachment protein receptor complexes and promotes fusion specificity [Citation5].
In humans, the EPG5 gene is located on 18q12.3 and was initially identified among a group of genes found to be mutated in breast cancer [Citation6]. This gene consists of 44 exons, with the longest transcript, among those reported in Ensembl [Citation7], encoding for a protein of 2,579 amino acids [Citation8]. The EPG5 gene is mainly expressed in the central nervous system (CNS) and in skeletal and cardiac muscles, as well as in thymus, immune cells, lung and kidney [Citation8]. Recessive mutations in the human EPG5 gene have been associated with a rare multisystemic disorder, called Vici syndrome (OMIM 242,840), mainly characterized by agenesis of the corpus callosum, hypopigmentation, variable immunodeficiency, cardio- and skeletal myopathy and decreased autophagy activity [Citation9]. This disease determines a markedly reduced life expectancy, with death occurring in infancy or early childhood. Recurrent and severe infections and/or progressive heart failure represent the most frequent causes of death in patients affected by EPG5-related diseases [Citation10]. Vici syndrome is the first multisystemic disorder directly associated with mutations in an autophagy-related gene [Citation9]. EPG5 mutations are distributed along the whole coding sequence [Citation9,Citation11]. The majority of these are null mutations predicted to produce truncated EPG5 proteins of variable lengths, whereas missense mutations occur in a very low number of cases [Citation12]. Notably, one of them was found to produce also multiple misspliced mRNA isoforms giving rise to truncated EPG5 proteins [Citation13].
To study EPG5 protein functions, an epg5 null mouse model was generated [Citation14]. epg5 knockout mice grow normally into sexually mature adults, but progressively develop neuronal damages and myofiber atrophy associated with behavioral and motor abnormalities, resulting in death between 10 and 12 months of age [Citation14,Citation15]. Although several features in this mouse model resemble those found in Vici syndrome, other features of the disease, such as hypopigmentation, facial dysmorphism and cataract, are absent [Citation14]. In addition, EPG5-deficient mice show key traits of amyotrophic lateral sclerosis [Citation15] and retinitis pigmentosa [Citation16] and could therefore help in unravelling the molecular mechanisms underlying these pathologies. As in C. elegans, EPG5 loss-of-function in mice leads to impaired autophagosome maturation and abnormal endosome trafficking [Citation14]. This latter defect was not evident in Vici syndrome patient-derived cells, and it was proposed that EPG5 function might be limited to autophagosome-lysosome fusion [Citation17]. Finally, an epg5 null medaka fish model revealed that ablation of this gene not only impairs the autophagic flux but also spermatogenesis, due to failure of germ plasm and mitochondria clearance during the process of germ cell specification in embryogenesis and in the adult gonads [Citation18].
In the present study, we describe the generation and characterization of a zebrafish epg5 mutant line by CRISPR-Cas9 mutagenesis. This line represents, to our knowledge, the first stable zebrafish model for EPG5-related disorders and provides a powerful novel tool for investigating the contribution of this protein on the development and progression of Vici syndrome from embryonic stages to adult. In addition, this fish model might be useful for large-scale in vivo screening of autophagy-modulating drugs.
Results
Zebrafish epg5 characterization and expression during development
epg5 is present in the zebrafish genome as a single gene located on chromosome 5. Because no experimentally-determined full-length epg5 sequences were available, we performed a 5ʹ-RACE analysis with RNA extracted from 4-hours post-fertilization (hpf) embryos to obtain a 363-nucleotide (nt) sequence containing the first non-coding exon and 2 coding exons of the epg5 mRNA transcript (AC MG775431). The transcript begins with a 5ʹ-untranslated region (UTR) of 117 nt. This experimentally-determined epg5 transcript fragment matches with the Genbank XM_009301680 and XM_005165361 sequences, but slightly diverges from the Genbank NM_001110525 sequence, which contains a different first exon and results in a 13-residue shorter protein with a different N-terminal region (see Figure S1(a)).
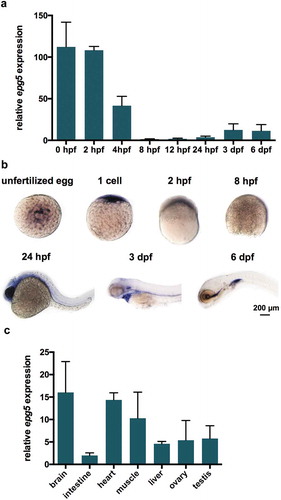
To investigate the temporal expression of zebrafish epg5, we performed RT-qPCR analysis on cDNA obtained from different developmental stages, ranging from 0 hpf to 6 days post-fertilization (dpf) ()) and a gene-specific primer set designed to span two introns, to reveal any contaminating genomic DNA (epg5-F and epg5-R). To compare differential gene expression over time, all values were adjusted to the stage with the lowest expression level, corresponding to 8 hpf, which was set at an arbitrary unit of 1. This analysis revealed that epg5 transcripts were maternally deposited into the oocytes, with the highest concentrations at 0 and 2 hpf. Thereafter, epg5 maternal transcripts declined throughout the first 8 hpf, being replaced at a low level by the corresponding embryonic mRNAs ()). To analyze the spatio-temporal expression of maternal and zygotic epg5 mRNAs during development, whole mount in situ hybridization (WMISH) was performed on wild type (WT) ovulated oocytes and embryos and larvae from 0.2 hpf to 6 dpf using a DIG-labeled antisense epg5 mRNA probe of 363 nt covering the 5ʹ-UTR and the N terminus. In oocytes, maternal epg5 mRNA was spread throughout the central ooplasm, as shown in ). At the 1-cell stage (0.2 hpf), transcripts were restricted to the blastodisc area, whereas no or very low signal was found at 8 and 12 hpf, in agreement with RT-qPCR results showing a minimum of epg5 mRNA concentration at these stages. At 24 hpf, the embryonic epg5 expression was mainly concentrated in the head and trunk. At 3 dpf, the transcripts were localized in the oral cavity and heart region and at 6 dpf mainly in the oral cavity and intestine. Cross sections of 6-dpf WMISH-stained larvae confirmed epg5 expression in the above districts (data not shown). In adults, RT-qPCR analysis showed epg5 expression in the brain, muscle, heart, liver, intestine and gonads ()).
Figure 1. epg5 expression patterns during zebrafish development. (a) RT-qPCR analysis of epg5 expression. The graph shows the relative epg5 transcript abundance in whole zebrafish embryos and larvae, from 0 hpf to 6 dpf. Error bars indicate ± SEM. Data were generated from 3 biological replicates, each a pool of 15 embryos or larvae. (b) Spatio-temporal expression of epg5 transcripts during zebrafish development, as revealed by WMISH performed at the indicated stages. All embryos or larvae are lateral views with the animal pole up (1-cell and 8-hpf) and head pointing to the left (24-hpf, 3-dpf and 6-dpf). Scale bar: 200 μm. (c) Graph showing the relative abundance of epg5 transcripts in zebrafish adult tissues, as determined by RT-qPCR. Error bars indicate ± SEM. Data were generated from 4 adult zebrafish (2 males and 2 females).
Generation and characterization of stable zebrafish epg5 mutant lines by targeted mutagenesis
To generate an Epg5 loss-of-function zebrafish model, we mutated the zebrafish epg5 gene using a CRISPR-Cas9 approach. In order to delete the whole functional protein, the CRISPR sequence was designed on the third exon (corresponding to the second coding exon). The sgRNA (see Figure S1), injected together with the cas9 mRNA, caused mutation at the expected target site in F0 embryos, as confirmed by sequencing of PCR fragments, which showed mutation in the proximity of the target CRISPR sequence. Two heterozygous F1 carriers with a 20- and a 13-nt deletion were selected from offspring of F0 outcrosses and used to obtain the F2 generation. Both deletions gave rise to frameshift mutations that lead to premature stop codons located 62 and 61 codons after the first translation codon, respectively. The putative encoded proteins contained 51 and 49 amino acid residues of the zebrafish Epg5 plus 11 and 12 new amino acid residues, respectively. Since preliminary analyses showed that the two epg5 mutant lines displayed similar effects on the autophagy process, we subsequently used only the 20-nt deleted line, named epg5ia31/ia31 in ZFIN database and epg5-/- hereafter ()).
Figure 2. Knockout of zebrafish epg5 gene. (a) Nucleotide and amino acid sequences showing the 13-bp and 20-bp deletion mutations, as revealed by DNA sequencing analysis of the epg5 CRISPR target site. Each deleted nucleotide is represented by a dash. CRISPR target site, highlighted in grey with the protospacer-adjacent motif sequence in bold, was designed within the second coding exon, corresponding to exon 3 of the epg5 gene. The epg5 sequence is shown from the start codon to the newly formed stop codons resulting from the introduced frameshifts in the coding region. The new amino acid residues resulting from nucleotide loss after CRISPR-Cas9 editing are labelled in bold red. (b) RT-qPCR analysis of 5-dpf WT and epg5-/- larvae, showing a statistically significant decrease of epg5 expression in epg5-/- mutants. Values represent the mean ± SEM. Data were generated from 3 biological replicates, each a pool of 15 larvae. Statistical significance was determined by two tail Student’s t-test (*, P < 0.05). (c) WMISH analysis of epg5 expression in 24-hpf WT and epg5-/- mutant embryos. Embryos are lateral views with head pointing to the left. Scale bar: 200 μm.
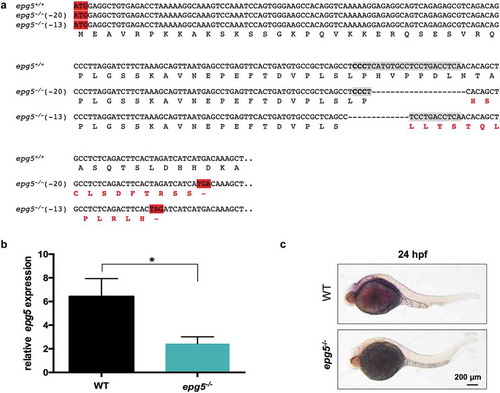
Due to the unavailability of a zebrafish Epg5-specific antibody and to the lack of cross-reactivity with commercial anti-human EPG5 antibody (Sigma-Aldrich, HPA031689), we could not experimentally verify the absence of the corresponding protein in our mutants. Thus, we investigated whether the introduced mutation resulted in quantitative changes of the epg5 transcribed products by means of RT-qPCR in 6-dpf homozygous mutants as compared to WT larvae. This analysis showed a statistically significant reduction of epg5 transcript levels to less than 35% of those measured in WT fish ()), an outcome consistent with nonsense-mediated mRNA decay (NMD) due to premature stop codon presence [Citation19]. Moreover, WMISH analysis of 24-hpf embryos from homozygous parents also showed, as expected, a consistent reduction of epg5 transcripts ()).
To evaluate whether the residual epg5 mRNAs can be translated from the 57 in-frame alternative AUG codons downstream the premature stop codon (XM_005165361.4) we carried out analyses with 2 translation initiation site prediction in cDNA sequences programs, TIS Miner (http://dnafsminer.bic.nus.edu.sg/Tis.html; [Citation20]) and ATGpr (http://atgpr.dbcls.jp; [Citation21]). These tools revealed that only a low number of these AUG codons present a correct Kozak consensus sequence. Finally, the mutated region was analyzed by RT-PCR and sequencing, confirming the presence of the mutation in the residual epg5 transcripts of homozygous mutants (data not shown).
Homozygous epg5 mutant embryos, obtained by heterozygous mating, were phenotypically similar to control siblings and segregated according to a Mendelian ratio, as shown by genotyping analysis of single embryos. Also, the survival rate during development was normal, indicating that Epg5 deficiency did not affect early embryo viability. Furthermore, the offspring from incrossed homozygous epg5 mutants raised to adulthood was viable and fertile, thus excluding that survival of homozygous fish derived from heterozygous females could be primarily due to the compensative effects of maternal epg5 transcripts or proteins.
Loss of Epg5 results in impaired autophagosome-lysosome fusion and defective response to starvation in zebrafish
To assess whether the predicted loss of the Epg5 protein results in autophagy impairment, we performed a western blot analysis on proteins extracted from 8- and 11-dpf epg5-/- and WT larvae. This analysis revealed that in fed conditions the levels of lipidated Lc3 (Lc3-II), the form localized specifically on the autophagosome membrane, were slightly higher but not significantly different in 8-dpf mutant larvae with respect to WT (,). Interestingly, Lc3-II levels were significantly higher in mutants at 11 dpf. As Lc3-II is a substrate for autophagic degradation, being continuously generated and degraded during the autophagic flux, its accumulation in zebrafish mutants confirmed the expected failure of the autophagic degradation pathway leading to accumulation of undegraded autophagic vacuoles (,).
Figure 3. Autophagy impairment in zebrafish epg5-/- mutants. (a) Representative western blot for Lc3 in WT and epg5-/- larvae at 8 dpf and 11 dpf, and (b) densitometric analysis of band intensities. Actb/β-actin was used as a control for protein loading. Statistical significance was determined by one tail Student’s t-test. Data are presented as mean ± SEM and were generated from 4 biological replicates with pools of 10 larvae (*, P < 0.05; n.s., not significant). (c) Transmission electron microscopy analysis of skeletal muscle of WT and epg5-/- larvae and adults. WT larvae and adults (upper panels) display well-organized myofibrils with subsarcolemmal mitochondria (M) and a well-developed sarcoplasmic reticulum (SR). 8-dpf epg5-/- larvae do not display overt changes of the ultrastructural organization of muscle fibers with respect to WT larvae, except for some subsarcolemmal membrane-like structures (ml), and some mitochondria with dilation of the outer membrane (arrows). Changes suggestive of altered autophagic flux, as accumulation of autophagosomes (AF), are evident in 11-dpf epg5-/- larvae. Although at a lesser extent, autophagosomes are also present in adult epg5-/- zebrafish. Ultrastructural analysis was performed on 4–5 animals for each condition. Scale bar: 1 µm.
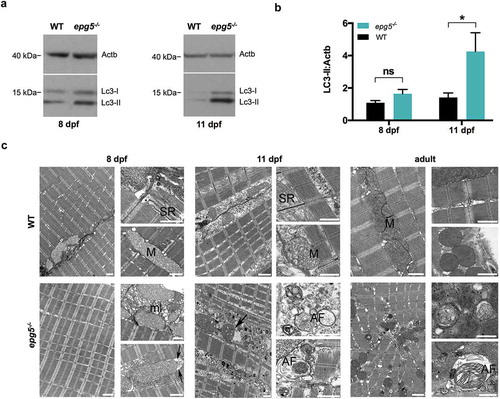
Electron microscopy analysis of 11-dpf larvae revealed overt muscle alterations in epg5-/- mutants, consistent with an impairment of the autophagic flux ()). Extensive accumulation of cytoplasmic debris, most of it membrane-bound, was detected among myofibrils. Several double membrane-bound structures, often including non-degraded organelles (i.e. mitochondria, endoplasmic reticulum membranes, glycogen granules) and compatible with autophagosomes, were noticed, while lysosomes were very rare. Some swollen mitochondria were detected, while the sarcoplasmic reticulum and the nuclear structure were apparently unaffected. The accumulation of autophagosomes was observed in non-degenerating myofibers, suggesting an early involvement of the autophagy defect in the onset of the muscle phenotype. Fed 8-dpf epg5-/- larvae displayed subsarcolemmal accumulation of membranous structures and some mitochondria with dilation of the outer membrane, while autophagosomes were sporadically detected ()). Although at a lesser extent, the accumulation of autophagosomes containing non-degraded mitochondria or cytoplasmic material occurred also in the muscle of fed epg5-/- adult fish ()). On the other hand, autophagosomes were never seen in fed WT 11-dpf larvae and adult fish.
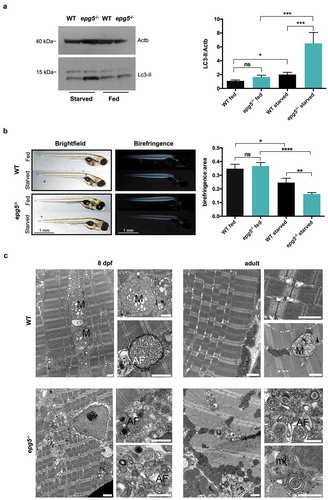
Due to the essential role of Epg5 during starvation-induced autophagy [Citation4], we analyzed the response of epg5-/- mutants to 2-day-long fasting. The experiment started at 5 dpf, around the onset of zebrafish exogenous feeding and thus before complete yolk depletion, and ended at 8 dpf. Western blot analysis of total proteins in 8-dpf larvae showed that starvation led to increased Lc3-II levels both in control and mutant larvae, but this increase was much higher in the latter ()). Skeletal muscle is one of the tissues with the highest rates of autophagic vesicle formation during fasting, thus ensuring cell survival through autophagic degradation of cytoplasm components [Citation22]. Hence, we analyzed skeletal muscle birefringence, which makes it possible to assess in vivo defects in the amount and/or organization of myofibrils, due to either muscle atrophy or damage. In fed condition, muscle birefringence was similar between WT and epg5-/- larvae, but starvation caused a drop in birefringence that was much higher in the epg5-/- larvae than in WT ()). Moreover, birefringence analysis did not show a patch-like pattern in epg5-/- larvae (as found in dystrophic models with random detachment of fibers from myosepta) but rather an overall attenuation, suggesting a general loss of fibers. Complying with a block of the autophagic flux, 2-day starvation induced an evident accumulation of autophagosomes in both 8-dpf epg5-/- larvae and adult epg5-/- fish ()). Conversely, age-matched fasted WT individuals showed only mitochondrial alterations, while autophagosomes and cytoplasmic debris were only occasionally detected ()).
Figure 4. Starvation response of zebrafish epg5 mutants. (a) Representative western blot for Lc3 in 8-dpf WT and epg5-/- larvae under fed and fasting conditions (left panel), and densitometric analysis of band intensities (right panel). β-actin was used as a control for protein loading. Lc3-II expression was higher in homozygous mutants with respect to WT and, upon starvation, epg5-/- mutant larvae exhibited a significantly higher increase of Lc3-II levels than the corresponding WT larvae. Statistical significance was determined by one tail t-test. Data are presented as mean ± SEM and were generated from 3 biological replicates with pools of 12 larvae (*P, < 0.05; **, P < 0.01; ***, P < 0.001). (b). Light microscopy analysis of muscle birefringence in 8-dpf WT and epg5-/- larvae under fed conditions and following two-day starvation (left panels), and quantification of muscle birefringence (right panel). Bright field images of WT and epg5-/- larvae are shown for reference. A global decrease of muscle birefringence is detected in fasted WT and epg5-/- larvae, but two-day starvation led to a significantly higher decrease of muscle birefringence in epg5-/- larvae when compared to controls, consistently with a myopathic phenotype. Quantification of birefringence was calculated as described in the Methods section. Statistical significance was determined by Student’s t-test. Data are presented as mean ± SEM and were generated from 3 different experiments, each containing 10 larvae per genotype and treatment condition (*, P < 0.05; **, P < 0.01; ****, P < 0.0001). Scale bar: 1 mm. (c) Transmission electron microscopy analysis of 8-dpf WT and epg5-/- larvae (left panels) and adults (right panels) subjected to food starvation for 2 d. In agreement with a defective regulation of autophagy, starved epg5-/- mutant larvae and adults display an accumulation of autophagosomes (AF) and membrane-like structures (ml). In contrast, starved WT larvae and adults display enlarged mitochondria (M) and rare autophagosomes (AF). Ultrastructural analysis was performed with 4–5 animals per genotype. Scale bar: 1 µm.
epg5 ablation in zebrafish affects the development of goblet cells in the intestine
Given the intriguing expression of epg5 transcripts in the intestine of zebrafish during larval stages, as shown by WMISH ()), we looked for possible effects of epg5 silencing on this tissue, starting with alcian blue staining of 6-dpf larvae to analyze mucins secreted by goblet cells in the mid-intestinal region, where these cells are restricted during larval stages [Citation23]. A substantial and statistically significant decrease in alcian blue-stained goblet cell area was found in 6-dpf epg5-/- larvae when compared to age-matched WT larvae ()). Moreover, as maturation of goblet cells is associated with changes in their size besides mucous granule content [Citation24], we counted both mature cells (area ≥ 19.6 µm2, diameter 5 µm) and immature cells (area < 19.6 µm2). A significantly reduced number of total goblet cells, essentially due to fewer mature cells, was found in the intestine of mutant larvae ()). To confirm the correlation between Epg5 depletion and goblet cells, we analyzed goblet cell area in WT and mutant epg5-/- larvae also from 4 to 8 dpf. While at 4 dpf the area was reduced but not in a statistically significant manner, all the other analyzed stages displayed a significantly lower goblet cell area (Figure S2).
Figure 5. epg5-/- larvae display decreased number of goblet cells and higher incidence of cell death in the intestine. (a) Detection of mucin-containing goblet cells in 6-dpf WT and epg5-/- mutant larvae by whole mount alcian blue staining. The graph reports quantification of average mucin area:goblet cells (WT, n = 16; epg5-/-, n = 11). Statistical significance was determined by Student’s t-test, and data are presented as mean ± SEM (**, P < 0.01). The left panels show representative images of alcian blue stained WT and epg5-/- larvae. Scale bar: 200 μm. (b) Quantification of the number of total, mature and immature goblet cells at 6 dpf (WT, n = 7; epg5-/-, n = 11). Statistical significance was determined by Student’s t-test, and data are presented as mean ± SEM (**, P < 0.01; ***, P < 0.001; ns, not significant). (c) Analysis of intestinal Sox9b-positive cell by means of immunofluorescence in 4- and 5-dpf larvae (WT, n = 10; epg5-/-, n = 10). Statistical significance was determined by Student’s t-test, and data are presented as mean ± SEM (**, P < 0.01). The left panels show 4 representative images of WT and epg5-/- larvae. Scale bar: 100 μm. (d) Analysis of intestinal cell death by means of acridine orange staining in 6-dpf larvae (WT, n = 10; epg5-/-, n = 10). Statistical significance was determined by Student’s t-test, and data are presented as mean ± SEM (**, P < 0.01). The left panels show 2 representative images of acridine orange stained WT and epg5-/- larvae. Scale bar: 200 μm.
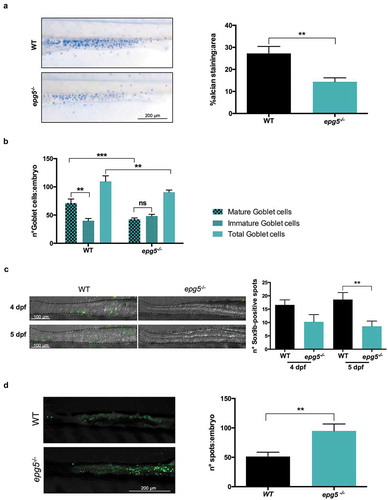
As a reduced number of goblet cells may reflect a reduced intestinal stem cell population, we performed immunofluorescence analysis for Sox9b, whose expression is limited to the base of the intestinal fold in adult medaka [Citation25] and zebrafish [Citation26], a region where cell proliferation is restricted, thus representing a putative marker of intestinal stem cells. As reported in ), in epg5-/- larvae the number of Sox9b-positive cells was lower at both stages analyzed and statistically significant at 5 dpf, suggesting a reduced capability to maintain the intestinal homeostasis. In parallel, we also found a higher incidence of cell death in epg5-/- intestine, as revealed by acridine orange staining ()).
To assess whether the lower goblet cell number may result in an increase of intestinal inflammation due to decreased production of protective mucus, we analyzed WT and epg5-/- larvae at 5-, 10- and 20-dpf stages for the expression of il1b/il1β by RT-qPCR and found a distinct trend, although not statistically significant, toward its upregulation in mutant larvae (Figure S3). The high degree of variability of these latter results may be explained by variability in the different batches of larvae, but also by dilution effects due to the analysis of whole-body samples.
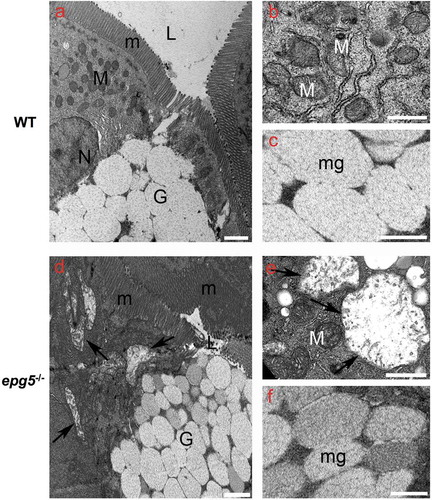
Transmission electron microscope analysis revealed striking alterations in 8-dpf epg5-/- intestine, with overt mitochondrial swelling in enterocytes and changes in the size and electron density of mucin vesicles in goblet cells. In WT larvae, the intestine displayed uniform, polarized enterocytes with an apical brush border, lateral cell border characterized by the presence of adherent junctions and desmosomes, and a basal membrane. Several scattered goblet cells, characterized by mucous granules with a reticular-filamentous content, were also present (–). Conversely, although mutant larvae displayed columnar-shaped enterocytes joined apically through a complex set of adherent junctions and desmosomes (not shown) and regular microvilli ()), enterocytes of epg5-/- larvae contained numerous mitochondria with increased size, reduced cristae and empty matrix (,), changes indicative of mitochondrial swelling. In addition, goblet cells of epg5-/- larvae showed mucous granules of reduced size and filled with electrodense granular material (–), consistent with delayed maturation, thus confirming the previous results obtained with alcian blue-staining.
Figure 6. Ultrastructural changes in the intestine of epg5-/- mutants. Transmission electron microscopy of 8-dpf WT (a–c) and epg5-/- (d–f) larvae, showing swelling of mitochondria (arrows in D and E) and increased density of mucous granules within goblet cells (asterisks in D and F) in epg5-/- larvae. G, goblet cell; L, lumen; M, mitochondrion; m, microvilli; mg, mucous granules; N, nucleus. Scale bar: 400 nm.
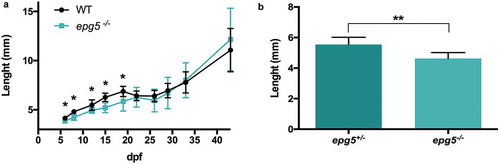
As the delayed maturation of goblet cells and the starvation phenotype of 11-dpf mutant larvae suggested a possible impairment of intestinal adsorptive capabilities, we measured body length as an estimate of larval growth rate. Compared to WT, epg5-/- larvae from incrossed homozygous animals displayed a slight but significant lower growth rate between 6 to 19 dpf ()). By 20 dpf, this delay was recovered, and length variations were no longer statistically significant. In order to exclude that length differences might be due to different genotypes or to the lack of epg5 maternal transcripts, the same analysis was performed at 15 dpf with sibling clutches derived from heterozygous female per homozygous male cross. Also in this case, the length difference was statistically significant ()).
Figure 7. epg5-/- larvae display slower growth rates. (a) Growth curve of WT and epg5-/- larvae derived from homozygous parents. Body length (in mm) was measured from 6 dpf to 44 dpf. The body length of epg5-/- larvae was significantly lower than WT from 6 to 19 dpf. Statistical significance was determined by multiple t-test comparing each age group using the Holm-Sidak method, and each age group was analyzed individually without assuming a consistent SD. Data are presented as mean ± SD (*, P < 0.05; n = 16 for each age and genotype). (b) Body length of siblings at 15 dpf from an outcross between one heterozygous female and one homozygous male. Statistical significance was determined by Student’s t-test. Data presented as mean ± SEM (**, P < 0.01; epg5-/-, n = 8; epg5±, n = 7).
Loss of zebrafish Epg5 does not elicit motor neuron developmental defects
Motor neuron development was analyzed by comparing heterozygous and homozygous epg5 mutants in the Tg(mnx1:GFP) (formerly hb9:GFP) [Citation27] transgenic background, in which spinal motor neurons and their processes are labelled with GFP. At 25 and 52 hpf, motor neuron development was the same in both genotypes in terms of axon number and arborization (Figure S4), thus excluding a problem in motor neuron development linked to epg5 deficiency.
Adult epg5-/- mutants display multiple defects in heart, gonads and other tissues
Adult epg5-/- fish reached at least 18 mpf (months post-fertilization). Although at this age they did not show any overt signs of distress, some of them were slightly thinner and displayed lower motility. On the basis of the morphological alterations described below, we considered this age as a humane endpoint, and thus mutants reaching 18 mpf were sacrificed and subjected to histological analyses. Comparative morphological analysis was performed in 10 WT and 20 epg5-/- adult zebrafish of both sexes, whose ages ranged from 4 to 18 mpf. This analysis revealed defects in the heart ()) and, although with a variable phenotype, in the gonads of epg5-/- animals (,).
Figure 8. Epg5 deficiency causes multiple tissue defects in adult zebrafish. (a) Effects of Epg5 deficiency on heart morphology in a zebrafish mutant male (9 mpf) in comparison with a WT fish at the same age. The boxed areas are shown at higher magnifications, to compare the compact myocardium structure between the 2 genotypes. epg5-/- heart displays a thinner compact myocardium, with an altered trabecular network containing clumps of red cells. A, atrium; Ba, bulbus arteriosus; C, clump, Cm, compact myocardium; Sv, sinus venosus; T, trabeculae; V, ventricle. (b) Effects of Epg5 deficiency on ovarian morphology in an epg5-/- mutant female (10 mpf), in comparison with a WT fish at the same age. epg5-/- ovary contains only immature stage I oocytes of the perinucleolar stage (Po), whereas WT ovary contains oocytes at different developmental stages. The arrows point at areas of interstitial edema. Ca, cortical alveolus stage oocyte; Mo, mature oocytes; Vo, vitellogenic stage oocyte. (c) Effects of Epg5 deficiency on testicular morphology in a male epg5-/- mutant (4 mpf) in comparison with a WT fish at the same age. Spermatozoa (Sz) and all stages of spermatogenesis are present on WT testis, whereas the tissue structure is disorganized in the epg5-/- testis, which also contains empty tubules (asterisk). Sc, spermatocytes; Sg, spermatogonia.
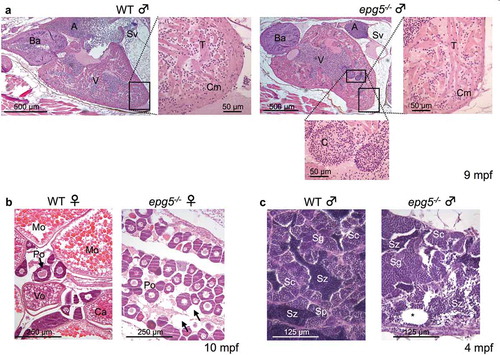
Consistent with the clinical features of Vici syndrome, all adult mutants displayed variable degrees of dilation of the heart and a reduction of the compact myocardium, as well as of the trabecular network () and S5). In one epg5-/- heart, clumps of red cell were seen between ventricular trabeculae ()), whereas in another one these were found in the sinus venosus (Figure S5 and Table S2).
All the analyzed adult WT females presented asynchronous ovaries, which contained follicles at all stages of development ranging from primary to full growth stages () and S6). Similar results were also obtained with some epg5-/- females, whereas histological analysis of other adult epg5-/- females showed ovaries typical of immature zebrafish, with reduced size and the almost exclusive presence of primary and pre-vitellogenic follicles, suggesting an impairment of follicle maturation. In addition, 2 females presented a very disorganized ovary with degenerative oocytes and a high proportion of early and late-stage atretic follicles (Figure S6 and Table S2). Defects were also found in the testes of epg5-/- males. Testes of all adult WT were organized into lobules containing sperm and all stages of spermatogenesis, whereas testes of mutants displayed morphological changes including drastically reduced size, tissue disorganization, empty tubules and increased fibrous connective tissue within the testicular stroma (), S7 and Table S2). These results emphasize impaired reproductive capabilities of epg5-/- mutants of both sexes, starting at around 8–10 months of age. According to the histological defects, a clear reduced mating success was measured both in male and female epg5-/- compared to WT at the same age (Figure S8).
No overt alterations of intestinal tissues were visible in adult mutants until about one year. However, in some of the oldest mutants, the intestinal mucosa displayed a sloughing epithelium at the fold tips and sometimes, in particular in oldest male samples, signs of mucosa detachment and degeneration of epithelium, defects that may explain the thinner appearance of epg5-/- mutants due to malabsorption (Figure S9 and Table S2). Moreover, the intestine of one 18-mpf-old female presented morphological alterations of the mucosa, which in some areas were associated with clusters of cells within the lamina propria (Figure S9 and Table S2). Additionally, one 10-mpf-old epg5-/- female developed a chordoma, an uncommon malignant tumor arising from notochord remnants usually occurring in the axial skeleton [Citation28,Citation29]. In our sample, as in those reported in a previous independent study [Citation29], the neoplasia was found in the alimentary tract and not in the axial skeleton. Morphology of the tumor was in agreement with a previous description [Citation29], with masses/nodules of notochord-like cells scattered throughout the intestine and separated from one another by fibrous bands (Figure S10(a)). In this epg5-/- female, the intestinal mucosa appeared altered and reduced in height. Histological analysis revealed the presence of a liver of extremely large size, with also morphologically altered areas, in one 13-mpf female (Figure S11). Moreover, the ovary of this female was reduced in size and presented a high concentration of atretic follicles. In gills, large hemorrhagic areas were clearly present (Figure S12(a)). Finally, areas with eosinophilic granular cells, generally dispersed in proteinaceous fluid, observable as homogenous dark pink material, were found in different samples of epg5-/- adults, such as around exocrine pancreatic tissues, in the proximity of the testis or above of the chordoma cysts (Figure S12 and Table S2).
Characterization of the reduced autophagosome-lysosome fusion of epg5-/- mutants
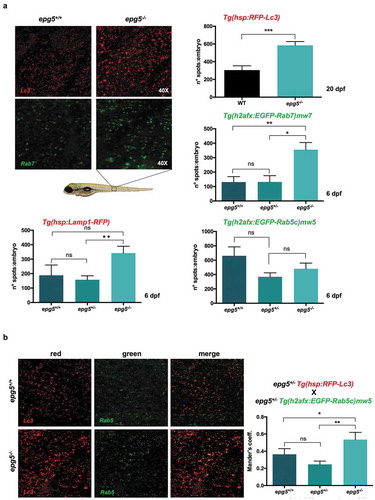
To analyze the autophagy flux in Epg5-deficient fish, epg5-/- mutant lines were generated in lc3 (Tg(hsp:RFP-LC3), labelling autophagosomes), rab5 (Tg(h2afx:EGFP-Rab5c)mw5, labelling early endosomes), rab7 (Tg(h2afx:EGFP-Rab7)mw7, labelling late endosomes and lysosomes) and lamp1 (Tg(hsp:Lamp1-RFP), labelling mature lysosomes) transgenic backgrounds. In agreement with western blot and electron microscopy data (see ), analysis of fluorescent Lc3 puncta showed a minor increase in 6-dpf epg5-/- mutants (not shown) and a strong increase in 20-dpf epg5-/- mutants ()). Lamp1 and Rab7 fluorescence signals were markedly accumulated in 6-dpf epg5-/- mutant larvae ()), confirming that lack of Epg5 results in the block of the autophagosome fusion with lysosomes. Conversely, Rab5 fluorescence signal was not different between 6-dpf WT and epg5-/- larvae ()), suggesting that maturation of early endosome to late endosome was not compromised by Epg5 ablation. epg5-/- larvae showed a minor, non-significant increase in the ratio of colocalization of Lc3 with Rab7 (data not shown). In contrast, fusion of Lc3-positive puncta with early endosomes, as indicated by the colocalization of Lc3 with Rab5, was increased in epg5 mutants ()), in agreement with the results previously obtained with C. elegans epg5 mutants [Citation5].
Figure 9. epg5-/- mutants display reduced autophagosome-lysosome fusion. (a) Representative fluorescence microscopy images and quantification of fluorescence spots for Lc3, Rab7, Rab5 and Lamp1 in sibling larvae obtained by crossings of epg5± mutants with the respective transgenic reporter fish lines (see also Methods). Analysis of fluorescence spots was performed in larvae at 20 dpf for Lc3 (n = 18), and in larvae at 6 dpf for the other markers. Statistical significance was determined by Student’s t-test, and data are represented as mean ± SEM (*, P < 0.05; **, P < 0.01; ***, P < 0.001; ns, not significant; n = 30 for each transgenic line). (b) Quantification of the colocalization between Rab5 spots (green) and Lc3 spots (red) in 6-dpf siblings obtained by crossings of epg5+/- mutants with the Rab5 and Lc3-double transgenic background, using Mander’s coefficient. Statistical significance was determined by Student’s t-test, and data are represented as mean ± SEM (*, P < 0.05; **, P < 0.01, ns, not significant; n = 22 for each genotype).
Discussion
In this work, we generated 2 viable and fertile zebrafish lines bearing a homozygous inactivating mutation in the epg5 gene. This was achieved by CRISPR-Cas9 deletion of a 13- and 20-nt segment, respectively, in the second coding exon of the zebrafish epg5 gene. Both deletions resulted in a frameshift, leading to premature stop codons that blocked translation after approximately 60 amino acid residues from the translation initiation codon. Detailed characterization of the mutants was performed using the 20-nt deletion line, named as epg5ia31/ia31 and called epg5-/- hereafter.
As determined by RT-qPCR analysis with primers designed downstream the CRISPR target region, the overall epg5 transcript levels were reduced by 65% in epg5-/- mutants, likely due to the NMD machinery, a surveillance pathway that prevents truncated protein formation [Citation19]. Based on the non-complete efficiency of the NMD machinery and the presence of several in-frame alternative downstream start codons, we cannot exclude potential alternative translation initiation events using the non-degraded epg5 mutant mRNAs, leading to truncated polypeptide products with at least partially retained functions. The lack of a zebrafish specific C-terminal Epg5 antibody and the absence of cross-reactivity with the commercially available human Epg5 antibody prevented us to analyze further the possible existence of truncated polypeptide products. However, the full penetrance of dysfunctional autophagy in zebrafish epg5-/- larvae, as confirmed by western blot analysis for the autophagy marker Lc3-II, suggests that Epg5 silencing was functionally achieved in our zebrafish mutant line. Impairment of the fusion of autophagosomes with lysosomes, the cell function in which Epg5 is involved as an effector of Rab7 [Citation5], was confirmed in zebrafish epg5-/- mutant lines by several different approaches, including western blotting, electron microscopy of muscle tissues at different ages and conditions, analysis of starvation-induced effects on autophagy flux, and evaluation of transgenic reporter lines for autophagy, lysosome and vesicle trafficking.
Although epg5-/- mutants were viable, phenotypic analysis revealed either a premature reduction of reproductive capabilities or a complete infertility starting from 8–10 months of age, when zebrafish reproductive capabilities are normally at the highest level [Citation30]. This finding was confirmed by histological analysis of the gonads, which presented, in both sexes, alteration of tissue architecture and a reduction of organ size, with an apparent block of the oocytes maturation process in females or the presence of a large number of atretic follicles. Involvement of Epg5 on spermatogenesis was already suggested by the work of Herpin et al. [Citation18], who found an essential role for this protein in the clearance of germplasm and mitochondria during germ cell specification and in the preservation of adult testis morphology in the medaka model organism. Silencing of Epg5 causes the loss of male medaka reproductive capacity, although no pathological features are reported regarding female gonads or other tissues/organs of the model [Citation18]. A significant contribution of autophagy on the reproductive system was also reported in mouse models. Germ cell-specific mouse atg7 knockout results in male and female fertility problems, as this autophagy gene is required for acrosome biogenesis during spermatogenesis and for protection from excessive oocyte loss [Citation31,Citation32]. Although the molecular mechanism underlying the reproductive impairment in zebrafish epg5-/- mutants needs to be further characterized, these results emphasize the critical role of autophagy on gametogenesis and reproduction.
Histological analysis of zebrafish epg5-/- mutants also highlighted pathological features of cardiomyopathy, in one case development of a tumor and several areas with invasion of eosinophilic granular cells. These cells, also called mast cells due to their similarity to mammalian mast cells [Citation33], can be observed in different tissues of teleost fish and have been suggested to be involved in defense mechanisms also linked to inflammation [Citation34].
These multisystemic effects can be explained by the wide expression of epg5 during zebrafish development and adult life, as shown by WMISH and RT-qPCR analysis of adult tissues. Moreover, these results were in agreement with the traits of Vici syndrome [Citation9] and confirmed the involvement of the autophagy pathway in the development and functioning of multiple organ systems. Whereas dysfunctional autophagy was confirmed in all the performed experiments, structural and degenerative changes in adult zebrafish epg5-/- mutants presented both common and uncommon features, indicating that the penetrance of the mutant phenotype differed between individuals, in agreement with features of Vici syndrome and results obtained with mouse [Citation14].
In humans, the EPG5 gene contains 44 exons encoding for a protein of 2579 amino acid residues. Mutations linked to the Vici syndrome identified so far are broadly distributed along the entire gene, and the great majority of them lead to the generation of a premature stop codon and eventually to the production of truncated proteins of different sizes [Citation10,Citation12]. Severity of the pathological features differs among Vici’s patients, and this was suggested to depend on the residual amount of functional EPG5 protein [Citation12,Citation13]. Interestingly, a recent paper [Citation35], describes a young boy with an attenuated Vici syndrome phenotype, presenting only four of the eight diagnostic features of the syndrome. This patient bears compound heterozygous mutations in the EPG5 gene, with one of these allowing reduced expression of WT EPG5 that possibly allowed him to acquire motor and communicative skills. In our zebrafish epg5-/- mutant lines, a variability in the residual Epg5 function due to the potential use of downstream start codons may explain the difference in phenotype severity, as well as the different onset of some pathological manifestations during adult life. Moreover, the possible presence of some shorter Epg5 products, missing the N-terminal portion of the protein, may explain the fact that zebrafish epg5-/- mutants still have reproductive capabilities, albeit time-limited, at difference from what displayed by the medaka model [Citation18]. The medaka mutant line was obtained during the generation of a transgenic model for Epg5 expression analysis and presents a single transgene insertion within the 3ʹ-UTR of the Oryzias latipes-epg5 gene. It is possible that O. latipes epg5 transcripts, devoid of the polyadenylation signal, results in a greater reduction of mRNA stability and messenger copy number with respect to our mutant. The lack of full penetrance of the phenotype may also rely on the activation of compensatory transcriptional activities [Citation36], whose efficiency likely decays with aging.
Growth impairment, a common feature of both Vici patients [Citation12] and epg5 knockout mice [Citation14], was also displayed by epg5-/- zebrafish mutants. In this model epg5 transcripts during larval stages were found to be expressed mainly in the oral cavity and intestine by WMISH, thus suggesting a possible involvement of this protein on intestine development. The reduction in body length was limited to the larval stage, just after the beginning of autonomous feeding, a process that partially overlaps with the completion of yolk depletion. Due to initial difficulties with prey capture, zebrafish larvae undergo a critical period, which lasts 7–10 d starting from first feeding [Citation37]. During this period, epg5-/- mutant larvae showed a significantly lower number of goblet cells, also paralleled by a decreased number of putative intestinal stem cells, and defective goblet cell maturation, pointing at a possible impairment in intestinal functioning. This may engender absorption problems in the intestine and a lower nutrient assimilation, leading to reduced growth as also suggested for a recently described EPG5 case [Citation38].
Moreover, the lower mucus amounts may determine susceptibility to intestinal inflammation, which explains the higher apoptotic cell number in the intestine of epg5-/- mutants. The high-molecular-weight glycoproteins of intestinal mucus exert a protective and homeostatic role on intestinal mucosa, as underlined by the phenotypes of mice deficient in AGR2, a protein essential for the synthesis and maturation of the intestinal mucin2, and of muc2 knockout mice [Citation39,Citation40]. Interestingly, agr2-/- mice show an increase in mast cells together with a higher expression of genes linked to inflammation, including Il1b [Citation39] whose expression showed an upregulated trend in epg5-/- zebrafish larvae from 5 to 20 dpf. It is known that autophagy is critically involved in the homeostasis of the intestinal epithelium, as demonstrated by chronic intestinal inflammation as a consequence of dysfunctional autophagy [Citation41] and by the association with high-risk Crohn disease development of single nucleotide polymorphisms in ATG16L1 (autophagy-related 16-like 1 [S. cerevisiae]), coding for an autophagy modulating protein that forms a complex with ATG12–ATG5 and is responsible for autophagosome formation [Citation42]. Mice expressing the same atg16l1 polymorphisms are associated with impaired activation of autophagy against intracellular bacteria and with an increase of IL1B secretion [Citation42].
The delay in assimilation competence can also explain the difference in autophagosomes detected under feeding in the skeletal muscle of 8- and 11-dpf epg5-/- mutants and confirmed by western blot analyses: at 8 dpf mutant larvae can still derive energy from the remaining yolk, whereas at 11 dpf the likely reduced energy from intestinal absorption in mutants needs to be integrated by activation of the autophagy process, thus resulting in the increased number of autophagosomes.
Further features of the Vici syndrome, such as pulmonary abnormalities associated with recurrent infections, are found in epg5 knockout mice, as well as in mice deficient for ATG14, RB1CC1, ATG5 or ATG7. The elevated inflammatory response, represented by an increase of neutrophils, eosinophils, activated alveolar macrophages as well as of pro-inflammatory cytokines expression seems to protect epg5 knockout mice from challenge with lethal influenza A virus [Citation43]. Interestingly, histological examination of our adult epg5-/- zebrafish mutants revealed areas with infiltration of eosinophilic granular cells, suggesting that, also in zebrafish, Epg5 ablation could interfere with the immune system.
In humans, EPG5 was initially named KIAA1632 and was identified among a group of genes that are mutated in breast cancer tissues [Citation6,Citation8], a finding shared with other genes involved in the autophagy machinery [Citation44]. Although the identification of a chordoma tumor in only one out of the 20 analyzed adult epg5-/- mutants is too limited to draw a clear correlation with cancer, this result is interesting. This tumor, normally associated with aged adult zebrafish, showed instead an early onset in this mutant. Noteworthy is also the finding that rapamycin, an inducer of autophagy, can delay chordoma formation in a zebrafish model for chordoma and improves survival of tumor-bearing fish [Citation28].
In conclusion, this zebrafish mutant model represents a new tool for dissecting, in an easy-to-use vertebrate model, Epg5 functions and its involvement in Vici syndrome. Moreover, the epg5-/- mutant zebrafish line provides a valuable model for the screening and selection of drugs acting as autophagy stimulators, without the need to block the autophagic flux, which is naturally interrupted in the mutant. This feature could be particularly useful not only when autophagy inhibitors or blockers are not compatible with the compounds under study, but also to reduce the number of variables to be analyzed.
Methods
Zebrafish maintenance and care
WT and epg5-/- mutant zebrafish were staged and maintained according to standard procedures [Citation45,Citation46]. Embryos were obtained by natural mating and raised at 28.5°C in Petri dishes containing fish water (50X: 25 g Instant Ocean (Acquarium systems, SS15-10), 39.25 g CaSO4 and 5 g NaHCO3 for 1 L) and kept in a 12:12 light:dark (LD) cycle. For screening and in vivo imaging, embryos and larvae were anesthetized with 0.04% tricaine (Sigma-Aldrich, E10521). Non-mutant embryos or larvae indicated as WT or epg5+/+ correspond to samples deriving from different or from the same egg batches of epg5-/-, respectively. During experiments with transgenic lines having a heat shock promoter, mutant transgenic larvae were collected and heat shocked by placing in 42°C fish water and then incubating for 60 min at 37°C. Fish were then placed back at 28.5°C and images were taken 12 h after the heat shock. All husbandry and experimental procedures complied with European Legislation for the Protection of Animals used for Scientific Purposes (Directive 2010/63/EU) and were previously authorized by the University of Padua, Body for the Protection of Animals (OPBA-Project Number 568/2016).
Sequencing of the zebrafish epg5 first exons
Based on predicted sequences available on EMBL, 2 reverse primers were designed to obtain the 5ʹ-UTR (epg5-R1 and epg5-R2; see Figure S1 for primer position). RNA ligase-mediated rapid amplification of cDNA 5ʹ-ends (RLM-5ʹ-RACE) was performed using the FirstChoice RLM-RACE kit (Ambion, AM1700M), following the manufacturer’s instructions. These analyses were accomplished using RNA extracted from 48-hpf embryos. The 363-nt sequence containing the first non-coding exon and 2 coding exons of the epg5 mRNA transcript (accession number MG775431) was cloned into Zero Blunt™ vector (invitrogen, K270020) for digoxigenin (DIG) probe preparation.
Generation of the epg5 mutant lines
epg5 mutant zebrafish were generated using the CRISPR-Cas9-mediated genome editing. Briefly, the e-crisp design software (available at: https://e-crisp.org) was used to design the gene-specific guide RNA (sgRNA) to target epg5 gene on exon 3 (AC MG775431). epg5 target sequence is reported in Figure S1. BLAST analysis of the target sequence revealed no specific binding with other genes. sgRNA was generated according to previously described methods [Citation47] and in vitro transcribed using MEGAshortscript T7 kit (Life Technologies, AM1354). Cas9 mRNA was transcribed from linearized pCS2-nls-zCas9-nls plasmid (Addgene, 47,929; deposited by Wenbiao Chen Lab) using mMessage Machine SP6 kit (Life Technologies, AM1340). Fertilized eggs were injected with 1 nl of a solution containing 400 ng/μl Cas9 mRNA and 50 ng/μl sgRNA. Genomic DNA was extracted from 5-dpf (days post-fertilization) larvae from individually injected eggs to verify the presence of mutations and confirm the activity of the guide RNA. Injected embryos were raised to adulthood and F0 founders selected by genotyping (see below). Embryos collected from the outcrosses between these F0 founders and WT were raised and genotyped to confirm germline transmission of the mutation (F1 generation). Heterozygous mutants were bred with WT and the resulting heterozygous (F2 generation) were selected and crossed, to obtain two lines of homozygous mutant embryos (F3 generation).
Genomic DNA extraction from embryos, larvae and fin clips
Genomic DNA was extracted from single larvae euthanized with a lethal dose of tricaine (MS222; Sigma-Aldrich, E10521) using the HotSHOT protocol [Citation48]. To extract DNA from fin clips, adult fish were anesthetized with tricaine and biopsies from the caudal fin were removed with a sharp blade. The specimens were then treated with the same protocol.
Genotyping of epg5 mutants
Mutations in F0 were detected using heteroduplex mobility assay (HMA). Genomic fragments at the target site were amplified by PCR with 5x HOT FIREPol® Blend Master Mix (Solis BioDyne, 04-25-00125) and the locus-specific primers (epg5-F1 and epg5-R1, listed in Table S1), that gave rise to a 265-bp fragment on WT samples. PCR conditions were as follows: 15 min at 95°C, 35 cycles at 95°C for 20 s, 60°C for 30 s and 72°C for 30 s. The resulting PCR amplicons were subjected to electrophoresis on a 15% polyacrylamide gel (Life Technologies, NP0323PK2). For verification, PCR products from fish harboring indel mutations were sequenced. Poly Peak Parser software (http://yosttools.genetics.utah.edu/PolyPeakParser/) was used for identification and sequence characterization of heterozygous mutant carriers generated by genome editing. The same primers used for F0 heteroduplex mobility assay (HMA) were utilized for screening of heterozygous and homozygous fish. PCR products were resolved with GelRed-stained 3% agarose low EEO gel (Fisher BioReagents, BP160-500) to identify epg5+/+, epg5+/- and epg5-/- samples.
Generation of mutant epg5 transgenic zebrafish lines
The epg5-/- mutant line was crossed with the following transgenic zebrafish lines: Tg(mnx1:GFP) (formerly hb9:GFP) [Citation27], Tg(h2afx:EGFP-Rab5c)mw5 and Tg(h2afx:EGFP-Rab7)mw7 [Citation49], Tg(hsp:Lamp1-RFP) and Tg(hsp:RFP-LC3), generated using the plasmids kindly provided by Prof. Michel Bagnat (Duke University Medical Center, Durham, NC, USA) [Citation50]. Each transgenic mutant line was analyzed alone or after the preparation of double transgenic mutant lines in order to study colocalization of fluorescence signals. Fluorescence analysis was performed on sibling larvae and was followed by genotyping.
RNA isolation and quantitative real time reverse transcription PCR (qRT-PCR)
For expression analysis, total RNA was extracted from pools of 15 embryos or larvae with TRIzol reagent (Thermo Fisher Scientific, 15,596,026). RNA samples were treated with DNaseI (Promega, M6101) to eliminate possible genomic DNA contaminations, and stored at −80°C until use. Total RNA was then used for cDNA synthesis with random primers (Promega, C1181) and M-MLV Reverse Transcriptase RNase H (Solis BioDyne, 06-21-010000) according to the manufacturer’s protocol. PCRs were performed with the kit HOT FIREPol EvaGreen (Solis BioDyne, 08-36-00001) in a Rotor Gene-Q Real-Time PCR thermal cycler (Qiagen). rplp0 (ribosomal protein, large, P0) was used as internal standard in each sample in order to standardize results by compensating variations in mRNA and cDNA quantity and quality. The annealing temperature for PCR ranged from 58 to 60°C, depending on the primer set. The cycling parameters were 95°C for 14 min, followed by 45 cycles at 95°C for 30 s, 30 s of annealing at the temperature selected for the pair of primers and 20 s of extension at 72°C. No amplification products were observed in negative controls and no primer-dimer formations in control templates. Data were analyzed using the Rotor Gene-Q software (Qiagen). All analyses were performed in triplicate. qPCR primers (epg5-F and epg5-R) were designed to span two introns. The identity of the amplified fragment was analyzed by sequencing. Primer sequences are reported in Table S1.
Protein extraction and western blotting
Pools of 8- or 11-dpf epg5-/- and WT larvae, kept in fed conditions or following 2-day starvation, were frozen in liquid nitrogen and mechanically homogenized in Tissue Extraction Reagent I (Invitrogen, FNN0071) added with protease inhibitors (Roche, COEDTAF-RO). Following a brief centrifugation, the supernatant was collected and the protein content was determined by BCA assay (Thermo-Fisher Scientific, 23,225). 30 μg of total proteins per sample were mixed with a reducing agent-containing loading buffer (Thermo-Fisher Scientific, NP0008), boiled and loaded onto 12% polyacrylamide precast gels (Thermo-Fisher Scientific, NP0341). Following SDS-PAGE, proteins were transferred onto a PVDF membrane (Thermo-Fisher Scientific, 88,520). This was subsequently saturated with 5% non-fat dry milk (Bio-Rad, 1,706,404) in 1X Tris-Buffered Saline (Thermo-Fisher Scientific, 28,358) added with 0.1% Tween20 detergent (Sigma-Aldrich, P9416) and hybridized with primary (anti-LC3 1:1000, Thermo-Fisher Scientific, PA1-16930; anti ACTB/β-actin 1:2000, Sigma-Aldrich, A5316) and secondary (HRP-conjugated goat anti-rabbit or anti-mouse IgG-Fc fragments; Bethyl Laboratories Inc., A120-111P and A90-131P). The signal was revealed with SuperSignal West Pico Chemiluminescent Substrate (Thermo-Fisher Scientific, 340,779).
Whole mount immunofluorescence
WT and epg5-/- 4- and 5-dpf larvae were fixed in 4% paraformaldehyde (Sigma, P6148) overnight at 4°C. Samples were subjected to indirect immunofluorescence analysis by exposure to the goat anti-zSox9b primary antibody (RayBiotech, ER14-1692) (1:50, overnight at 4°C) followed by anti-goat Alexa Fluor 488 secondary antibody (Abcam, ab150141) according to Dolez et al., 2011 [Citation51]. Images were taken using a Nikon C2 confocal microscope.
Morphological and histological analyses
epg5-/- and WT zebrafish were fixed for 24 h in Bouin’s solution at room temperature. Samples were dehydrated through a graded series of ethanol, infiltrated with xylene and embedded in Paraplast plus (Leica, 39,602,004). Samples were serially cut into 7–8 μm sections on an LKB microtome. After rehydration, the sections were stained with hematoxylin and eosin and mounted with Eukitt (BioOptica, 09–00100) for microscopy examination.
Electron microscopy
epg5-/- and WT larvae at 8- and 11-dpf and adults were fixed with Karnovsky fixative (2.5% glutaraldehyde and 2% paraformaldehyde in 0.1 M cacodylate buffer) for 3 h at 4°C, washed with 0.1 M cacodylate buffer, post-fixed with osmium tetroxide for 2 h and embedded in EMbed 812 (Electron Microscopy Sciences, 14,120). Ultrathin sections were stained with uranyl acetate and lead citrate and observed at a Philips EM400 operating at 100 kV.
Birefringence assay
Muscle birefringence was analyzed by placing anesthetized larvae mounted in 2% methyl-cellulose in H2O on a glass polarizing filter and covering them with a second polarizing filter on a Leica M165 FC microscope. Larvae were photographed with a Nikon DS-Fi2 digital camera in bright field. The top filter was twisted to see the light refracting through striated muscle. Pixel intensity in the trunk region was measured with ImageJ software. Values were normalized for sample area, as mutant and WT zebrafish were slightly different in size at the analyzed stages. Three independent clutches of 10 larvae per genotype and treatment were checked for their muscle birefringence. Data are represented as means ± SEM and statistical significance was determined by Student’s t-test.
Whole mount in situ hybridization (WMISH)
Zebrafish embryos and larvae were fixed overnight at 4°C in 4% paraformaldehyde in phosphate-buffered saline (Sigma, 79,382) at the developmental stages of interest. WMISH was performed as previously described [Citation52]. DIG-labelled epg5-riboprobe was synthesized by in vitro transcription of the 5ʹ-UTR fragment with Sp6 RNA polymerase (Roche, 10 810 274 001), following the manufacturer’s instructions, after plasmid linearization with Apa1 (New England BioLabs, RO114S). After staining, larvae were embedded in 4% low-melting agarose and sectioned with a vibratome (Leica, VT1000S).
Alcian blue staining
Larvae were fixed in 4% paraformaldehyde, rinsed in acidic ethanol and stained with alcian blue (Sigma, A5268), as previously described [Citation53]. Unbound stain was removed by repeated rinsing with acidic ethanol and 3 washes in 0.5% KOH, 3% H202 in H2O prior to whole-mount imaging. Alcian blue staining was quantified as the total integrated density after removing the background according to a defined threshold in the middle-intestine area (area and threshold were kept constant in all the samples) by using ImageJ. Dimensions of alcian spots were also measured using ImageJ and counted as mature cells if area > 19.6 µm2 (diameter 5 µm) and as immature if area < 19.6 µm2 [Citation24].
Fluorescent staining with acridine orange
For acridine orange fluorescent staining, live larvae were submerged in a solution containing a final concentration of 5 mg/ml of acridine orange (Sigma, A6014) in Fish Water and incubated at 28.5°C for 30 min in the dark. Larvae (6-dpf) were then washed several times in Fish Water and mounted in low-melting agarose for positioning and confocal microscope image acquisition. Quantification of apoptotic acridine orange-positive spots was performed with the 3D-object counter plug-in of ImageJ software, using the same intestinal area and a constant threshold for all samples.
Growth rate curve
epg5-/- and WT larvae (6-dpf) were placed into 2.5-L fish tanks. Eight random fish were photographed twice a week from 6 dpf to 2 months, by using a Leica 165 DM and the Nikon DS-FiS. This protocol was repeated in 2 independent experiments. Measures were obtained with ImageJ.
Imaging
For imaging, transgenic embryos and larvae were anesthetized with 0.04% tricaine, embedded in 0.8% low-melting agarose and placed on a depression slide. The Nikon C2 confocal system using the software NIS ELEMENTS was used to record images. WMISH-stained embryos and larvae were mounted in 87% glycerol in phosphate-buffered saline plus 0.1% Tween 20 (Sigma, P1379) or cleared and mounted in 2:1 benzyl benzoate:benzyl alcohol, observed under a Leica M165 FC microscope, and photographed with a Nikon DS-Fi2 digital camera. Histological samples were photographed on a Leica DMR using a Nikon DS-Fi2 digital camera. All images were analyzed with Fiji (ImageJ) software as described by Facchinello and colleagues [Citation54].
Statistical analysis
Statistical analysis was performed with Graph Pad Prism V6.0. Data are presented as the means ± SEM, except for the growth rate analysis. Comparison between WT and mutant fish lines was performed by Student’s t-test. The p-values are indicated with the following symbols: *, P < 0.05; **, P < 0.01; ***, P < 0.001; ****, P < 0.0001.
Supplemental Material
Download Zip (7.8 MB)Acknowledgments
The authors wish to acknowledge Prof. Michel Bagnat (Department of Cell Biology, Duke University Medical Center, Durham, NC) for providing hsp:Lc3-RFP and hsp:Lamp1-RFP plasmids, Prof. Marino Zerial (Max Planck Institute of Molecular Cell Biology and Genetics, Dresden, Germany) for providing Tg(h2afx:EGFP-Rab5c)mw5 and Tg(h2afx:EGFP-Rab7)mw7 zebrafish lines. Moreover, the authors wish to acknowledge Luigi Pivotti and Dr. Martina Milanetto for their valuable assistance in the fish facility and Dr. Kiriakidu Despina (IGM-CNR, Bologna) for help on electron microscopy sample preparation.
Disclosure statement
No potential conflict of interest was reported by the authors.
Supplementary material
Supplemental data for this article can be accessed here.
Additional information
Funding
Related Research Data
References
- Tian Y, Ren H, Zhao Y, et al. Four metazoan autophagy genes regulate cargo recognition, autophagosome formation and autolysosomal degradation. Autophagy. 2010 Oct;6(7):984–985. PubMed PMID: 20814246.
- Levine B, Klionsky DJ. Development by self-digestion: molecular mechanisms and biological functions of autophagy. Dev Cell. 2004 Apr;6(4):463–477. PubMed PMID: 15068787.
- Cecconi F, Levine B. The role of autophagy in mammalian development: cell makeover rather than cell death. Dev Cell. 2008 Sep;15(3):344–357. PubMed PMID: 18804433; PubMed Central PMCID: PMCPMC2688784.
- Tian Y, Li Z, Hu W, et al. C. elegans screen identifies autophagy genes specific to multicellular organisms. Cell. 2010 Jun 11;141(6):1042–1055. PubMed PMID: 20550938.
- Wang Z, Miao G, Xue X, et al. The Vici syndrome protein EPG5 is a Rab7 effector that determines the fusion specificity of autophagosomes with late endosomes/lysosomes. Mol Cell. 2016 Sep 1;63(5):781–795. PubMed PMID: 27588602.
- Sjoblom T, Jones S, Wood LD, et al. The consensus coding sequences of human breast and colorectal cancers. Science. 2006 Oct 13;314(5797):268–274. PubMed PMID: 16959974.
- Flicek P, Amode MR, Barrell D, et al. Ensembl 2014. Nucleic Acids Res. 2014 Jan;42(Database issue):D749–D755. PubMed PMID: 24316576; PubMed Central PMCID: PMCPMC3964975.
- Halama N, Grauling-Halama SA, Beder A, et al. Comparative integromics on the breast cancer-associated gene KIAA1632: clues to a cancer antigen domain. Int J Oncol. 2007 Jul;31(1):205–210. PubMed PMID: 17549423.
- Cullup T, Kho AL, Dionisi-Vici C, et al. Recessive mutations in EPG5 cause Vici syndrome, a multisystem disorder with defective autophagy. Nat Genet. 2013 Jan;45(1):83–87. PubMed PMID: 23222957; PubMed Central PMCID: PMCPMC4012842.
- Ebrahimi-Fakhari D, Saffari A, Wahlster L, et al. Congenital disorders of autophagy: an emerging novel class of inborn errors of neuro-metabolism. Brain. 2016 Feb;139(Pt 2):317–337. PubMed PMID: 26715604.
- Ehmke N, Parvaneh N, Krawitz P, et al. First description of a patient with Vici syndrome due to a mutation affecting the penultimate exon of EPG5 and review of the literature. Am J Med Genet A. 2014 Dec;164A(12):3170–3175. PubMed PMID: 25331754.
- Byrne S, Dionisi-Vici C, Smith L, et al. Vici syndrome: a review. Orphanet J Rare Dis. 2016 Feb 29;11:21. PubMed PMID: 26927810; PubMed Central PMCID: PMCPMC4772338.
- Kane MS, Vilboux T, Wolfe LA, et al. Aberrant splicing induced by the most common EPG5 mutation in an individual with Vici syndrome. Brain. 2016 Sep;139(9):e52. PubMed PMID: 27343256.
- Zhao H, Zhao YG, Wang X, et al. Mice deficient in Epg5 exhibit selective neuronal vulnerability to degeneration. J Cell Biol. 2013 Mar 18;200(6):731–741. PubMed PMID: 23479740; PubMed Central PMCID: PMCPMC3601354.
- Zhao YG, Zhao H, Sun H, et al. Role of Epg5 in selective neurodegeneration and Vici syndrome. Autophagy. 2013 Aug;9(8):1258–1262. PubMed PMID: 23674064; PubMed Central PMCID: PMCPMC3748201.
- Miao G, Zhao YG, Zhao H, et al. Mice deficient in the Vici syndrome gene Epg5 exhibit features of retinitis pigmentosa. Autophagy. 2016 Dec;12(12):2263–2270. PubMed PMID: 27715390; PubMed Central PMCID: PMCPMC5173265.
- Hori I, Otomo T, Nakashima M, et al. Defects in autophagosome-lysosome fusion underlie Vici syndrome, a neurodevelopmental disorder with multisystem involvement. Sci Rep. 2017 Jun 14;7(1):3552. PubMed PMID: 28615637; PubMed Central PMCID: PMCPMC5471274.
- Herpin A, Englberger E, Zehner M, et al. Defective autophagy through epg5 mutation results in failure to reduce germ plasm and mitochondria. FASEB J. 2015 Oct;29(10):4145–4161. PubMed PMID: 26183773; PubMed Central PMCID: PMCPMC4566938.
- Baker KE, Parker R. Nonsense-mediated mRNA decay: terminating erroneous gene expression. Curr Opin Cell Biol. 2004 Jun;16(3):293–299. PubMed PMID: 15145354.
- Liu H, Wong L. Data mining tools for biological sequences. J Bioinform Comput Biol. 2003 Apr;1(1):139–167. PubMed PMID: 15290785.
- Salamov AA, Nishikawa T, Swindells MB. Assessing protein coding region integrity in cDNA sequencing projects. Bioinformatics. 1998 Jun;14(5):384–390. PubMed PMID: 9682051.
- Bonaldo P, Sandri M. Cellular and molecular mechanisms of muscle atrophy. Dis Model Mech. 2013 Jan;6(1):25–39. PubMed PMID: 23268536; PubMed Central PMCID: PMCPMC3529336.
- Wallace KN, Akhter S, Smith EM, et al. Intestinal growth and differentiation in zebrafish. Mech Dev. 2005 Feb;122(2):157–173. PubMed PMID: 15652704.
- Chen YC, Lu YF, Li IC, et al. Zebrafish Agr2 is required for terminal differentiation of intestinal goblet cells. PLoS One. 2012;7(4):e34408. PubMed PMID: 22514630; PubMed Central PMCID: PMCPMC3326001.
- Aghaallaei N, Gruhl F, Schaefer CQ, et al. Identification, visualization and clonal analysis of intestinal stem cells in fish. Development. 2016 Oct 1;143(19):3470–3480. PubMed PMID: 27578784; PubMed Central PMCID: PMCPMC5087619.
- Cheesman SE, Neal JT, Mittge E, et al. Epithelial cell proliferation in the developing zebrafish intestine is regulated by the Wnt pathway and microbial signaling via Myd88. Proc Natl Acad Sci U S A. 2011 Mar 15;108 Suppl 1:4570–4577. PubMed PMID: 20921418; PubMed Central PMCID: PMCPMC3063593.
- Flanagan-Steet H, Fox MA, Meyer D, et al. Neuromuscular synapses can form in vivo by incorporation of initially aneural postsynaptic specializations. Development. 2005 Oct;132(20):4471–4481. PubMed PMID: 16162647.
- Burger A, Vasilyev A, Tomar R, et al. A zebrafish model of chordoma initiated by notochord-driven expression of HRASV12. Dis Model Mech. 2014 Jul;7(7):907–913. PubMed PMID: 24311731; PubMed Central PMCID: PMCPMC4073279.
- Cooper TK, Murray KN, Spagnoli S, et al. Primary intestinal and vertebral chordomas in laboratory zebrafish (Danio rerio). Vet Pathol. 2015 Mar;52(2):388–392. PubMed PMID: 24913269; PubMed Central PMCID: PMCPMC4261063.
- Avdesh A, Chen M, Martin-Iverson MT, et al. Regular care and maintenance of a zebrafish (Danio rerio) laboratory: an introduction. J Vis Exp. 2012 Nov 18;(69):e4196. DOI:10.3791/4196 PubMed PMID: 23183629; PubMed Central PMCID: PMCPMC3916945.
- Song ZH, Yu HY, Wang P, et al. Germ cell-specific Atg7 knockout results in primary ovarian insufficiency in female mice. Cell Death Dis. 2015 Jan 15;6:e1589. PubMed PMID: 25590799; PubMed Central PMCID: PMCPMC4669757.
- Wang H, Wan H, Li X, et al. Atg7 is required for acrosome biogenesis during spermatogenesis in mice. Cell Res. 2014 Jul;24(7):852–869. PubMed PMID: 24853953; PubMed Central PMCID: PMCPMC4085765.
- Salinas E, Rodriguez G, Quintanar JL. Immunocytochemical demonstration of SNAP-23 and syntaxin 4 in tilapia Oreochromis aureus eosinophilic granule cells/mast cells. J Appl Ichthyol. 2007 Apr;23(2):198–199. PubMed PMID: WOS:000245057400017; English.
- Reite OB, Evensen O. Inflammatory cells of teleostean fish: A review focusing on mast cells/eosinophilic granule cells and rodlet cells. Fish Shellfish Immunol. 2006 Feb;20(2):192–208. PubMed PMID: WOS:000232195700006; English.
- Waldrop MA, Gumienny F, Boue D, et al. Low-level expression of EPG5 leads to an attenuated Vici syndrome phenotype. Am J Med Genet A. 2018 May;176(5):1207–1211. PubMed PMID: 29681093.
- Rossi A, Kontarakis Z, Gerri C, et al. Genetic compensation induced by deleterious mutations but not gene knockdowns. Nature. 2015 Aug 13;524(7564):230–233. PubMed PMID: 26168398.
- China V, Holzman R. Hydrodynamic starvation in first-feeding larval fishes. Proc Natl Acad Sci U S A. 2014 Jun 3;111(22):8083–8088. PubMed PMID: 24843180; PubMed Central PMCID: PMCPMC4050599.
- Shimada S, Hirasawa K, Takeshita A, et al. Novel compound heterozygous EPG5 mutations consisted with a missense mutation and a microduplication in the exon 1 region identified in a Japanese patient with Vici syndrome. Am J Med Genet A. 2018 Aug 27;176:2803–2807. PubMed PMID: 30152144.
- Park SW, Zhen G, Verhaeghe C, et al. The protein disulfide isomerase AGR2 is essential for production of intestinal mucus. Proc Natl Acad Sci U S A. 2009 Apr 28;106(17):6950–6955. PubMed PMID: 19359471; PubMed Central PMCID: PMCPMC2678445.
- Van der Sluis M, De Koning BA, De Bruijn AC, et al. Muc2-deficient mice spontaneously develop colitis, indicating that MUC2 is critical for colonic protection. Gastroenterology. 2006 Jul;131(1):117–129. PubMed PMID: 16831596.
- Randall-Demllo S, Chieppa M, Eri R. Intestinal epithelium and autophagy: partners in gut homeostasis. Front Immunol. 2013 Sep 30;4:301. PubMed PMID: 24137160; PubMed Central PMCID: PMCPMC3786390.
- Lassen KG, Kuballa P, Conway KL, et al. Atg16L1 T300A variant decreases selective autophagy resulting in altered cytokine signaling and decreased antibacterial defense. Proc Natl Acad Sci U S A. 2014 May 27;111(21):7741–7746. PubMed PMID: 24821797; PubMed Central PMCID: PMCPMC4040621.
- Lu Q, Yokoyama CC, Williams JW, et al. Homeostatic Control of Innate Lung Inflammation by Vici Syndrome Gene Epg5 and Additional Autophagy Genes Promotes Influenza Pathogenesis. Cell Host Microbe. 2016 Jan 13;19(1):102–113. PubMed PMID: 26764600; PubMed Central PMCID: PMCPMC4714358.
- Levine B, Kroemer G. Autophagy in the pathogenesis of disease. Cell. 2008 Jan 11;132(1):27–42. PubMed PMID: 18191218; PubMed Central PMCID: PMCPMC2696814.
- Kimmel CB, Ballard WW, Kimmel SR, et al. Stages of embryonic development of the zebrafish. Dev Dyn. 1995 Jul;203(3):253–310. PubMed PMID: 8589427.
- Westerfield M. The Zebrafish book: a guide for the laboratory use of zebrafish (Brachydanio rerio). Eugene, OR: University of Oregon Press; 1993.
- Gagnon JA, Valen E, Thyme SB, et al. Efficient mutagenesis by Cas9 protein-mediated oligonucleotide insertion and large-scale assessment of single-guide RNAs. PLoS One. 2014;9(5):e98186. PubMed PMID: 24873830; PubMed Central PMCID: PMCPMC4038517.
- Meeker ND, Hutchinson SA, Ho L, et al. Method for isolation of PCR-ready genomic DNA from zebrafish tissues. Biotechniques. 2007 Nov;43(5):610, 612, 614. PubMed PMID: 18072590.
- Clark BS, Winter M, Cohen AR, et al. Generation of Rab-based transgenic lines for in vivo studies of endosome biology in zebrafish. Dev Dyn. 2011 Nov;240(11):2452–2465. PubMed PMID: 21976318; PubMed Central PMCID: PMCPMC3197968.
- Ellis K, Bagwell J, Bagnat M. Notochord vacuoles are lysosome-related organelles that function in axis and spine morphogenesis. J Cell Biol. 2013 Mar 4;200(5):667–679. PubMed PMID: 23460678; PubMed Central PMCID: PMCPMC3587825.
- Dolez M, Nicolas JF, Hirsinger E. Laminins, via heparan sulfate proteoglycans, participate in zebrafish myotome morphogenesis by modulating the pattern of Bmp responsiveness. Development. 2011 Jan;138(1):97–106. PubMed PMID: 21115608.
- Thisse C, Thisse B. High-resolution in situ hybridization to whole-mount zebrafish embryos. Nat Protoc. 2008;3(1):59–69. PubMed PMID: 18193022.
- Oehlers SH, Flores MV, Hall CJ, et al. Retinoic acid suppresses intestinal mucus production and exacerbates experimental enterocolitis. Dis Model Mech. 2012 Jul;5(4):457–467. PubMed PMID: 22563081; PubMed Central PMCID: PMCPMC3380709.
- Facchinello N, Schiavone M, Vettori A, et al. Monitoring Wnt Signaling in Zebrafish Using Fluorescent Biosensors. Methods Mol Biol. 2016;1481:81–94. PubMed PMID: 27590154.