
ABSTRACT
Aberrant CTNNB1 signaling is one of the fundamental processes in cancers, especially colorectal cancer (CRC). Here, we reported that TRAF6, an E3 ubiquitin ligase important for inflammatory signaling, inhibited epithelial-mesenchymal transition (EMT) and CRC metastasis through driving a selective autophagic CTNNB1 degradation machinery. Mechanistically, TRAF6 interacted with MAP1LC3B/LC3B through its LC3-interacting region ‘YxxL’ and catalyzed K63-linked polyubiquitination of LC3B. The K63-linked ubiquitination of LC3B promoted the formation of the LC3B-ATG7 complex and was critical to the subsequent recognition of CTNNB1 by LC3B for the selective autophagic degradation. However, TRAF6 was phosphorylated at Thr266 by GSK3B in most clinical CRC, which triggered K48-linked polyubiquitination and degradation of TRAF6 and thereby attenuated its inhibitory activity towards the autophagy-dependent CTNNB1 signaling. Clinically, decreased expression of TRAF6 was associated with elevated GSK3B protein levels and activity and reduced overall survival in CRC patients. Pharmacological inhibition of GSK3B activity stabilized the TRAF6 protein, promoted CTNNB1 degradation, and effectively suppressed EMT and CRC metastasis. Thus, targeting TRAF6 and its pathway may be meaningful for treating advanced CRC.
Abbreviations: AMBRA1: autophagy and beclin 1 regulator 1; AOM: azoxymethane; ATG5: autophagy related 5; ATG7: autophagy related 7; Baf A1: bafilomycin A1; BECN1: beclin 1; CoIP: co-immunoprecipitation; CQ: chloroquine; CRC: colorectal cancer; CTNNB1/β-catenin: catenin beta 1; DSS: dextran sodium sulfate; EMT: epithelial-mesenchymal transition; FBS: fetal bovine serum; GFP: green fluorescent protein; GSK3B/GSK3β: glycogen synthase kinase 3 beta; IgG: Immunoglobulin G; IHC: immunohistochemistry; LIR: LC3-interacting region; MAP1LC3B/LC3B: microtubule associated protein 1 light chain 3 beta; RFP: red fluorescent protein; RT: room temperature; shRNA: short hairpin RNA; siRNA: small interfering RNA; TRAF6: TNF receptor-associated factor 6; WT: wild-type; ZEB1: zinc finger E-box binding homeobox 1
Introduction
Colorectal cancer (CRC) is the one of the most commonly diagnosed types of cancer. Aberrant CTNNB1 signaling is a key pathway that is involved in the pathogenesis and progression of CRC [Citation1]. Deregulation of CTNNB1 signaling is mainly due to the biallelic inactivation of APC or by the activation of mutations of CTNNB1 [Citation2]. Recent genomic studies have shown that CRC can be divided into hypermutated and non-hypermutated subgroups. APC was frequently mutated in the non-hypermutated tumors (~81%), but it was less frequently mutated in the hypermutated tumors (~51%). However, CTNNB1 had a relatively lower mutation frequency in both non-hypermutated tumors and hypermutated tumors [Citation2]. These findings indicate that the oncogenic CTNNB1 activation in CRC, especially in hypermutated tumors, might be regulated by distinct mechanisms that are independent of APC.
TRAF6 (TNF receptor-associated factor 6), a member of the TRAF family, was first identified as a signal transducer for inflammatory signaling [Citation3,Citation4]. Recent interest has focused on its role in cancer. TRAF6 overexpression in some cancer types, such as lung cancer and pancreatic cancer, regulates tumorigenesis and angiogenesis [Citation5–Citation7], yet the roles and mechanism of TRAF6 in CRC metastasis remains unclear. Here, we reported that TRAF6 curbed the potential of CRC metastasis through regulation of the selective autophagic CTNNB1 degradation pathway.
Results
Reduced expression of TRAF6 promotes lung metastasis of CRC and causes tumor invasion in TRAF6+/- mice
We first stably knocked down TRAF6 gene by shRNA in SW480 cells, and the results showed that silencing TRAF6 enhanced the migratory and invasive property of CRC cells (Figure S1(a–e)). Consistently, the xenograft metastasis model showed that the depletion of TRAF6 promoted lung metastasis (Figure S1(f–h)). Traf6 homozygous mice (traf6−/-) appear normal at birth, but they fail to thrive normally and die prematurely [Citation8]. we thus used Traf6 heterozygous mice (Traf6+/-) and their wild-type littermates (Traf6+/+) to verify the role of TRAF6 in vivo. In the AOM/DSS-induced colon cancer model, we found that the Traf6+/- mice developed marked tumor invasion (). Reflecting this difference, the depth of tumor invasion was greatly increased in the Traf6+/- mice as compared to the Traf6+/+ mice. Tumors in the submucosa, muscularis propria, and even in serosa, a feature of malignancy, were frequently observed in the Traf6+/- mice (). Kaplan-Meier survival curve analysis showed that the Traf6+/- mice had significantly shorter life spans compared to the Traf6+/+ mice (). Together, these results indicate that TRAF6 inhibits invasion and metastasis of CRC.
Figure 1. Reduced expression of TRAF6 causes local tumor invasion phenotypes in Traf6+/- mice, and induces ZEB1 expression and EMT via CTNNB1. (a,b) Representative H&E sections of intestinal tumors (a) and histopathological scoring of the invasive depth of colorectal cancer glands (b) in Traf6+/+ (n = 9) and Traf6+/- (n = 9) mice. Dotted lines in a, muscularis mucosae. Asterisk in a, colorectal cancer glands invading the submucosa. Mu, intramucosal; sm, submucosa; mp, muscularis propria; and se, serosa. (c) Kaplan-Meier survival curve analysis of Traf6+/+ (n = 12) and Traf6+/- (n = 12) mice in the AOM/DSS-induced colon cancer model. (d,e) qPCR (d) and western blotting (e) analysis of the indicated gene or protein expression in HCT116 cells transfected with TRAF6 plasmid or vector (left) and SW480 cells stably expressing control or TRAF6-specific shRNA (right). (f) Western blotting of the indicated proteins in intestinal tumors in Traf6+/+ and Traf6+/- mice. (g) Chromatin immunoprecipitation assays of CTNNB1’s ability to bind the ZEB1 promoter in SW480 cells stably expressing control or TRAF6-specific shRNA. The amplified ZEB1 promoter region (−325 to −101) contains CTNNB1-TCF4 binding sites at −161. (h) Western blotting to detect the indicated proteins in SW480 cells with indicated treatments.(i) Immunofluorescence staining of CDH1 (green) or ZEB1 (red) in SW480 cells with indicated treatments. Nuclei were stained with DAPI (blue). (j,k) Representative lung picture tissues are shown by HE staining (j), and the area of metastatic nodules in individual mice was calculated using Dmetrix software (k). Arrows indicate metastatic nodules (n = 7 for each group).
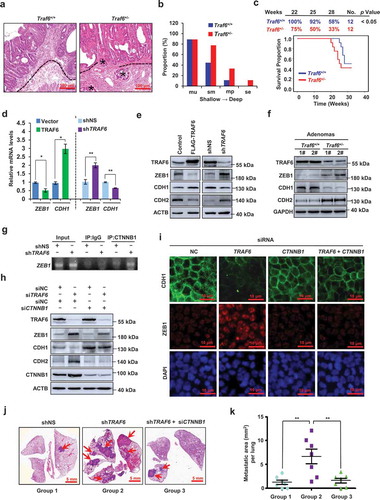
TRAF6 inhibits ZEB1 expression and EMT via CTNNB1
EMT is associated with enhanced cell migration and invasion [Citation9]. qPCR assays revealed that the overexpression of TRAF6 inhibited the mRNA expression of ZEB1, a known EMT inducer, and this was accompanied by a detectable increase in CDH1/E-cadherin expression. In contrast, silencing TRAF6 did the opposite (). Consistently, a strong negative correlation existed between TRAF6 and ZEB1 at the protein level (Figure S2(a,b)). As expected, the protein level of the epithelial marker CDH1 increased, while the mesenchymal marker CDH2/N-cadherin decreased, in TRAF6-overexpressed cells. Conversely, silencing TRAF6 did the opposite (). in vivo studies further confirmed that TRAF6 expression was negatively correlated with ZEB1 expression and EMT in the intestinal adenomas of the Traf6+/+ and Traf6+/- mice (). Together, these results indicate that TRAF6 suppresses EMT in CRC.
The CTNNB1-TCF4 complex induces ZEB1 expression by binding the ZEB1 promoter and activating its transcription [Citation10]. We found that the depletion of TRAF6 increased CTNNB1 occupancy on the ZEB1 promoter (). Silencing of TRAF6 induced ZEB1 and CDH2 increases, and CDH1 losses, which were markedly reversed by the depletion of CTNNB1 (). Furthermore, our results showed that silencing of TRAF6 increased cell migration, invasion (Figure. S3(a–d)) and metastasis (). However, the depletion of CTNNB1 reversed this effects.
TRAF6 suppresses CTNNB1 expression through an APC-independent pathway
The above findings indicated that TRAF6 inhibits EMT and metastasis via CTNNB1. Thus we asked whether TRAF6 has a causal role in regulating CTNNB1 expression. Although no interaction was observed between them (Figure S4(a,b)), strikingly, we found that TRAF6 overexpression led to a significant CTNNB1 reduction (). Inversely, the silencing of TRAF6 greatly increased the CTNNB1 expression ().
Figure 2. TRAF6 inhibits CTNNB1 signaling through APC-independent pathway. (a) Exogenous CTNNB1 protein levels were determined by western blotting in SW480 or HEK293T cells with increasing amounts of TRAF6. (b,c) Western blotting of endogenous CTNNB1 protein levels in HCT116 cells with increasing amounts of TRAF6 (B) and SW480 cells stably expressing control or TRAF6-specific shRNA (c). (d) Western blot showing the expression of CTNNB1S33Y in HCT116 or HEK293T cells co-expressing TRAF6 and CTNNB1S33Y. (e) Western blotting of endogenous CTNNB1 in RKO or HCT116 cells that transiently express control or APC-specific siRNA. (f) Western blotting of TRAF6 and CTNNB1 in the lysates from intestinal adenomas of Traf6+/+ and Traf6+/- mice. (g) Subcellular fractionation analysis of CTNNB1 expression in the lysates from intestinal adenomas of Traf6+/+ and Traf6+/- mice. Immunoblots of GAPDH and LMNB1 (lamin B1) served as controls for the purity of membranous and cytoplasmic (M + C) and nuclear (N) fractions, respectively. (h,i) Luciferase reporter assay for measuring TOP-Flash reporter activity in HCT116 cells co-expressing TRAF6 and CTNNB1 (h) or SW480 cells co-expressing TRAF6 and CTNNB1S33Y (i). (j,k) IHC analysis of TRAF6 and CTNNB1 in 78 cases of human CRC tissues. Representative images of IHC (j) and spearman correlation analysis between TRAF6 and CTNNB1 (k) are shown.
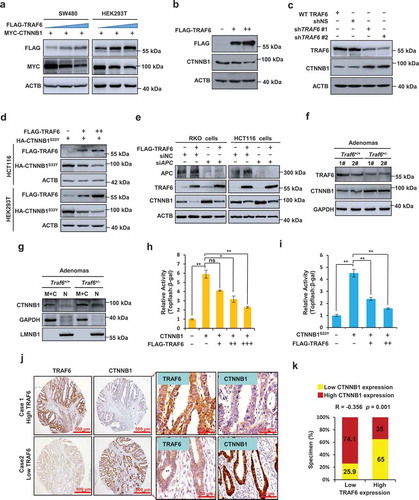
GSK3B phosphorylation of CTNNB1 at Serine 33 is critical for its proteasome degradation in an APC-dependent manner, and mutant CTNNB1S33Y is refractory to proteasomal degradation. Unexpectedly, the overexpression of TRAF6 also inhibited CTNNB1S33Y expression (). Furthermore, the knockdown of APC, in HCT116 and RKO cells that possess wild-type APC, did not affect the inhibitory effect of TRAF6 on CTNNB1 expression (), suggesting that the regulatory role of TRAF6 on CTNNB1 expression occurs through a distinct mechanism that is independent of APC.
In the AOM/DSS-induced colon cancer model, increased protein expression levels of CTNNB1 were found in intestinal adenomas of the Traf6+/- mice compared to that of the Traf6+/+ mice (), and the intestinal adenomas of the Traf6+/- mice showed a significant increase in the levels of nuclear CTNNB1 (). We next used the LEF1/TCF (lymphoid enhancer binding factor 1) reporter plasmid Topflash to determine whether TRAF6 affect the transcriptional activity of CTNNB1. The results showed that ectopic expression of TRAF6 led to a dramatic decrease of CTNNB1 or mutant CTNNB1S33Y-induced Topflash reporter activity (), indicating that TRAF6 negatively regulates the transcriptional activity of CTNNB1. Clinically, a significant negative correlation between TRAF6 and CTNNB1 was observed in human CRC tissues ().
Autophagy induction is required for TRAF6-mediated CTNNB1 degradation and EMT inhibition
Recent evidence revealed a critical role of autophagy in regulating protein turnover [Citation11–Citation14]. Strikingly, we found that the autophagy inhibitor chloroquine (CQ) restored CTNNB1 expression in the TRAF6-overexpressed CRC cells, but the proteasome inhibitor MG132 did not (). Consistently, inhibition of autophagy by silencing ATG5, a key autophagy gene, significantly impaired the inhibitory effect of TRAF6 on CTNNB1 expression (). These results indicated that CTNNB1 may be targeted for TRAF6-mediated autophagic degradation.
Figure 3. CTNNB1 is targeted for autolysosomal degradation. (a) Western blotting of lysates of HCT116 cells transfected with TRAF6 and treated with MG132 (10 μM) or CQ (10 mM) for 6 h before harvest. (b) Western blot showing CTNNB1 expression in HCT116 cells stably expressing control or ATG5-specific shRNA. (c,d) SW480 cells stably expressing control or TRAF6-specific shRNA were examined with autophagosomes by transmission electron microscopy (TEM) observation. Representative images (c) and statistical analysis of autophagosomes (d) are shown; red arrows indicate autophagosomes. (e) Representative images (left) and quantification (right) of LC3B puncta in HCT116 cells transfected with TRAF6 and treated with CQ (10 mM) for 4 h before harvest. (f) Western blot showing the indicated protein expression in HCT116 cells transfected with TRAF6 and treated with CQ (10 mM) for 4 h before harvest. (g,h) Western blot showing the indicated protein expression in HCT116 cells (g), or SW480 cells (h) during growth in normal medium (RPMI-1640) with or without FBS in the presence of CQ (10 mM) and Baf A1 (100 nM). (i) A representative western blotting of HCT116 cells following TRAF6 overexpression and ATG5 shRNA or ATG7 shRNA. (j,k) Representative lung picture tissues are shown by HE staining (j), and the area of metastatic nodules in individual mice was calculated by Dmetrix software (k). Red arrows indicate metastatic nodules (n = 7 for each group).
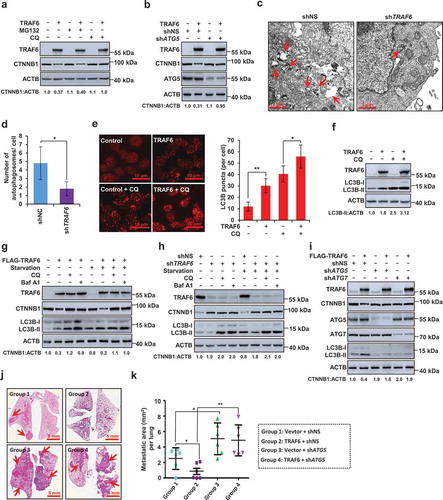
We next determined whether TRAF6 regulates autophagy in CRC. Transmission electron microscopy (TEM) [Citation15] revealed a decrease in the formation of autophagic vesicles in TRAF6-silencing CRC cells (). Overexpression of TRAF6 significantly increased LC3B puncta and the LC3B-II levels in the presence or absence of CQ, an inhibitor of lysosomal acidification and autophagosome degradation [Citation15] (). Consistently, we further transfected a tandem mRFP-EGFP-LC3B construct into HCT116 cells [Citation16,Citation17], and found that silencing of TRAF6 significantly impaired the autophagic flux (Figure S5(a,b)). Together, these results indicated that TRAF6 promoted autophagy induction in CRC.
We further observed that blockade of autophagy with lysosomal autophagy inhibitors CQ and Baf A1 attenuated the TRAF6-induced decrease in CTNNB1 protein expression under both basal conditions and serum starvation conditions (). Consistently, treatment with CQ or Baf A1 greatly increased CTNNB1 protein expression in CRC cells (), suggesting that autophagy induction by TRAF6 may be required for CTNNB1 degradation. Consistent with these results, we observed that the inhibition of autophagy by silencing of ATG5 or ATG7 inhibited the degradation of CTNNB1 that had been induced by TRAF6 (). We next determine whether autophagy could affect the transcriptional activity of CTNNB1. The results showed that knockdown of ATG7 greatly impaired the inhibitory effect of TRAF6 on TopFlash reporter activity (Figure S6(a)). Conversely, the induction of autophagy by PP242, an MTOR inhibitor, significantly inhibited the TopFlash reporter activity in the TRAF6-silenced SW480 cells (Figure S6(b)), indicating that autophagy negatively regulates CTNNB1 signaling activity.
Since our aforementioned results indicated that TRAF6 inhibits ZEB1 expression and EMT via CTNNB1, we next wondered whether TRAF6-induced autophagy is involved this process. Indeed, overexpression of TRAF6 significantly downregulated CTNNB1 expression and inhibited EMT. However, TRAF6-mediated this effect was curbed by silencing ATG7 (Figure S6(c)), suggesting that autophagy is involved in TRAF6-mediated EMT. In the xenograft metastasis model, we observed that TRAF6 significantly inhibited tumor metastasis to the lungs. However, ATG5 knockdown in TRAF6-overexpressed HCT116 cells greatly reversed this effect (), indicating that the induction of autophagy by TRAF6 is required for inhibiting lung metastasis of CRC.
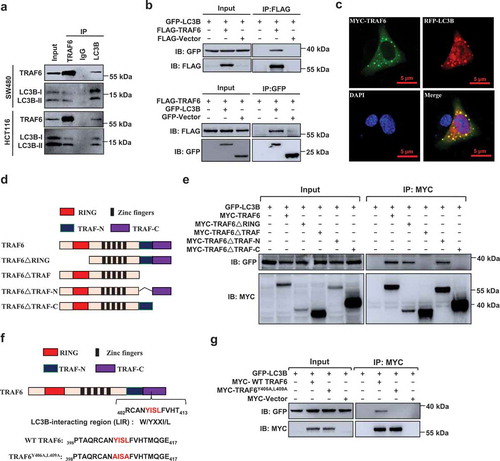
TRAF6 interacts with LC3B
Recent studies have shown that TRAF6 activates autophagy through interaction with AMBRA1 or BECN1 [Citation18,Citation19]. However, silencing of BECN1 or AMBRA1 did not affect the effect of TRAF6 on autophagy induction and CTNNB1 inhibition (Figure S7(a,b)), suggesting that TRAF6 regulates autophagy through an unknown mechanism in CRC. Interestingly, we found that TRAF6 was able to interact with both LC3B-I and LC3B-II in the CRC cells (). Similarly, exogenous TRAF6 and LC3B were immunoprecipitated from HEK293T cells (). Confocal microscopy revealed that punctate TRAF6 was distributed in the cytoplasm and co-localized extensively with LC3B (). Several TRAF6 deletion mutants were constructed (), and the CoIP assay showed that the TRAF-C domain of TRAF6 might be important for LC3B binding (). By performing a sequence alignment analysis, we found that the TRAF-C domain of TRAF6 carries a typical W/YxxI/L motif (also called the LC3-interacting region, LIR), 406YISL409. The W/YxxI/L motifs are commonly found in mitophagy receptors to mediate their interaction with LC3B for the recognition of autophagosomes [Citation20]. We further generated a mutant form of TRAF6 (TRAF6Y406A,L409A) with 2 C-terminal Tyr and Leu residues substituted with Ala (). The CoIP assay showed that the TRAF6Y406A,L409A lost the ability to interact with LC3B (), indicating that the LIR motif mediates TRAF6 interaction with LC3B.
Figure 4. TRAF6 interacts with LC3B. (a) SW480 or HCT116 cells were immunoprecipitated (IP) with IgG, TRAF6 or LC3B antibody, and the immunoprecipitates were analyzed by western blot. (b) Western blot analysis of lysates after immunoprecipitation from HEK293T cells transfected with FLAG-TRAF6 and GFP-LC3B. (c) Representative images showing colocalization of transfected FLAG-TRAF6 and RFP-LC3B in HCT116 cells, examined by confocal microscopy. (d) Schematic representation of TRAF6 and mutants. (e) Immunoprecipitation and immunoblot of cell lysates from HEK293T cells expressing GFP-LC3B and deletion mutants of TRAF6 with MYC-tag. (f) Schematic representation of the YISL motif in TRAF6. (g) Immunoprecipitation and immunoblot of cell lysates from HEK293T cells expressing GFP-LC3B and MYC-TRAF6 or MYC-TRAF6Y406A,L409A.
TRAF6 catalyzes K63-linked polyubiquitination of LC3B at lysine 51
Since TRAF6 serves as an E3 ubiquitin ligase by interacting with numerous proteins to regulate their degradation or signaling transduction [Citation21], we thus hypothesized that TRAF6 might regulate autophagy through ubiquitinating LC3B. Our results showed that the overexpression of TRAF6 induced LC3B ubiquitination (), and silencing TRAF6 greatly inhibited the ubiquitination of LC3B (). Interestingly, transfection of the Lys63-only ubiquitin mutant (UbK63R) failed to incur LC3B ubiquitination (), indicating a Lys63-linkage specific LC3B ubiquitination. LC3B carries 3 species-conserved lysine residues, Lys8, Lys49, and Lys51, so to identify which Lys residue is responsible for LC3B ubiquitination by TRAF6, we constructed several mutants, and found that LC3BK51R, a mutant with Lys51 replaced with Arg, was not able to be ubiquitinated by TRAF6 (), indicating a critical role of Lys51 in LC3B ubiquitination.
Figure 5. TRAF6 catalyzes K63-linked polyubiquitination of LC3B and promotes the formation of the LC3B-ATG7 and LC3B-CTNNB1 complexes. (a) HEK293T cells were transfected with the indicated plasmids for 24 h, the lysates were analyzed by immunoprecipitation with anti-GFP antibody, and the immunocomplexes were examined using western blot analysis. (b) Ubiquitination assays of exogenous LC3B in the lysates from TRAF6 shRNA transduced SW480 cells. (c) Ubiquitination assays of exogenous LC3B in the lysates from HEK293T cells transfected with HA-Ub or HA-UbK63R. (d) HEK293T cells were transfected with MYC-tagged wild-type LC3B or each of the LC3B mutants. The exogenous LC3B or each of the LC3B mutants was immunoprecipitated with anti-MYC antibody and analyzed with immunoblot for ubiquitination. (e,f) Interaction of endogenous ATG7 or CTNNB1 with MYC-LC3B in transfected HCT116 (e) or SW480 (f) cells by immunoprecipitation with anti-IgG or anti-MYC antibody followed by western blot with anti-ATG7 or anti-CTNNB1 antibody. (g) Interactions between LC3B and ATG7 or between LC3B and CTNNB1 were analyzed by immunoprecipitation in the intestinal adenomas of Traf6+/+ and Traf6+/- mice. (h) HCT116 cells were transfected with indicated plasmids for 24 h. Then the coimmunoprecipitation of endogenous ATG7 or CTNNB1 with MYC-LC3B were analyzed. (i) Schematic representation showing the proposed mechanism of TRAF6 in regulating selective autophagic CTNNB1 degradation.
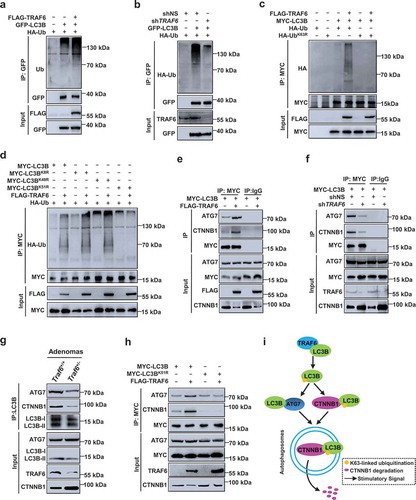
K63-linked polyubiquitination of LC3B catalyzed by TRAF6 promotes LC3B interactions with ATG7 and CTNNB1
LC3B lipidation and subsequent autophagosome biogenesis require LC3B to interact with ATG7 [Citation22]. The CoIP assays showed that the interaction between LC3B and ATG7 required TRAF6, as the event was enhanced by the overexpression of TRAF6 (), but it was suppressed by the depletion of TRAF6 (). Consistently, the interaction between LC3B and ATG7 was significantly more impaired in the intestinal adenomas from the Traf6+/- mice than in those of wild-type mice (). Furthermore, the LC3B ubiquitination-resistant mutant LC3BK51R diminished the TRAF6-induced association of LC3B with ATG7 (), indicating a role of LC3B ubiquitination by TRAF6 in the interaction between LC3B and ATG7.
Given the evidence that LC3B interacts with cargos targeted for selective protein degradation in autophagosomes [Citation23], we sought to determine whether LC3B associates with CTNNB1. CoIP assays revealed that endogenous CTNNB1 immunoprecipitated with MYC-LC3B and this was enhanced by overexpression of TRAF6 (), but it was impaired by silencing of TRAF6 (). Consistently, the interaction of LC3B with CTNNB1 was greatly impaired in the intestinal adenomas from the Traf6+/- mice than wild-type mice (). Importantly, we observed that overexpression of TRAF6 did not exert any significant effect on this interaction in cells expressing LC3B ubiquitination-resistant mutant (LC3BK51R) (), suggesting that the K63-linked ubiquitination of LC3B by TRAF6 was critical to the recognition of CTNNB1 by LC3B
Taken together, these data indicate that TRAF6 binds to LC3B and catalyzes K63-linked ubiquitination of LC3B, which promotes the interaction of LC3B with ATG7 to elicit autophagosome formation. However, the K63-linked ubiquitination of LC3B interacts with CTNNB1 and promotes selective autophagic degradation of CTNNB1 ().
The LIR motif in TRAF6 is required for autophagy activation, selective autophagic CTNNB1 degradation and EMT inhibition
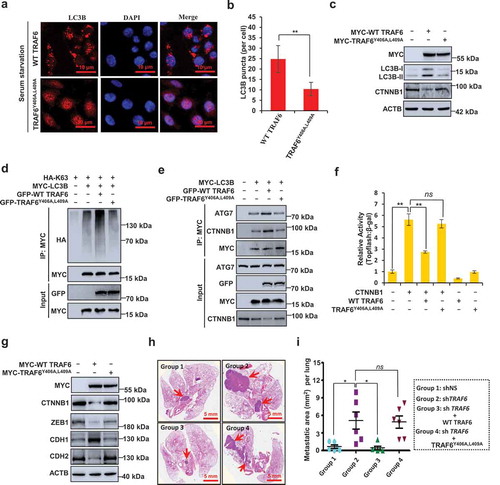
To confirm the significance of the the interaction between TRAF6 and LC3B, we first analyzed the effect of LIR domain mutant of TRAF6 (TRAF6Y406A,L409A) on autophagy induction. TRAF6Y406A,L409A induced fewer LC3B puncta than wild-type TRAF6 (WT TRAF6) (). Our results further showed that overexpression of WT TRAF6, but not TRAF6Y406A,L409A, significantly promoted CTNNB1 degradation and LC3B ubiquitination (). In addition, transfected WT TRAF6, but not TRAF6Y406A,L409A, potentiated LC3B binding to ATG7, and promoted the recognition of CTNNB1 by LC3B (). These results demonstrated that TRAF6 binding to LC3B is crucial for its induction of autophagy and selective autophagic CTNNB1 degradation. Thus, CTNNB1 signaling activity and EMT were greatly inhibited by WT TRAF6 compared with TRAF6Y406A,L409A () In the xenograft metastasis model, we found that re-expression of WT TRAF6 in TRAF6-depleted SW480 cells significantly impaired CRC metastasis but re-expression of TRAF6Y406A,L409A did not (), indicating that the TRAF6-LC3B interaction is critical to the inhibitory effect of TRAF6 on CRC metastasis.
Figure 6. LIR motif of TRAF6 is required for its regulations of selective autophagic CTNNB1 degradation, EMT inhibition, and CRC metastasis. (a,b) Representative images (a) and quantification (b) of LC3B puncta in HCT116 cells stably transfected with MYC-TRAF6 or MYC-TRAF6Y406A,L409A during growth in normal medium without FBS. (c) Immunoblot detection of the indicated protein in HCT116 cells transfected with MYC-TRAF6 or MYC-TRAF6Y406A,L409A plasmid. (d) Mutation of the YISL motif in TRAF6 reduces K63-linked polyubiquitination of LC3B. Immunoprecipitation, and immunoblot of cell lysates from HEK293T cells expressing the indicated plasmids. (e) HCT116 cells were transfected with the indicated plasmids for 24 h, then the coimmunoprecipitation of endogenous ATG7 or CTNNB1 with MYC-LC3B were analyzed. (f) Luciferase reporter assay for measuring TOP-Flash reporter activity in HEK293T cells co-expressing TRAF6 or TRAF6Y406A,L409A and CTNNB1. (g) HCT116 cells were transfected with MYC-TRAF6 or MYC-TRAF6Y406A,L409A plasmid for 24 h, and the lysates were analyzed with the indicated antibodies. (h,i) Representative lung picture tissues are shown by HE staining (h), and the area of metastatic nodules in individual mice was calculated by Dmetrix software (i). Arrows indicate metastatic nodules (n = 6 for each group).
TRAF6 is downregulated in human CRC and negatively correlates with GSK3B expression and activity
To determine the clinical relevance of TRAF6 in CRC development, we analyzed the surgical specimens of CRC and found that the TRAF6 expression levels were substantially downregulated in the primary CRC tumors (Figure S8(a–c)), and that the expression of TRAF6 was further reduced in those with lymph node metastasis (Figure S8(d,e)). Person χ2 test analysis revealed a strong association between TNM (tumor, lymph nodes, distant metastasis) stage, LNM (lymph node metastasis), and reduced TRAF6 expression (Table S1).
Surprisingly, we found that the decreased expression of TRAF6 was concomitant with the increased expression of GSK3B, elevated phosphorylation of GSK3B at Tyr216 (p-GSK3B (Tyr216), the active form of GSK3B), and reduced phosphorylation of GSK3B at Ser9 (p-GSK3B (Ser9), inactive form of GSK3B) (). Immunohistochemistry (IHC) staining further revealed a significant negative correlation between TRAF6 expression and p-GSK3B (Tyr216) (). Kaplan-Meier survival analysis showed that the CRC patients with higher p-GSK3B (Tyr216) expression had poorer prognoses than those with lower p-GSK3B (Tyr216) expression (). Consistently, the survival time of the CRC patients with lower TRAF6 expression was significantly shorter than those with higher TRAF6 expression ().
Figure 7. GSK3B activity correlates with TRAF6 expression in human CRC and is indicative of patient survival. (a) Western blot of the indicated protein in human CRC tissue. 6 randomly selected pairs of CRC tumors (T) and matched surrounding tissues (S) are presented. (b) Comparison of p-GSK3B (Tyr216) and TRAF6 expression in CRC tissues and paired adjacent normal tissues (n = 37). Statistical significance was determined using Student’s t tests. (c,d) IHC staining of p-GSK3B (Tyr216) and TRAF6 in 90 cases of human CRC tissues. Representative images of IHC staining (c) and Spearman correlation analysis (d) were shown. (e,f) Kaplan–Meier plot of overall survival of CRC patients with low (n = 37) and high (n = 53) p-GSK3B (Tyr216) expression (e) or low (n = 45) and high (n = 45) TRAF6 expression (f). (g) Immunoblot analysis of lysates of DLD-1 or RKO cells transfected with wild-type GSK3B or its kinase activation mutant (GSK3BS9A). (h) Immunoblot of TRAF6 levels in HCT116 and SW480 cells that transiently express control or GSK3B-specific siRNA. (i) Western blot analysis of endogenous TRAF6 in GSK3B overexpressed RKO cells treated with or without MG132 (20 μM). (j) The effect of overexpressing or silencing GSK3B on the half-life of TRAF6 was analyzed in HCT116 cells treated with cyclohexamide (CHX). The protein half-life curves are obtained by quantifying 3 independent experiments with western blot analysis.
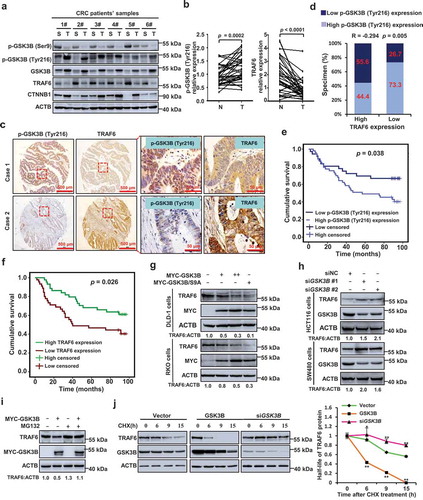
We next determined whether GSK3B contributes to the regulation of TRAF6 expression. Our results showed that the expression of TRAF6 was efficiently impaired by GSK3B or its activation mutant GSK3BS9A (). The inhibition of GSK3B expression significantly enhanced TRAF6 expression (). Interestingly, GSK3B-induced TRAF6 protein reduction was greatly reversed when CRC cells were treated with MG132, an inhibitor of proteasome pathway (), indicating that GSK3B negatively regulates TRAF6 expression at the protein level. Therefore, overexpression of GSK3B decreased the half-life of TRAF6, and downregulation of GSK3B expression prolonged it ().
GSK3B interacts with and phosphorylates TRAF6 at Thr266, which promotes K48-linked ubiquitination of TRAF6
We next sought to determine the mechanism by which GSK3B inhibits TRAF6 expression. The CoIP assays showed a strong interaction between GSK3B and TRAF6 (). Furthermore, we found that TRAF6 might interact with GSK3B through the TRAF-N region (Figure S9). Given our above finding that the kinase-active mutant form of GSK3B (GSK3BS9A) strongly decreased TRAF6 protein levels, we speculated that GSK3B might regulate TRAF6 protein expression via its phosphorylation. When a minimal amount of GSK3B was transfected into HCT116 cells, we detected a significant threonine phosphorylation level of TRAF6 (). Treatment with LiCl, an inhibitor of GSK3B, substantially impaired this GSK3B-induced phosphorylation. Consistently, the phosphorylation of TRAF6 was efficiently enhanced by GSK3B’s activation mutant (GSK3BS9A), but not its kinase-dead mutant (GSK3B/KM) (). We next performed mass spectrometry (MS) and identified potential phosphorylation sites of TRAF6 in the presence or absence of GSK3B. A total of 2 phosphorylation sites, Thr266 and Tyr473, were identified () and Table S2). We subsequently constructed the TRAF6 point mutants and found that GSK3B did not lead to a significant downregulation of TRAF6T266A (with the substitution of alanine for threonine at position 266) (), suggesting that Thr266 was the most important phosphorylation residue for its regulation by GSK3B. Sequence comparison revealed that Thr266 is a conserved phosphorylation motif in TRAF6 orthologs ().
Figure 8. GSK3B interacts with TRAF6, phosphorylates TRAF6 at threonine 266, and promotes TRAF6 ubiquitination. (a) SW480 cells were immunoprecipitated (IP) with IgG and TRAF6 antibody, and the immunoprecipitates were examined by western blot analysis. (b,c) Exogenous interaction between TRAF6 and GSK3B were analyzed by immunoprecipitation in HEK293T cells transfected with GFP-TRAF6 and FLAG-GSK3B. nsb, non-specific band. (d) GSK3B phosphorylates TRAF6 at Thr and Ser residues. HCT116 cells transfected with the indicated plasmids were treated with or without LiCl (30 mM) for 3 h. (e) Mass-spectrometry analysis of an GSK3B-phosphorylated TRAF6 at Thr266 peptide. (f) Immunoblot analysis of lysates of HEK293T cells transfected to express the indicated plasmids. (g) Sequence alignment of GSK3B-mediated phosphorylation sites in TRAF6 orthologues of different species. (h) Ubiquitination assays of exogenous TRAF6 in the lysates from HEK293T cells transfected with indicated plasmids. The cells were treated MG132 (20 μM) before harvesting and immunoprecipitation with the indicated antibodies. (i) HEK293T cells were transfected with the indicated plasmids for 24 h, and then treated with MG132 (20 μM) before harvesting. The lysates were analyzed by immunoprecipitation with anti-MYC antibody, and the immunocomplexes were examined by western blot analysis. (j) Ubiquitination assays of WT TRAF6 and its mutant TRAF6T266A in the lysates from HEK293T cells with indicated treatments. The cells were treated with MG132 (20 μM) before harvesting and then immunoprecipitation with anti-MYC antibody. (k) Western blotting of the indicated protein in HT-29 cells transfected with the indicated plasmids for 24 h.
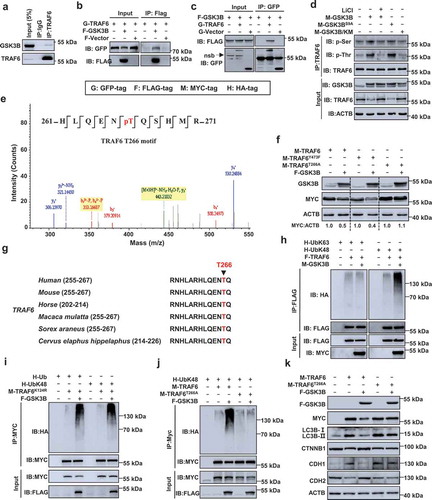
We further investigated whether GSK3B regulates TRAF6 ubiquitination. The results showed that the overexpression of GSK3B led to a significant increase in the level of K48-linked polyubiquitination of TRAF6, while the K63-linked polyubiquitination of TRAF6 did not have an obvious effect (). The lysine 124 residue of TRAF6 is critical for ubiquitin acceptance, and the mutant with Lys124 replaced with Arg (TRAF6K124R) is refractory to the assembly of K63-linked polyubiquitin chains [Citation24]. We found that GSK3B increased the level of total ubiquitination and K48-linked ubiquitination of TRAF6K124R (), suggesting that GSK3B inhibits TRAF6 protein expression by promoting the K48-linked polyubiquitination of TRAF6. In addition, GSK3B significantly enhanced WT TRAF6, but not TRAF6T266A, with K48-linked ubiquitination (), indicating an important role of TRAF6 phosphorylation at Thr266 by GSK3B in TRAF6 ubiquitination.
Our results further showed that overexpression of TRAF6 significantly induced autophagy activation and CTNNB1 degradation and inhibited EMT. These effects were markedly reversed by GSK3B overexpression. However, GSK3B overexpression did not exert any marked effect on TRAF6T266A-induced autophagy activation, CTNNB1 degradation, or EMT inhibition ().
Inhibition of GSK3B activity serves as the therapeutic potential of CRC through modulation of TRAF6/autophagy/CTNNB1 axis
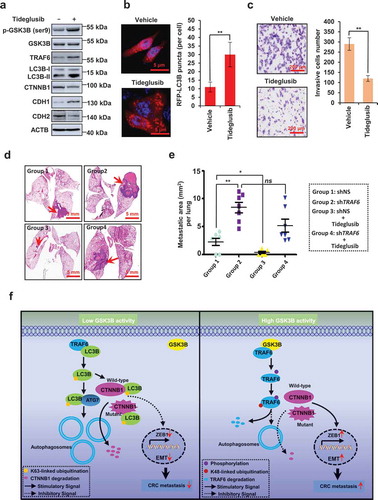
We then assessed the effect of tideglusib, an irreversible and non-adenosine triphosphate (ATP)-competitive GSK3B inhibitor, on CRC cells. Tideglusib treatment increased the level of p-GSK3B (Ser9) (). Notably, tideglusib treatment stabilized the TRAF6 expression. Furthermore, we found that tideglusib treatment activated autophagy, decreased the levels of CTNNB1, and inhibited EMT (). Consistently, tideglusib significantly repressed the ability of CRC invasion (), and reduced tumor metastasis to the lungs (), However, tideglusib had little effect on tumor metastasis in the TRAF6-silencing group (), indicating a critical role of TRAF6 in the antimetastatic effect of tideglusib.
Figure 9. Pharmacological inhibition of GSK3B activity effectively inhibits EMT and CRC metastasis. (a) Immunoblot of the indicated protein in HT-29 cells treated with tideglusib (0.1 μM) for 5 h. (b) Representative images (left) and quantification (right) of RFP-LC3B puncta in HCT116 cells treated with tideglusib (0.1 μM) for 5 h. (c) Invasion assays were performed in HCT116 cells treated with vehicle or tideglusib (0.1 μM) for 24 h. Representative photographs are presented (left) and the relative number of invasive cells (right) were counted. (d,e) Representative lung picture tissues are shown by HE staining (d), and the area of metastatic nodules in individual mice was calculated by Dmetrix software (e). Red arrows indicate metastatic nodules (n = 7 for each group). (f) Schematic representation showing the proposed mechanism of TRAF6 in regulating CRC metastasis.
Discussion
CTNNB1 signaling is involved in many physiological and pathological processes. Here, we report that TRAF6 drives a selective autophagic CTNNB1 degradation machinery to inhibit CRC metastasis. Our results suggest a new approach for improving CRC treatment strategies by targeting TRAF6. The majority of CRC had a mutated APC gene [Citation2], leading to increased CTNNB1 nuclear accumulation that contributes to the malignant phenotype of CRC cells. Thus, targeting the GSK3B- and APC-dependent CTNNB1 degradation pathway for treatment of those types of CRC seems to be inefficient. Our current studies showed that TRAF6 induced CTNNB1 degradation in both wild-type APC and APC mutant CRC cells, suggesting that the novel CTNNB1 degradation mechanism regulated by TRAF6 functions in those CRC patients with APC gene mutation, and this mechanism could also be coordinated with GSK3B- and APC-dependent CTNNB1 degradation mechanism to regulate CTNNB1 levels in those CRC patients with APC gene non-mutation.
Autophagy plays a dual role in cancer. It provides nutrients to tumor cells, and thereby promotes cancer development [Citation25]. It also functions as a tumor suppressor. Heterozygous disruption of Becn1, a gene required for the initiation of autophagy, results in increased spontaneous tumorigenesis [Citation26], and the decreased expression of BECN1 has been observed in human breast carcinoma [Citation27]. Hypoxia-regulated autophagy in breast cancer inhibits pulmonary metastasis [Citation28]. Here, we reported that autophagy activation by TRAF6 in CRC contributed to the inhibition of CRC cell invasion and metastasis, supporting an inhibitory effect of autophagy on tumor metastasis.
Recent studies have shown the role of TRAF6 in autophagy. During inflammatory responses, TRAF6 promotes autophagy by interacting with BECN1 and subsequently triggering the K63-linked ubiquitination of BECN1 [Citation19]. TRAF6 interacts with autophagy protein AMBRA1 and activates autophagy in cervical cancer cells [Citation18]. Interestingly, silencing of AMBRA1 or BECN1 in colon cancer cells did not affect the effect of TRAF6 on autophagy induction, suggesting that TRAF6 regulates autophagy in colorectal cancer through a distinct mechanism that is independent of BECN1 or AMBRA1. We here for the first time revealed that TRAF6 binded to and catalyzed LC3B with K63-linked polyubiquitination, which facilitated formation of the LC3B-ATG7 complex and promoted the recognition of CTNNB1 by LC3B for the selective autophagic degradation. In this way, these data indicate that the underlying mechanism by which TRAF6 regulates autophagy differ in different cell types and cell-specific context.
Our results showed that TRAF6 controled CTNNB1 levels by activating autophagy-dependent CTNNB1 degradation machinery to prevent primary tumor cells from metastasizing. However, in some CRC patients, especially in those CRC patients with lymph node metastasis, the amount of the TRAF6 protein was often downregulated, resulting in the inability to inhibit CTNNB1 signaling. Here, we identified TRAF6 as a novel substrate of GSK3B. GSK3B interacted with TRAF6 and phosphorylated TRAF6 at Thr266, which promoted TRAF6 ubiquitination and proteasome degradation and subsequently inhibited the selective autophagic CTNNB1 degradation. Thus, our study partially addresses the doubts about why elevated GSK3B expression and activity are often concomitant with increased CTNNB1 expression and signaling in the majority of CRC patients [Citation29].
Our results showed that pharmacological inhibition of GSK3B activity by tideglusib stabilized the TRAF6 protein, enhanced autophagy-dependent CTNNB1 degradation, and efficiently suppressed EMT and CRC metastasis. Based on these findings, restoring the TRAF6 expression by inhibiting GSK3B expression or activity, or targeting its pathway may provide new entry points for improving CRC therapy.
Materials and methods
Mice
Wild-type and Traf6± mice were obtained from the Wellcome Trust Sanger Institute. Nude mice (BALB/c, 16–18 g, 4–5-weeks old, male) were purchased from Shanghai SLRC Laboratory Animal Co., Ltd. All mice were housed in a pathogen-free facility under a 12 h light-dark cycle with free access to food and water. These mouse experiments were approved by the Animal Care and Use Committee of Sun Yat-sen University.
Cell lines and cell culture
The HCT116 cells (TCHu99), SW480 cells (TCHu172), HT-29 cells (TCHu103), DLD-1 cells (TCHu134), RKO cells (TCHu116) were purchased from Cell Bank of the Chinese Academy of Sciences, and HEK293T cells (CRL-3216) were purchased from ATCC. These cells were cultured as recently described [Citation30,Citation31].
Human CRC samples
Human CRC samples for western blot analysis were obtained from First Affiliated Hospital of Soochow University (Suzhou, Jiangsu, China). The correlations among TRAF6, CTNNB1 and p-GSK3B (Tyr216) expression were measured using immunohistochemistry in the human CRC tissue microarray from Shanghai Outdo Biotech (Shanghai, China). The study was approved by Sun Yat-sen University Biomedical Research Ethics Committee.
AOM/DSS-induced colon cancer model
Wild-type and Traf6+/- mice were injected intraperitoneally with 10 mg/kg AOM (Sigma-Aldrich, A5486) at 2 months of age. At the same time, the animals were started on the first of 3 cycles of 1% dextran sodium sulfate (Sigma-Aldrich, 42867) in their drinking water. Each cycle was 7 days long, each separated by a 14-day recovery period. The mice were killed at the indicated time, and colon tissues were harvested for tumor evaluation and standard histopathological studies.
In vivo xenograft mouse study
Nude mice were injected with 1 × 10⁶ colon cancer cells into the lateral vein in the nude mouse tail. The mice were sacrificed after 30 days. Lung tissues were collected for metastatic foci evaluation and standard histopathological study. For the tideglusib (Selleckchem, S2823) treatment, the same number of colon cancer cells was injected into the tail veins of nude mice. Tideglusib (25 mg/kg, once every 3 days) was initiated on the same day. The mice were sacrificed after 30 days. Lung tissues were collected for metastatic foci evaluation and standard histopathological study.
Plasmid constructs
Plasmid FLAG-TRAF6 was kindly provided by Dr. Ashley Mansell (Monash Institute of Medical Research, Melbourne, Australia). Plasmids GFP-LC3B, RFP-LC3B, HA-Ub, HA-UbK63R, HA-UbK48, FLAG-GSK3β were kindly provided by Dr. Xiao-Kun Zhang (Xiamen University, Xiamen, China). MYC-TRAF6/∆TRAF-N, MYC-TRAF6/∆TRAF-C, MYC-TRAF6/△TRAF, MYC-TRAF6/△RING, MYC-TRAF6Y406A,L409A, MYC-TRAF6T266A, MYC-GSK3B, MYC-GSK3BS9A, MYC-GSK3B/KM, MYC-LC3B, MYC-LC3BK8R, MYC-LC3BK49R and MYC-LC3BK51R were constructed using PCR or the QuikChange site-directed mutagenesis kit (Stratagene, 200518).
Generation of stable cell lines
SW480 cells stably expressing control or TRAF6-specific shRNA (GeneChem, Shanghai, China). SW480 cells were transduced with serial dilutions of lentiviral supernatant, and 36 h later, cells were selected using 5 μg/ml puromycin for 3–4 weeks. Protein expression was visualized by western blotting. The human TRAF6 shRNA target sequences as follows: TRAF6 shRNA #1: 5ʹ-CAC GGG AAA TAT GTA ATA T-3ʹ; TRAF6 shRNA #2: 5ʹ-TGG ATT CTA CAC TGG CAA A-3ʹ.
H&E staining
Tissues were fixed in 10% neutral-buffered formalin and embedded in paraffin. Sections of tissue 5 μm in thickness were affixed to slides, and then stained with hematoxylin and eosin according to standard histological procedures.
Immunohistochemistry
The tissue specimens were fixed in 10% formalin, embedded in paraffin, and sectioned. After dewaxing and rehydration, the specimens were incubated in citrate buffer at 100°C for 10 min for antigen retrieval and incubated blocking buffer (5% normal goat serum in PBS) for 1 h at room temperature (RT). Then, tissue sections were incubated overnight at 4°C with the primary antibodies including anti-TRAF6 (Abcam, ab33915), anti-CTNNB1 (Cell Signaling Technology, 8480) and anti-GSK3B (Tyr216; BD Pharmingen, 3040573). After 3 washes, tissue sections were incubated with biotinylated secondary antibody reagents for 20 min at RT. DAB solutions (ZSGB-BIO, Beijing, China) was added after 3 washes with PBS. Then, the slides were counterstained with haematoxylin.
Immunoprecipitation and western blotting
For cell lysis, cells were lysed in a buffer containing 2 mM Tris-HCl, pH7.4, 10 mM EDTA, 100 mM NaCl and 1% IGEPAL (Sigma-Aldrich, I3021). For colon tissue lysis, the full thickness colon tissue was homogenized in 1 mL cell lysis buffer containing protease inhibitor cocktails (Roche, 05056489001). The homogenate was incubated on ice for 30 min and finally the samples were centrifuged at 13,000 x g for 20 min at 4°C. Total cell or tissues lysates were subjected to immunoprecipitation with the indicated antibodies in protein A/G beads (Santa Cruz Biotechnology, sc-2003). Protein expression was detected by primary and secondary antibodies. The signals were finally detected using ECL system (Bioshine, ChemiQ 4800 mini)
Each western blot for the indicated protein detection contained a standard curve, using the CRC cells sample for all blots, of from 20 to 100 μg protein per lane. An amount of protein that was within the linear range was selected and immunoblotted with the indicated antibodies. The immunoreactive bands were quantified via densitometry, and the mean ratios of the indicated protein from 3 independent experiments are shown at the bottom of the figure.
Cell fraction
Membrane and cytoplasm lysis buffer (10 mM HEPES, pH 7.9, 1.5 mM MgCl2, 10 mM KCl, 0.5 mM DTT) was applied to lyse cells with a cocktail of proteinase inhibitors on ice for 10 min. The membranous and cytoplasmic fraction was obtained by collecting supernatant after centrifugation at 6,000 x g for 30 s. The resulting pellets containing nuclei were resuspended in the nuclear fraction buffer (20 mM HEPES, pH 7.9, 25% glycerol, 420 mM NaCl, 1.5 mM MgCl2, 0.2 mM EDTA, 0.5 mM DTT), with a cocktail of proteinase inhibitors on ice for 30 min. The supernatant was collected by centrifugation at 12,000 x g at 4°C for 15 min.
Chromatin immunoprecipitation (Chip)
The Chip experiment was performed using SimpleChIP plus Enzymatic Chromatin IP kit (Cell Signaling Technology, 9005). Briefly, cells were crosslinked with 37% formaldehyde and quenched with glycine. Cross-linked chromatin was digested by micrococcal nuclease and subjected to immunoprecipitation with specific antibody against MYC-tag (Santa Cruz Biotechnology, sc-40). The protein/DNA complexes were precipitated with protein A beads and digested with proteinase K to remove proteins. The specific DNA fragments were subjected to PCR amplification using the following primers:. ZEB1 promoter forward primer: 5ʹ-TTT ACC TTT CCA ACT CCG ACA GC-3ʹ; ZEB1 promoter reverse primer: 5ʹ-GGC TTT ACG ACA TCA CCT TCC TTA C-3ʹ.
qPCR analysis
Total RNA was extracted from cells using Trizol according to the manufacturer’s instructons (Qiagen, 79306). First-strand cDNA was generated with RevertAid™ First Strand cDNA Synthesis Kits (Qiagen, 205313). qPCR was carried out according to the manufacturer’s instructions (Roche Applied Science, 04673484001). Primers with the following sequences were used: ZEB1, forward 5ʹ-CGA GTC AGA TGC AGA AAA TGA GCA A-3ʹ and reverse 5ʹ-ACC CAG ACT GCG TCA CAT GTC TT-3ʹ; CDH1, forward 5ʹ-GCC CCA TCA GGC CTC CGT TT-3ʹ and reverse 5ʹ-ACC TTG CCT TCT TTG TCT TTG TTG GA-3ʹ.
Luciferease report assay
HCT116 and SW480 cells were transfected with a Topflash luciferase reporter, β-gal and other required expression plasmids. 24 h after transfection, the cells were lysed and reporter activity was analyzed with the luciferase reporter assay system (Promega, E1910). Luciferase activity was normalized for transfection efficiency using the corresponding β-gal activity.
Confocal microscopy
Cells grown on cover slips in a 24-well plate were washed twice with cold PBS, and then fixed with 4% paraformaldehyde for 15 min at RT. Then, the cells were permeabilized with 0.1% Triton X-100 for 5 min on ice, and stained with the indicated antibodies. Nuclei were visualized with DAPI. The images were taken with laser scanning confocal microscopy (Olympus, FV1000).
Transwell migration and matrigel invasion assays
For the transwell migration assay, the top chamber was seeded with 1 × 10⁵ CRC cells, and the bottom chamber was filled with 500 μL RPMI-1640 medium (Gibco™, Thermo Fisher Scientific, 23400021) with 10% FBS (Gibco™, Thermo Fisher Scientific, 26140079). After 24 h, the filters were fixed with 100% methanol for 5 min at RT, and then stained with Wright-Giemsa. For the matrigel invasion assay, biocoat matrigel invasion chambers (BD Biosciences, 354480) were used for the invasion assay following the instructions of the manufacturer. To quantify the migratory and invasive cells microscopically, cells were counted in 5 random fields using an optical microscope (Nikon, Japan). The images were taken with a Nikon ECLIPSE Ni scope with color camera and were processed with NIS-Elements D 4.10.00 software.
Mass spectrometry (MS) analysis
HEK293T cells were cotransfected with FLAG-TRAF6 and MYC-GSK3B. After transfection for 24 h, cell were lysed in a buffer containing 2 mM Tris-HCl, pH7.4, 10 mM EDTA, 100 mM NaCl and 1% IGEPAL. Cell extracts were subjected to IP using an anti-FLAG antibody (Sigma-Aldrich, F1804). The resulting immunoprecipitates were separated by SDS-PAGE. After silver staining, the TRAF6 specific bands compared to control were cut and tryptically digested, and then analyzed in LC-MS (Thermo Fisher Scientific, IQLAAEGAAPFADBMBCX). The fragment spectra were analyzed using Mascot (Matrix Science) and Protein Pilot (AB Sciex). Phosphopeptide matches were analyzed by using PhosphoRS implemented in Proteome Discoverer and manually curated.
Transmission electron microscopy
SW480 cells stably expressing control or TRAF6-specific shRNA were cultured in 10 cm dishes for 24 h. Cells were collected and fixed in 2.5% glutaraldehyde in 100 mM phosphate buffer for 8 h at RT, then post-fixed in 1% osmic acid for 3 h at 4°C. They were then embedded in Spurr’s resin (Ted-Pella, 18300), sectioned, doubly stained with uranyl acetate and lead citrate, and analyzed using transmission electron microscope (JEOL, JEM1230).
Statistical analysis
The relationships between TRAF6 expression and clinicopathological factors were analyzed using Pearson’s chi-square test, and the correlations between the expression levels of TRAF6 and CTNNB1, p-GSK3B (Tyr216) were calculated using Spearman’s rank Correlation test. The Kaplan-Meier survival analysis was used to illustrate the prognostic relevance of TRAF6 and p-GSK3B (Tyr216) in univariate analysis. Each assay was performed in 3 independent experiments. All of the data were presented as mean ± standard error of the mean. Student’s t-test was used to compare data and to calculate their P values. Asterisks were attributed for the following significance values: P > 0.05 (ns), P < 0.05 (*), P < 0.01 (**).
Supplemental Material
Download MS Word (7.5 MB)Disclosure statement
No potential conflict of interest was reported by the authors.
Supplementary material
Supplemental data for this article can be accessed here.
Additional information
Funding
Related Research Data
References
- Bienz M, Clevers H. Linking colorectal cancer to Wnt signaling. Cell. 2000 Oct 13;103(2):311–320. PubMed PMID: 11057903.
- Cancer Genome Atlas Network. Comprehensive molecular characterization of human colon and rectal cancer. Nature. 2012 Jul 18;487(7407):330–337. PubMed PMID: 22810696.
- Ishida T, Mizushima S, Azuma S, et al. Identification of TRAF6, a novel tumor necrosis factor receptor-associated factor protein that mediates signaling from an amino-terminal domain of the CD40 cytoplasmic region. J Biol Chem. 1996 Nov 15;271(46):28745–28748. PubMed PMID: 8910514.
- Cao Z, Xiong J, Takeuchi M, et al. TRAF6 is a signal transducer for interleukin-1. Nature. 1996 Oct 3;383(6599):443–446. PubMed PMID: 8837778.
- Starczynowski DT, Lockwood WW, Delehouzee S, et al. TRAF6 is an amplified oncogene bridging the RAS and NF-κB pathways in human lung cancer. J Clin Invest. 2011 Oct;121(10):4095–4105. PubMed PMID: 21911935.
- Rong Y, Wang D, Wu W, et al. TRAF6 is over-expressed in pancreatic cancer and promotes the tumorigenicity of pancreatic cancer cells. Med Oncol. 2014 Nov;31(11):260. PubMed PMID: 25252821.
- Sun H, Li XB, Meng Y, et al. TRAF6 upregulates expression of HIF-1α and promotes tumor angiogenesis. Cancer Res. 2013 Aug 1;73(15):4950–4959. PubMed PMID: 23722539.
- Lomaga MA, Yeh WC, Sarosi I, et al. TRAF6 deficiency results in osteopetrosis and defective interleukin-1, CD40, and LPS signaling. Genes Dev. 1999 Apr 15;13(8):1015–1024. PubMed PMID: 10215628.
- Thiery JP, Acloque H, Huang RY, et al. Epithelial-mesenchymal transitions in development and disease. Cell. 2009 Nov 25;139(5):871–890. PubMed PMID: 19945376.
- Sanchez-Tillo E, de Barrios O, Siles L, et al. β-catenin/TCF4 complex induces the epithelial-to-mesenchymal transition (EMT)-activator ZEB1 to regulate tumor invasiveness. Proc Natl Acad Sci U S A. 2011 Nov 29;108(48):19204–19209. PubMed PMID: 22080605.
- Jin S, Cui J. BST2 inhibits type I IFN (interferon) signaling by accelerating MAVS degradation through CALCOCO2-directed autophagy. Autophagy. 2018;14(1): 171–172. PubMed PMID: 29165031.
- Mizushima N, Klionsky DJ. Protein turnover via autophagy: implications for metabolism. Annu Rev Nutr. 2007;27: 19–40. PubMed PMID: 17311494.
- Petherick KJ, Williams AC, Lane JD, et al. Autolysosomal β-catenin degradation regulates Wnt-autophagy-p62 crosstalk. EMBO J. 2013 Jul 3;32(13):1903–1916. PubMed PMID: 23736261.
- Feng L, Zhang J, Zhu N, et al. Ubiquitin ligase SYVN1/HRD1 facilitates degradation of the SERPINA1 Z variant/α-1-antitrypsin Z variant via SQSTM1/p62-dependent selective autophagy. Autophagy. 2017 Apr 3;13(4):686–702. PubMed PMID: 28121484.
- Klionsky DJ, Abdelmohsen K, Abe A, et al. Guidelines for the use and interpretation of assays for monitoring autophagy (3rd edition). Autophagy. 2016;12(1):1–222. PubMed PMID: 26799652.
- Li Y, Zhang Y, Wang L, et al. Autophagy impairment mediated by S-nitrosation of ATG4B leads to neurotoxicity in response to hyperglycemia. Autophagy. 2017 Jul 3;13(7):1145–1160. PubMed PMID: 28633005.
- Tai H, Wang Z, Gong H, et al. Autophagy impairment with lysosomal and mitochondrial dysfunction is an important characteristic of oxidative stress-induced senescence. Autophagy. 2017 Jan 2;13(1):99–113. PubMed PMID: 27791464.
- Nazio F, Strappazzon F, Antonioli M, et al. mTOR inhibits autophagy by controlling ULK1 ubiquitylation, self-association and function through AMBRA1 and TRAF6. Nat Cell Biol. 2013 Apr;15(4):406–416. PubMed PMID: 23524951.
- Shi CS, Kehrl JH. Traf6 and A20 differentially regulate TLR4-induced autophagy by affecting the ubiquitination of Beclin 1. Autophagy. 2010 Oct;6(7):986–987. PubMed PMID: 20798608.
- Noda NN, Ohsumi Y, Inagaki F. Atg8-family interacting motif crucial for selective autophagy. FEBS Lett. 2010 Apr 2;584(7):1379–1385. PubMed PMID: 20083108.
- Wu H, Li XM, Wang JR, et al. NUR77 exerts a protective effect against inflammatory bowel disease by negatively regulating the TRAF6/TLR-IL-1R signalling axis. J Pathol. 2016 Feb;238(3):457–469. PubMed PMID: 26564988.
- Huang R, Xu Y, Wan W, et al. Deacetylation of nuclear LC3 drives autophagy initiation under starvation. Mol Cell. 2015 Feb 5;57(3):456–466. PubMed PMID: 25601754.
- Rogov V, Dotsch V, Johansen T, et al. Interactions between autophagy receptors and ubiquitin-like proteins form the molecular basis for selective autophagy. Mol Cell. 2014 Jan 23;53(2):167–178. PubMed PMID: 24462201.
- Lamothe B, Besse A, Campos AD, et al. Site-specific Lys-63-linked tumor necrosis factor receptor-associated factor 6 auto-ubiquitination is a critical determinant of I kappa B kinase activation. J Biol Chem. 2007 Feb 9;282(6):4102–4112. PubMed PMID: 17135271.
- White E. Deconvoluting the context-dependent role for autophagy in cancer. Nat Rev Cancer. 2012 Apr 26;12(6):401–410. PubMed PMID: 22534666.
- Qu X, Yu J, Bhagat G, et al. Promotion of tumorigenesis by heterozygous disruption of the beclin 1 autophagy gene. J Clin Invest. 2003 Dec;112(12):1809–1820. PubMed PMID: 14638851.
- Liang XH, Jackson S, Seaman M, et al. Induction of autophagy and inhibition of tumorigenesis by beclin 1. Nature. 1999 Dec 9;402(6762):672–676. PubMed PMID: 10604474.
- Dower CM, Bhat N, Wang EW, et al. Selective reversible inhibition of autophagy in hypoxic breast cancer cells promotes pulmonary metastasis. Cancer Res. 2017 Feb 1;77(3):646–657. PubMed PMID: 28115361.
- Chen HZ, Liu QF, Li L, et al. The orphan receptor TR3 suppresses intestinal tumorigenesis in mice by downregulating Wnt signalling. Gut. 2012 May;61(5):714–724. PubMed PMID: 21873734.
- Xing C, Lu XX, Guo PD, et al. Ubiquitin-specific protease 4-mediated deubiquitination and stabilization of PRL-3 Is required for potentiating colorectal oncogenesis. Cancer Res. 2016 Jan 1;76(1):83–95. PubMed PMID: 26669864.
- Guo PD, Lu XX, Gan WJ, et al. RARγ downregulation contributes to colorectal tumorigenesis and metastasis by derepressing the Hippo-Yap pathway. Cancer Res. 2016 Jul 1;76(13):3813–3825. PubMed PMID: 27325643.