
ABSTRACT
Chaperone-mediated autophagy (CMA) is a lysosomal degradation pathway of select soluble proteins. Nearly one-third of the soluble proteins are predicted to be recognized by this pathway, yet only a minor fraction of this proteome has been identified as CMA substrates in cancer cells. Here, we undertook a quantitative multiplex mass spectrometry approach to study the proteome of isolated lysosomes in cancer cells during CMA-activated conditions. By integrating bioinformatics analyses, we identified and categorized proteins of multiple cellular pathways that were specifically targeted by CMA. Beyond verifying metabolic pathways, we show that multiple components involved in select biological processes, including cellular translation, was specifically targeted for degradation by CMA. In particular, several proteins of the translation initiation complex were identified as bona fide CMA substrates in multiple cancer cell lines of distinct origin and we show that CMA suppresses cellular translation. We further show that the identified CMA substrates display high expression in multiple primary cancers compared to their normal counterparts. Combined, these findings uncover cellular processes affected by CMA and reveal a new role for CMA in the control of translation in cancer cells.
Abbreviations: 6-AN: 6-aminonicotinamide; ACTB: actin beta; AR7: atypical retinoid 7; CHX: cycloheximide; CMA: chaperone-mediated autophagy; CQ: chloroquine; CTS: cathepsins; DDX3X: DEAD-box helicase 3 X-linked; EEF2: eukaryotic translation elongation factor 2; EIF4A1: eukaryotic translation initiation factor 4A1; EIF4H: eukaryotic translation initiation factor 4H; GEO: Gene Expression Omnibus; GO: Gene Ontology; GSEA: gene set enrichment analysis; HK2: hexokinase 2; HSPA8/HSC70: heat shock protein family A (Hsp70) member 8; LAMP: lysosomal-associated membrane protein; LDHA: lactate dehydrogenase A; NES: normalized enrichment score; NFKBIA: NFKB inhibitor alpha; PCA: principle component analysis; PQ: paraquat; S.D.: standard deviation; SUnSET: surface sensing of translation; TMT: tandem mass tags; TOMM40/TOM40: translocase of outer mitochondrial membrane 40.
Introduction
Chaperone-mediated autophagy (CMA) is an important degradative mechanism that delivers intracellular components into lysosomes for cellular quality control purposes [Citation1]. However, the process is specific and only applies to select proteins. During CMA, proteins are targeted for degradation through their interaction with a cytosolic chaperone, HSPA8/HSC70 (heat shock protein family A [Hsp70] member 8), that recognizes and binds to a pentapeptide sequence, chemically related to the KFERQ motif, on the cargo protein [Citation2]. This interaction enables the cargo protein to translocate to the lysosomal membrane and bind a receptor called LAMP2A (lysosomal-associated membrane protein 2A) [Citation1], which forms a translocation complex that facilitates the internalization of the substrate protein into the lysosomal lumen, allowing their degradation [Citation3]. CMA is therefore distinct from macroautophagy, as it does not broadly target cellular components and organelles.
While a basal level of CMA activity has been detected in almost all mammalian cell types, it is extensively and specifically activated upon several types of cellular stressors, including nutrient deprivation and oxidative stress [Citation4,Citation5]. Accordingly, CMA represents a protective mechanism that beyond providing cells with nutrients, it allows cell survival by selectively removing altered or damaged proteins. Beyond its physiological significance, defects in CMA have been linked to promoting the accumulation of misfolded and pathological mutant proteins involved in a wide range of human diseases, including neurodegenerative and metabolic disorders as well as cancers [Citation6–Citation8]. The conformation of TP53 (tumor protein p53) proteins with missense mutations is known to share similarity with that of pathological mutant proteins involved in neurodegenerative diseases. In fact, select proteins associated with cancer such as accumulated mutant TP53 as well as misfolded NCOR (nuclear receptor corepressor) proteins have been shown to be degraded by CMA in cancer cells [Citation9,Citation10]. Moreover, CMA contributes to the degradation of pro-oncogenic EPS8 (epidermal growth factor receptor pathway substrate 8), associated with the progression of numerous solid malignancies [Citation11]. Through the degradation of these cancer-driving proteins, increased CMA activity can lead to the death of cancer cells, while normal cells are spared, indicating its immense role in cancer [Citation9,Citation12]. Furthermore, multiple metabolic proteins, possessing the CMA targeting motif, is identified as CMA substrates, including GAPDH (glyceraldehyde-3-phosphate dehydrogenase) and PK (pyruvate kinase) as well as kinases involved in lipid and carbohydrate metabolism in the liver [Citation13–Citation15]. Similarly, oncogenic HK2 (hexokinase 2) protein, which plays a key function in glycolysis in cancer cells, is selectively targeted for degradation, in nutrient-deprived conditions, upon increased CMA activity [Citation16]. Combined, these findings suggest that CMA can selectively promote the degradation of enzymes operating in glucose or lipid metabolism pathways.
Approximately 30% of the soluble proteins are suggested to display KFERQ-like motifs [Citation2], yet only a minor fraction of this proteome has been identified as CMA substrates [Citation17]. It is therefore unclear whether groups of proteins with similar functions or proteins assigned to specific and well-defined cellular processes are selectively targeted for degradation by CMA in different physiological or pathological settings.
Here, we undertook an integrative quantitative mass spectrometry and bioinformatics approaches to study the proteome from isolated lysosomes in cancer cells during CMA-activated conditions. We identified and categorized proteins of multiple cellular pathways that were specifically degraded and affected by CMA. In addition to metabolic pathways, we found that activation of CMA in cancer cells targets multiple proteins involved in the translation processes. We show that CMA degrades key proteins primarily at the level of translation initiation and that CMA activation leads to inhibition of translation. We further show that these newly identified CMA substrates were highly expressed in multiple primary cancers across distinct cohorts and provide a new strategy to target components of the translation machinery by activation of CMA. These findings reveal a new role for CMA in the control of translation and unveil previously unknown cellular processes affected by CMA in cancer cells.
Results
Quantitative proteomics analysis of isolated lysosomes from CMA-activated conditions in cancer cells
To identify the protein profile that is specifically targeted into the lysosomes for degradation through the CMA pathway and to directly assess the CMA proteome in cancer cells, we first determined and optimized the uptake of proteins into the lysosomes during CMA-activated conditions by differential large-scale multilayered density gradient centrifugations in breast cancer SUM159 cells (Figure S1(a)). The experimental strategy ()) was to isolate lysosomal fractions for proteomics analysis.
Figure 1. Degradome analysis of cancer cells upon CMA activation. (a) Lysosomal fractionation and TMT mass spectrometry workflow. Four experimental conditions (Control, CMA-activated 16 h, CMA-activated 36 h, and CMA-activated 36 h + siLAMP2A) were prepared in four biological replicates in SUM159 cells. CMA was induced by the combination treatment of 2 µM AC220 and 20 µM spautin-1. CQ (25 µM) was used as a lysosomal inhibitor. (b) Lysosomal fractions of the above-mentioned samples were analyzed by immunoblotting using antibodies to lysosomal matrix protein CTSD, lysosomal membrane protein LAMP1, LAMP2, and -two known CMA substrates NFKBIA and HK2. (c) Lysosomal enrichment quantified from 4 replicates of the indicated proteins. Data are presented as mean ± S.D. (n = 4) * p < 0.05 **p < 0.01 ***p < 0.001; ns, non-significant, two-tailed student’s t-test. (d) TMT signal distribution before and after normalization of the sample sets following LC-MS/MS. (e) Score plot of principal components analysis (PCA) of control, CMA-activated, and CMA-activated + siLAMP2A-treated samples. PC1 and PC2: principal component 1 and principal component 2. Each point represents a sample of the biological replicates. (f) Diagrams of proteins identified in the different samples. (g) Quantitative proteomic comparison of changes identified in the sample sets. Proteins with at least twofold increase ratios and at least 20% siLAMP2A dependencies are highlighted in orange.
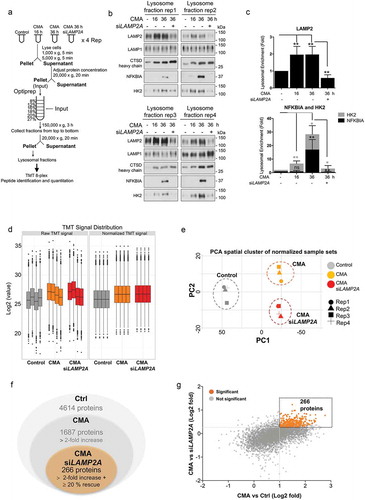
CMA was induced as previously described with AC220 and spautin-1 [Citation16]. Using the selective macroautophagy inhibitor [Citation18] spautin-1 precludes the contribution of macroautophagy to the lysosomal degradation and further activates CMA in response to blockage of macroautophagy [Citation19]. In addition, to prevent the degradation of CMA substrates that may occur rapidly after their lysosomal translocation, cells were treated with the lysosomal inhibitor chloroquine (CQ).
Lysosomal fractions were isolated from SUM159 cells as depicted by the flow diagram for the various preparations (Figure S1(a)) and analyzed by western blot (Figure S1(b)). Among the analyzed fractions, the lower gradient solutions contained the most prominent enrichment of lysosomal components, as indicated by LAMP2 and CTSD (cathepsin D), and with the least contamination of mitochondria, as indicated by TOMM40/TOM40 (translocase of outer mitochondrial membrane 40) (Figure S1(b)). Next, we optimized the lysosome enrichment by comparing control and CMA-activated conditions focusing on the lower gradient fractions. Western blot analysis revealed that the 12% fractions displayed the most optimal lysosomal enrichment based on the levels of the lysosomal markers LAMP1, LAMP2, LAMP2A, and CTSD, compared to the mitochondrial TOMM40 and cytosolic LDHA (lactate dehydrogenase A) marker levels (Figure S1(c)).
Ultimately, lysosomes were isolated from control and CMA-activated conditions at 16 h and 36 h, as well as when LAMP2A was genetically knocked down in SUM159 cells (,). We used siRNA that significantly targeting LAMP2A (Figure S1(d)), as it is the key regulator of CMA [Citation20], and does not affect the degradation by endosomal microautophagy (e-MI) [Citation21], which excludes the involvement of this pathway in our analysis. Further, since increased lysosomal levels of well-known CMA substrates is a standard indication of CMA activity, the lysosomal enrichment and uptake rate of HK2 accompanied with the NFKBIA (NFKB inhibitor alpha) proteins, two classical CMA substrates [Citation15,Citation22], was used to optimize the CMA activity conditions (). LAMP2A levels were significantly increased in lysosomal fractions of all CMA-activated samples, as the abundance of this protein in lysosomes usually correlates with CMA activity, whereas both HK2 and NFKBIA proteins display a time-dependent gradient enrichment into the lysosomes, with the higher degree at 36 h compared to control and to 16 h following CMA activation (,), and their lysosomal levels were significantly affected in a LAMP2A-dependent manner. These data confirm that the indicated proteins are enriched in lysosomes upon CMA activation, and that their enrichment changes over time of activation; thus, based on these data, further proteome analyses were made using CMA-activated conditions at 36 h.
The experimental outline () required lysosomal isolation coupled to a quantitative proteomics approach amenable to multiplexing for simultaneous quantitative comparison across the experimental conditions. Therefore, four biological replicates from isolated lysosomal fractions of control, CMA-activated or siLAMP2A + CMA-activated conditions were analyzed by 8-plex Tandem Mass Tags (TMT) mass spectrometry for their lysosomal content following CMA activation. The TMT signals were normalized by the Quantile method (). In addition, to get a high-level view of the similarities and differences among samples, we compared the proteomic datasets by principle component analysis (PCA) (). The clear partitioning of the sample sets into time course groups demonstrates that the primary feature of change is CMA activation compared to control (PC1). Significant differences were similarly shown due to LAMP2A depletion within the CMA-activated clusters in the sample sets analyzed (PC2) ()), which indicates a good separation of the biological replicates within the treatment sample groups. Moreover, the proteome data revealed that while LAMP1 and the late endosomal marker RAB9 levels were not changed, proteins that have been shown to participate in lysosome function and CMA activity, including lysosomal hydrolases CTSA, CTSB, CTSD (cathepsin A, B and D) as well as HSPA8/HSC70 were maintained at high levels in the lysosomal compartment during CMA-activated conditions, further confirming that the analyzed lysosome fractions were probed for enzymes for lysosomal proteolysis and HSPA8/HSC70-positive, thus competent for CMA and proportional to CMA activity (Figure S1(e)).
The mass spectrometry analysis identified 4614 proteins, out of which 36.5% were detected with at least twofold lysosomal enrichment with an adjusted p-value less than 0.05 upon CMA-activated conditions compared to the control. Further, the lysosomal enrichment of these proteins was tested for their LAMP2A-dependency. By this comparison, 266 proteins were found to display, in addition to a twofold enrichment upon CMA activation, also at least 20% reduced lysosomal accumulation upon LAMP2A depletion, thus were considered as potential CMA substrates (,).
Identification of cellular processes affected by CMA
The identified potential CMA substrate proteins were subjected for bioinformatics analyses based on their cellular localization. Proteins were first mapped with Gene Ontology (GO) term cytosol (GO:0005829), and then manually searched in Uniprot. While we obtained information on the subcellular localization of 250 proteins, 6% of the proteins remained undefined in this regard. Among the 250 proteins, 90% matched within the cytosol category and only 10% of the proteins were indicated as membrane-bound proteins experimentally (7%) or by sequence similarity prediction (3%). Further, by performing a motif search to check the proportion of proteins presenting a KFERQ-like motif among the 266 proteins identified as LAMP2A-dependent degraded proteins, we found that 77% (204) of the proteins contain a ‘canonical’ KFERQ-like motif. However, we do not exclude that the remaining 23% might possess putative CMA motifs, in which the targeting motif can be generated e.g. through post-translational modifications.
To identify cellular processes affected by CMA, we performed biological function distribution analysis using the GO database on the proteome identified as potential CMA substrates. Beyond identifying metabolic pathways [Citation13,Citation16], our proteomic analyses uncovered multiple novel processes, including translation and RNA regulation processes as well as intercellular transport, as previously unknown events as being affected by CMA (). Notably, these processes belong to the most energy-consuming cellular processes and known to be blocked as a rapid and effective means for the cell to respond to many different stresses and for coupling nutrient deprivation.
Figure 2. Identification of cellular pathways affected upon CMA activation. (a) Gene ontology (GO) enrichment analysis of the identified proteins. Dot plot of enriched pathways is indicated as the ratio of the differentially expressed gene number to the total gene number in a certain GO annotation. The size and color of the dots represent the gene number and the range of p values, respectively. (b) GSEA of CMA-activated and CMA-activated + siLAMP2A-treated samples. The enrichment plot shows the distribution of genes in the set and the enrichment score plotted as a function of the position within the ranked list of probes is shown as a green line. p values and the normalized enrichment score is presented in the figure. FDR <0.2 are reported. (c) Heat map representation of the relative lysosomal abundance of proteins involved in the cellular translation process based on GO analysis, of all biological replicates. The color key is shown below the heat map. The colored circles indicate the protein function. (d) Table summary of the identified proteins involved in translation initiation. (e) Fold TMT intensity of lysosomal enrichment of the indicated proteins. (n = 4) Data are presented as mean ± S.D. Adjusted p values. *p < 0.05 **p < 0.01 ***p < 0.001; Limma package.
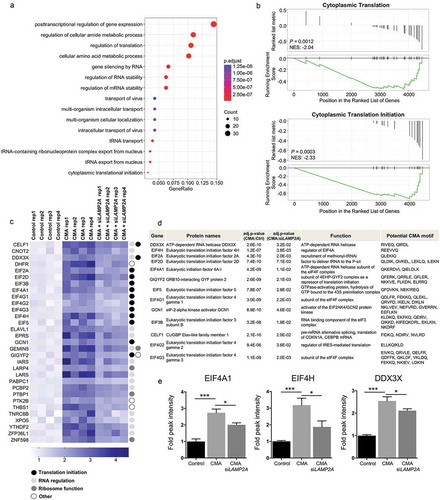
To further validate our data, we performed gene set enrichment analysis (GSEA) for the differentially expressed genes between the CMA-activated and siLAMP2A + CMA-activated groups to interrogate if any gene sets were enriched in CMA-activated conditions but were concurrently suppressed by siLAMP2A. The GSEA method identified statistically significant concordant differences in the abundance of defined gene sets for the translation process with an adjusted p-value <0.05 (). This analysis confirmed that processes of cytoplasmic translation, and especially initiation of cytoplasmic translation were significantly enriched in the CMA-activated conditions, while in the siLAMP2A + CMA-activated samples these gene sets were underscored reflected by the negative normalized enrichment score (NES), indicating that the degradation of proteins defined by these gene sets are blocked by LAMP2A depletion ().
The identified lysosomal enriched proteins belonging to the translation gene sets were recapitulated further by categorizing them based on their function as translation initiation, RNA processing or regulation, ribosomal function or other (). This revealed that proteins classified as translation initiation subunits were highly abundant in this group (,)). In addition, analysis of the subcellular localization and the potential CMA-targeting motifs in this group of proteins revealed that all identified potential CMA substrate proteins involved in the translation initiation processes were categorized as cytosolic proteins and possessed one or multiple KFERQ-like motif in their amino acid sequences (), in support of their selective targeting to lysosomes by CMA.
Taken together, these findings show the selectivity of CMA in targeting select cellular processes in cancer cells and imply a novel role for CMA in the control of translation initiation. As the reduction of translation increases overall energy availability in cells, these data further confirm that CMA can function as a salvage process during stress conditions by degrading proteins no longer needed to recycle amino acids required under nutrient limitation.
The eukaryotic translation initiation factors are bona fide CMA substrates
To experimentally test if the identified proteins involved in translation initiation are true CMA substrates, multiple proteins involved in different steps of translation initiation were chosen for further validation, including EIF4A1 (eukaryotic translation initiation factor 4A1), which is a subunit of the EIF4F complex; EIF4H (eukaryotic translation initiation factor 4H), which stimulates the RNA helicase activity of EIF4A in the translation initiation complex; and the multifunctional DDX3X (DEAD-box helicase 3 X-linked) protein implicated in both RNA processing and translation initiation regulation. As a first approach, we analyzed the proteomic data for their lysosomal level intensities in isolated fractions upon CMA treatment and the effect of LAMP2A silencing. In contrast to the control samples, all three proteins displayed significant increased levels in the lysosomal fractions following CMA activation and its accumulation was blunted by siLAMP2A (). Further, using isolated lysosomes, we studied their lysosomal enrichment and if changes in the lysosomes abundance of these proteins correlate with CMA activity (). As seen by immunoblotting, all three proteins displayed a gradual accumulation in the lysosomes peaking at 36 h compared to control and the 16 h CMA-activated conditions (,). This colocalization correlated with enriched levels of LAMP2A in the fractions and not with the LAMP1 levels, as knockdown of LAMP2A significantly affected the lysosomal accumulation of EIF4A1, EIF4H, and DDX3X (,). To make sure that the difference we observed was not due to protein loading variation, we stained the membrane with Ponceau S Red, which indicates the total protein levels in the fractions ()). These data indicate EIF4A1, EIF4H and DDX3X proteins as CMA substrates as their protein levels increase in CMA-active lysosomes in the presence of CQ but not when LAMP2A is absent.
Figure 3. Translation initiation factors are bona fide CMA substrates. (a) Lysosomal fractions of control, CMA-activated 16 h, CMA-activated 36 h and CMA-activated 36 h + siLAMP2A-treated SUM159 cells analyzed by immunoblotting using antibodies to lysosomal membrane protein LAMP1 and LAMP2A, and to translation initiation factor EIF4A1, EIF4H and DDX3X. Total protein levels visualized by Ponceau S Red staining in the fractions. (b) Lysosomal enrichment presented of indicated proteins as fold over control. (n = 3) Data are presented as mean ± S.D. *p < 0.05 **p < 0.01 ***p < 0.001; two-tailed student’s t-test. (c) Protein expression levels of translation initiation factors, EIF4A1, EIF4H, and DDX3X, following 16 h CMA activation in the absence or presence of lysosomal inhibitor CQ (25 µM), the cysteine protease inhibitor E64D (5 µM) or cysteine, serine and threonine peptidase inhibitor leupeptin (40 µM). ACTB was used for equal loading. (d) qPCR data showing the expression of EIF4A1, EIF4H, and DDX3X, following CMA activation. (n = 3) Data are expressed as mean ± S.D. (e) Time-dependent decrease in expression levels of EIF4A1, EIF4H, DDX3X and, along with two known CMA substrates NFKBIA and HK2, as well as the translation elongation factor EEF2 upon CMA activation up to 36 h. ACTB was used for equal loading. (f) The degradation profile of indicated proteins over time (0–36 h). (n = 3) Data are presented as mean ± SEM. * p < 0.05 **p < 0.01 ***p < 0.001; two-tailed student’s t-test. (g) The effect of different CMA activators on the expression of EIF4A1, EIF4H, and DDX3X at the indicated time points. Compounds include 6-AN, geldanamycin (HSP90 inhibitor) or AR7, as CMA activators, compared to the combination treatment of AC220 and spautin-1. (h) Western blot analysis of WT EIF4A1 and EIF4A1Q93,I94A or WT EIF4H and EIF4HV223,Q224A MYC-DDK-expressing ES2 cells following 16 h CMA activation. ACTB was used for equal loading.
Next, we studied the degradation of EIF4A1, EIF4H, and DDX3X upon CMA activation in cells by immunoblotting. While a marked reduction in cellular level of these proteins was detected under conditions of CMA activation, three pharmacological inhibitors against lysosomal function, including CQ, the cysteine protease inhibitor E64D, or the cysteine, serine and threonine peptidase inhibitor leupeptin, significantly blocked their degradation () and S2(a)), proving that their localization in the lysosomes is for degradation purposes. qPCR analysis further confirmed that the observed changes in the expression level of these proteins by CMA was not due to a differential mRNA expression ()). Furthermore, the degradation of EIF4A1, EIF4H and DDX3X proteins occurred in a time-dependent manner upon CMA activation and concurrently with the degradation profile of previously known CMA substrates (HK2 and NFKBIA), while the EEF2 (eukaryotic translation elongation factor 2) was unaffected (,) and S2(b)), further indicating the selective targeting of translation initiation by CMA.
To further evaluate the effect of CMA on EIF4A1, EIF4H, and DDX3X, other compounds that have been suggested to modulate CMA activity were tested. Cancer cells were treated with different compounds including, 6-aminonicotinamide (glucose-6-phosphate dehydrogenase inhibitor; 6-AN), geldanamycin (HSP90 inhibitor) or atypical retinoid 7 (AR7), as CMA activators [Citation23,Citation24] () and S2(c)). A time-dependent decrease of EIF4A1, EIF4H, and DDX3X levels were observed upon treatment with all three compounds, among which AR7 and geldanamycin showed the most effect on EIF4A1 and DDX3X, respectively (). Since 6-AN is suggested to affect other forms of the lysosomal degradation pathway, we treated cells in combination with macroautophagy inhibitor spautin-1, which led to a further decrease in the EIF4A1 levels. In addition, a significant decrease in protein levels of EIF4A1, EIF4H and DDX3X was observed during glucose-free conditions (Figure S2(d)), as well as when oxidative stress was induced by either H2O2 or paraquat (PQ), previously shown to activate CMA [Citation25,Citation26] (Figure S2(e)). These data validate that distinct CMA activators decreases the cellular levels of EIF4A1, EIF4H, and DDX3X.
Furthermore, because CMA is often activated in response to cellular stress, conditions that might also affect the MTOR (mechanistic target of rapamycin kinase) network, we tested if treatment with rapamycin could affect the degradation and consequently the expression levels of EIF4A1, EIF4H, and DDX3X. Compared to the CMA-activated conditions, no significant change in the protein levels was detected by rapamycin treatment (Figure S2(f)). Combined, these data suggest that although the translation machinery might be affected by different stresses, its components may not be targeted for degradation, unless CMA is activated.
To functionally determine the importance of the identified putative CMA targeting motifs in EIF4A1 and EIF4H, we generated the mutants EIF4A1Q93,I94A and EIF4A1Q308,K309A with a 2-amino-acid mutation in the putative CMA motif 93QIELD97 or 308QKERD312. and the mutant EIF4HV223,Q224A in the CMA motif 220EEVVQ224 by site-directed mutagenesis. Our data revealed that while the mutant EIF4A1Q308,K309A did not affect the EIF4A1 degradation (Figure S2(g)), the EIF4A1Q93,I94A and EIF4HV223,Q224A mutant proteins were significantly less competent for degradation by CMA compared to their wild-type protein (), which highlights the importance of these motifs in EIF4A1 and EIF4H for degradation by CMA.
Higher expression levels of EIF4A1, EIF4H, and DDX3X in primary tumors
Altered expression of translation initiation factors has been reported to be associated with malignant transformation in numerous types of cancers [Citation27]. Thus, we set out to examine and analyze the expression of EIF4A1, EIF4H and DDX3X using the Gene Expression Omnibus (GEO) database, in the primary breast (153) and ovarian (31) tumors samples compared with expression levels in its respective normal healthy controls. In line with observations of other translation initiation factors, this analysis revealed that indeed all these three translation initiation factors, EIF4A1, EIF4H and DDX3X, display elevated expression in the analyzed primary tumors compared to normal controls (). Correspondingly, we next tested if EIF4A1, EIF4H and DDX3X proteins could also be targeted for degradation by CMA in multiple cancer cells of distinct origin. In all cancer cell lines tested, including, ovarian cancer OVCAR3 and ES2, lung cancer A549 and H1437, breast cancer SUM159 and HCC1500 as well as fibrosarcoma HT1080 cell lines, a significant decrease in the level of these proteins were observed following CMA activation, demonstrating their targetability and degradation by CMA (,), indicative of a new approach of targeting components of the translation initiation for degradation by activation of CMA in cancer cells.
Figure 4. Expression of EIF4A1, EIF4H, and DDX3X in multiple primary cancer cohorts and their targetability by CMA. (a) Transcript abundance (probe intensity) of the indicated genes in primary Ovarian (GSE40595) Cancer (31) Normal (8) and Breast (GSE65194) Cancer (153) Normal (11) datasets. Differential expression was determined using Mann–Whitney U test. (b) and (c) The expression levels of EIF4A1, EIF4H and DDX3X in untreated and CMA-activated conditions in the indicated multiple cancer cell lines. CMA treatment for different cancer cells are as follows: 2 μM AC220 and 20 μM spautin-1. OVCAR3, ES2, HCC1500 and HT1080 for 24 h, A549, NCI-H1437 and SUM159 for 36 h. ACTB was used for equal loading. (n = 3) Data are presented as mean ± S.D. *p < 0.05 **p < 0.01 ***p < 0.001; two-tailed student’s t-test.
CMA activation decreases protein translation
To determine the effect of CMA activation on translation, we performed the non-isotopic surface sensing of translation (SUnSET) technique, which allows a valid and accurate measurement of in vitro changes in protein synthesis, using puromycin incorporation [Citation28]. Untreated samples were compared to CMA-activated conditions in cancer cells. In addition, to demonstrate the specificity of the anti-puromycin signal, samples in which cells were treated with the translation inhibitors silvestrol or cycloheximide (CHX) were included. Because CHX blocks the translocation step in elongation, whereas silvestrol modulates the translation initiation by preventing ribosome loading onto mRNA templates by targeting the eukaryotic initiation factor EIF4A, these inhibitors represent proper controls for our analysis. Our results showed that the puromycin levels dramatically decreased when cells were treated to undergo CMA or exposed to CHX or silvestrol in a time- and concentration-dependent manner (,) and S2(h)). In contrast, puromycin levels were not affected in rapamycin-treated samples. In addition, testing the SUnSET method for cancer cells treated with 6-AN and geldanamycin, as CMA activators showed marked decrease in puromycin levels compared to the control cells (). Furthermore, SUnSET experiments, in which cells were knocked down for LAMP2A and activated for CMA, were performed. These data showed that the anti-puromycin labeling was significantly restored in the LAMP2A-silenced samples compared to non-targeting control cells during CMA-activated conditions (). Combined, our data indicate that CMA can suppress the translation process and thereby decrease protein synthesis.
Figure 5. CMA activation affects cellular translation. (a) Representative images of the SUnSET western blots showing the incorporation of puromycin-labelling for the indicated cell lines following CMA activation at shown concentrations and time points. To demonstrate the specificity of the puromycin signal, the translation initiation inhibitor silvestrol and translation elongation inhibitor CHX was used. Total protein levels visualized by Ponceau S Red staining in the fractions. (b) Quantification of the puromycin signal intensities of ES2 cells within the linear range of the film. In this quantification procedure, the puromycin signal of samples was expressed relative to the ponceau staining. (n = 3) Data are presented as mean± S.D. * p < 0.05 **p < 0.01 ***p < 0.001; two-tailed student’s t-test. (c) Representative images of the SUnSET western blots showing the incorporation of puromycin-labelled peptides in indicated cell lines treated with 6-AN, geldanamycin (HSP90 inhibitor), as CMA activators, at shown concentrations and time points. Total protein levels visualized by Ponceau S Red staining in the fractions. (d) SUnSET western blot showing the incorporation of puromycin-labelling for ES2 cells N.T (Non-targeting) or siLAMP2A-mediated knockdown following 16 h CMA activation.
Discussion
In this study, we aimed to understand if proteins belonging to particular molecular pathways are selectively targeted by CMA in cancer cells. We show that upon CMA activation multiple cellular pathways, which accounts for the most energy-consuming cellular mechanisms [Citation29], were affected in cancer cells. In addition, and as expected, to previously indicated metabolic pathways, we found that CMA targets multiple proteins involved in cellular translation processes for degradation.
Nutrient limitation can slowdown, alter or even completely downregulate various metabolic pathways to adjust to scarce conditions [Citation30,Citation31]. Accordingly, selective targeting of the enzyme in inactivated metabolic processes by CMA would undoubtedly provide a collective benefit to maximize energy efficiency. Further, protein translation is one of the most energy-consuming cellular processes as it requires approximately 75% of the cell’s total energy [Citation32]. Consequently, the reduction of translation increases overall energy availability. Although transcriptional regulation is essential in stress response, translational control often provides immediate and effective changes, which underlines the contribution of their degradation by CMA. It is known that stress (nutrient, oxidative) can induce a decrease in protein synthesis by specifically suppressing translation of components of the translation machinery (ribosomal proteins, translation factors). Accordingly, inhibiting and blocking this process is dynamic and a primary level of control of protein abundance in mammalian cells [Citation33]. As the rate-limiting step in translation, much of the regulation is directed towards the level of initiation as it is a rapid and effective means for the cell to respond to many different stresses and for coupling nutrient deprivation and other stress conditions with levels of protein synthesis [Citation34]. Because CMA affected proteins mainly at the level of translation initiation, as multiple translation initiation complex subunit proteins were validated as bona fide CMA substrates, our findings show that there is a high selectivity of the CMA pathway in targeting certain biological processes. By its selectivity CMA can function as a salvage process under stress conditions by degrading proteins no longer needed to recycle amino acids required under nutrient limitation, thus offering time for cellular adaptation under stress.
We have determined that 93QIELD97 of EIF4A1 and 220EEVVQ224 of EIF4H are important for CMA-dependent protein degradation. Furthermore, our findings showed that most of the proteins involved in the translation process identified as potential CMA substrates possess a CMA recognition motif. Although this indicates their potential to undergo degradation by CMA, most substrate proteins are known to undergo additional layer of complex regulatory steps to control their recognition by the CMA machinery depending on the activatory stimulus. This may be due to that the CMA targeting motif is not exposed or accessible based on the folding or if covered by interaction with other molecules or proteins [Citation16,Citation35]. Therefore, not all proteins bearing the recognition motif is continuously degraded through this pathway. As a direct evidence for this, we found that the EEF2 was not degraded by CMA over time as shown by in ,), while possessing 2 KFERQ-like motifs: QRIVE, LVEIQ.
It has, however, been suggested that molecular chaperones may be involved in recognition of regulatory complexes to mediate their disassembly [Citation36]. The p23 chaperone and to a lesser extent HSP90, at increased levels, were shown to disassemble transcriptional regulatory complexes and interfere with the transcription initiation activity. As a consequence, it was further shown that the POLR2/RNA polymerase II preinitiation complexes also were disassembled in the same reactions [Citation36]. This principle could very well extend similarly to other regulatory complexes, such as the regulation of translation initiation, which occurs predominantly by multiple associated proteins, each designated as eukaryotic initiation factors that assemble in multiple complexes. Since acute adverse conditions, such as heat shock, hypoxia, nutrient deprivation as well as an accelerated unfolded protein response (UPR) are signals for a rapid reduction in global translation, and conditions that lead to activation of the CMA pathway, it is possible that upon CMA activation, upregulation of multiple chaperones may act broadly to disassemble both transcriptional and or translational regulatory complexes leading to their components to expose their motif and be detected. While this hypothesis remains to be examined, findings from our study indicate that although multiple stress signals converge on initiation factors to inhibit global protein synthesis, and the translation is generally repressed under most if not all types of stress conditions, subunits of the translational regulatory complexes may remain without incurring degradation unless CMA is activated.
Dysregulation of translation upstream of oncogenic signals presents one of the early steps in tumorigenesis. Transcripts that are particularly sensitive to fluctuations in levels of the EIF4F complex are often associated with oncogenic characteristics (e.g. proliferation, survival, and angiogenesis) and their translational output appears to be preferentially reduced when EIF4F is inhibited. In particular, the enzymatic subunit of the EIF4F complex, EIF4A, has been extensively explored as a druggable target with several natural products identified as potent and selective inhibitors. Importantly, we provide a new strategy to target components of the translation machinery, including EIF4A by activation of CMA in cancer cells.
Materials and methods
Cell lines and treatments
The ovarian cancer cell lines: ES2, OVCAR3; the breast cancer cell line: HCC1500; the fibrosarcoma cell line: HT1080 and the lung cancer cell lines: NCI-H1792, NCI-H1437, A549 were cultured in RPMI (Sigma-Aldrich, R8758) medium supplemented with 10% (v:v) heat‐inactivated fetal bovine serum (FBS; Gibco, 10500064), 100 U/ml penicillin and 100 U/ml streptomycin (Sigma-Aldrich, P0781) and 1% (w:v) glutamine (Sigma-Aldrich, G7513). The breast cancer cell line: SUM159, was cultured in Ham’s F12 medium supplemented (Lonza, BE12-618F) with 5% (v:v) heat‐inactivated FBS, 100 U/ml penicillin and 100 U/ml streptomycin, 5 mg/ml insulin (Sigma-Aldrich, I6634) and 1 mg/ml hydrocortisone (Sigma-Aldrich, H4001). All cell lines were grown at 37°C in a 5% CO2 atmosphere and maintained in a logarithmic growth phase. Throughout the experiments (unless otherwise stated), cells were treated with 1.5 µM AC220 (Selleckchem, S1526) and 10 µM spautin-1 (Sigma-Aldrich, SML0440) for CMA activation as previously described [Citation16]. For the glucose-free condition, cell culture media with no glucose was supplemented with dialyzed FBS. The following compounds were used for the treatment of cells in the indicated experiments: 25 µM or 50 µM CQ (Sigma-Aldrich, C6628), 4 µM geldanamycin (Selleckchem, S2713), 10 µM 6-AN (Sigma-Aldrich, A68203), 40 µM AR7 (Sigma-Aldrich, SML0921), 2.5 mM PQ (Sigma-Aldrich, 36541), 250 µM H2O2 (Merck, 107209), 5–30 µM CHX (Sigma-Aldrich, C7698), 25–100 nM silvestrol (MedChemExpress, HY-13251), 200 nM rapamycin (Sigma-Aldrich, 37094), 5 µM E64D (Sigma-Aldrich, E8640) or 40 µM leupeptin (Sigma-Aldrich, L2884).
siRNAs and plasmids
All siRNA was purchased from Shanghai GenePharma Co, Ltd. 20 nM siRNA was used, and the transfection was performed using Lipofectamine 2000 Reagent (Invitrogen, 11668019) according to the manufacturer’s instructions. The efficiency of siRNA and expression level of protein was monitored at 48–72 h post-transfection by western blotting. The following siRNA were used:
NT (Non-targeting) sense 5ʹ-UUCUCCGAACGUGUCACGUTT-3ʹ
NT (Non-targeting) antisense 5ʹ-ACGUGACACGUUCGGAGAATT-3ʹ
LAMP2A #1 sense 5ʹ-GCAGUGCAGAUGACGACAATT-3ʹ
LAMP2A #1 antisense 5ʹ-UUGUCGUCAUCUGCACUGCTT-3ʹ
LAMP2A #2 sense 5ʹ-GCCUUGGCAGGAGUACUUATT-3ʹ
LAMP2A #2 antisense 5ʹ-UAAGUACUCCUGCCAAGGCTT-3ʹ
Plasmids were purchased from OriGene: pCMV6-DDX3 (RC204171), pCMV6-EIF4A1 (RC203298), pCMV6-EIF4H (RC204028). Transfections were performed using Viafect (Promega, E4982) according to the manufacturer’s instructions.
Lysosomal fractionation
The lysosomal fractionation was performed according to the manufacturer of the Lysosome Isolation Kit (Sigma-Aldrich, LYSISO1). Briefly, approximately 1 × 10⁸ SUM159 cells were trypsinized, washed, collected and pelleted for each condition. Cells were resuspended in 2 ml of 1x extraction buffer supplemented with Protease Inhibitor Cocktail (Sigma-Aldrich, P8340). Cells were broken up by applying 15 strokes with 25-gauge syringe needles. Lysates were cleared by differential centrifugation at 1,000 x g for 5 min, followed by 5,000 x g for 5 min. The protein amounts were adjusted for all samples and conditions and the same amount of extract of each condition was centrifuged at 20,000 x g for 20 min. The pellets were resuspended in 550 µl 1x extraction buffer, diluted with 267 µl OptiPrep (Sigma-Aldrich, O4889) (60%), 163 µl OptiPrep Dilution Buffer and 20 µl 2.3 M sucrose (Sigma-Aldrich, S4189), and subjected to density gradient centrifugation. Discontinuous OptiPrep gradients (27%, 20%, 18%, 16%, 12%, 8%) were layered and centrifuged at 150,000 x g for 3 h. Fractions were collected as indicated, diluted with 2xvolume of 1xExtract buffer, and pelleted at 20,000 x g for 20 min.
Sample preparation for mass spectrometry
All reagents were prepared in 50 mM HEPES, pH 8.5 (Biomol, 05288.100). Cysteines were reduced using dithiothreitol (56°C, 30 min 10 mM; Biomol, 04010.25). Samples were cooled to 24°C and alkylated with iodoacetamide (room temperature, in the dark, 30 min, 10 mM; Merck, 8.04744.0100). Subsequently, the samples were prepared for LC-MS/MS using the SP3 protocol [Citation37], digested with trypsin (enzyme to protein ratio, 1:50; Promega, V5111) at 37°C overnight. TMT10plex™ Isobaric Label Reagent (Thermo Fisher Scientific, 90111) was added to the samples according the manufacturer’s instructions. Labeled peptides were cleaned up using OASIS® HLB µElution Plate (Waters, Milford, MA, USA). Offline high pH reverse phase fractionation was performed using an Agilent 1200 Infinity high-performance liquid chromatography (HPLC) system, equipped with a Gemini C18 column (3 μm, 110 Å, 100 × 1.0 mm; Phenomenex, Torrance, CA, USA). The solvent system consisted of 20 mM ammonium formate (pH 10.0; Sigma-Aldrich, 78314-500ML-F) as mobile phase (A) and 100% acetonitrile (Fisher Chemicals, A955-1) as mobile phase (B). This was performed at the Proteomics Core Facility at EMBL Heidelberg, Germany.
LC-MS/MS
Peptides were separated using the UltiMate 3000 RSLC nano-LC system (Dionex, Sunnyvale, CA, USA) fitted with a trapping cartridge (µ-Precolumn C18 PepMap 100, 5 µm, 300 µm i.d.x5 mm, 100 Å; Thermo Fisher Scientific, Waltham, MA, USA) and an analytical column (Acclaim PepMap 100 75 µm x 50 cm C18, 3 µm, 100 Å; Thermo Fisher Scientific, Waltham, MA, USA). The outlet of the analytical column was coupled directly to a Q Exactive plus (Thermo Fisher Scientific, Waltham, MA, USA) using the proxeon nanoflow source in positive ion mode. Solvent A was water, 0.1% formic acid (Fisher Chemicals, A117-50) and solvent B was acetonitrile, 0.1% formic acid. Trapping time was 6 min with a constant flow of solvent A at 30 µl/min onto the trapping column. Peptides were eluted via the analytical column a constant flow of 0.3 µl/min. During the elution step, the percentage of solvent B increased in a linear fashion from 2% to 4% B in 4 min, from 4% to 8% in 2 min, then 8% to 28% for a further 96 min, and finally from 28% to 40% in additional 10 min. Column cleaning at 80% B followed, lasting 3 min, before returning to initial conditions for the re-equilibration, lasting 10 min. The peptides were introduced into the mass spectrometer (Q Exactive plus) via a Pico-Tip Emitter 360 µm ODx20 µm ID; 10µm tip (New Objective, Woburn, MA, USA) and a spray voltage of 2.3 kV was applied. The capillary temperature was set at 320°C. Full scan MS spectra with mass range 350–1400 m/z were acquired in profile mode in the FT with a resolution of 70,000. The filling time was set at a maximum of 100 ms with a limitation of 3 × 10⁶ ions. DDA was performed with the resolution of the Orbitrap set to 35000, with a fill time of 120 ms and a limitation of 2 × 10⁵ ions. Normalized collision energy of 32 was used. A loop count of 10 with count 1 was used and a minimum AGC trigger of 2e2 was set. Dynamic exclusion time of 30s was applied. The peptide match algorithm was set to ‘preferred’ and charge exclusion ‘unassigned’, charge states 1.5–8 were excluded. Isolation window was set to 1.0 m/z and 100 m/z set as the fixed first mass. MS/MS data was acquired in profile mode. This was performed at the Proteomics Core Facility at EMBL Heidelberg, Germany.
Data analysis
Acquired data was processed by IsobarQuant (doi:10.1038/nprot.2015.101) and Mascot (v2.2.07) and searched against a Uniprot Homo sapiens proteome database (UP000005640) containing common contaminants and reversed sequences. The data were searched with the following modifications: Carbamidomethyl (C) and TMT10 (K) (fixed modification), Acetyl (N-term), Oxidation (M) and TMT10 (N-term) (variable modifications). The mass error tolerance for the full scan MS spectra was set to 10 ppm and for the MS/MS spectra to 0.02 Da. A maximum of two missed cleavages was allowed. For proteins, identification of a minimum of two unique peptides with a peptide length of at least seven amino acids and a false discovery rate below 0.01 were required on the peptide and protein level. This analysis was performed at the Proteomics Core Facility at EMBL Heidelberg, Germany.
Bioinformatics analysis
Based on the output data from IsobarQuant, proteins with at least two single spectra matches and two unique peptide matches were kept for the analysis. After the raw data were log2 transformed, the Batch effects were removed by fitting a linear model to the data that try to explain the replicates. The data from different groups were then normalized using Quantile method, and the fold change and significant level between different groups were calculated using the limma package [Citation38]. The quality of normalized data was checked by PCA analysis. Gene set enrichment analysis (GSEA) was applied for the differentially expressed genes between CMA-activated and CMA-activated + siLAMP2A treatment groups to find the activated gene ontology (GO) categories using ReactomePA package [Citation39]. Transcript abundance (probe intensity) data of EIF4A1, EIF4H and DDX3X genes in ovarian (GSE40595), and breast (GSE65194) cancer were retrieved from the GEO database [Citation40]. The statistical significance for gene expression level differences between tumor samples and corresponding control samples was checked by Mann–Whitney test.
Site-directed mutagenesis
Site-directed mutagenesis of EIF4A1Q93,I94A, EIF4A1Q308,K309A and EIF4HV223,Q224A was generated by site-directed mutagenesis using QuikChange Lightning (Agilent, 210513). The resulting plasmids were verified by sequencing. All exogenous proteins were expressed in cells as tagged proteins with N-terminal MYC-DDK and exposed in western blots by DDK antibody to differentiate from the endogenously expressed proteins.
The following mutagenic primers were used:
EIF4A1Q93,I94A sense 5ʹ-TCT GCA GGC GGC GGA ATT AGA TCT AAA AGC CAC CCA G-3ʹ
EIF4A1Q93,I94A antisense 5ʹ-AAT TCC GCC GCC TGC AGA ATT GAT ATG GCA AAT GT-3ʹ
EIF4A1Q308,K308A sense 5ʹ- CGC CAT GCA TGG AGA TAT GGA CGC AGC GGA ACG AGA CGT GAT TAT GAG G-3ʹ
EIF4A1Q308,K308A antisense 5ʹ- CCT CAT AAT CAC GTC TCG TTC CGC TGC GTC CAT ATC TCC ATG CAT GGC G-3ʹ
EIF4HV223,Q224A sense 5ʹ-GAA GTC GCT GCA AAG GAG CAA GAA ACG CGT ACG CG-3ʹ
EIF4HV223,Q224A antisense 5ʹ-TCC TTT GCA GCG ACT TCC TCT CTA GGC CTG GCA-3ʹ
SUnSET (surface sensing of translation)
SUnSET is a nonradioactive method to measure differences in protein synthesis. This method makes it possible to detect the difference in protein synthesis through the incorporation of puromycin into the elongating peptide chains [Citation28]. In detail, cells were seeded and treated in six-well plates with the indicated concentrations of compounds and time points. Puromycin (10 µg/ml; Sigma-Aldrich, P7255) was added to the wells 30 min before harvesting the cells. Different concentrations of CHX and silvestrol were used as positive controls for blocking the protein synthesis. Puromycin incorporation was detected by immunoblotting using the anti-puromycin antibody as a reflection of protein synthesis. To ensure equal loading of proteins, membranes were stained with Ponceau S Red.
RNA extraction and cDNA synthesis
Total RNA was extracted using the RNAqueous phenol-free total RNA isolation kit (Ambion, AM1912) according to the manufacturer’s instructions. Potential trace DNA contamination was enzymatically removed using DNase I in the samples, according to the optional RNA clean-up Procedures, based on the kits manufacturer’s instructions. One microgram of RNA was used to synthesize cDNA with the IScript cDNA Synthesis Kit (Bio-Rad, 1708890), according to the manufacturer’s instructions. Approximately 200 ng of the cDNA sample was analyzed by quantitative PCR using Maxima qPCR SYBR Green Master Mix (Thermo Fisher Scientific, K0222) and amplified using the 7500 Real-Time PCR system (Applied Biosystems, Foster City, CA, USA). ΔΔCt method was used to determine the relative mRNAs expression after normalization with ACTB as a reference gene. The following oligonucleotides were used:
LAMP1 Fw 5′-TGTGGACAAGTACAACGTGAG-3′
LAMP1 Rv 5′-CGTGTTGTCCTTCCTCTCATAG-3′
LAMP2A Fw 5′-TGATCTAAGGGTTCAGCCTTTC-3′
LAMP2A Rv 5′-GCTATGGGCACAAGGAAGT-3′
LAMP2B Fw 5′-AGGGTTCAGCCTTTCAATGT-3′
LAMP2B Rv 5′-CTGAAAGACCAGCACCAACTA-3′
LAMP2C Fw 5′-TCAGTGTCTGGAGCATTTCAG-3′
LAMP2C Rv 5′-GGTCAGAGTCAGCAGAACATT-3′
EIF4A1 Fw 5′-AAGCCGTGGATTCAAGGACCAG-3′
EIF4A1 Rv 5′-CACCTCAAGCACATCAGAAGGC-3′
EIF4H Fw 5′-GAGAACCCACAGAAGAGGAAAG-3′
EIF4H Rv 5′-AAGATAGCAGAGTTGGGATTGG-3′
DDX3X Fw 5′-GAAGTGCCGTCTTGGTTAGAA-3′
DDX3X Rv 5′-GCACCAAACCCTCCACTAAA-3′
ACTB Fw 5′-GCAAGCAGGAGTATGACGAG-3′
ACTB Rv 5′-CAAATAAAGCCATGCCAATC-3′
Western blotting and antibodies
Cells were harvested, washed and lysed followed by protein concentration determination using the BCA assay (Thermo Fisher Scientific, 23225). Equal amounts of protein from each sample were mixed with SDS sample buffer (62 mM Tris-HCl, pH 6.8, 0.05% w:v bromophenol blue, 4% v:v glycerol, 2% w:v SDS, 5% β-mercaptoethanol final concentration) and subjected to SDS-PAGE and transferred onto nitrocellulose membranes. Primary antibodies used in western blotting and immunostaining were as follows: anti-ACTB (Santa Cruz Biotechnology, sc-81178), anti-DDK (Origene, TA50011-100), anti-puromycin (Merck Millipore, MABE343), anti-LAMP1 (Cell Signaling Technology, 9091), anti-NFKBIA (Santa Cruz Biotechnology, sc-371), anti-LDHA (Cell Signaling Technology, 3582), anti-TOMM40/TOM40 (Santa Cruz Biotechnology, sc-11414), anti-EIF4A1 (Abcam, ab31217), anti-CTSD (Santa Cruz Biotechnology, sc-6486), anti-LAMP2 (Santa Cruz Biotechnology, sc-18822), anti-HK2 (Novus Biologicals, NBP1-51643), anti-LAMP2A (Abcam, ab18528), anti-EIF4H (Cell Signaling Technology, 3469), anti-DDX3X (Cell Signaling Technology, 8192), anti-EEF2 (Cell Signaling Technology, 2332 s). Secondary antibodies used for western blotting were as follows: Goat anti-mouse IgG, (H + L) secondary antibody, HRP (Thermo Fisher Scientific, 31430) and goat anti-rabbit IgG, (H + L) secondary antibody, HRP (Thermo Fisher Scientific, 31460), rabbit anti-goat IgG (H + L) secondary antibody, HRP (Thermo Fisher Scientific, 31402). All antibodies were diluted according to the manufacturer’s recommendation.
Statistics
All graphs were analyzed using GraphPad Prism7. For all experiments with error bars, standard deviation (S.D.) was calculated to indicate the variation within each experiment and data, and values represent mean ± SD. Data are presented as fold change over control and are an average of at least three independent experiments or representative of independent experiments. In all graphs, treatment groups (CMA-activated) were compared with a control group (Ctrl), unless otherwise shown. ns, not significant, *P < 0.05, **P < 0.01, ***P < 0.001.
Supplemental Material
Download MS Power Point (3.9 MB)Acknowledgments
This work was supported by grants from the Ragnar Söderberg Stiftelse, Swedish Research Council (VR), the Swedish Association for Medical Research (SSMF), the Swedish Cancer Society, the Malin and Lennart Philipson Foundation and Magnus Bergwalls Stiftelse. We thank Dr. Mandy Rettel and Dr. Frank Stein at the Proteomics Core Facility, EMBL Heidelberg, Germany, Dr. Andre Lima Queiroz for technical advice and Dr. Matilda Eriksson for comments on the manuscript.
Disclosure statement
No potential conflict of interest was reported by the authors.
Supplemental material
Supplemental data for this article can be accessed here.
Additional information
Funding
Related Research Data
References
- Kaushik S, Cuervo AM. Chaperone-mediated autophagy: a unique way to enter the lysosome world. Trends Cell Biol. 2012 Aug;22(8):407–417. PubMed PMID: 22748206; PubMed Central PMCID: PMCPMC3408550.
- Dice JF. Peptide sequences that target cytosolic proteins for lysosomal proteolysis. Trends Biochem Sci. 1990 Aug;15(8):305–309. PubMed PMID: 2204156.
- Bandyopadhyay U, Kaushik S, Varticovski L, et al. The chaperone-mediated autophagy receptor organizes in dynamic protein complexes at the lysosomal membrane. Mol Cell Biol. 2008 Sep;28(18):5747–5763. PubMed PMID: 18644871; PubMed Central PMCID: PMCPMC2546938.
- Cuervo AM, Knecht E, Terlecky SR, et al. Activation of a selective pathway of lysosomal proteolysis in rat liver by prolonged starvation. Am J Physiol. 1995 Nov;269(5 Pt 1):C1200–C8. PubMed PMID: 7491910.
- Kiffin R, Bandyopadhyay U, Cuervo AM. Oxidative stress and autophagy. Antioxid Redox Signal. 2006 Jan-Feb;8(1–2):152–162. PubMed PMID: 16487049.
- Cuervo AM, Wong E. Chaperone-mediated autophagy: roles in disease and aging. Cell Res. 2014 Jan;24(1):92–104. PubMed PMID: 24281265; PubMed Central PMCID: PMCPMC3879702.
- Wang Y, Martinez-Vicente M, Kruger U, et al. Tau fragmentation, aggregation and clearance: the dual role of lysosomal processing [research support, N.I.H., extramural research support, non-U.S. Gov’t]. Hum Mol Genet. 2009 Nov 1;18(21):4153–4170. PubMed PMID: 19654187; PubMed Central PMCID: PMC2758146. eng.
- Bauer PO, Goswami A, Wong HK, et al. Harnessing chaperone-mediated autophagy for the selective degradation of mutant huntingtin protein [research support, non-U.S. Gov’t]. Nat Biotechnol. 2010 Mar;28(3):256–263. PubMed PMID: 20190739; eng.
- Vakifahmetoglu-Norberg H, Kim M, Xia HG, et al. Chaperone-mediated autophagy degrades mutant p53. Genes Dev. 2013 Aug 1;27(15):1718–1730. PubMed PMID: 23913924; PubMed Central PMCID: PMCPMC3744729.
- Ali AB, Nin DS, Tam J, et al. Role of chaperone mediated autophagy (CMA) in the degradation of misfolded N-CoR protein in non-small cell lung cancer (NSCLC) cells. PLoS One. 2011;6(9):e25268. PubMed PMID: 21966475; PubMed Central PMCID: PMCPMC3179509.
- Welsch T, Younsi A, Disanza A, et al. Eps8 is recruited to lysosomes and subjected to chaperone-mediated autophagy in cancer cells. Exp Cell Res. 2010 Jul 15;316(12):1914–1924. PubMed PMID: 20184880.
- Galan-Acosta L, Xia H, Yuan J, et al. Activation of chaperone-mediated autophagy as a potential anticancer therapy. Autophagy. 2015;11(12):2370–2371. PubMed PMID: 26577179; PubMed Central PMCID: PMCPMC4835192.
- Schneider JL, Suh Y, Cuervo AM. Deficient chaperone-mediated autophagy in liver leads to metabolic dysregulation. Cell Metab. 2014 Sep 2;20(3):417–432. PubMed PMID: 25043815; PubMed Central PMCID: PMCPMC4156578.
- Lv L, Li D, Zhao D, et al. Acetylation targets the M2 isoform of pyruvate kinase for degradation through chaperone-mediated autophagy and promotes tumor growth. Mol Cell. 2011 Jun 24;42(6):719–730. PubMed PMID: 21700219; PubMed Central PMCID: PMCPMC4879880.
- Aniento F, Roche E, Cuervo AM, et al. Uptake and degradation of glyceraldehyde-3-phosphate dehydrogenase by rat liver lysosomes. J Biol Chem. 1993 May 15;268(14):10463–10470. PubMed PMID: 8486700.
- Xia HG, Najafov A, Geng J, et al. Degradation of HK2 by chaperone-mediated autophagy promotes metabolic catastrophe and cell death. J Cell Biol. 2015 Aug 31;210(5):705–716. PubMed PMID: 26323688; PubMed Central PMCID: PMCPMC4555813.
- Tang Y, Wang XW, Liu ZH, et al. Chaperone-mediated autophagy substrate proteins in cancer. Oncotarget. 2017 Aug 1;8(31):51970–51985. PubMed PMID: 28881704; PubMed Central PMCID: PMCPMC5584305.
- Liu J, Xia H, Kim M, et al. Beclin1 controls the levels of p53 by regulating the deubiquitination activity of USP10 and USP13. Cell. 2011 Sep 30;147(1):223–234. PubMed PMID: 21962518; PubMed Central PMCID: PMCPMC3441147.
- Kaushik S, Massey AC, Mizushima N, et al. Constitutive activation of chaperone-mediated autophagy in cells with impaired macroautophagy. Mol Biol Cell. 2008 May;19(5):2179–2192. PubMed PMID: 18337468; PubMed Central PMCID: PMCPMC2366850.
- Massey AC, Kaushik S, Sovak G, et al. Consequences of the selective blockage of chaperone-mediated autophagy. Proc Natl Acad Sci U S A. 2006 Apr 11;103(15):5805–5810. PubMed PMID: 16585521; PubMed Central PMCID: PMCPMC1458654.
- Sahu R, Kaushik S, Clement CC, et al. Microautophagy of cytosolic proteins by late endosomes. Dev Cell. 2011 Jan 18;20(1):131–139. PubMed PMID: 21238931; PubMed Central PMCID: PMCPMC3025279.
- Cuervo AM, Hu W, Lim B, et al. IkappaB is a substrate for a selective pathway of lysosomal proteolysis [research support, non-U.S. Gov’t research support, U.S. Gov’t, P.H.S.]. Mol Biol Cell. 1998 Aug;9(8):1995–2010. PubMed PMID: 9693362; PubMed Central PMCID: PMC25451. eng.
- Finn PF, Mesires NT, Vine M, et al. Effects of small molecules on chaperone-mediated autophagy. Autophagy. 2005 Oct-Dec;1(3):141–145. PubMed PMID: 16874031.
- Anguiano J, Garner TP, Mahalingam M, et al. Chemical modulation of chaperone-mediated autophagy by retinoic acid derivatives. Nat Chem Biol. 2013 Jun;9(6):374–382. PubMed PMID: 23584676; PubMed Central PMCID: PMCPMC3661710.
- Zhang L, Sun Y, Fei M, et al. Disruption of chaperone-mediated autophagy-dependent degradation of MEF2A by oxidative stress-induced lysosome destabilization. Autophagy. 2014 Jun;10(6):1015–1035. PubMed PMID: 24879151; PubMed Central PMCID: PMCPMC4091166.
- Kiffin R, Christian C, Knecht E, et al. Activation of chaperone-mediated autophagy during oxidative stress. Mol Biol Cell. 2004 Nov;15(11):4829–4840. PubMed PMID: 15331765; PubMed Central PMCID: PMCPMC524731.
- de la Parra C, Walters BA, Geter P, et al. Translation initiation factors and their relevance in cancer. Curr Opin Genet Dev. 2017 Nov;15(48):82–88. PubMed PMID: 29153484.
- Schmidt EK, Clavarino G, Ceppi M, et al. SUnSET, a nonradioactive method to monitor protein synthesis. Nat Methods. 2009 Apr;6(4):275–277. PubMed PMID: 19305406.
- Buttgereit F, Brand MD. A hierarchy of ATP-consuming processes in mammalian cells. Biochem J. 1995 Nov 15;312(Pt 1):163–167. PubMed PMID: 7492307; PubMed Central PMCID: PMCPMC1136240.
- Eriksson M, Ambroise G, Ouchida AT, et al. Effect of mutant p53 proteins on glycolysis and mitochondrial metabolism. Mol Cell Biol. 2017 Dec 15;37(24). DOI:10.1128/MCB.00328-17 PubMed PMID: 28993478; PubMed Central PMCID: PMCPMC5705820.
- DeBerardinis RJ, Chandel NS. Fundamentals of cancer metabolism. Sci Adv. 2016 May;2(5):e1600200. PubMed PMID: 27386546; PubMed Central PMCID: PMCPMC4928883.
- Lane N, Martin W. The energetics of genome complexity. Nature. 2010 Oct 21;467(7318):929–934. PubMed PMID: 20962839.
- Schwanhausser B, Busse D, Li N, et al. Global quantification of mammalian gene expression control. Nature. 2011 May 19;473(7347):337–342. PubMed PMID: 21593866.
- Sonenberg N, Hinnebusch AG. Regulation of translation initiation in eukaryotes: mechanisms and biological targets. Cell. 2009 Feb 20;136(4):731–745. PubMed PMID: 19239892; PubMed Central PMCID: PMCPMC3610329.
- Patel B, Cuervo AM. Methods to study chaperone-mediated autophagy. Methods. 2015 Mar;75:133–140. PubMed PMID: 25595300; PubMed Central PMCID: PMCPMC4355229.
- Freeman BC, Yamamoto KR. Disassembly of transcriptional regulatory complexes by molecular chaperones. Science. 2002 Jun 21;296(5576):2232–2235. PubMed PMID: 12077419.
- Hughes CS, Foehr S, Garfield DA, et al. Ultrasensitive proteome analysis using paramagnetic bead technology. Mol Syst Biol. 2014 Oct;30(10):757. PubMed PMID: 25358341; PubMed Central PMCID: PMCPMC4299378.
- Ritchie ME, Phipson B, Wu D, et al. limma powers differential expression analyses for RNA-sequencing and microarray studies. Nucleic Acids Res. 2015 Apr 20;43(7):e47. PubMed PMID: 25605792; PubMed Central PMCID: PMCPMC4402510.
- Yu G, He QY. ReactomePA: an R/Bioconductor package for reactome pathway analysis and visualization. Mol Biosyst. 2016 Feb;12(2):477–479. PubMed PMID: 26661513
- Edgar R, Domrachev M, Lash AE. Gene expression omnibus: NCBI gene expression and hybridization array data repository. Nucleic Acids Res. 2002 Jan 1;30(1):207–210. PubMed PMID: 11752295; PubMed Central PMCID: PMCPMC99122.