
ABSTRACT
Mitochondria are key organelles for cellular metabolism, and regulate several processes including cell death and macroautophagy/autophagy. Here, we show that mitochondrial respiratory chain (RC) deficiency deactivates AMP-activated protein kinase (AMPK, a key regulator of energy homeostasis) signaling in tissue and in cultured cells. The deactivation of AMPK in RC-deficiency is due to increased expression of the AMPK-inhibiting protein FLCN (folliculin). AMPK is found to be necessary for basal lysosomal function, and AMPK deactivation in RC-deficiency inhibits lysosomal function by decreasing the activity of the lysosomal Ca2+ channel MCOLN1 (mucolipin 1). MCOLN1 is regulated by phosphoinositide kinase PIKFYVE and its product PtdIns(3,5)P2, which is also decreased in RC-deficiency. Notably, reactivation of AMPK, in a PIKFYVE-dependent manner, or of MCOLN1 in RC-deficient cells, restores lysosomal hydrolytic capacity. Building on these data and the literature, we propose that downregulation of the AMPK-PIKFYVE-PtdIns(3,5)P2-MCOLN1 pathway causes lysosomal Ca2+ accumulation and impaired lysosomal catabolism. Besides unveiling a novel role of AMPK in lysosomal function, this study points to the mechanism that links mitochondrial malfunction to impaired lysosomal catabolism, underscoring the importance of AMPK and the complexity of organelle cross-talk in the regulation of cellular homeostasis.
Abbreviation: ΔΨm: mitochondrial transmembrane potential; AMP: adenosine monophosphate; AMPK: AMP-activated protein kinase; ATG5: autophagy related 5; ATP: adenosine triphosphate; ATP6V0A1: ATPase, H+ transporting, lysosomal, V0 subbunit A1; ATP6V1A: ATPase, H+ transporting, lysosomal, V0 subbunit A; BSA: bovine serum albumin; CCCP: carbonyl cyanide-m-chlorophenylhydrazone; CREB1: cAMP response element binding protein 1; CTSD: cathepsin D; CTSF: cathepsin F; DMEM: Dulbecco’s modified Eagle’s medium; DMSO: dimethyl sulfoxide; EBSS: Earl’s balanced salt solution; ER: endoplasmic reticulum; FBS: fetal bovine serum; FCCP: carbonyl cyanide-p-trifluoromethoxyphenolhydrazone; GFP: green fluorescent protein; GPN: glycyl-L-phenylalanine 2-naphthylamide; LAMP1: lysosomal associated membrane protein 1; MAP1LC3B/LC3B: microtubule associated protein 1 light chain 3 beta; MCOLN1/TRPML1: mucolipin 1; MEF: mouse embryonic fibroblast; MITF: melanocyte inducing transcription factor; ML1N*2-GFP: probe used to detect PtdIns(3,5)P2 based on the transmembrane domain of MCOLN1; MTORC1: mechanistic target of rapamycin kinase complex 1; NDUFS4: NADH:ubiquinone oxidoreductase subunit S4; OCR: oxygen consumption rate; PBS: phosphate-buffered saline; pcDNA: plasmid cytomegalovirus promoter DNA; PCR: polymerase chain reaction; PtdIns3P: phosphatidylinositol-3-phosphate; PtdIns(3,5)P2: phosphatidylinositol-3,5-bisphosphate; PIKFYVE: phosphoinositide kinase, FYVE-type zinc finger containing; P/S: penicillin-streptomycin; PVDF: polyvinylidene fluoride; qPCR: quantitative real time polymerase chain reaction; RFP: red fluorescent protein; RNA: ribonucleic acid; SDS-PAGE: sodium dodecyl sulfate polyacrylamide gel electrophoresis; shRNA: short hairpin RNA; siRNA: small interfering RNA; TFEB: transcription factor EB; TFE3: transcription factor binding to IGHM enhancer 3; TMRM: tetramethylrhodamine, methyl ester, perchlorate; ULK1: unc-51 like autophagy activating kinase 1; ULK2: unc-51 like autophagy activating kinase 2; UQCRC1: ubiquinol-cytochrome c reductase core protein 1; v-ATPase: vacuolar-type H+-translocating ATPase; WT: wild-type
Introduction
Mitochondria are multi-tasking cellular organelles with key roles in energy metabolism [Citation1]. Their importance for cell biology, however, extends beyond metabolism. These organelles are powerful signaling platforms regulating processes such as cell proliferation, differentiation, death, as well as autophagy [Citation2–Citation4].
Autophagy is a process of intracellular self-digestion that is used to recycle damaged or excessive cellular components, by sequestering them within cytoplasmic double-membrane compartments, termed autophagosomes [Citation5]. The autophagosomes subsequently fuse with the lysosomes (organelles containing degradative enzymes that can break down many proteins and biomolecules), allowing the contents of the autophagosomes to be degraded by lysosomal hydrolases [Citation5]. The process of autophagy is highly regulated at several steps, in particular at the level of autophagosome formation and degradation of autophagosomal cargo. Autophagosome formation is regulated by protein kinase A and by the AMPK-MTORC1-ULK1/2 signaling axis in response to amino acid availability and cellular energy charge [Citation6,Citation7]. Lysosomal-mediated autophagosomal degradation is regulated by several transcription factors (e.g., CREB, TFEB, MITF, TFE3) that promote the expression of a large set of genes encoding lysosomal proteins (lysosomal biogenesis), ultimately resulting in increased number and hydrolytic capacity of the lysosomes [Citation8,Citation9].
The energy-sensing AMPK (AMP-dependent protein kinase) is an important integrator of energy and metabolic cues [Citation10,Citation11]. It responds to energy stress caused by depletion in cellular ATP levels, for example as a result of acute inhibition of the mitochondrial respiratory chain or under glucose deprivation, as well as to cytoplasmic Ca2+ levels, reactive oxygen species and other stimuli [Citation10]. In addition to activation of autophagosome formation, AMPK stimulates both mitochondrial and lysosomal biogenesis [Citation11–Citation13]. Persistent activation of AMPK can, however, trigger apoptosis in vitro and in vivo [Citation14–Citation16]. The metabolic and signaling roles of AMPK place it at the crossroads between mitochondrial function and autophagy.
The interplay between mitochondria and autophagy is often focused on how mitochondria are regulated via mitophagy, i.e., selective autophagy of mitochondria [Citation17]. However, mitochondria also regulate the autophagy pathway, independently of mitophagy, in particular by regulating autophagosome formation [Citation18,Citation19]. Nevertheless, it remains unclear how autophagosome digestion is impacted in mitochondrial deficiency.
In the present study, we show that mitochondrial respiratory chain deficiency inhibits lysosomal hydrolysis. This prominent defect can be fully rescued by re-activation of AMPK signaling, or by direct activation of the lysosomal Ca2+ channel MCOLN1 (mucolipin 1). Importantly, we also show AMPK has a role in the regulation of basal lysosomal function, mediated by the generation of PtdIns(3,5)P2 and MCOLN1 activity. These results place AMPK at the core of a regulatory mechanism coordinating mitochondria-lysosome interplay.
Results
Chronic mitochondrial respiratory chain deficiency leads to accumulation of autophagosomes
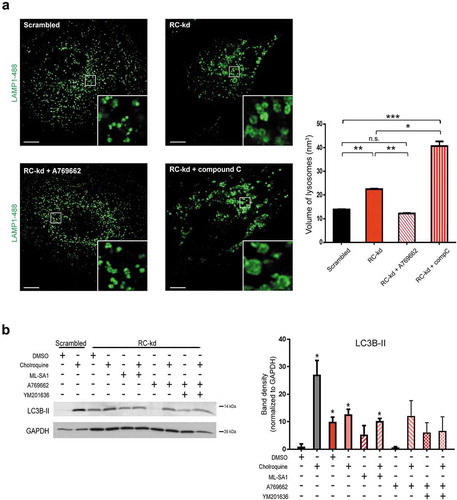
To study the consequences of chronic mitochondrial respiratory chain malfunction on the autophagy pathway, we prepared a cellular model of chronic respiratory chain deficiency by a stable shRNA-mediated knockdown of a subunit of respiratory chain complex III (UQCRC1/[ubiquinol-cytochrome c reductase core protein 1]) in HeLa cells (hereafter referred to as respiratory chain knockdowns or RC-kds). shRNAs with scrambled sequence were used as controls (HeLa scrambled). We tested 5 different shRNA constructs, of which we selected the 2 with the strongest knockdown efficiency evident both at protein (Fig. S1A) and transcript levels (Fig. S1B). These RC-kds cells showed a robust decrease in oxygen consumption rate (OCR) (Fig. S1C, quantified in S1D), and an increase in superoxide levels, as assessed by the superoxide-sensitive dye MitoSOX (Fig. S1E). The potential across the mitochondrial membrane (Δψm) was found to be modestly yet significantly decreased (Fig. S1F), as assessed by the ratio between MitoTracker Red (imported to mitochondria in a Δψm-dependent manner) and MitoTracker Green (imported independently of Δψm). The mitochondrial impairment in RC-kds was comparable to control cells treated with a complex III inhibitor, antimycin (Fig. S1G), and more moderate than treatment with the uncoupler FCCP (Fig. S1F-S1G). Altogether, these data show that the RC-kds cells have chronic respiratory chain malfunction.
To assess the effect of mitochondrial respiratory chain malfunction on the autophagy pathway, we first expressed a green fluorescent protein (GFP)-tagged autophagosomal marker protein, MAP1LC3B/LC3B (microtubule associated protein 1 light chain 3 beta) (GFP-LC3B), to determine the abundance of autophagosomes in RC-kd cells and controls. Increased numbers of autophagosomes were observed in the RC-kd cells ()), and their size was also mildly enlarged. To validate this observation, we measured the protein levels of the autophagosomal marker LC3B-II by western blot: the RC-kds cells presented increased levels of LC3B-II ()). Given that both RC-kds were behaving similarly, we focused on RC-kd1 (henceforth referred to as RC-kd) for a more detailed follow-up. We also observed increased GFP-LC3 signal in RC-kd by flow cytometry (Fig. S2A), further confirming the increased autophagosomal mass in RC-kds.
Figure 1. Respiratory chain deficiency causes lysosomal enlargement independently of autophagy. (a) Increase in the number of GFP-LC3-positive structures in the RC-kd cells. Representative equatorial (through the middle of the cell) plane confocal images show autophagosome distribution (by expression of the autophagosomal marker GFP-LC3) in HeLa cells with scrambled control (upper panel), or stable knock-down of the respiratory chain subunit UQCRC1 (RC-kd1 and RC-kd2, lower panel). Scale bar: 2 μm. The quantification of average lysosomal area is presented in the plot in the upper right panel as average ± s.e.m.(s.e.m), (scrambled N = 54 cells; RC-kd1 N = 60 cells; RC-kd2 N = 54 cells; from three independent experiments). ANOVA adjusted p-value *p < 0.05 **p < 0.001. (b) Western blot analysis of whole-cell extracts for LC3B in RC-kd and scrambled control HeLa cells, using GAPDH as loading control. The band for LC3B-II, a marker of autophagosomal mass, is increased in RC-kds. Column plot shows average plus standard deviation of at least three independent experiments, with duplicates in each experiment. ANOVA p-value *p < 0.05. (c) Autophagosomes remain undigested in the RC-kd cells. Representative spinning disk confocal images of autophagosome and lysosomes, by co-expression of the lysosomal marker LAMP1-GFP and of the autophagosomal marker RFP-LC3 in scrambled control or RC-kd HeLa cells, or HeLa cells treated with chloroquine, as a positive control for impaired lysosomal function. Scale bar: 0.5 μm. The insets on the right side show the magnification of the areas inside the squares. (d) Lysosomal volume is increased in the RC-kd cells. Representative confocal microscopy images of HeLa cells (scrambled, upper panel; or RC-kds, bottom panel) stained with anti-LAMP1 antibody (secondary conjugated with Alexa-488 fluorophore). Scale bar: 2 μm. The box plot on the upper right panel shows the distribution of the lysosomal volume across at least 50 cells obtained for each condition, obtained from three independent experiments, and also indicates the average volume and the standard deviation. T-test p-value **p < 0.005. The histogram on the lower right panel indicates the frequency distribution of lysosomal size in the control and RC-kd cells, showing that the RC-kds have less small lysosomes (<5 nm3) and a robust increase in the amount of very large lysosomes (>15 nm3). (e) Saturated lysosomes are detected in RC-kds. Representative electron micrographs showing the presence of electron-dense (saturated) lysosomes in RC-kd cells, which are rarely observed in control cells. Scale bar: 500 nm. The box plot on the upper right panel shows the distribution of the lysosomal volume across at least 12 cells obtained for each condition, obtained from 3 independent experiments, and also indicates the average volume and the standard deviation. T-test p-value *p < 0.05. The histogram on the lower right panel indicates the frequency distribution of lysosomal size in the control and RC-kd cells, showing that the RC-kds have less small lysosomes and an increase in the amount of very large lysosomes. (f) Lysosomal enlargement in RC-kds is not caused by excessive autophagosome trafficking. Representative confocal microscopy images of HeLa cells (scrambled, upper panel; or RC-kds, bottom panel), transfected with siRNA against ATG5 or a scrambled sequence (siRNA control), stained with anti-LAMP1 antibody (secondary conjugated with Alexa Fluor 488 fluorophore). Scale bar: 2 μm. The plot on the right panel shows the average ± s.e.m. lysosomal volume across at least 40 cells obtained for each condition, obtained from 2 independent experiments. ANOVA p-value **p < 0.01. The histogram on the bottom panel indicates the frequency distribution of lysosomal size in the control and RC-kd cells, showing that the silencing of ATG5 caused an increase in the number of larger lysosomes both in scrambled and RC-kd HeLa cells.
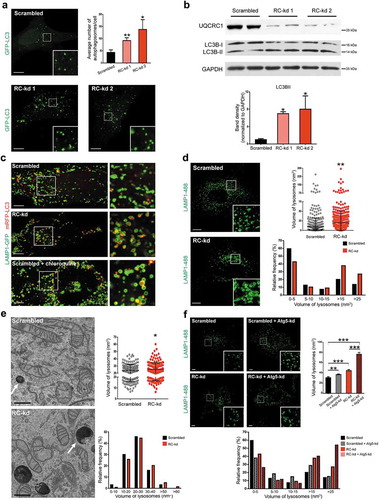
The accumulation of autophagosomes in the cell results from an imbalance between autophagosome formation and degradation. To determine whether autophagosome degradation was affected, we co-expressed LAMP1 (lysosomal associated membrane protein 1)-GFP and RFP-LC3, markers for lysosomes and autophagosomes, respectively. While in the control cells almost no RFP-LC3-positive signal was found inside lysosomes (), upper panel), the RC-kd cells showed a robust accumulation of undigested RFP-LC3 in LAMP1-GFP-positive compartments (), middle panel), suggesting that undigested RFP-LC3 remains inside lysosomes. Curiously, when control cells were treated with the lipophilic base chloroquine, which inhibits lysosomal acidification, a similar effect was observed, with prominent accumulation of undigested RFP-LC3 signal inside the LAMP1-GFP-positive lysosomal membrane (), bottom panel).
In addition to the undigested RFP-LC3-positive content, the lysosomes in RC-kd cells appeared enlarged (), middle panel). To examine lysosomal morphology in more detail, we detected LAMP1 in RC-kd and control cells by immunocytochemistry, and observed that while the number of LAMP1-positive compartments was not affected (Fig. S2B), the average size of LAMP1-positive puncta, indicating lysosomal volume, was significantly increased in the RC-kd (), quantification in the upper right panel). Specifically, the population of smaller LAMP1-positive lysosomes decreased in RC-kd, while the presence of larger LAMP1-positive lysosomes increased (), lower right panel). The protein extracts from RC-kd cells also showed an increase in the protein levels of lysosomal proteins, namely LAMP1 (Fig. S2C), and the lysosomal v-ATPase components ATP6V0A1 and ATP6V1A (Fig. S2D) in comparison to controls, showing that the RC-kd cells have increased levels of lysosomal proteins per cell. Finally, we also observed an increase in LysoTracker dye intensity in the RC-kd cells, as measured by flow cytometry (Fig. S2E). Interestingly, the phenotype that we have detected in RC-kd cells is reminiscent to the described lysosomal phenotype in Niemann-Pick lysosomal storage disease, in which increased intensity upon lysosomal staining with the dye LysoTracker was established as a biomarker for lysosomal enlargement [Citation20].
To exclude the possibility that these observations were an artifact of a clonal HeLa cell line and specific knock-down of UQCRC1 or of a subunit of respiratory chain complex III, we tested mouse embryonic fibroblasts (MEFs) lacking a subunit of respiratory chain complex I, ndufs4−/-, and the corresponding wild-type (WT) littermates. As observed in the RC-kd cells, the ndufs4−/- MEFs presented similar number of slightly enlarged LAMP1-immunostained lysosomes (Fig. S2F) and robustly increased LysoTracker intensity (Fig. S2G), indicating that the effect of chronic mitochondrial respiratory chain malfunction on lysosomal function is conserved across different cell lines, in accordance with our previous study [Citation13].
Lysosomes and lysosome-related organelles have a specific morphological signature that is best appreciated by high-resolution ultrastructural analysis using electron microscopy (EM) [Citation21]. Thus, we performed detailed EM-based analysis of RC-kd and control cells grown under standard cell culture conditions. The abnormality in lysosome morphology was strongly evidenced by electron micrographs, in which enlarged structures with electron-dense contents were abundantly and frequently observed in RC-kd while rarely detected in control cells (), quantification of size and distribution in the right panel), in agreement with our data obtained by light microscopy imaging and biochemistry.
It is possible that the lysosomal enlargement observed in RC-kd cells by various methods could be caused by excessive delivery of autophagosomal cargo. To test this possibility, we silenced the expression of ATG5 (autophagy related 5) protein, which is essential for the formation of the autophagosomes [Citation22]. Silencing of ATG5 in both RC-kd and control cells by siRNA increased the lysosomal size in both conditions ()), suggesting that the lysosomal enlargement observed in RC-kd was not caused by excessive trafficking of autophagosomal cargo.
Mitochondrial respiratory chain malfunction impairs lysosomal function by repressing the lysosomal Ca2+ channel MCOLN1
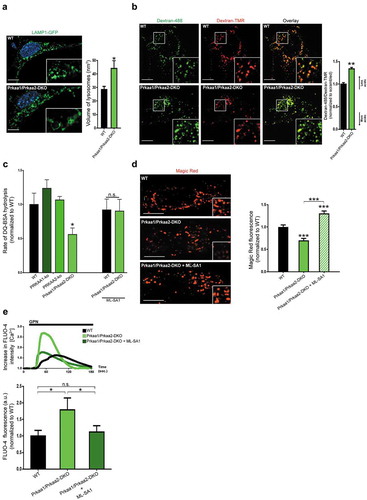
Because the enlargement of lysosomes in RC-kd cells did not appear to be a result of excessive delivery of autophagosomal cargo, and given that lysosomal defects often result in enlarged lysosomes [Citation20,Citation23,Citation24], we hypothesized that lysosomal function per se was impaired. The lysosomes have several diverse roles in cellular metabolism and homeostasis, particularly in hydrolysis of complex lipids and proteins as well as Ca2+ storage, that all depend on acidic lumenal pH [Citation25]. We probed lysosomal pH by using 2 complementary dextran-conjugated dyes (with the same molecular weight), which are endocytosed by the cell and accumulate selectively in the lysosomes. One set of dextran molecules is conjugated with Oregon Green, whose emission is quenched under acidic environments such as the lysosomal lumen, while the other is conjugated with TMRM, whose emission in the red spectrum is pH independent [Citation26]. Therefore, by determining the ratio between the green and red dextran-coupled fluorophores, it is possible to monitor the changes in lysosomal pH (more acidic, lower green:red ratio; less acidic, higher green:red). We verified these properties of the dextrans by setting the lysosomal pH in control cells at pH 4.0, pH 7.0 and pH 10.0. The green fluorescence was barely detectable at pH 4.0, while increasingly noticeable at neutral (pH 7.0) and alkaline (pH 10.0) pH (Fig. S3A). Accordingly, treatment of scrambled cells with the v-ATPase inhibitor bafilomycin A1 resulted in clear lysosomal alkalinization, as shown by a strong increase in the green dextran (Fig. S3A).The RC-kd cells presented a much higher green:red ratio than the control cells, indicating a lysosomal pH close to neutral (), Fig. S3A).
Figure 2. Respiratory chain deficiency causes impaired lysosomal function and accumulation of lysosomal Ca2+. (a) Lysosomal acidification is impaired in RC-kd. Representative equatorial plane confocal images of RC-kd and scrambled control HeLa cells stained with dextran-Oregon Green and dextran-TMRM. Scale bar: 2 μm. Dextran-Oregon Green is quenched under acidic pH, so increased green:red ratio denotes impaired lysosomal acidification. The average ± s.e.m. green:red ratio for at least 40 cells in 3 independent experiments is presented in the plot on the right panel (normalized to scrambled green/red = 1). (b) Decreased lysosomal proteolytic capacity in RC-kd. DQ-BSA is bovine serum albumin labelled with a green fluorophore. It is taken up by endocytosis, and delivered to the lysosomes. As a monomer, the fluorophore is too concentrated and the signal is quenched. As DQ-BSA is degraded by the lysosomal proteases, it releases monomers which emit fluorescence. This process is illustrated in the figure. The rate of DQ-BSA hydrolysis (increase of fluorescence units per min, per mg of protein) is a function of lysosomal proteases, and was measured using a plate reader over 2 h. The linear range was used to determine the rate. The average ± s.e.m. rate for each condition (20 wells in a 96-well plate) is presented in the plot on the upper right panel. These values are a representative experiment. Three independent experiments were performed, with at least 20 wells per condition. ANOVA p-value *p < 0.05 ***p < 0.001. (c) Increased lysosomal Ca2+ levels in RC-kds. Cells are loaded with the lysosomotropic compound Gly-Phe β-naphthylamide (GPN), which readily diffuses throughout the cell. When entering the lysosome, GPN is activated by CTSC, and the activated product forms pores in the lysosomal membrane which allow the release of lysosomal contents to the cytoplasm, including Ca2+. The increase in cytoplasmic Ca2+ upon GPN treatment is measured by changes in the fluorescence intensity of the cytoplasmic Ca2+ indicator Fluo-4 over time. The process is illustrated in the upper panel. The curves obtained for Fluo-4 fluorescence intensity over time scrambled and RC-kds cells are presented in the bottom panel (average of at least 32 cells per condition, in 3 independent experiments), normalized to the fluorescence intensity in the first frame. The increased magnitude of the peaks are a function of increased lysosomal Ca2+contents in RC-kds. The Fluo-4 intensity curves in the presence of ITPR/IP3R inhibitor xestospongin C are presented as dotted lines (here, average of 30 cells from 2 independent experiments is shown). (d) Quantification of the peak height in the GPN-induced release of lysosomal Ca2+ to cytoplasm, as an estimation of lysosomal Ca2+ contents. In the plot, the scrambled and RC-kds (RC-kd1 and RC-kd2) are shown (average ± s.e.m. of at least 29 cells per condition in 3 independent experiments) both under basal conditions and after treatment with MLSA1 20 µM for 4 h, prior to the GPN experiment. MLSA1 is an activator of MCOLN1, one lysosomal Ca2+ channel. The RC-kds have increased lysosomal Ca2+, which is normalized when the cells are treated with the activator of MCOLN1. ANOVA p-value *p < 0.05 ***p < 0.001; n.s. (e) Protein levels of MCOLN1 are not changed in RC-kd. Representative western blot of whole-cell extracts for MCOLN1 in RC-kd and scrambled control HeLa cells, in duplicate, using GAPDH as loading control. Column plot shows average plus standard deviation of at least 2 independent experiments, with duplicates in each experiment. T-test yielded a p-value>0.05 (non-significant, n.s.). (f) Lysosomal enlargement in RC-kd is rescued by reactivation of MCOLN1. Representative equatorial plane confocal images of HeLa cells (scrambled, upper panel; or RC-kds, bottom panel), treated with the MCOLN1 activator MLSA1 20 µM 4 h (or DMSO as vehicle control), stained with anti-LAMP1 antibody (secondary conjugated with Alexa Fluor 488 fluorophore). Scale bar: 2 μm. The plot on the right panel shows the average ± s.e.m. lysosomal volume across at least 45 cells obtained for each condition, obtained from 3 independent experiments. ANOVA p-value *p < 0.05,**p < 0.005. (g) Cytoplasmic Ca2+ levels are decreased in RC-kd, and return to control values upon MCOLN1 reactivation. Cytoplasmic Ca2+ levels were assessed using the cytoplasmic indicator Fluo-4, by flow cytometry in scrambled, RC-kd cells treated with MCOLN1 activator MLSA1 20 µM 4 h (or DMSO as vehicle control). The average distribution of cells per fluorescence intensity is plotted on the left panel. The quantification of the average ± st.dev of at least 3 independent replicates (repeated twice, representative experiment plotted) per condition is presented in the bar graph. ANOVA p-value *p < 0.05, ***p < 0.001.
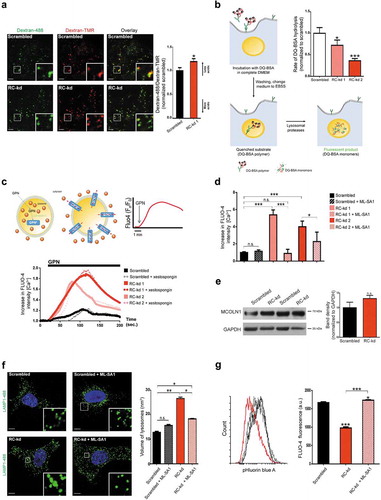
To assess if the increased pH had an impact in lysosomal proteolytic activity, we loaded the control and both RC-kd cell lines (to verify whether both RC-kd lines behave comparably also in key functional assays) with polymeric bovine serum albumin labelled with a green BODIPY dye (DQ Green BSA green; the assay is based on the fact that the high amount of fluorophore in polymeric DQ Green BSA has a quenching effect). Cells take up DQ Green BSA by endocytosis and it accumulates in the lysosomes [Citation27]. As the lysosomal proteases hydrolyze DQ Green BSA into small peptides, in which the fluorescence is no longer quenched, the fluorescent monomers accumulate and an increase in fluorescence is observed ()). In addition, the rate of this fluorescence increase is proportional to the activity of the lysosomal proteases. Both RC-kd1 and RC-kd2 also had a lower rate of DQ Green BSA hydrolysis, suggesting a decrease in the activity of lysosomal proteases in situ ()). We obtained a similar result using DQ Red BSA, thus discounting the possibility that the lower DQ-BSA hydrolysis rate was an artifact of fluorophore detection due to a different lumenal pH in the RC-kd cells (data not shown). To exclude the possibility that the DQ-BSA result was affected by possible differential uptake of DQ-BSA in the RC-kd versus control cells, we also employed the Magic Red assay. This dye diffuses through cellular membranes and therefore cannot be affected by possible differential endocytic rates. When Magic Red is activated by cathepsins in the lysosome, the product triggers a red fluorescent signal. The RC-kd cells also had lower Magic Red fluorescence, supporting decreased lysosomal cathepsin activity (Fig. S3B). Importantly, the treatment of control cells with the lysosomal inhibitor chloroquine results in decreased Magic Red intensity (Fig. S3B) as well as decreased DQ-BSA degradation (Fig. S3C), thus validating the use of these assays and supporting decreased lysosomal proteolytic function in RC-kd cells. It is noteworthy that the ndufs4−/- MEFs also showed decreased lysosomal DQ-BSA degradation (Fig. S2H).
The lysosomal storage of Ca2+ also depends on the acidic pH [Citation28], therefore we assessed the lysosomal Ca2+ levels ([Ca2+]L). We exposed the RC-kd and control cells to glycyl-L-phenylalanine 2-naphthylamide (GPN), a compound that when activated in the lysosomal lumen by CTSC (cathepsin C) forms pores in the lysosomal membrane through which Ca2+ and other lysosomal components are released [Citation29]. We monitored the changes in cytoplasmic [Ca2+] upon lysosomal permeabilization using membrane-permeable Ca2+-sensitive dye, Fluo-4 AM ()). Interestingly, upon permeabilization, lysosomes in RC-kd cells release on average ~4–5-fold more Ca2+ to the cytoplasm than control cells ()). Representative time-lapse images of Fluo-4-stained control and RC-kd cells are presented in Video SV1. This result is unexpected given that it is widely accepted that when lysosomal pH increases, the organelle releases Ca2+ in the cytosol [Citation28]. Importantly, pre-treatment of the cells with xestospongin C, an inhibitor of Ca2+ release through ITPRs/IP3 receptors in the endoplasmic reticulum, had no effect on the GPN-induced lysosomal Ca2+ release ()). These data exclude the possibility that Ca2+ from the endoplasmic reticulum was a confounding factor. Therefore, Ca2+ accumulates in the lysosomes in RC-kd cells. Given that this occurs under conditions of neutral lysosomal pH, it implies that the conventional mechanisms of lysosomal Ca2+ release are impaired. Thus, we tested the properties of lysosomal Ca2+ release in the RC-kd model.
Lysosomes have several Ca2+ channels, including 2 large families of MCOLN and two-pore channels. The loss-of-function, or the deletion, of one of the MCOLN channels, MCOLN1 (mucolipin 1), result in enlarged lysosomes, lysosomal Ca2+ accumulation and increased pH [Citation24], all of which are observed in the RC-kd cells. Furthermore, MCOLN1 is the only lysosomal Ca2+ channel that is required for autophagy and lysosomal biogenesis, via activation of PPP3/calcineurin and TFEB (transcription factor EB) [Citation30,Citation31]. Interestingly, unlike control cells, neither the RC-kd cells (Fig. S4A), nor ndufs4−/- MEFs (Fig S4B), were able to induce lysosomal biogenesis, both under basal conditions, or upon amino acid starvation. Given the curious overlap between the cellular phenotypes of MCOLN1 loss-of-function and the RC-kd lines, we tested the possibility that MCOLN1 abundance and/or function is altered in the RC-kd lines. To first test if the accumulation of lysosomal Ca2+ in RC-kd lines was related with MCOLN1, we treated the cells with the MCOLN1-specific activator MLSA1 [Citation32] 20 µM for 4 h (or DMSO as control), and most interestingly observed that the lysosomal Ca2+ levels in the RC-kd lines were returned to the values comparable to the control line (); representative time-lapses in Video SV1; note that no effect of MLSA1 was observed on the control cells). Given that both RC-kd cell lines gave similar results in all functional assay that assess lysosomal proteolysis and Ca2+, we proceeded again with just one RC-kd (RC-kd1) line. Notably, the protein levels of MCOLN1 were not altered in the RC-kd cells ()), suggesting that the accumulation of Ca2+ in lysosomes is due to aberrant MCOLN1 activity. Interestingly, we observed that reactivation of MCOLN1 in RC-kd cells, by treatment with MLSA1, also allowed the lysosome to reacidify (Fig. S3A).
We next sought to determine if increasing the activity of MCOLN1 and normalizing the lysosomal Ca2+ levels and pH was sufficient to rescue the lysosomal enlargement in RC-kd cell lines. Thus, we treated the control and RC-kd cells with MLSA1 20 µM for 4 h (or DMSO as control), and inspected lysosomal morphology by antibody staining against LAMP1. We observed, as before, that lysosomes were enlarged in RC-kd, but remarkably MLSA1 treatment restored lysosomal volume to the control values (); the MLSA1 treatment per se had no effect on the lysosomal volume in control cells). These data show that reactivation, or increased activity, of MCOLN1 channel is sufficient to normalize both lysosomal morphology, Ca2+ levels and pH in RC-kd cells.
To test whether the normalization of lysosomal volume caused by MCOLN1 activation in RC-kd cells had impacted lysosomal function, we employed the DQ-BSA and Magic Red functional assays. Indeed, RC-kds treated with MLSA1 to reactivate MCOLN1 showed an improvement in lysosomal activity to control levels, both as assessed by Magic Red (Fig. S3B) and by DQ-BSA (Fig. S3C). We further confirmed this result with another functional assay based on acridine orange. Acridine orange is a lipophilic amine, which freely diffuses across the cell. Upon repeated exposure to blue light in the acidic environment of the lysosome, acridine orange becomes phototoxic, damaging the lysosomal membrane and eventually causing its rupture [Citation33]. The lysosomal acridine orange then leaks into the neutral cytoplasmic pH, where its fluorescence emission is shifted from red to green [Citation34,Citation35]. Discrete events of lysosomal disintegration can be observed in time lapse imaging, as shown in Video SV2 (top row, control cells; medium row, RC-kd cells; bottom row, RC-kd cells treated with MLSA1). The kinetics of lysosomal disintegration due to acridine orange phototoxicity is slower when the lysosomes are impaired [Citation35]. We observed that the control cells lost acridine orange lysosomal fluorescence in ~60 s (Fig. S5A). Yet, the RC-kd cells retained lysosomal acridine orange fluorescence even at ~120 s (Fig. S5A), and this was corrected by activation of MCOLN1 using MLSA1 (Fig. S5A). The disappearance of lysosomal acridine orange signal in a representative organelle for each condition is depicted in Fig. S5B. Overall, the loss of lysosomal acridine orange was significantly slower in the RC-kd cells, in line with our data showing that lysosomal function is impaired in RC-kd cells. The treatment of RC-kd cells with MLSA1 was able to normalize the function of lysosomes (Fig. S5C). These data also illustrate the consequences of impaired MCOLN1 activity for lysosomal function in RC-kd cells.
Notably, the accumulation of Ca2+ in the lysosomes of RC-kd cells has consequences for the cellular Ca2+ homeostasis, because cytoplasmic Ca2+ levels appeared to be decreased in RC-kd and were returned to control levels after MCOLN1 activation by MLSA1 treatment, as assessed by intensity of the cytoplasmic Ca2+-dye Fluo-4 in basal conditions ()). Altogether, these data show that Ca2+ accumulation in lysosomes of RC-kd cells is due to reduced or abolished MCOLN1 activity, which also has consequences for cellular Ca2+ homeostasis because it affects Ca2+ levels both in the lysosome (excess Ca2+) and in the cytoplasm (decreased Ca2+).
Downregulation of MCOLN1 is caused by decreased AMPK signaling
The activity of MCOLN1 is stimulated by PtdIns(3,5)P2, which is synthesized by the enzyme PIKFYVE in the lysosomal membrane [Citation36]. AMPK has been suggested to activate PIKFYVE [Citation37], and is also a known responder to mitochondrial stress [Citation10]. Given that the RC-kd cells show accumulation of lysosomal Ca2+ and decreased activity of MCOLN1, we set to test whether AMPK may control the activity of MCOLN1 via the PIKFYVE-PtdIns(3,5)P2-MCOLN1 pathway ()). Despite HeLa cells lacking the LKB1 protein [Citation38], which is necessary for activation of AMPK by AMP [Citation39], it has been shown that AMPK gets activated in response to energy stress in these cells [Citation40], which therefore can be employed as a model.
Figure 3. AMPK signaling is downregulated in RC-kd. (a) Schematic representation of the pathway presumably linking AMPK with MCOLN1 activity. (b) Western blot analysis of whole-cell extracts (first 2 lanes) as well as extracts obtained from AMPK immunoprecipitation, using a pan-antibody against PRKAA1 and PRKAA2. Lanes 3–4 show two independent experiments of AMPK immunoprecipitate in control cells, and lanes 5–6 show 2 independent experiments of AMPK immunoprecipitate in RC-kd cells. Lanes 7–8 show the unbound eluate, and lane 9 is the negative control. The proteins detected include AMPK and PIKFYVE, which is readily detected in the AMPK immunoprecipitate. GAPDH is detected in the input samples and in the unbound eluate, but not in the AMPK immunoprecipitate, demonstrating specificity of the interaction between AMPK-PIKFYVE. (c) Decreased phosphorylation of AMPK targets in RC-kd. Western blot analysis of whole-cell extracts for UQCRC1, AMPK, p-AMPK (T172), TSC2. p-TSC2 (S1387) and PIKFYVE in RC-kd and scrambled control HeLa cells, using GAPDH as loading control. The bands for UQCRC1, p-AMPK and p-TSC2 are decreased in RC-kds, while there is no change in PIKFYVE protein amount, as shown in the plots on the right side. Column plot shows average±s.d. of 3 independent experiments, with duplicates in each experiment. T-test p-value *p < 0.05 (d) Decreased PtdIns(3,5)P2 levels in the lysosomes of RC-kd cells, returned to control levels by reactivation of AMPK. Representative equatorial plane confocal images of HeLa cells (scrambled with vehicle control DMSO; scrambled with PIKFYVE inhibitor YM201636 1 μM 4 h; RC-kds with vehicle control DMSO; RC-kd treated with AMPK activator A769662 100 μM 4 h), cotransfected with ML1N*2-GFP and LAMP1-RFP. The localization of the ML1N*2-GFP probe to the lysosome is related to the lysosomal PtdIns(3,5)P2 content. Scale bar: 2 μm. The plot presents the quantification of PtdIns(3,5)P2 fluorescence on microscopy images of HeLa, scrambled and RC-kd, cotransfected with ML1N*2-GFP and LAMP1-RFP. Control cells were also treated with the PIKFYVE inhibitor YM201636 1 μM 4 h, and RC-kd were treated with AMPK activator A769662 100 μM 4 h (or DMSO as vehicle control). The plot shows the average±s.e.m ML1N*2-GFP intensity on the spots marked with LAMP1-RFP, across 45 cells for each condition, obtained from 3 independent experiments. ANOVA p-value **p < 0.005; ***p < 0.001; n.s., non-significant.
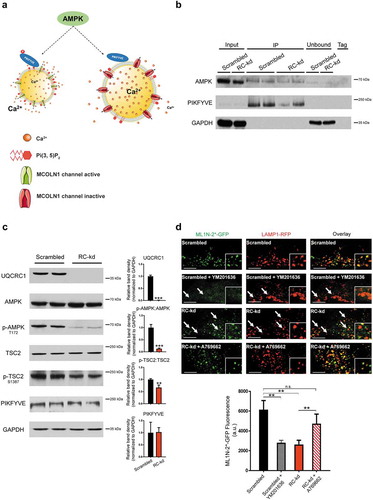
First, we tested if we could observe a direct interaction between AMPK and PIKFYVE. We immunoprecipitated AMPK, and could detect PIKFYVE as one of its interactors ()). However, the amount of PIKFYVE interacting with the AMPK alpha subunits was similar in RC-kd and control cells (), lanes 3–4 for scrambled and 5–6 for RC-kd). Thus, AMPK interacts with PIKFYVE to a similar extent in control and RC-kd cells, and therefore this interaction alone cannot explain a decrease in the PIKFYVE-MCOLN1 pathway in RC-kd cells.
We then tested if AMPK activity is affected in RC-kd cells. Using western blotting, we found that phosphorylation of AMPK Thr172, which is indicative of its activity, was decreased in RC-kd cells, suggesting that AMPK signaling was downregulated ()). Accordingly, phosphorylation of AMPK-target site Ser1387 in TSC2 (tuberous sclerosis complex 2) was also decreased in RC-kd cells, substantiating decreased AMPK activity in these cells ()). Interestingly, when scrambled HeLa were treated for 4 h with antimycin (an inhibitor of respiratory chain complex III), there was an increase in AMPK activity, as assessed by phosphorylation of AMPK and its target TSC2 (Fig. S6A). However, the same treatment in the RC-kd cells has no effect on AMPK activity (Fig. S6A). These results highlight that HeLa cells can activate AMPK in response to energy stress, a response that is impaired in the RC-kd cells.
Because MCOLN1 function is defective in RC-kd cells, and MCOLN1 is regulated by the PIKFYVE-PtdIns(3,5)P2-MCOLN1 pathway, we hypothesized that the decrease in AMPK activity might result in depression of the PIKFYVE-PtdIns(3,5)P2-MCOLN1 pathway, thus impairing lysosomal function. Indeed, the inability of a cell to synthesize PtdIns(3,5)P2 due to defects in PIKFYVE or associated enzymes results in enlarged lysosomes [Citation41]. Accordingly, treatment with 1 µM of the PIKFYVE inhibitor YM201636 for 4 h caused lysosomal enlargement in both control and RC-kd cells (Fig. S7).
We subsequently assessed whether the observed decrease in AMPK signaling has consequences for the levels of PtdIns(3,5)P2. We assessed PtdIns(3,5)P2 using a genetic probe consisting of the transmembrane segment of MCOLN1 fused with GFP (ML1N*2-GFP) [Citation42]. This is the region of MCOLN1 that interacts with PtdIns(3,5)P2 [Citation42], and therefore the probe is expected to be recruited to the membranes where PtdIns(3,5)P2 is present (which is mostly the lysosomal membrane) in a manner proportional to the amount of lipid. To control for the possibility of mislocalization of the ML1N*2-GFP probe [Citation43], we co-expressed it with the lysosomal marker LAMP1-RFP. First, as a control for PtdIns(3,5)P2 specificity, we tested if the signal was decreased upon PIKFYVE inhibition. We treated scrambled cells with the PIKFYVE inhibitor YM201636 1 µM 4 h, and observed that the ML1N*2-GFP probe presented a weak, diffuse staining ()). This result suggests that in the conditions we are employing, the ML1N*2-GFP probe seems specific for PtdIns(3,5)P2. We further observed that the intensity of the ML1N*2-GFP signal in the lysosome (areas of overlap between LAMP1-RFP and ML1N*2-GFP; GFP intensity measured) was lower in RC-kd cells compared to control cells, suggesting decreased amounts of PtdIns(3,5)P2 in the lysosomal membranes of RC-kd cells ()). This was not a consequence of decreased amounts of PIKFYVE protein in RC-kd cells ()), therefore PIKFYVE is likely inhibited under these conditions. Interestingly, one of the most prevalent cellular phenotypes of loss of PIKFYVE activity is the accumulation of undigested contents in the lysosomes [Citation41,Citation44], consistent with our observations in RC-kd cells.
We then tested if reactivating AMPK signaling in the RC-kd cells, with the compound A769662, a widely accepted specific activator of AMPK [Citation45], would lead to an increase in PtdIns(3,5)P2 levels. This compound activates AMPK independently of STK11/LKB1, and therefore is also effective in HeLa cells [Citation46]. We observed that the activation of AMPK restores the levels of PtdIns(3,5)P2 in the RC-kd to control levels, as assessed by co-expression of ML1N*2-GFP and LAMP1-RFP ()). Altogether, these data suggest that AMPK signaling regulates, at least in part, the production of PtdIns(3,5)P2 and, through it, the activity of MCOLN1.
Downregulation of AMPK signaling in RC-kd is caused by the induction of FLCN expression
Since AMPK signaling is usually found to be increased in response to acute mitochondrial respiratory chain malfunction, the decreased AMPK activity observed in RC-kd might seem counterintuitive. Therefore, we sought first to test what happens to the AMPK signaling in an in vivo system of chronic mitochondrial respiratory chain malfunction. The ndufs4−/- mice are a model of mitochondrial dysfunction that results in disease characterized by encephalopathy and prematurely dying at ~7 weeks of age [Citation47]. We used brain homogenates from ndufs4−/- mice and their WT littermates to probe the AMPK pathway by western blot, and found that AMPK signaling, as assessed by the phosphorylation of AMPK target ACAC/ACC (acetyl-CoA carboxylase), was downregulated in the ndufs4−/- brain (Fig S8A, quantified in S8B). Therefore, the decreased AMPK signaling in RC-kd cells is consistent with downregulation of AMPK signaling under chronic mitochondrial respiratory chain malfunction.
Next, we explored the reasons underlying AMPK downregulation. The termination of AMPK signaling is poorly studied, and to our knowledge the only protein known to directly inhibit AMPK activity is the tumor-suppressor FLCN. FLCN forms a heterotrimer with FNIP1 (folliculin interacting protein 1) and FNIP2, and such a complex inhibits AMPK activity [Citation48]. In support of decreased AMPK activity in the RC-kds cells, FLCN and FNIP1 proteins were more abundant in whole cell extracts of RC-kds ()). This may result from increased transcription, because the transcripts of FLCN, FNIP1 and FNIP2 were all upregulated in RC-kds ()). To test if FLCN is directly responsive to mitochondrial stress, we treated control cells with an inhibitor of mitochondrial respiratory chain complex III, antimycin, for short (1–4 h) and long (48 h) periods. We observed that the protein levels of FLCN and FNIP remained mostly unaltered during the acute treatments, but were robustly increased by the long-term mitochondrial respiratory chain inhibition (Fig. S6B). Notably, the transcript levels of FLCN, FNIP1 and FNIP2 were downregulated during the acute treatments, but upregulated after 48 h of treatment (Fig. S6C). FNIP2 was also downregulated in acute inhibition but remained unaffected in the long-term treatment () and Fig. S6C). Thus, the transcript levels of FLCN and FNIP1 were responsive to long-term mitochondrial respiratory chain deficiency, both in the RC-kd cells and under pharmacological inhibition (antimycin).
Figure 4. FLCN represses AMPK signaling in RC-kd cells. (a) Western blot analysis of whole-cell extracts for FLCN and FNIP1 in RC-kd and scrambled control HeLa cells, using GAPDH as loading control. Both proteins are more abundant in RC-kds. Column plot shows average plus standard deviation of 2 independent experiments, with duplicates in each experiment. ANOVA p-value *p < 0.05. (b) Transcript levels of FLCN, FNIP1 and FNIP2 measured by quantitative RT-PCR, in control and RC-kd cells, calculated by the ΔΔCt method using GAPDH as a control gene. Column plot shows average plus standard deviation of at least 3 independent experiments, with duplicates in each experiment. T-test p-value ***p < 0.001. (c) Western blot analysis of control and RC-kd whole-cell extracts with FLCN silencing (siRNA FLCN) or with control siRNA (siRNA ctrl), using GAPDH and HPRT as loading controls. Decrease of FLCN leads to the reactivation of AMPK signaling. Column plot shows average plus standard deviation of 2 independent experiments. T-test p-value *p < 0.05, **p < 0.01 against basal condition (scrambled+siRNA ctrl). (d) FLCN silencing in RC-kd cells normalizes lysosomal volume. Representative equatorial plane confocal images of HeLa cells (scrambled, left side; or RC-kds, right side), with FLCN silencing (bottom panel) or control siRNA (upper panel), stained with anti-LAMP1 antibody (secondary conjugated with Alexa Fluor 488 fluorophore). Scale bar: 5 μm. The column plot on the upper right panel shows the average±st.d. of the lysosomal volume across 30 cells acquired for each condition, obtained from 2 independent experiments. ANOVA p-value **p < 0.05, ***p < 0.001 (e) FLCN silencing restores lysosomal acidification in RC-kd. Representative spinning-disk microscopy images of RC-kd and scrambled control HeLa cells, with FLCN siRNA or scrambled control siRNA, stained with dextran-Oregon Green and dextran-TMRM. Scale bar: 5 μm. Dextran-Oregon Green is quenched under acidic pH, so increased green:red ratio denotes impaired lysosomal acidification. The average ± st.d green:red ratio for 30 cells from 2 independent experiments is presented in the plot on the right panel (normalized to scrambled green:red = 1). ANOVA p-value ***p < 0.001.
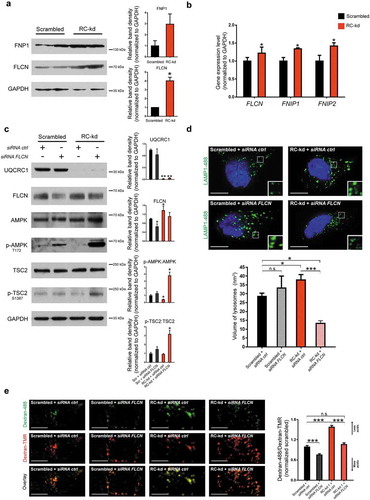
We tested 2 antibodies against FLCN and FNIP1 in mouse cells and tissues, yet they did not work and/or were not specific in our hands. Because in the RC-kds the upregulation in expression of FLCN, FNIP1 and FNIP2 was also observed at transcript levels, we tested their transcript levels in ndufs4−/- MEFs and brain. We observed an upregulation of the transcript levels of Flcn, Fnip1 and Fnip2 in ndufs4−/- MEFs (Fig. S6D), and of Flcn and Fnip1 in ndufs4−/- brain (Fig. S6E). Altogether, these results suggest that FLCN induction is a specific consequence of chronic, but not acute, mitochondrial respiratory chain impairment.
We then tested if silencing of FLCN might be beneficial for the RC-kds cells, using siRNA. First, we observed that the siRNA against FLCN was efficient ()). The activity of AMPK was clearly induced by the silencing of FLCN ()), as assessed by the phosphorylation of AMPK and of its target TSC2. This result is in agreement with the known repressor role of FLCN on AMPK, and underscores that silencing of FLCN in RC-kd cells was sufficient to return AMPK activity to control levels. Notably, the partial silencing of FLCN yielded a much stronger effect in AMPK in the RC-kd cells than in the controls.
Next, we tested if the silencing of FLCN had beneficial effects on lysosomal function. We assessed lysosomal size by immunohistochemistry against LAMP1, and observed that silencing FLCN in RC-kd cells returned lysosomal size to control levels ()). Interestingly, silencing of FLCN in scrambled cells resulted in a trend for lysosomal enlargement, underscoring that forcing the levels of FLCN to go below the baseline has negative consequences ()). The acidification of the lysosome was comparable to control levels in RC-kd with FLCN silencing ()). Curiously, the silencing of FLCN in RC-kds cells caused an increase in the expression of lysosomal genes (Fig. S6F), indicating a normalization of the lysosomal Ca2+ efflux through MCOLN1, necessary for TFEB activity [Citation30]. However, despite the silencing of FLCN in RC-kd being sufficient to rescue lysosomal size and pH, the activity of the lysosomes as assessed by DQ-BSA remained unaffected (Fig. S6G) in RC-kds, and decreased robustly in control cells, underscoring that efficient lysosomal function can only occur within a limited range of folliculin levels.
AMPK is required for basal lysosomal function
The decrease in AMPK signaling observed in RC-kd and the downstream consequences for PIKFYVE and MCOLN1 suggest that AMPK might have a role in the regulation of lysosomal function. To test if this role takes place exclusively during chronic mitochondrial stress or also under basal conditions, we took advantage of MEFs lacking AMPK activity. AMPK functions as a heterotrimer, containing 1 catalytic (PRKAA/α) subunit and 2 regulatory subunits (PRKAB/β and PRKAG/γ). Mammals have 2 genes encoding the catalytic α subunit, PRKAA1 and PRKAA2 [Citation49]. To test if loss of AMPK activity is sufficient to impair lysosomal function, we used MEFs with defective or absent AMPK activity, derived from knockouts of the genes encoding the catalytic subunits, Prkaa1, Prkaa2 or Prkaa1 Prkaa2 double knockout (DKO).
We first tested if complete absence of AMPK signaling (in DKO MEFs) affected lysosomal morphology, by assessing lysosomal size using LAMP1-GFP ()). We observed that AMPK-DKO MEFs had a robust increase in the size of lysosomes. Next, we tested if the lysosomal pH was affected in AMPK-DKO MEFs using the dextran approach described above. The AMPK-DKO MEFs showed decreased lysosomal acidity, as assessed by the dextran approach ()). We then tested if lysosomal function was also impaired in AMPK-DKO, using the DQ-BSA assay. Indeed, there was a robust decrease in DQ-BSA degradation in the absence of AMPK signaling ()). Interestingly, the 2 catalytic subunits of AMPK, PRKAA1 and PRKAA2, seemed to be redundant for lysosomal function in these cells, because loss of either one, individually, had no effect in lysosomal proteolytic capacity ()). Notably, the decrease in lysosomal function in AMPK DKO could be rescued by treatment with the MCOLN1 activator MLSA1 ()). We further validated this result using the Magic Red assay, which also showed a robust decrease in lysosomal proteolytic activity in AMPK DKO cells, which was fully rescued by treatment with MLSA1 ()). Altogether, these results support the idea that AMPK activity is an upstream regulator of the PIKFYVE-PtdIns(3,5)P2-MCOLN1 axis even in basal conditions, in the absence of mitochondrial defects.
Figure 5. Impaired lysosomal function in AMPK-deficient cells. (a) Increased lysosomal volume in cells lacking AMPK activity (prkaa1 prkaa2 double-knockout MEFs, AMPK DKO). Representative equatorial plane confocal images of mouse embryonic fibroblasts derived from WT (upper panel) or AMPK DKO (lower panel) mice, transfected with LAMP1-GFP. Scale bar: 2 μm. The column plot on the right shows the average±st.d. of the lysosomal volume across at least 60 cells acquired for each condition, from 2 independent experiments. T-test p-value *p < 0.05 (b) Equatorial plane confocal images of AMPK DKO and WT MEF cells stained with dextran-Oregon Green and dextran-TMRM. Scale bar: 3 μm. Dextran-Oregon Green is quenched under acidic pH, so increased green:red ratio denotes impaired lysosomal acidification. The average ± s.e.m. green:red ratio for 40 cells from 2 independent experiments is presented in the plot on the right panel (normalized to WT green:red = 1). (c) Decreased lysosomal proteolytic capacity in AMPK DKO MEFs, which was rescued after reactivation of the lysosomal Ca2+ channel MCOLN1. The rate of DQ-BSA hydrolysis (increase of fluorescence units per min, per mg of protein) is a function of lysosomal proteases, and was measured using a plate reader over 2 h. The linear range was used to determine the rate. The average±st.d. rate for each condition (20 wells in a 96-well plate) is presented in the plot on the upper right panel. These values are a representative experiment. Three independent experiments were performed, with 20 wells per condition. ANOVA p-value *p < 0.05; n.s., non-significant. (d) Decreased activation of Magic Red dye in AMPK DKO MEFs. Magic Red freely diffuses through the cell, and upon activation in the lysosomes, it emits red fluorescence proportional to the activity of lysosomal CTSB. The AMPK DKO cells present a sharp decrease in the activation of Magic Red, which is normalized by treatment with the MCOLN1 activator MLSA1 20 µM 4 h (DMSO as vehicle control). The column plot shows the average±st.d. intensity of Magic Red signaling from 40 cells per condition from 2 independent experiments. ANOVA p-value ***p < 0.001 (e) Increased lysosomal Ca2+ in AMPK DKO MEFs. Cells are loaded with the lysosomotropic compound Gly-Phe β-naphthylamide (GPN), which readily diffuses across the cell. When entering the lysosome, GPN is activated by CTSC, and the activated product forms pores in the lysosomal membrane which allow the release of lysosomal contents to the cytoplasm, including Ca2+. The increase in cytoplasmic Ca2+ upon GPN treatment is measured by changes in the fluorescence intensity of the cytoplasmic Ca2+ indicator Fluo-4 over time. The curves obtained for Fluo-4 fluorescence intensity over time scrambled and RC-kds cells are presented in the bottom panel (average of at least 30 cells per condition; 2 independent experiments were performed), normalized to the fluorescence intensity in the first frame. The increased magnitude of the peaks are a function of increased lysosomal Ca2+contents in AMPK DKO, and the average±st.d. of the peaks are presented in the column plot below. ANOVA p-value *p < 0.05.
To confirm this possibility, we tested if the lysosomal Ca2+ levels were affected in AMPK DKO cells, using the GPN-Fluo4 approach described above. Most interestingly, AMPK DKO cells had increased lysosomal Ca2+, which could be rescued by treatment with the MCOLN1 activator MLSA1 ()), in line with the result obtained for the proteolytic activity and with the results from the RC-kd cells (representative time lapse images in Video SV3). The pre-treatment of the MEFs with xestospongin had no effect on the GPN-induced lysosomal Ca2+ release (data not shown). Overall, these data show that, in physiological conditions, AMPK activity is needed to regulate MCOLN1 and is thus required for proper lysosomal function.
Reactivation of AMPK rescues lysosomal function
Given that reactivation of AMPK in RC-kd cells rescued the levels of PtdIns(3,5)P2 (as shown above in )), we hypothesized that it may also rescue MCOLN1 function and consequently lysosomal enlargement. Indeed, treatment of RC-kd with the AMPK activator A769662 lead to normalization of lysosomal volume ()). Reciprocally, treatment of RC-kd with dorsomorphine (also known as ‘compound C’), a routinely employed AMPK inhibitor [Citation49], resulted in exacerbation of the lysosomal enlargement phenotype ()), suggesting that the activity of AMPK was inhibited but not completely ablated in RC-kd cells, in agreement with the western blot data on AMPK activity. AMPK activation is known to repress MTORC1 signaling [Citation50]. Therefore, we tested if the repression of MTORC1 in RC-kd cells was sufficient to restore the lysosomal size. Treatment with RC-kd cells with the MTORC1-specific inhibitor Torin1 resulted in exacerbation of the lysosomal enlargement phenotype (Fig S9), implying that the rescue of lysosomal size by AMPK activation in RC-kd cells cannot be attributed to the repression of MTORC1.
Figure 6. AMPK activation rescues lysosomal size. (a) Lysosomal enlargement in RC-kd cells is rescued by AMPK reactivation. Representative Airyscan confocal equatorial plane images of scrambled or RC-kd HeLa cells, treated with A769662 or compound C (DMSO as vehicle control), and stained with anti-LAMP1 antibody (secondary conjugated with Alexa Fluor 488 fluorophore). Scale bar: 3 μm. The measurement of the lysosomal volume across at least 40 cells obtained for each condition from 2 independent experiments, is plotted on the right panel as average±s.e.m.. ANOVA p-value *p < 0.05, **p < 0.005 and ***p < 0.001. (b) Reactivation of AMPK signaling in RC-kd restores autophagosome digestion. Western blot analysis of whole-cell extracts for LC3B in RC-kd and scrambled control HeLa cells, using GAPDH as loading control. Every condition was also subject to the treatment with the lysosomal inhibitor chloroquine, to assess the amount of autophagosomes that accumulate specifically due to lysosomal impairment. The band for LC3B-II, a marker of autophagosomal mass, is increased in RC-kds and rescued by activation of AMPK. This rescue is dependent on the activity of PIKFYVE (inhibited by YM201636). Column plot shows average±s.d. of 2 experiments. ANOVA p-value *p < 0.05 (against control condition in the absence of chloroquine, lane 1).
Because AMPK activation in the RC-kd cells restored lysosomal size to normal, we next tested if lysosomal function was also improved. We showed earlier (see ) that lysosomal impairment in RC-kds resulted in accumulation of autophagosomes. When we treated the RC-kd cells with the AMPK activator A769662, a clear decrease in autophagosomal LC3B-II was observed ()), denoting that the lysosomes are processing the autophagosomal cargo. It is important to note that AMPK is known to stimulate the formation of new autophagosomes, so the decrease in the levels of LC3B-II cannot be attributed to reduced autophagosome formation, but rather to increased lysosomal catabolic activity. Nevertheless, to objectively distinguish these 2 possibilities, we treated a batch of cells in each condition with chloroquine, which inhibits lysosomal degradation and thus demonstrably shows that the accumulation of autophagosomal cargo in RC-kd was caused by lysosomal impairment, and the resolution of the lysosomal malfunction restored autophagosome contents to control levels ()). Notably, the rescue of lysosomal function by AMPK required PIKFYVE, because simultaneous treatment with the AMPK activator A769662 and PIKFYVE inhibitor YM201636 was not able to resolve autophagosome accumulation ()). Therefore, it seems that the reactivation of the MCOLN1 channel was necessary to regain normal lysosomal function in RC-kd cells. Accordingly, treatment of RC-kd cells with the MCOLN1 activator MLSA1 also resolved the accumulation of autophagosomal mass ()). Importantly, reactivation of MCOLN1 also restored lysosomal acidification (Fig. S3A) as well as lysosomal proteolytic activity as assessed by Magic Red (Fig. S3B) and DQ-BSA assays (Fig. S3C), and normalized lysosomal size ()).
Chronic reactivation of MCOLN1 in RC deficiency is beneficial
To determine if the inhibition of lysosomal function in chronic RC deficiency is beneficial or detrimental to the cells, we subjected RC-kd and control cells to a mild death stimulus, using staurosporine, a cell death inducer [Citation51]. Treatment of cells with staurosporine for 6–12 h induces mostly apoptotic cell death, but shorter treatments cause a mix of apoptosis and necrosis [Citation52]. We treated the cells with 2 µM staurosporine for only 1 h, to create a mildly stressed environment rather than induce large-scale cell death. The cells were then labelled with ANXA5/annexin V (binds to phosphatidylserine exposed in the outer leaflet of the plasma membrane, a characteristic of apoptotic cells) and propidium iodide (accumulates in dead cells) ()). Under these conditions, we observed that the RC-kds presented a 2-fold increase in apoptosis and in necrosis compared to the control cells ()). The treatment of the RC-kds with the MCOLN1 activator MLSA1 for 4 h had no significant effect on the apoptosis in RC-kds, but resulted in increased necrosis () and quantification in 7B).
Figure 7. Cell death in RC-kd and ndufs4−/-. (a) Apoptosis and necrosis evaluation in scrambled, RC-kd and RC-kd HeLa treated with 20 μM ML-SA1 for 4 h. The cells were subject to 2 µM staurosporine for 1 h prior to collection as a mild cell death-inducing condition. Afterwards the cells were labelled with ANXA5/annexin V (a marker of apoptotic cell death that recognizes externalization of phosphatidylserine to the outer leaflet of the plasma membrane) and propidium iodide (accumulates in dead cells). Fluorescence was measured by flow cytometry; the experiment was done in triplicate. (b) Column plot showing that that RC-kd cells present more apoptosis and necrosis than the scrambled cells. Additionally, MLSA1 treatment has no effect in the apoptotic cells but significant increases the necrotic cells. The plot shows variation in the number of cells undergoing death under each condition compared to the control (fold change; scrambled = 1). ANOVA p-value *p < 0.05, **p < 0.005, ***p < 0.005 (c) Measurement of apoptosis and necrosis in ndufs4−/- and WT MEFs, as well as ndufs4−/- MEFs treated with 20 μM ML-SA1 for 4 h. The cells were subject to 2 µM staurosporine for 1 h prior to collection, as a mild cell death-inducing condition. Afterwards the cells were labelled with ANXA5 and propidium iodide, as above. Fluorescence was measured by flow cytometry; the experiment was done in triplicate. (d) Column plot showing that that ndufs4−/- cells present less apoptosis but more necrosis than the WT. Additionally, MLSA1 treatment has not effect in the apoptotic cells but significant increases the necrotic cells. The plot shows variation in the number of cells undergoing death under each condition compared to the control (fold change; scrambled = 1). ANOVA p-value *p < 0.05, **p < 0.005, ***p < 0.005, n.s. (e) Cell death decreases after long-term treatment with 20 μM MLSA1 in control and RC-kd HeLa cells. Plot shows the average±s.d. of the number of propidium iodide-positive cells per well of a 6-well plate. Three wells per condition were used per experiment, and 2 independent experiments were performed. ANOVA p-value *p < 0.05.
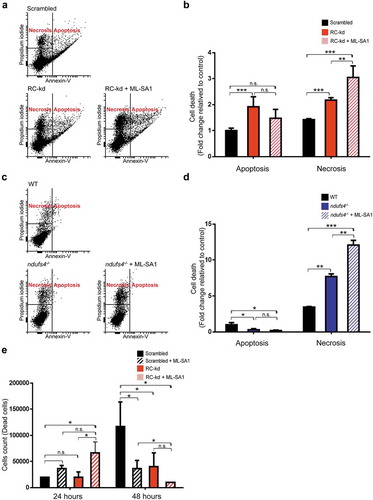
Importantly, we obtained similar results with ndufs4−/- MEFs, which had ~7-fold more necrotic cells than the WT MEFs, and there was a further increase in necrosis after MLSA1 treatment (), quantified in 7D). Since the treatments with MLSA1, to reactivate MCOLN1, were carried out during 4 h in all experiments, including this cell death assessment, we tested longer periods of MLSA1 treatment to determine if the pro-death effect remained. Therefore, we treated scrambled and RC-kd cells for 24 h and 48 h with MLSA1, and assessed cell death using the propidium iodide assay (here only dead cells were scored, with no distinction between apoptosis and necrosis). We observed that while in the first 24 h the MLSA1 treatment resulted in increased cell death, the effect in the period 24–48 h was opposite, with MLSA1 treatment in RC-kd resulting in decreased cell death. Thus, the reactivation of MCOLN1 under chronic mitochondrial RC deficiency seems to be a beneficial in the long run, despite the fact that it leads to increased cell death in the early hours of the treatment.
Discussion
In this study, we identified the mechanism by which mitochondrial respiratory chain (RC) malfunction impairs lysosomal function and autophagy flux. Under chronic RC deficiency, FLCN expression is increased, causing a downregulation of AMPK signaling, which results in decreased PIKFYVE-dependent PtdIns(3,5)P2 levels (). PtdIns(3,5)P2 is needed to activate the MCOLN1 lysosomal Ca2+ channel, and therefore lower PtdIns(3,5)P2 levels result in lower MCOLN1 activity, and consequent accumulation of Ca2+ in the lysosome, lysosomal enlargement and impaired performance. The decrease in lysosomal activity is emphasized by the intralysosomal accumulation of undigested autophagosomal cargo. Remarkably, reactivation of MCOLN1, or of the whole pathway via AMPK activation, results in normalization of lysosomal function and resolution of the stalled autophagy.
Figure 8. Model for the mechanism linking chronic mitochondrial deficiency with regulation of lysosomal function. This diagram depicts the contrast between chronic and acute mitochondrial malfunction. Acute mitochondrial defects result in an increase of AMPK activity, which promotes the pathway that activates MCOLN1 channel, while chronic mitochondrial malfunction, as shown by this study, results in increased FLCN, which represses AMPK activity resulting in decreased activity of the MCOLN1 channel. This, in turn, causes accumulation of Ca2+ in the lysosomes, alterations in lysosomal pH, enlargement of lysosomes and lysosomal malfunction.
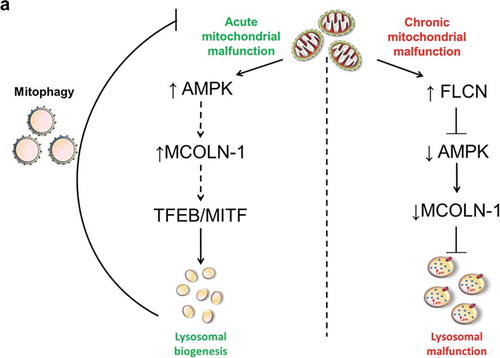
The effects of chronic mitochondrial deficiency on lysosomal function, mediated by a downregulation of AMPK and MCOLN1, sharply contrast with the effects of acute mitochondrial impairment. Under acute mitochondrial stress, both AMPK [Citation13] and MCOLN1 [Citation53] are activated, as well as a AMPK-TFEB/MITF-dependent transcriptional program of lysosomal biogenesis. This program is repressed under chronic mitochondrial stress [Citation13]. Accordingly, our RC-kds and ndufs4−/- cells were unable to trigger lysosomal biogenesis even under amino acid starvation, consistent with the known role of MCOLN1 in starvation-induced activation of TFEB and other microphtalmia transcription factors. Overall, AMPK signaling seems to be the gatekeeper of lysosomal function under mitochondrial respiratory chain deficiency. Importantly, this occurs independently of MTORC1 signaling. Interestingly, we find that the cause of AMPK downregulation lies on the increased expression of FLCN, a tumor suppressor protein that inhibits both AMPK and TFEB. Accordingly, silencing FLCN in the cells with mitochondrial RC defects rescued most of the lysosomal phenotypes.
The involvement of AMPK, a canonical responder to mitochondrial stress, in the regulation of lysosomal function via PIKFYVE-PtdIns(3,5)P2, both under basal conditions and under mitochondrial malfunction, raises the important point that AMPK is a signaling hub of the crosstalk between mitochondria and lysosomes. AMPK was already shown to regulate lysosomal biogenesis in cultured cells [Citation13] as well as in vivo [Citation12], but its role in the regulation of lysosomal function, at basal level, was unknown. While there is a large body of work on the role of AMPK in response to acute mitochondrial stress, less is known about the involvement of AMPK in chronic mitochondrial disease. Here, we observed that AMPK signaling is decreased in RC-kd cells but also downregulated in the brain of a mouse model of respiratory chain deficiency, ndufs4−/-. A decrease of AMPK activity in the brain would be of particular significance as many of the pathological consequences of impairments in the PIKFYVE-PtdIns(3,5)P2-MCOLN1 pathway are related to the nervous system [Citation41,Citation54,Citation55].
The decrease in the activity of this pathway has broad consequences for the lysosome and for the cells, given the importance of PtdIns(3,5)P2 for numerous cellular processes besides MCOLN1 regulation. The immediate consequence for the lysosome seems to be the loss of acidity and, consequently, function. Often, increase in lysosomal pH (loss of acidity) is associated with the inability to retain intralysosomal Ca2+. Here, we observe that accumulation of Ca2+ and lysosomal neutral pH occur simultaneously. These results are in agreement with data showing increased (less acidic) pH in MCOLN1-deficient cells [Citation24], and with data showing that lysosomal Ca2+ refilling is independent of the pH gradient [Citation56].
The broader biological relevance of the pathway here described is underscored by the embryonic lethality of constitutive pikfyve knockout in mouse [Citation44], neonatal lethality of mice lacking VAC14 [Citation57], and profound neurodegeneration in a mouse with a mutation in [Citation58], 2 proteins associated with PIKFYVE and necessary for its activity. At the cellular level, defects in PtdIns(3,5)P2 homeostasis affect lysosomal function and trafficking, endosomal sorting, and retrograde traffic from the lysosome to the Golgi complex [Citation41]. At the organismal level, defects in PtdIns(3,5)P2 are associated with several human diseases, thus raising the possibility that lower activity of the PIKFYVE-PtdIns(3,5)P2-MCOLN1 pathway may have a role in the pathology of mitochondrial diseases. Interestingly, activation of AMPK activity was found to be beneficial in a mouse model of myopathy caused by defects in mitochondria RC complex IV [Citation59]. It is important to note that while this study did not determine the mechanism by which AMPK activates PIKFYVE, we have established a direct interaction between the two proteins, and showed that reactivation of AMPK in RC-kd is dependent on PIKFYVE activity.
Furthermore, MCOLN1 also regulates lysosomal exocytosis [Citation60], which seems to have a biphasic response to oxidative stress: increased by short-term bursts, but inhibited by prolonged oxidative stress, both in a MCOLN1-dependent manner [Citation60]. When placing our results in this context, it could be speculated that under chronic mitochondrial malfunction it is beneficial to suppress lysosomal exocytosis in order to avoid depleting the cells of constituents. Furthermore, when considering tissues, in vivo, persistent lysosomal exocytosis would likely result in permanent inflammation [Citation61]. Our observation that restoration of lysosomal function leads to increased cell death in cells with chronic mitochondrial impairment suggests that inhibition of the lysosome is a protective mechanism, at least under basal culture conditions and for a short 4-h treatment with the MCOLN1 activator MLSA1. However, longer treatment with MLSA1 decreased cell death, suggesting that in the long term MCOLN1 reactivation in chronic mitochondrial malfunction may be beneficial. It is possible that the early increase in cell death upon the 4-h treatment with MLSA1 is due to increase of cytoplasmic Ca2+ in RC-kd cells that were already adapted to lower cytoplasmic Ca2+ levels. Indeed, necrotic cell death is associated with cytoplasmic Ca2+ overload [Citation62].
The inhibition of lysosomal function comes, evidently, at a cost. The lysosomes are an important metabolic hub, with roles in amino acid sensing and coordination, as well as a major signaling node which regulates many aspects of cell life [Citation25]. By repressing lysosomal function, the cells create a new set of problems akin to that observed in lysosomal storage diseases which, like mitochondrial diseases, often have devastating consequences for the central nervous system, cardiac function and skeletal muscle [Citation63]. Interestingly, the MCOLN1 knockout mice present several phenotypes that are often observed in mitochondrial diseases, including reduced myelination [Citation54], neurological perturbations [Citation64] and retinal degeneration [Citation55]. While it is a speculative statement at this point, it is possible that the MCOLN1 inhibition is contributing to the pathological phenotypes observed in mouse models and patients with mitochondrial diseases.
The interplay here described between mitochondria and lysosomes brings the issue of organelle cross-talk to center stage. While defects in cellular organelles were studied in an organelle-specific manner, it is now clear that to fully understand the impact of one dysfunctional organelle, such as the mitochondria, it is pivotal to understand how the other cellular organelles respond to the mitochondrial defect [Citation13,Citation65–Citation69]. This is particularly relevant since the existence of contact sites between mitochondria and lysosomes was recently reported in mammalian cells [Citation70]. Further studies will elucidate if the crosstalk between mitochondria and lysosomes unveiled in the present study is dependent on these contact sites, or if it can affect their occurrence [Citation71–Citation73]. The interplay between these organelles and the endoplasmic reticulum is also a key question to be addressed, particularly given that the lysosomal Ca2+ contents are refilled by the endoplasmic reticulum [Citation56].
The mechanisms that mediate the crosstalk between mitochondria and lysosomes remain unexplored, regardless of their involvement in contact sites or via signaling pathways. This question goes beyond fundamental biology, since in many diseases caused by primary malfunction of one organelle (e.g., mitochondrial diseases, lysosomal storage diseases, etc.), defects in other organelles have been extensively reported [Citation65]. However, it is usually assumed that the secondary perturbations in other organelles occur chaotically and progressively, as eventually every component of a diseased cell would cease to function. Our data suggests that impairment of lysosomes in mitochondrial disease is not a chaotic succession of events, but rather a highly regulated process. The understanding of this process will aid in the identification of targets for novel therapeutic strategies, which will be of relevance not just for mitochondrial and lysosomal diseases but also to several neurodegenerative syndromes that present defects in both organelles.
Materials and methods
Cell culture and generation of stable knockdown cells
HeLa cells and MEFs were grown in DMEM high glucose medium (Gibco, 11965) supplemented with 10% fetal bovine serum and 1% penicillin-streptomycin at 37°C and 5% CO2. ndufs4−/- MEFs were prepared as described previously [Citation74]. AMPK MEFs [Citation75] prkaa1−/-, prkaa2−/-, and prkaa1−/- prkaa2−/- and corresponding wild type, were a kind gift by Dr. Benoit Viollet (Institut Cochin, Paris, France). All MEFs were immortalized using E6E7 viral particles as previously described [Citation74].
Lentiviral stable knockdown generation was done by growing HEK293T packaging cells in DMEM high glucose supplemented with 10% FBS and after 24 h were transfected with viral components and shRNA against target genes (or scrambled control) using Lipofectamine 2000 (Invitrogen, 11668–019), grown and concentrated using Lenti-X Concentrator (Clontech Laboratory, 631232) according to the manufacturer’s instructions. The shRNA constructs were purchased from Open Biosystems (Dharmacon). HeLa cells were then seeded at 12000 cells/cm2 and grown overnight to 70–80% confluence. These cells were transduced with the lentiviral particles using Polybrene (8 µg/ul; Sigma-Aldrich TR-1003-G). Puromycin (Fisher Scientific, BP2956-100; 6 mg/ml) was used as selection agent.
Transient Atg5 and FLCN knockdowns were done with siRNA (RNAi DsiRNA Duplex Oligos from IDT) and Fugene 6 Transfection Reagent (Promega, E2691) according to the manufacturer’s instructions.
The LAMP1-GFP (LAMP1-mGFP; 34831) [Citation76], GFP-LC3 (pEGFP-LC3; 24920) [Citation77] and RFP-LC3 (pmRFP-LC3; 21075) [Citation78] were obtained from Addgene (deposited by Dr. Esteban Dell’Angelica, Dr. Toren Finkel and Dr. Tamotsu Yoshimori, respectively).
Drugs and cellular treatments
The following drugs were used: A769662 (InvivoGen, inh-a769) and dorsomorphin (compound C; Sigma Aldrich, P5499); Torin1 (BioVision, 2273); MLSA1 (Sigma-Aldrich, SML0627) and YM201636 (InvivoGen, inh-ym20); staurosporine (Sigma-Aldrich, 37095). These compounds were solubilized in DMSO (Sigma-Aldrich, D8418), which was used as vehicle control. Mitochondrial uncoupler FCCP (Sigma- Aldrich, C2920) or respiratory chain inhibitor antimycin A (Sigma-Aldrich, A8674) were solubilized in ethanol (Sigma-Aldrich, 51976), which was used as vehicle control for the experiments involving these drugs.
Western blotting
Whole-cell extracts of cultured human cells were prepared in 1.5% n-dodecylmaltoside (Carl Roth, CN26.2) in PBS (Sigma-Aldrich, P44177) as described previously [Citation79]. Briefly, gels were loaded with 50 µg of total protein per well, proteins were separated in 12% SDS-PAGE gels and transferred to polyvinylidene fluoride (PVDF) membranes (Amersham Life Technologies, GE10600023). The following antibodies were used for immunoblotting: UQCRC1 (Abcam, ab110252), GAPDH (Sigma-Aldrich, G9545), HPRT (Abcam, ab10479), LAMP1 (Developmental Hybridoma Bank, H4A3) for mouse; (Abcam, ab24170) samples) for human samples, LC3B (Cell Signaling Technology, 3868), AMPKα1 (Cell Signaling Technology, 2795), p-PRKAA1/AMPKα1 (T172) (Cell Signaling Technology, 2535), FLCN (Cell Signaling Technology, 3697), FNIP1 (Abcam, ab134969), TSC2 (Cell Signaling Technology, 4308), p-TSC2 (S1387) (Cell Signaling Technology, 5584), PIKFYVE (Proteintech, 13361–1-AP), ACAC/ACC (Cell Signaling Technology, 3676), p-ACAC/ACC (Ser79) (Cell Signaling Technology, 3661), RPS6/S6 (Cell Signaling Technology, 2217S), p-RPS6/S6 (Cell Signaling Technology, 4858S), MCOLN1 (Novus, NBP1-92152). Band density quantification was determined using ImageJ after subtraction of background, and normalized against loading controls (HPRT, GAPDH, RPL7).
Immunoprecipitations and Western blot analyses
To evaluate the interaction between AMPK and PIKFYVE, scrambled control and RC-kd HeLa cells were harvested in cold PBS on ice by scraping. Lysates were prepared from cell pellets using WCE buffer (40 mM Tris-HCl, pH 7.5 [Carl Roth, 9090.2], 150 mM NaCl [AppliChem, A1430,0010], 1 mM EDTA, 10 mM MgCl2 [VWR, 8.14733.0100] supplemented with 1x HALT protease and phosphatase inhibitor cocktail [Thermo Scientific, 78442]). Cell lysates were incubated at 40°C with rotation for 20 min and centrifuged at 16000 × g for 20 min. The supernatants were collected and protein concentrations were determined by the Bradford assay. 500 µg of protein was incubated with either anti PRKAA (Cell Signaling Technologies, 5832) (1:100) or with IgG (1:100; Dianova, 111–001-008) and 30 µL each of equilibrated protein G agarose beads (Millipore, 16–266) overnight at 4°C with rotation. Beads were then washed 4 times in WCE buffer and boiled in Laemmli buffer containing β-mercaptoethanol (Carl Roth, 4227.3) for 5 min at 95°C and centrifuged at 16000 × g for 1 min. Gels were loaded with 10 µL of the supernatants and subjected to western blotting as described and probed with anti-PRKAA, anti-PYKFYVE and anti-GAPDH antibodies.
Quantitative RT-PCR
RNA extraction and purification were performed as described previously [Citation13]. cDNA was diluted 1:100, and each 8 µl reaction contained 4 µl diluted cDNA, 0,2 µl dilutions of each primer (from 25 µM stock), and 3.6 µl iTaq Universal SYBR Green Supermix (Bio-Rad, 1725120). The data were analyzed by the ΔΔCT method, using HPRT or GAPDH as control gene.
DQ-BSA
Lysosomal protease activity in cells was measured using DQ™ Green BSA (Life Technologies, D12050) or DQ™ Red BSA (Life Technologies, D12051). The cells were plated at a density of 12.000 cells/well in a black, clear bottom 96 well-plate, 24 hours before. The medium was replaced with DMEM high glucose containing 10 µg/ml DQ Green BSA and incubated 1 h at 37°C. After the incubation the plate was washed twice with PBS and the medium was replaced with 100 µl of EBSS medium. Lyosomal protease activity was measured as fluorescence in a microplate reader (BioTek) at 495 nm excitation, 525 nm emmision each 5 min for 4 h. The slope of the linear range (0–90 minutes of EBSS) was used for analysis.
Magic red
Cells were plated in 24-mm round coated glass coverlips (Marienfeld, 0101060) the day before the experiment. The incubation of the cells with Magic Red (Bio-Rad, ICT937) took 20 min, after which the coverslip was washed in warm imaging buffer and then placed on a coverslip holder filled with pre-heated imaging buffer. The coverslip was then immediately taken to the Nikon/PerkinElmer Spinning Disk microscope under a humidified chamber heated at 30°C, and imaged. Data was analyzed using ImageJ.
Electron microscopy
Cells seeded on 24-mm glass coverslips were fixed with 2.5% (vol:vol) glutaraldehyde in 0.1 M sodium cacodylate during 1 h at room temperature. After washing with 0.1 M cacodylate buffer, cells were post-fixed with 1% OsO4 solution and 1.5% ferrocyanide in 0.1 M cacodylate during 1 h at room temperature. The samples were then washed 3 times in 0.1 M cacodylate buffer following 3 times in Millipore water and then incubated in 1% aqueous uranyl acetate at 4°C overnight. Then, cells were rinsed with Millipore water, dehydrated with ethanol and infiltrated in Epon (CarlRoth, 8619.1) using 1:1 (v:v) resin and anhydrous ethanol for 1 h. Additionally, 2 steps of 100% resin during 1 h were performed. After, the cells were incubated at 45°C over night following a second over night at 60°C. Thin sections were prepared and imaged using a LEO 912AB transmission electron microscope with Omega energy filter operated at 120 kV.
Flow cytometry
Cells were incubated with MitoSOX (Life Technologies, M36008) 50 nm for 20 min at 37°C; Fluo-4-AM (Life Technologies, F14201) 2 µM for 20 min at 37°C; LysoTracker Green DND-26 (Life Technologies, L7526) 200 nM for 20 min at 37°C under regular cell culture conditions. Then, they were washed 3x in warm PBS, detached with trypsin, washed and ressuspended in PBS and sorted using a FACScan (BD Biotechnology).
Microscopy
Cells were plated using coverslips on 12-well plates and transiently transfected with GFP-LC3, RFP-LC3, LAMP1-GFP (all obtained from Addgene, described in detail in the construct section), PtdIns(3,5)P2 GFP probe [Citation42], lysosomal Ca2+ probe using Fugene 6 Transfection Reagent (Promega, E2691) according to the manufacturer’s instructions. Images were obtained using a Nikon/PerkinElmer Spinning Disk microscope or with a Zeiss LSM 880 Laser Scanning Microscope with Airyscan. Data was analyzed using Imaris 8.1.1 (Bitplane) and ImageJ software.
Acridine orange assay
Scrambled or RC-kds HeLa cells were seeded at 10000cells/cm2 in coated coverslips. On the following day, the cells were preloaded for 20 min with 10 μg/ml acridine orange (Sigma-Aldrich, 318337), followed by 3 fast washes and 3 5 min washes in pre-warmed (37°C) imaging buffer, and then moved to the spinning disc microscope for imaging. The cells were imaged in time lapse to capture the green and red channels. Photodamage was induced by continuous illumination between images at 488 nm. The data were analyzed as previously described33.
Lysosomal Ca2+ assessment
The experiment was performed as described previously [Citation69]. Briefly, the cells were plated on 24-mm glass coverslips at a density of 5,000 cells/cm2 the day before the experiment. On the day of the experiment, each coverslip was labelled with 2 µM Fluo-4-AM for 20 min at 37̊°C. The coverslip was then rinsed 3 times in PBS pre-warmed to 37̊C, further washed 3 × 5 min in warm PBS, placed in the coverslip holder, and incubated with warm Ca2+-free imaging buffer. The coverslip was then placed in a Nikon/PerkinElmer Spinning Disk microscope, kept in a humidified 5% CO2 chamber, warmed to 30°C. Images were taken with a 40x objective, at the rate of 3 frames per second. One min after the image collection started, we added glycyl-L-phenylalanine 2-naphthylamide (GPN) (Sigma-Aldrich, P5891) to a final concentration of 50 µM and followed fluorescence in the green channel for an additional 3 min. The data were then analyzed using ImageJ to determine the ratio between the intensity of each image compared to the first frame, which was used to calculate the difference between the peak cytoplasmic fluorescence intensity (obtained after GPN addition) and the baseline established before GPN was added.
ndufs4−/- tissue samples preparation
All ethical regulations regarding animal handling and maintenance were followed. The mice were analyzed at 3 and 6 weeks of age (their lifespan is 7 weeks). The brains were collected for RNA and protein analysis, as described [Citation74]. The samples were lysed in RIPA buffer (prepared as described previously [Citation69]) with protease and phosphatase inhibitor cocktail (Thermo Scientific, 78430). Quantitative PCR was performed on RNA purified from these same mouse tissues using Crystal RNA mini Kit (Biolab, 31–010-404) using the same method already described for human cells, but with mouse-specific primers.
Statistical analyses
For western blotting, flow cytometry, quantitative RT-PCR, DQ-BSA, all data points represent the mean of at least 2, but often 3 independent biological replicates. Error bars represent standard deviation unless otherwise stated. For images, typically at least 40 cells were analyzed from at least 2 independent experiments (unless otherwise stated); the data indicate average and the error bars represent the standard error of the mean. For pairwise comparisons, P-values were determined using unicaudal Student´s t test, otherwise one-sided ANOVA was employed.
Supplemental Material
Download Zip (27.2 MB)Acknowledgments
This work was supported by ERC grant 337327 (NR), SFB1190/P2 from the Deutsche Forschungsgemeinschaft (for NR and IM), Schram-Stiftung T287/25457 and Emmy Noether Award MI-1702/1 from the Deutsche Forschungsgemeinschaft (IM). CVD was in part supported by a postdoctoral fellowship by Peter und Traudl Engelhorn Stiftung. MS was supported by the University of Liverpool, NWCR research grant and the Welcome Trust 2-year scholarship. AHP was supported by NWCR research grant. We thank Ms. Daniela Gerke, Ms. Melanie Koenig and Mr. Dirk Schwitters for excellent technical assistance. We are grateful to Dr. Haoxing Xu (University of Michigan, Ann Arbor, USA) for sharing the PtdIns(3,5)P2 probe, and to Dr. Benoit Viollet (Institut Cochin, Paris, France) for sharing the AMPK MEFs. We thank Prof. Lois Weisman (University of Michigan, Ann Arbor, USA) for commenting on the manuscript.
Disclosure statement
No potential conflict of interest was reported by the authors.
Supplemental material
Supplemental data for these article can be accessed here.
Additional information
Funding
Related Research Data
References
- McBride HM, Neuspiel M, Wasiak S. Mitochondria: more than just a powerhouse. Curr Biol. 2006 Jul 25;16(14):R551–60. . PubMed PMID: 16860735; eng.
- Kasahara A, Scorrano L. Mitochondria: from cell death executioners to regulators of cell differentiation. Trends Cell Biol. 2014 Dec;24(12):761–770. PubMed PMID: 25189346; eng.
- Raimundo N, Mosquera LF, Yambire KF. Mitochondrial Signaling. In: Hockenberry DM, editor. Mitochondria and cell death. Springer; 2015. p. 169–184.
- Raimundo N. Mitochondrial pathology: stress signals from the energy factory. Trends Mol Med. 2014 May;20(5):282–292. PubMed PMID: 24508276; eng.
- Bento CF, Renna M, Ghislat G, et al. Mammalian autophagy: how does it work? Annu Rev Biochem. 2016 Jun 2;85:685–713. PubMed PMID: 26865532; eng.
- Zhao YG, Zhang H. ULK1 cycling: the ups and downs of the autophagy response. J Cell Biol. 2016 Dec 19;215(6):757–759. PubMed PMID: 27932574; eng.
- Kim J, Kundu M, Viollet B, et al. AMPK and mTOR regulate autophagy through direct phosphorylation of Ulk1. Nat Cell Biol. 2011 Feb;13(2):132–141. PubMed PMID: 21258367; eng.
- Settembre C, Ballabio A. TFEB regulates autophagy: an integrated coordination of cellular degradation and recycling processes. Autophagy. 2011 Nov;7(11):1379–1381. PubMed PMID: 21785263; eng.
- Settembre C, Di Malta C, Polito VA, et al. TFEB links autophagy to lysosomal biogenesis. Science. 2011 Jun 17;332(6036):1429–1433. PubMed PMID: 21617040; eng.
- Garcia D, Shaw RJ. AMPK: mechanisms of cellular energy sensing and restoration of metabolic balance. Mol Cell. 2017 Jun 15;66(6):789–800. PubMed PMID: 28622524; eng.
- Herzig S, Shaw RJ. AMPK: guardian of metabolism and mitochondrial homeostasis. Nat Rev Mol Cell Biol. 2018 Feb;19(2):121–135. PubMed PMID: 28974774; eng.
- Young NP, Kamireddy A, Van Nostrand JL, et al. AMPK governs lineage specification through Tfeb-dependent regulation of lysosomes. Genes Dev. 2016 Mar 01;30(5):535–552. PubMed PMID: 26944679; eng.
- Fernandez-Mosquera L, Diogo CV, Yambire KF, et al. Acute and chronic mitochondrial respiratory chain deficiency differentially regulate lysosomal biogenesis. Sci Rep. 2017 Mar 27;7:45076. PubMed PMID: 28345620; eng.
- Hill K, Yuan H, Wang X, et al. Noise-induced loss of hair cells and cochlear synaptopathy are mediated by the activation of AMPK. J Neurosci. 2016 Jul 13;36(28):7497–7510. PubMed PMID: 27413159; eng.
- McKay SE, Yan W, Nouws J, et al. Auditory pathology in a transgenic mtTFB1 mouse model of mitochondrial deafness. Am J Pathol. 2015 Dec;185(12):3132–3140. PubMed PMID: 26552864; PubMed Central PMCID: PMCPMC5801480. eng.
- Raimundo N, Song L, Shutt TE, et al. Mitochondrial stress engages E2F1 apoptotic signaling to cause deafness. Cell. 2012 Feb 17;148(4):716–726. PubMed PMID: 22341444; PubMed Central PMCID: PMC3285425. eng.
- Rambold AS, Lippincott-Schwartz J. Mechanisms of mitochondria and autophagy crosstalk. Cell Cycle. 2011 Dec 1;10(23):4032–4038. PubMed PMID: 22101267; eng.
- Graef M, Nunnari J. Mitochondria regulate autophagy by conserved signalling pathways. Embo J. 2011 Jun 1;30(11):2101–2114. PubMed PMID: 21468027; eng.
- Graef M, Nunnari J. A role for mitochondria in autophagy regulation. Autophagy. 2011 Oct;7(10):1245–1246. PubMed PMID: 21613823; eng.
- Te Vruchte D, Speak AO, Wallom KL, et al. Relative acidic compartment volume as a lysosomal storage disorder-associated biomarker. J Clin Invest. 2014 Mar;124(3):1320–1328. PubMed PMID: 24487591; eng.
- Hurbain I, Romao M, Bergam P, et al. Analyzing lysosome-related organelles by electron microscopy. Methods Mol Biol. 2017;1594:43–71. PubMed PMID: 28456976; eng.
- Kuma A, Hatano M, Matsui M, et al. The role of autophagy during the early neonatal starvation period. Nature. 2004 Dec 23;432(7020):1032–1036. PubMed PMID: 15525940; eng.
- Hesselink RP, Wagenmakers AJ, Drost MR, et al. Lysosomal dysfunction in muscle with special reference to glycogen storage disease type II. Biochim Biophys Acta. 2003 Mar 20;1637(2):164–170. PubMed PMID: 12633905; eng.
- Cao Q, Yang Y, Zhong XZ, et al. The lysosomal Ca2+ release channel TRPML1 regulates lysosome size by activating calmodulin. J Biol Chem. 2017 May 19;292(20):8424–8435. PubMed PMID: 28360104; eng.
- Perera RM, Zoncu R. The Lysosome as a regulatory hub. Annu Rev Cell Dev Biol. 2016 Oct 06;32:223–253. PubMed PMID: 27501449; PubMed Central PMCID: PMC5059141. eng.
- Johnson DE, Ostrowski P, Jaumouille V, et al. The position of lysosomes within the cell determines their luminal pH. J Cell Biol. 2016 Mar 14;212(6):677–692. PubMed PMID: 26975849; eng.
- Marwaha R, Sharma M. DQ-red BSA trafficking assay in cultured cells to assess cargo delivery to lysosomes. Bio Protoc. 2017 Oct 5;7(19). PubMed PMID: 29082291; eng.
- Christensen KA, Myers JT, Swanson JA. pH-dependent regulation of lysosomal calcium in macrophages. J Cell Sci. 2002 Feb 1;115(Pt 3):599–607. PubMed PMID: 11861766; eng.
- Berg TO, Stromhaug E, Lovdal T, et al. Use of glycyl-L-phenylalanine 2-naphthylamide, a lysosome-disrupting cathepsin C substrate, to distinguish between lysosomes and prelysosomal endocytic vacuoles. Biochem J. 1994 May 15;300(Pt 1):229–236. PubMed PMID: 8198538; eng.
- Medina DL, Di Paola S, Peluso I, et al. Lysosomal calcium signalling regulates autophagy through calcineurin and TFEB. Nat Cell Biol. 2015 Feb 27;17(3):288–299. PubMed PMID: 25720963; Eng.
- Wang W, Gao Q, Yang M, et al. Up-regulation of lysosomal TRPML1 channels is essential for lysosomal adaptation to nutrient starvation. Proc Natl Acad Sci U S A. 2015 Mar 17;112(11):E1373–81. PubMed PMID: 25733853; eng.
- Shen D, Wang X, Li X, et al. Lipid storage disorders block lysosomal trafficking by inhibiting a TRP channel and lysosomal calcium release. Nat Commun. 2012 Mar 13;3:731. PubMed PMID: 22415822; eng.
- Stagi M, Klein ZA, Gould TJ, et al. Lysosome size, motility and stress response regulated by fronto-temporal dementia modifier TMEM106B. Mol Cell Neurosci. 2014 Jul;61:226–240. PubMed PMID: 25066864; eng.
- Kirkegaard T, Roth AG, Petersen NH, et al. Hsp70 stabilizes lysosomes and reverts Niemann-Pick disease-associated lysosomal pathology. Nature. 2010 Jan 28;463(7280):549–553. PubMed PMID: 20111001; eng.
- Zdolsek JM, Olsson GM, Brunk UT. Photooxidative damage to lysosomes of cultured macrophages by acridine orange. Photochem Photobiol. 1990 Jan;51(1):67–76. PubMed PMID: 2304980; eng.
- Zolov SN, Bridges D, Zhang Y, et al. In vivo, PikFYVE generates PI(3,5)P2, which serves as both a signaling lipid and the major precursor for PI5P. Proc Natl Acad Sci U S A. 2012 Oct 23;109(43):17472–17477. PubMed PMID: 23047693; eng.
- Liu Y, Lai YC, Hill EV, et al. Phosphatidylinositol 3-phosphate 5-kinase (PIKFYVE) is an AMPK target participating in contraction-stimulated glucose uptake in skeletal muscle. Biochem J. 2013 Oct 15;455(2):195–206. PubMed PMID: 23905686; eng.
- Wingo SN, Gallardo TD, Akbay EA, et al. Somatic LKB1 mutations promote cervical cancer progression. PloS one. 2009;4(4):e5137. PubMed PMID: 19340305; eng.
- Shaw RJ, Bardeesy N, Manning BD, et al. The LKB1 tumor suppressor negatively regulates mTOR signaling. Cancer Cell. 2004 Jul;6(1):91–99. PubMed PMID: 15261145.
- Fogarty S, Hawley SA, Green KA, et al. Calmodulin-dependent protein kinase kinase-beta activates AMPK without forming a stable complex: synergistic effects of Ca2+ and AMP. Biochem J. 2010 Jan 27;426(1):109–118. PubMed PMID: 19958286; eng.
- Jin N, Lang MJ, Weisman LS. Phosphatidylinositol 3,5-bisphosphate: regulation of cellular events in space and time. Biochem Soc Trans. 2016 Feb;44(1):177–184. PubMed PMID: 26862203; eng.
- Li X, Wang X, Zhang X, et al. Genetically encoded fluorescent probe to visualize intracellular phosphatidylinositol 3,5-bisphosphate localization and dynamics. Proc Natl Acad Sci U S A. 2013 Dec 24;110(52):21165–21170. PubMed PMID: 24324172; eng.
- Hammond GR, Takasuga S, Sasaki T, et al. The ML1Nx2 phosphatidylinositol 3,5-bisphosphate probe shows poor selectivity in cells. PloS one. 2015;10(10):e0139957. PubMed PMID: 26460749; PubMed Central PMCID: PMCPMC4604148. eng.
- Ikonomov OC, Sbrissa D, Delvecchio K, et al. The phosphoinositide kinase PIKfyve is vital in early embryonic development: preimplantation lethality of PIKfyve-/- embryos but normality of PIKfyve± mice. J Biol Chem. 2011 Apr 15;286(15):13404–13413. PubMed PMID: 21349843; eng.
- Sanders MJ, Ali ZS, Hegarty BD, et al. Defining the mechanism of activation of AMP-activated protein kinase by the small molecule A-769662, a member of the thienopyridone family. J Biol Chem. 2007 Nov 09;282(45):32539–32548. PubMed PMID: 17728241; eng.
- Goransson O, McBride A, Hawley SA, et al. Mechanism of action of A-769662, a valuable tool for activation of AMP-activated protein kinase. J Biol Chem. 2007 Nov 09;282(45):32549–32560. PubMed PMID: 17855357; eng.
- Kruse SE, Watt WC, Marcinek DJ, et al. Mice with mitochondrial complex I deficiency develop a fatal encephalomyopathy. Cell Metab. 2008 Apr;7(4):312–320. PubMed PMID: 18396137; eng.
- Yan M, Gingras MC, Dunlop EA, et al. The tumor suppressor folliculin regulates AMPK-dependent metabolic transformation. J Clin Invest. 2014 Jun;124(6):2640–2650. PubMed PMID: 24762438; eng.
- Hardie DG. AMP-activated protein kinase: an energy sensor that regulates all aspects of cell function. Genes Dev. 2011 Sep 15;25(18):1895–1908. PubMed PMID: 21937710; PubMed Central PMCID: PMC3185962. eng.
- Gwinn DM, Shackelford DB, Egan DF, et al. AMPK phosphorylation of raptor mediates a metabolic checkpoint. Mol Cell. 2008 Apr 25;30(2):214–226. PubMed PMID: 18439900.
- Belmokhtar CA, Hillion J, Segal-Bendirdjian E. Staurosporine induces apoptosis through both caspase-dependent and caspase-independent mechanisms. Oncogene. 2001 Jun 7;20(26):3354–3362. PubMed PMID: 11423986; eng.
- McKeague AL, Wilson DJ, Nelson J. Staurosporine-induced apoptosis and hydrogen peroxide-induced necrosis in two human breast cell lines. Br J Cancer. 2003 Jan 13;88(1):125–131. PubMed PMID: 12556971; eng.
- Zhang X, Cheng X, Yu L, et al. MCOLN1 is a ROS sensor in lysosomes that regulates autophagy. Nat Commun. 2016 Jun 30;7:12109. PubMed PMID: 27357649; eng.
- Grishchuk Y, Pena KA, Coblentz J, et al. Impaired myelination and reduced brain ferric iron in the mouse model of mucolipidosis IV. Dis Model Mech. 2015 Dec;8(12):1591–1601. PubMed PMID: 26398942; eng.
- Grishchuk Y, Stember KG, Matsunaga A, et al. Retinal dystrophy and optic nerve pathology in the mouse model of mucolipidosis IV. Am J Pathol. 2016 Jan;186(1):199–209. PubMed PMID: 26608452; eng.
- Garrity AG, Wang W, Collier CM, et al. The endoplasmic reticulum, not the pH gradient, drives calcium refilling of lysosomes. Elife. 2016 May 23;5. DOI:10.1016/j.tibs.2016.09.001. PubMed PMID: 27213518; PubMed Central PMCID: PMC5123979. eng.
- Zhang Y, Zolov SN, Chow CY, et al. Loss of Vac14, a regulator of the signaling lipid phosphatidylinositol 3,5-bisphosphate, results in neurodegeneration in mice. Proc Natl Acad Sci U S A. 2007 Oct 30;104(44):17518–17523. PubMed PMID: 17956977; eng.
- Chow CY, Zhang Y, Dowling JJ, et al. Mutation of FIG4 causes neurodegeneration in the pale tremor mouse and patients with CMT4J. Nature. 2007 Jul 05;448(7149):68–72. PubMed PMID: 17572665; eng.
- Viscomi C, Bottani E, Civiletto G, et al. In vivo correction of COX deficiency by activation of the AMPK/PGC-1alpha axis. Cell Metab. 2011 Jul 06;14(1):80–90. PubMed PMID: 21723506; eng.
- Ravi S, Pena KA, Chu CT, et al. Biphasic regulation of lysosomal exocytosis by oxidative stress. Cell Calcium. 2016 Nov;60(5):356–362. PubMed PMID: 27593159; eng.
- Ge W, Li D, Gao Y, et al. The roles of lysosomes in inflammation and autoimmune diseases. Int Rev Immunol. 2015;34(5):415–431. PubMed PMID: 25075736; eng.
- Orrenius S, Gogvadze V, Zhivotovsky B. Calcium and mitochondria in the regulation of cell death. Biochem Biophys Res Commun. 2015 Apr 24;460(1):72–81. PubMed PMID: 25998735; eng.
- Parenti G, Andria G, Ballabio A. Lysosomal storage diseases: from pathophysiology to therapy. Annu Rev Med. 2015;66:471–486. PubMed PMID: 25587658; eng.
- Venugopal B, Browning MF, Curcio-Morelli C, et al. Neurologic, gastric, and opthalmologic pathologies in a murine model of mucolipidosis type IV. Am J Hum Genet. 2007 Nov;81(5):1070–1083. PubMed PMID: 17924347; eng.
- Diogo CV, Yambire KF, Fernandez Mosquera L, et al. Mitochondrial adventures at the organelle society. Biochem Biophys Res Commun. 2017 Apr 26. DOI:10.1016/j.bbrc.2017.04.124. PubMed PMID: 28456629; eng.
- Raimundo N, Fernandez-Mosquera L, Yambire KF, et al. Mechanisms of communication between mitochondria and lysosomes. Int J Biochem Cell Biol. 2016 Oct;79:345–349. PubMed PMID: 27613573; eng.
- Raimundo N, Krisko A. Cross-organelle communication at the core of longevity. Aging (Albany NY). 2018 Jan 22;10(1):15–16. PubMed PMID: 29362289; PubMed Central PMCID: PMCPMC5811256. eng.
- Peric M, Lovric A, Saric A, et al. TORC1-mediated sensing of chaperone activity alters glucose metabolism and extends lifespan. Aging cell. 2017 Oct;16(5):994–1005. PubMed PMID: 28613034; PubMed Central PMCID: PMCPMC5595670. eng.
- Peric M, Bou Dib P, Dennerlein S, et al. Crosstalk between cellular compartments protects against proteotoxicity and extends lifespan. Sci Rep. 2016 Jun 27;6:28751. PubMed PMID: 27346163; PubMed Central PMCID: PMCPMC4921836. eng.
- Wong YC, Ysselstein D, Krainc D. Mitochondria-lysosome contacts regulate mitochondrial fission via RAB7 GTP hydrolysis. Nature. 2018 Feb 15;554(7692):382–386. PubMed PMID: 29364868; eng.
- Todkar K, Ilamathi HS, Germain M. Mitochondria and lysosomes: discovering bonds. Front Cell Dev Biol. 2017;5:106. PubMed PMID: 29270406; PubMed Central PMCID: PMCPMC5725469. eng.
- Torres S, Balboa E, Zanlungo S, et al. Lysosomal and mitochondrial liaisons in Niemann-Pick disease. Front Physiol. 2017;8:982. PubMed PMID: 29249985; PubMed Central PMCID: PMCPMC5714892. eng.
- Soto-Heredero G, Baixauli F, Mittelbrunn M. Interorganelle communication between mitochondria and the endolysosomal system. Front Cell Dev Biol. 2017;5:95. PubMed PMID: 29164114; PubMed Central PMCID: PMCPMC5681906. eng.
- Murdoch JD, Rostosky CM, Gowrisankaran S, et al. Endophilin-a deficiency induces the Foxo3a-Fbxo32 network in the brain and causes dysregulation of autophagy and the ubiquitin-proteasome system. Cell Rep. 2016 Oct 18;17(4):1071–1086. PubMed PMID: 27720640; PubMed Central PMCID: PMC5366864. eng.
- Laderoute KR, Amin K, Calaoagan JM, et al. 5ʹ-AMP-activated protein kinase (AMPK) is induced by low-oxygen and glucose deprivation conditions found in solid-tumor microenvironments. Mol Cell Biol. 2006 Jul;26(14):5336–5347. PubMed PMID: 16809770; eng.
- Falcon-Perez JM, Nazarian R, Sabatti C, et al. Distribution and dynamics of Lamp1-containing endocytic organelles in fibroblasts deficient in BLOC-3. J Cell Sci. 2005 Nov 15;118(Pt 22):5243–5255. PubMed PMID: 16249233; eng.
- Lee IH, Cao L, Mostoslavsky R, et al. A role for the NAD-dependent deacetylase Sirt1 in the regulation of autophagy. Proc Natl Acad Sci U S A. 2008 Mar 4;105(9):3374–3379. PubMed PMID: 18296641; PubMed Central PMCID: PMCPMC2265142. eng.
- Kimura S, Noda T, Yoshimori T. Dissection of the autophagosome maturation process by a novel reporter protein, tandem fluorescent-tagged LC3. Autophagy. 2007 Sep-Oct;3(5):452–460. PubMed PMID: 17534139; eng.
- Raimundo N, Vanharanta S, Aaltonen LA, et al. Downregulation of SRF-FOS-JUNB pathway in fumarate hydratase deficiency and in uterine leiomyomas. Oncogene. 2009 Mar 5;28(9):1261–1273. PubMed PMID: 19151755; eng.