
 ?Mathematical formulae have been encoded as MathML and are displayed in this HTML version using MathJax in order to improve their display. Uncheck the box to turn MathJax off. This feature requires Javascript. Click on a formula to zoom.
ABSTRACT
The destruction of mitochondria through macroautophagy (autophagy) has been recognised as a major route of mitochondrial protein degradation since its discovery more than 50 years ago, but fundamental questions remain unanswered. First, how much mitochondrial protein turnover occurs through auto-phagy? Mitochondrial proteins are also degraded by nonautophagic mechanisms, and the proportion of mitochondrial protein turnover that occurs through autophagy is still unknown. Second, does auto-phagy degrade mitochondrial proteins uniformly or selectively? Autophagy was originally thought to degrade all mitochondrial proteins at the same rate, but recent work suggests that mitochondrial autophagy may be protein selective. To investigate these questions, we used a proteomics-based approach in the fruit fly Drosophila melanogaster, comparing mitochondrial protein turnover rates in autophagy-deficient Atg7 mutants and controls. We found that ~35% of mitochondrial protein turnover occurred via autophagy. Similar analyses using parkin mutants revealed that parkin-dependent mitophagy accounted for ~25% of mitochondrial protein turnover, suggesting that most mitochondrial autophagy specifically eliminates dysfunctional mitochondria. We also found that our results were incompatible with uniform autophagic turnover of mitochondrial proteins and consistent with protein-selective autophagy. In particular, the autophagic turnover rates of individual mitochondrial proteins varied widely, and only a small amount of the variation could be attributed to tissue differences in mitochondrial composition and autophagy rate. Furthermore, analyses comparing autophagy-deficient and control human fibroblasts revealed diverse autophagy-dependent turnover rates even in homogeneous cells. In summary, our work indicates that autophagy acts selectively on mitochondrial proteins, and that most mitochondrial protein turnover occurs through non-autophagic processes.
Abbreviations: Atg5: Autophagy-related 5 (Drosophila); ATG5: autophagy related 5 (human); Atg7: Autophagy-related 7 (Drosophila); ATG7: autophagy related 7 (human); DNA: deoxyribonucleic acid; ER: endoplasmic reticulum; GFP: green fluorescent protein; MS: mass spectrometry; park: parkin (Drosophila); Pink1: PTEN-induced putative kinase 1 (Drosophila); PINK1: PTEN-induced kinase 1 (human); PRKN: parkin RBR E3 ubiquitin protein ligase (human); RNA: ribonucleic acid; SD: standard deviation; Ub: ubiquitin/ubiquitinated; WT: wild-type; YME1L: YME1 like ATPase (Drosophila); YME1L1: YME1 like 1 ATPase (human)
Introduction
Mitochondria play critical roles in energy production, calcium homeostasis, metabolite synthesis and apoptosis [Citation1-Citation4]. They are also the major cellular source of reactive oxygen species, which damage mitochondrial DNA, lipids and proteins [Citation3,Citation5]. It is therefore unsurprising that progressive accumulation of damaged mitochondria has been implicated in aging and in common diseases of the elderly [Citation6–Citation8]. Mitochondria have a large repertoire of quality control mechanisms to oppose this deterioration, including multiple pathways for the removal of damaged mitochondrial components. Individual mitochondrial proteins can be selectively degraded by mitochondrial resident proteases [Citation9] or the proteasome [Citation10–Citation12], or transported to the lysosome in mitochondria-derived vesicles [Citation13]. Alternatively, entire mitochondria can be destroyed via macroautophagy (henceforth ‘autophagy’), a process in which mitochondria are sequestered and ultimately undergo lysosomal degradation [Citation14].
Of the various mitochondrial protein-degradation processes, the most extensively studied is autophagy, first identified in the 1960s. The pioneering work of Fletcher and Sanadi, which found essentially identical turnover rates for three types of mitochondrial protein as well as mitochondrial lipids [Citation15], concluded that mitochondria were ‘turning over as an entity’; soon afterwards, electron micrographs showing mitochondria inside lysosomes provided a plausible mechanism for destruction of whole organelles [Citation16]. Later work revealed that auto-phagy is a highly regulated process involving a complex network of autophagy-related (ATG) gene factors [Citation17], and demonstrated multiple pathways leading to autophagic degradation of mitochondria [Citation18,Citation19]. In particular, selective destruction of damaged mitochondria was identified and termed ‘mitophagy’ [Citation20,Citation21]. A more mechanistic understanding of mitophagy emerged through study of the neurodegeneration-associated proteins PINK1 (PTEN induced kinase 1) and PRKN (parkin), which together target dysfunctional mitochondria for autophagic degradation [Citation22–Citation24], and work in Drosophila demonstrated that this mitophagy pathway is required for normal mitochondrial protein turnover in vivo [Citation25].
While the above findings demonstrate the importance of autophagy in mitochondrial quality control, there is also evidence that non-autophagic mechanisms contribute substantially to turnover of mitochondrial proteins. Although some studies that followed Fletcher and Sanadi supported their view that mitochondria are degraded as units [Citation26,Citation27], others instead found different turnover rates for individual mitochondrial components [Citation28–Citation30], and later in vivo proteomic studies showed that mitochondrial protein turnover rates are in fact highly diverse [Citation25,Citation31–Citation37]. These wide ranges of turnover rates, sometimes spanning more than two orders of magnitude, are consistent with substantial mitochondrial protein degradation through non-autophagic mechanisms. Accumulation of mitochondrial proteins after ablation of the mitochondrial protease Lon [Citation38] or inhibition of the proteasome [Citation12] further suggests that non-autophagic mechanisms degrade considerable amounts of mitochondrial protein. Work to date thus indicates that autophagy accounts for some, but not all, mitochondrial protein turnover; however, the actual proportion of turnover that occurs via autophagy is unknown.
In the last few years, new findings have also begun to blur the distinction between lysosomal destruction of whole mitochondria and targeted degradation of individual mitochondrial proteins. Work in yeast has demonstrated stress-induced autophagic degradation of selected mitochondrial proteins [Citation39,Citation40], and experiments using mammalian cultured cells have suggested that related phenomena may exist in higher eukaryotes [Citation41,Citation42]. However, whether mitochondrial auto-phagy normally degrades individual mitochondrial proteins at different rates in intact metazoans is unknown.
To answer these unresolved questions about the nature of mitochondrial autophagy, we used an approach based on proteomic measurement of protein turnover in the fruit fly Drosophila melanogaster. We calculated the percentage contribution of autophagy by comparing mitochondrial protein turnover rates in autophagy-deficient Atg7 (Autophagy-related 7) null mutant flies to those in normal flies, and the percentage contribution of parkin-dependent mitophagy using parkin (park)null mutants. Approximately 35% of all mitochondrial protein turnover occurred through autophagy and 25% through parkin-dependent mitophagy, consistent with the idea that autophagy primarily degrades mitochondria that have become dysfunctional. We then investigated whether autophagy had differential effects on individual mitochondrial proteins. We modelled uniform, nonselective mitochondrial protein turnover and found that our data were incompatible with the model’s predictions. Most importantly, the calculated autophagic turnover rates of individual mitochondrial proteins ranged over two orders of magnitude. Only a small part of that range could be explained by differences in mitochondrial protein expression and mitochondrial autophagy rate in the tissues analysed, and autophagic turnover rates were equally diverse when calculated by comparing protein turnover in homogeneous ATG7−/− or ATG5−/− human fibroblasts with WT cells. Taken together, our findings show that autophagy degrades mitochondrial proteins at unequal rates, and that most mitochondrial protein turnover in both Drosophila and vertebrates occurs through non-autophagic processes.
Results
We measured the contribution of autophagy to mitochondrial protein degradation in vivo by comparing turnover rates of mitochondrial proteins in WT flies to their turnover rates in Atg7 null mutants [Citation43]. Atg7 encodes an evolutionarily conserved E1-like enzyme required for autophagic vesicle formation [Citation14]. In previous work, we demonstrated markedly impaired mitochondrial protein turnover in Drosophila Atg7 null mutants [Citation25], and we now used these well-characterised autophagy-deficient flies to quantify the contribution of autophagy to mitochondrial protein turnover. Briefly, we used stable isotope labelling followed by mass spectrometry to measure the rates at which unlabelled proteins were degraded and replaced by labelled proteins. The technique and other analyses of the data have been described [Citation25].
Calculating the contribution of autophagy to mitochondrial protein turnover
We identified 186 mitochondrial proteins from Drosophila heads that met quality criteria in both Atg7 mutants and controls (Dataset S1; see Materials and Methods). For each protein, we determined the autophagy-dependent turnover rate (the fraction of the protein’s total abundance degraded via autophagy per unit time), which we then used to calculate the contribution of autophagy to the protein’s overall degradation.
The turnover rate of any mitochondrial protein (M) is the sum of the mitochondrial autophagy rate and all non-autophagic turnover rates for that protein. Non-autophagic turnover includes degradation by mitochondrial proteases, the ubiquitin-proteasome system, mitochondria-derived vesicles, and any other non-autophagic degradation processes. We calculated autophagy-dependent turnover rate by subtracting the turnover rate of protein M in Atg7 mutants (in which turnover occurs solely through non-autophagic mechanisms) from the turnover rate of M in WT flies (which includes turnover via both autophagy and non-autophagic mechanisms), as follows:
We then calculated the ratio of the autophagy-dependent turnover rate to the protein’s overall degradation rate and expressed the result as a percentage. We called this measure of autophagy’s contribution to degradation percent autophagic turnover.
Mitochondrial proteins in fly heads showed a substantial range of percent autophagic turnover values, but the vast majority (89%) had less than 50% turnover through auto-phagy (), Dataset S1). Mean percent autophagic turnover for all mitochondrial proteins was 36.0% (± 11.7%; )). For comparison, we calculated percent autophagic turnover for proteins of the cytosolic ribosome (n = 52), another target of selective autophagy. In striking contrast to mitochondrial proteins, 96% of ribosomal proteins had percent autophagic turnover values greater than 50%, and the mean percent autophagic turnover for the ribosome was 63.9% ± 5.4% (p < 3.4 × 10−41 vs. mitochondrial proteins by Student t test; -b), Dataset S2). Thus, while the majority of ribosomal protein degradation is autophagic, autophagy accounts for approximately one-third of mitochondrial protein turnover.
Figure 1. Autophagy accounts for approximately one-third of mitochondrial protein turnover. (a) Percent autophagic turnover of individual mitochondrial proteins and cytosolic ribosomal proteins in Drosophila heads (n = 186 mitochondrial and 52 ribosomal proteins). (b) Mean percent autophagic turnover of mitochondrial and ribosomal proteins (significantly different by Student t test, p < 3.4 × 10−41). Error bars represent SD. (c) Contribution of parkin-dependent mitophagy to turnover of individual mitochondrial proteins. Unadjusted percent parkin-dependent turnover was calculated using 168 mitochondrial proteins common to the parkin, Atg7, and WT datasets (Dataset S1). Adjusted percent parkin-dependent turnover was calculated after excluding 53 putative targets of nonautophagic parkin-dependent degradation (see Materials and Methods), and is thus based on 115 proteins. (d) Mean percent parkin-dependent turnover for the mitochondrial proteins in panel C. Error bars represent SD.
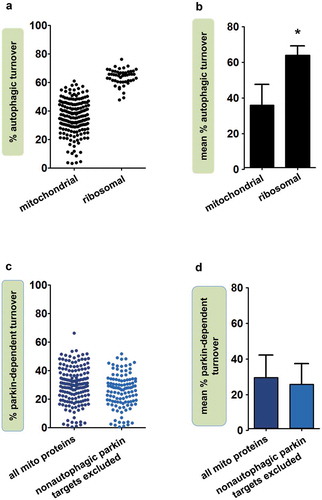
Most mitochondrial autophagy requires parkin
A form of mitochondrial autophagy that has been intensively studied in recent years is parkin-dependent mitophagy, a process that detects dysfunctional mitochondria and marks them for degradation [Citation23]. We previously observed that mitochondrial protein turnover was impaired in parkin mutants, though not as profoundly as in Atg7 mutants [Citation25]. To compare the influence of parkin and Atg7 more quantitatively, we calculated the contribution of parkin to mitochondrial protein turnover, comparing turnover rates in parkin mutants and WT flies ()). We included only the 168 mitochondrial proteins that met quality standards in all three relevant genotypes (parkin, Atg7, and WT; Dataset S1). The mean percent parkin-dependent turnover in fly heads was 29.5% ± 12.6% ()). However, because parkin also takes part in non-autophagic forms of mitochondrial protein turnover [Citation44–Citation47], including production of mitochondria-derived vesicles, this method of calculating parkin-dependent turnover could potentially overestimate its contribution to mitochondrial autophagy. We therefore recalculated mean percent parkin-dependent turnover after excluding likely targets of non-autophagic parkin-dependent degradation (Table S1; see Materials and Methods). Mean percent parkin-dependent turnover for the remaining proteins (n = 115) was 25.7% ± 11.8% ()). This adjusted mean parkin-dependent turnover value for mitochondrial proteins was ~70% of the overall mean autophagic turnover value derived from Atg7 mutants. Our findings thus suggest that a large proportion of autophagic mitochondrial protein degradation requires parkin, and that quality control surveillance is the major driver of autophagic mitochondrial protein degradation.
Mitochondrial autophagy is protein selective
We next considered the question of whether autophagy degrades mitochondrial proteins uniformly or selectively. The idea that autophagy degrades mitochondrial proteins uniformly dates back to Fletcher and Sanadi’s concept of mitochondria ‘turning over as an entity’, and we therefore called it the classical model of mitochondrial autophagy. According to the classical model, when a mitochondrion undergoes autophagy, all proteins are degraded simultaneously and equally. As described above, however, recent work in yeast and cell culture challenges this idea [Citation39–Citation42]. To determine whether basal autophagy is protein selective in an intact metazoan, we compared our Atg7 mutant findings to the predictions of the classical model. The key assumption of the classical model is the idea that mitochondrial proteins all undergo autophagic turnover at the same rate ()). By contrast, the rate of turnover via other degradation pathways differs from protein to protein, and thus total turnover rates vary.
Figure 2. Mitochondrial autophagy is protein selective. (a) Classical model of mitochondrial protein turnover. The total turnover rate of each mitochondrial protein is the sum of its turnover rate via autophagy (presumed to be the same for all proteins) and its turnover rate via non-autophagic mechanisms (different from protein to protein). The turnover rate via non-autophagic mechanisms is the sum of turnover by mitochondrial proteases, the ubiquitin-proteasome system, mitochondria-derived vesicles and any other non-autophagic degradation processes. Note that long-lived proteins are those with low total turnover rates. (b) Autophagy-dependent turnover rates (h−1) for individual mitochondrial and ribosomal proteins. (c) Mitochondrial proteins have a large range of autophagy-dependent turnover rates, but cytosolic ribosomal proteins do not. The 5% trimmed ranges (95th/5th percentile values) are displayed; the full ranges were 253.4-fold for mitochondrial proteins and 2.0-fold for ribosomal proteins. (d) Autophagy-dependent turnover rates of individual mitochondrial proteins vary substantially even within a specific region of the mitochondrion, including matrix (5% trimmed range 17.2-fold, n = 95) and inner membrane (IM; 5% trimmed range 24.7-fold, n = 72). (e) Percent autophagic turnover correlates positively rather than negatively with WT turnover rate (h−1).
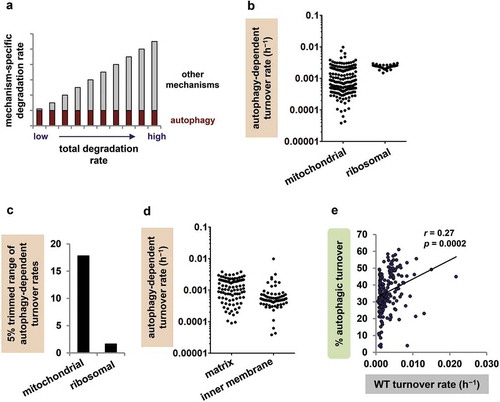
The classical model makes two testable predictions. First, the model predicts that the calculated autophagy-dependent turnover rates of mitochondrial proteins should fall within a narrow range because they are all approximations of a single true mitochondrial autophagy rate. Second, the model predicts that percent autophagic turnover for an individual mitochondrial protein should be inversely related to its overall WT turnover rate, because total turnover rate increases as the contribution of nonautophagic degradation becomes larger.
To test the first prediction, we compared autophagy-dependent turnover rates for all mitochondrial proteins. The autophagy-dependent turnover rates of mitochondrial proteins spanned a 253-fold range ()); when we considered only the rates from the 5th to the 95th percentile (the 5% trimmed range) to limit the impact of extreme values, the range was still ~18-fold ()). Even groups of proteins localising to a particular region of the mitochondrion (e.g. inner membrane proteins) had large ranges of autophagy-dependent turnover rates ()); the range of autophagy-dependent turnover rates for complex I proteins alone was 4.1-fold (Figure S1). To put the findings in perspective, we again compared them to data from another target of autophagy, the cytosolic ribosome. The autophagy-dependent turnover rates of ribosomal proteins fell within a relatively narrow range (full range 2.0-fold and 5% trimmed range 1.6-fold; -c)), indicating that the large range of rates for mitochondrial proteins reflected a biological phenomenon rather than experimental noise.
To test the second prediction, we plotted percent autophagic turnover against WT turnover rate for each mitochondrial protein. The correlation between percent autophagic turnover and WT turnover rate was, surprisingly, significantly positive rather than negative ()). Proteins with low overall turnover rates (long-lived proteins), predicted to have high percent autophagic turnover, actually had very modest percentages of turnover through autophagy. In fact, the mitochondrial proteins with the lowest WT turnover rates (n = 19, the lowest 10% of the dataset) all had percent autophagic turnover values under 50%, and their mean percent autophagic turnover was lower than the mean for the remaining proteins in the dataset (28.5% vs. 36.8%; p < 0.005). Our findings thus contradict both of the classical model’s predictions and suggest that, instead of degrading all mitochondrial proteins equally, mitochondrial autophagy has differential effects on individual mitochondrial proteins.
The mitochondrial autophagy findings are not explained by genetic compensation
An alternative explanation for both the moderate percentage contribution of autophagy and the wide-ranging autophagy-dependent turnover rates of mitochondrial proteins is compensatory upregulation of non-autophagic degradation. Induction of a compensatory degradation pathway in Atg7 mutants would decrease the effects of Atg7 inactivation on mitochondrial protein turnover; if the compensatory pathway were protein selective, its induction might also increase the range of autophagy-dependent turnover rates. While compensation probably occurs to some extent in all mutants, we do not believe that it accounts for our major findings, based on the following evidence. First, we looked for upregulation of compensatory turnover pathways, using both RNA and protein data. Microarray analysis of the Atg7 mutants showed no change in expression of genes encoding proteasome subunits, mitochondrial proteases, mitochondrial vesicle factors, auto-phagy factors other than Atg7, or specific mitophagy factors (Table S2, Dataset S3). We also measured the abundance of proteins in these same categories, and found significant changes in only 2 of 58 proteins (~3%; Table S2, Dataset S4). Second, we investigated whether turnover was less autophagy dependent in proteins identified as substrates of non-autophagic turnover processes. We hypothesised that normal substrates of a given turnover pathway would be most affected by compensatory induction of that pathway. However, orthologues of the mitochondrial proteins identified as proteasome substrates by Wagner et al. [Citation48] did not differ from other mitochondrial proteins in percent autophagic turnover or autophagy-dependent turnover rate (-b)); neither did proteins bearing degron sequences for the mitochondrial proteases YME1L (YME1 like ATPase) and Lon [Citation49,Citation50] (-d)). We thus found no evidence that our data are explained by genetic compensation.
Figure 3. The effects of Atg7 ablation are not explained by induction of potential compensatory turnover mechanisms. (a) Autophagy-dependent turnover rates (h−1) of fly orthologues of mitochondrial proteins with (n = 43) and without (n = 143) evidence of proteasomal turnover (ubiquitinated [Ub] sites) [Citation48]. Red lines indicate means. (b) Percent autophagic turnover of fly orthologues of mitochondrial proteins with and without ubiquitinated sites, as in panel A. (c) Autophagy-dependent turnover rates (h−1) of individual mitochondrial proteins with (n = 24) and without (n = 162) degrons for mitochondrial proteases Lon and YME1L [Citation49,Citation50]. (d) Percent autophagic turnover of mitochondrial proteins with and without protease degrons (as in panel C). Comparisons of means in panels A through D are all nonsignificant by Student t test.
![Figure 3. The effects of Atg7 ablation are not explained by induction of potential compensatory turnover mechanisms. (a) Autophagy-dependent turnover rates (h−1) of fly orthologues of mitochondrial proteins with (n = 43) and without (n = 143) evidence of proteasomal turnover (ubiquitinated [Ub] sites) [Citation48]. Red lines indicate means. (b) Percent autophagic turnover of fly orthologues of mitochondrial proteins with and without ubiquitinated sites, as in panel A. (c) Autophagy-dependent turnover rates (h−1) of individual mitochondrial proteins with (n = 24) and without (n = 162) degrons for mitochondrial proteases Lon and YME1L [Citation49,Citation50]. (d) Percent autophagic turnover of mitochondrial proteins with and without protease degrons (as in panel C). Comparisons of means in panels A through D are all nonsignificant by Student t test.](/cms/asset/bd9367a2-23e2-4c25-90ed-ec82b41570d2/kaup_a_1586258_f0003_c.jpg)
Tissue differences in protein expression and mitochondrial autophagy rate contribute to the range of autophagy-dependent turnover rates
Another possible explanation for the existence of diverse auto-phagy-dependent turnover rates in the fly head samples arises from the fact that they contain multiple tissues. Tissue differences in mitochondrial protein expression and mitochondrial autophagy rate could interact to produce diverse autophagy-dependent turnover rates for individual mitochondrial proteins (see Figure S2 for a detailed explanation). As there is evidence in vertebrates for both differential tissue expression of mitochondrial proteins [Citation51] and tissue-specific mitochondrial autophagy rates [Citation52,Citation53], we considered the possibility that the range of autophagy-dependent turnover rates could be explained in terms of tissue differences within Drosophila heads.
We first determined whether fly heads had significant differences in mitochondrial protein composition between tissues. Gene expression values for three fly head tissues (brain, fat body and eye) were available from the public data repository FlyAtlas [Citation54]. For genes encoding the mitochondrial proteins in our fly head data, we found that normalised expression of individual genes in a given tissue varied by as much as two orders of magnitude (Figure S3, Dataset S1). We then tested whether this variation in tissue expression correlated with autophagy-dependent turnover rate. Autophagy-dependent turnover rate correlated negatively with brain expression and positively with fat body expression, and had no relationship with eye expression (-c)). By contrast, in proteins from other organelles targeted by autophagy (ribosomes, endoplasmic reticulum [ER], and peroxisomes), we found no significant relationship between autophagy-dependent turnover rate and expression in any of the head tissues (–f)); the findings in mitochondrial proteins therefore appeared to reflect tissue differences in mitochondrial autophagy rate rather than in general autophagy. These results are consistent with the idea that heterogeneous tissue expression of proteins could explain some observed variation in autophagy-dependent turnover rates (Figure S2), and they also suggest that mitochondrial autophagy rate is substantially lower in brain than in fat body.
Figure 4. Autophagy-dependent turnover rates of mitochondrial proteins correlate with their tissue expression. Normalised gene expression (tissue enrichment) values for brain, fat body, and eye were obtained from FlyAtlas [Citation102] and were log10 transformed to normalise skewed distributions. Autophagy-dependent turnover rates (h−1) were calculated for all mitochondrial proteins with available FlyAtlas data (n = 177), and for proteins from other organelles degraded by autophagy (ribosomes, ER, and peroxisomes). Autophagy-dependent turnover rates of mitochondrial proteins correlate negatively with brain expression (a) and positively with fat body expression (b). There is no significant relationship with eye expression (c). Autophagy-dependent turnover rates of other organellar proteins (ribosomes, ER, and peroxisomes) do not correlate significantly with expression in brain (d), fat body (e), or eye (f); n = 82 other organellar proteins with FlyAtlas data for brain, 79 for fat body, 80 for eye.
![Figure 4. Autophagy-dependent turnover rates of mitochondrial proteins correlate with their tissue expression. Normalised gene expression (tissue enrichment) values for brain, fat body, and eye were obtained from FlyAtlas [Citation102] and were log10 transformed to normalise skewed distributions. Autophagy-dependent turnover rates (h−1) were calculated for all mitochondrial proteins with available FlyAtlas data (n = 177), and for proteins from other organelles degraded by autophagy (ribosomes, ER, and peroxisomes). Autophagy-dependent turnover rates of mitochondrial proteins correlate negatively with brain expression (a) and positively with fat body expression (b). There is no significant relationship with eye expression (c). Autophagy-dependent turnover rates of other organellar proteins (ribosomes, ER, and peroxisomes) do not correlate significantly with expression in brain (d), fat body (e), or eye (f); n = 82 other organellar proteins with FlyAtlas data for brain, 79 for fat body, 80 for eye.](/cms/asset/3d9790b1-5484-4dfc-986e-740a95add935/kaup_a_1586258_f0004_c.jpg)
While tissue differences in mitochondrial autophagy rate contributed to the varying autophagy-dependent turnover rates of mitochondrial proteins, they did not provide a complete explanation for the wide range of rates. Correlations between mitochondrial proteins’ autophagy-dependent turnover rates and their expression in a given tissue, even when statistically significant, accounted for a minority of the total variance (R2 = 0.01 to 0.26). Mitochondrial autophagy rate differences in tissues not documented in FlyAtlas might account for some of the remaining variation; however, to explain the observed range of auto-phagy-dependent turnover rates, such differences would have to be vast (Figure S4).
Autophagy-dependent turnover rates of mitochondrial proteins are diverse in a single cell type
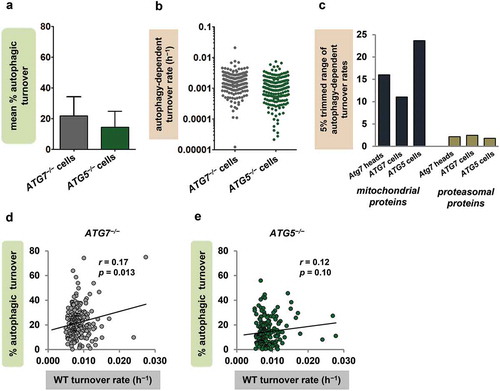
To test more definitively whether our findings were explained by tissue differences in mitochondrial autophagy rate and protein composition, we measured the contribution of autophagy to mitochondrial protein turnover in a single cell type. We compared mitochondrial protein turnover rates in ATG7−/− and ATG5−/− engineered human fibroblasts (originally described by Zhang et al. [Citation55]) to the corresponding rates in WT cells, and calculated percent autophagic turnover as described above (), Dataset S5). The mean percent autophagic turnover was 21.8% ± 16.7% when calculated from ATG7−/− cells (n = 211 proteins), and 14.4% ± 10.3% when calculated from ATG5−/− cells (196 proteins), consistent with our in vivo finding that most mitochondrial protein turnover occurs through non-autophagic mechanisms. Also, in both cell lines, the autophagy-dependent turnover rates of mitochondrial proteins spanned ranges comparable to those seen in fly heads. In ATG7−/− fibroblasts, the full range of rates was 1659-fold and the 5% trimmed range 11-fold; in ATG5−/−, the full and trimmed ranges were 1079-fold and 28-fold, respectively (-c)). As in previous analyses, we compared the mitochondrial protein findings to data from another target of autophagy [Citation56]. Because ribosomal turnover showed little dependence on autophagy in the fibroblasts, we compared mitochondrial proteins from fibroblasts and fly heads to proteins of the proteasome, which also undergoes autophagic degradation [Citation57]. The range of autophagy-dependent turnover rates was much larger for mitochondrial than for proteasomal proteins in both ATG7−/− and ATG5−/− fibroblasts, and in Atg7 null fly heads as well ()). In addition, the percent autophagic turnover values of individual mitochondrial proteins did not show an inverse relationship with WT turnover rate (-e)), again contradicting the classical model of mitochondrial autophagy. In fact, ATG7−/− fibroblasts, like fly heads, showed a significant positive correlation between WT turnover rate and percent autophagic turnover ()), and ATG5−/− fibroblasts showed a trend in the same direction ()).
Figure 5. Findings in autophagy-deficient cultured cells support the protein selectivity of mitochondrial autophagy. (a) Mean percent autophagic turnover calculated from ATG7−/− (n = 211 proteins) and ATG5−/− (n = 196) vs. WT human fibroblasts. Error bars represent SD. (b) Autophagy-dependent turnover rates of individual mitochondrial proteins calculated from ATG7−/− and ATG5−/− fibroblasts (ranges 1659-fold and 1079-fold, respectively). (c) The 5% trimmed ranges (95th/5th percentile) of autophagy-dependent turnover rates for mitochondrial and proteasomal proteins in ATG7−/− fly heads, ATG7−/− fibroblasts, and ATG5−/− fibroblasts (n = 16 proteasomal proteins in heads and 33 in both ATG7−/− and ATG5−/− fibroblasts). (d and e) Percent autophagic turnover correlates positively with WT turnover rate (h−1) for mitochondrial proteins in ATG7−/− fibroblasts (d). ATG5−/− fibroblasts (e) show a trend-level positive correlation between percent autophagic turnover and WT turnover rate as well.
As before, we looked for evidence that our findings could be explained by genetic compensation. Measurement of protein abundance in the ATG5−/− fibroblasts revealed modestly increased abundance of most proteasome subunits, and proteasome activity was ~25% above WT [Citation55]. While the increased proteasome activity might explain the lower mean percent autophagic turnover values in fibroblasts compared to fly heads (), )), it did not appear to explain the range of autophagy-dependent turnover rates. We found no differences in percent autophagic turnover or auto-phagy-dependent turnover rate in mitochondrial proteins identified as proteasome targets [Citation48] (proteins with ubiquitinated sites; -b), Figure S5A–B). Likewise, the abundance of Lon protease was 17% higher in ATG5−/− mutants compared to WT, but there were no significant associations of percent autophagic turnover or autophagy-dependent turnover rate with the presence of mitochondrial protease degron sequences (-d), Figure S5C–D). The simplest explanation for the observed diversity of autophagy-dependent turnover rates in both fly heads and human cells is that some mitochondrial proteins undergo more autophagic degradation than others.
Figure 6. The protein-selective effects of autophagy in ATG7−/− and ATG5−/− cells are not explained by genetic compensation. (a) Autophagy-dependent turnover rates (h−1) of mitochondrial proteins from ATG7−/− fibroblasts with and without evidence of proteasomal turnover (ubiquitinated [Ub] sites) [Citation48]. Red lines indicate means; n = 44 proteins with ubiquitinated sites, 167 without. (b) Autophagy-dependent turnover rates (h−1) of mitochondrial proteins from ATG5−/− fibroblasts with (n = 45) and without (n = 151) ubiquitinated sites, as in panel A. (c) Autophagy-dependent turnover rates (h−1) of individual mitochondrial proteins from ATG7−/− fibroblasts with (n = 31) and without (n = 180) degrons for mitochondrial proteases Lon and YME1L1. (d) Autophagy-dependent turnover rates (h−1) of individual mitochondrial proteins from ATG5−/− fibroblasts with and without protease degrons (n = 30 proteins with degrons, 166 without). All comparisons of means in panels A through D are nonsignificant by Student t test.
![Figure 6. The protein-selective effects of autophagy in ATG7−/− and ATG5−/− cells are not explained by genetic compensation. (a) Autophagy-dependent turnover rates (h−1) of mitochondrial proteins from ATG7−/− fibroblasts with and without evidence of proteasomal turnover (ubiquitinated [Ub] sites) [Citation48]. Red lines indicate means; n = 44 proteins with ubiquitinated sites, 167 without. (b) Autophagy-dependent turnover rates (h−1) of mitochondrial proteins from ATG5−/− fibroblasts with (n = 45) and without (n = 151) ubiquitinated sites, as in panel A. (c) Autophagy-dependent turnover rates (h−1) of individual mitochondrial proteins from ATG7−/− fibroblasts with (n = 31) and without (n = 180) degrons for mitochondrial proteases Lon and YME1L1. (d) Autophagy-dependent turnover rates (h−1) of individual mitochondrial proteins from ATG5−/− fibroblasts with and without protease degrons (n = 30 proteins with degrons, 166 without). All comparisons of means in panels A through D are nonsignificant by Student t test.](/cms/asset/54ece987-be05-4412-8db7-2164d021345d/kaup_a_1586258_f0006_c.jpg)
Discussion
In this work, we addressed two fundamental questions about mitochondrial autophagy. First, what proportion of mitochondrial protein degradation occurs through autophagy? Second, is the process significantly protein selective? We found that autophagy accounts for approximately one-third of mitochondrial protein turnover in vivo, and that individual mitochondrial proteins are degraded by autophagy at highly divergent rates.
Our finding that autophagy was not the primary mechanism of mitochondrial protein turnover is consistent with previous work suggesting large-scale mitochondrial protein turnover by non-autophagic processes; for instance, proteasome inhibition in mammalian cells causes dramatic accumulation of mitochondrial proteins [Citation12], and yeast mitochondrial proteases can degrade up to ~5% of total mitochondrial protein per hour [Citation58]. Studies of mitochondrial DNA turnover also suggest that autophagic degradation of mitochondria is not a high-frequency event [Citation59,Citation60]. These findings corroborate the general accuracy of our measurement. It is entirely possible, however, that autophagy makes larger contributions to mitochondrial protein turnover during other life stages or under different metabolic conditions. Our technique did have the potential to underestimate autophagic turnover if alternative autophagy pathways [Citation61,Citation62] contributed significantly to mitochondrial protein turnover. However, multiple reports indicate that strong inhibition of the Atg7-dependent pathway causes profound to total blockade of mitochondrial autophagy [Citation22,Citation42,Citation52,Citation63–Citation65].
Selective autophagic degradation of mitochondrial proteins has been clearly demonstrated in yeast under stress conditions [Citation39,Citation40], and cell culture studies have indicated that protein-selective mitochondrial autophagy may also occur in vertebrates [Citation41,Citation42]; we now demonstrate that basal autophagy degrades mitochondrial proteins at widely differing rates in an intact metazoan. Multiple factors could contribute to the protein selectivity of mitochondrial autophagy. For instance, among mitochondria within a single cell, the probability of autophagic degradation may correspond with subcellular variation in protein composition. Mitochondria in different regions of a cell (e.g. perinuclear vs. peripheral) show differences on multiple measures, including protein content, membrane potential, respiration rate, and reactive oxygen species generation [Citation66–Citation69]. The probability of mitochondrial auto-phagy could likewise differ between subcellular regions, whether because of environmental factors (local availability of autophagic machinery [Citation70]) or intrinsic characteristics (functional specialisation leading to high reactive oxygen species production [Citation68]). Subcellular mitochondrial heterogeneity could explain why the classical model of mitochondrial auto-phagy underestimated percent autophagic turnover in mitochondrial proteins with high WT turnover rates (short-lived proteins; )). These proteins included many enzymes involved in fatty acid and amino acid metabolism (Dataset S1), which may have been concentrated in a functionally specialised mitochondrial population with a high probability of autophagy.
Differences in mitochondrial protein composition within a cell may also arise dynamically as part of quality control. Mitochondrial fission has been shown to produce daughter mitochondria with significant differences in membrane potential and probability of autophagic degradation, and possibly even in physical structure [Citation71,Citation72]. These differences could reflect active or passive damage-based sorting of damaged proteins into areas of the mitochondrial network that will ultimately be isolated and degraded [Citation73–Citation75]. While the sorting process itself remains largely speculative, there is clear evidence that cells can target concentrations of abnormal mitochondrial protein; such damage-enriched areas recruit quality control and fission factors to facilitate their own removal [Citation76,Citation77]. The net result of these selective sorting and degradation processes could be high autophagic turnover rates for proteins prone to unfolding or damage.
Differences in autophagic turnover between mitochondrial proteins could also reflect sorting based on a protein’s identity or characteristics. This phenomenon has been demonstrated in aging yeast, which generate mitochondria-derived compartments containing only highly defined subsets of proteins [Citation39]. If identity-based sorting occurs in other contexts, proteins extremely prone to oxidative damage or unfolding might be actively directed to autophagy-bound mitochondria at high rates, a preventive approach that could produce more effective quality control than damage sensing alone. Conversely, proteins that are energetically costly to replace could be sorted into areas of the mitochondrial network with low probabilities of degradation. This type of sorting would explain our findings on mitochondrial proteins with low WT turnover rates; their combination of low total turnover rates and modest percent autophagic turnover is consistent with active exclusion from autophagy-bound mitochondria. Many questions remain, particularly as to the physical mechanisms of protein redistribution, but the advantages of the process are clear. Active redistribution of mitochondrial proteins would lend additional flexibility and precision to quality control, and would facilitate quick adjustments to changing conditions.
In summary, our findings suggest that autophagy’s role in mitochondrial quality control is different, but no less vital, than previously envisioned. First, while the contribution of autophagy was less than that of all other degradation pathways combined, autophagy may still degrade more mitochondrial protein than any other single mechanism. Second, the most important function of mitochondrial autophagy may not be large-scale protein degradation, but swift removal of unsalvageable parts of the mitochondrial network. The relatively large contribution of parkin-dependent mitophagy underscores the idea that autophagy degrades mitochondria primarily when they have become severely dysfunctional. Autophagy can thus be seen as a cell’s crucial last line of defence against mitochondrial damage. Nevertheless, our findings raise new questions about the widely proposed strategy of enhancing autophagy to treat neurodegenerative disease [Citation78]. Would drug-stimulated mitochondrial autophagy retain its protein selectivity? If not, would the change be detrimental? Our work also suggests that enhancing non-autophagic mitochondrial protein turnover might be an even better therapeutic approach. A deeper understanding of non-autophagic mitochondrial protein turnover mechanisms, and their individual roles in mitochondrial health, is thus an important goal for future research.
Materials and methods
Drosophila strains and culture
Fly stocks were maintained on standard cornmeal-molasses food at 25°C. The Atg7d4, Atg7d77, park25, and Pink1rv alleles, as well as the UAS-Pink1#2 strain, have been previously described [Citation43,Citation79,Citation80]. Other strains and alleles were originally obtained from the Bloomington Stock Center. Atg7 null mutants were Atg7d4/Atg7d77 transheterozygotes. The full genotype of parkin mutants was If/CyO; park25/park25. The WT controls were four separate groups of healthy flies with intentionally diverse genetic backgrounds (see protein turnover rate calculations section).
In vivo stable isotope labelling of flies
[5,5,5 – 2H3] leucine (D3-leucine; 99 atom % deuterium) was obtained from Isotec/Sigma-Aldrich (486825). Synthetic complete medium without leucine (C-Leu) [Citation81] was supplemented with glucose and 60 mg/L D3-leucine. A strain of Saccharomyces cerevisiae auxotrophic for leucine (BB14-3A, Brewer Lab, University of Washington [Citation82]) was grown to saturation at 30°C, then spun down, flash-frozen in liquid nitrogen, lyophilised, and stored at −80°C until needed. Groups of 10 to 50 male flies were selected on the day of eclosion and housed in perforated plastic flasks, where they received plain yeast paste for 24 h. They were then provided with D3-leucine–labelled yeast paste, which was replaced every 2–3 days, and were maintained in humidified containers at 25°C. After 120 h or 240 h of labeling (the shortest time points that allowed adequate labeling of mitochondrial proteins), flies were flash-frozen in liquid nitrogen. Three biological replicates (50–115 heads each) were obtained for each genotype and time point.
Sample preparation
Frozen flies were vortexed to remove heads, and the isolated heads were homogenised in 0.1% RapiGest (Waters Corporation, 186001861) solution in 50 mM ammonium bicarbonate (Fisher Scientific, A643) using a 0.2-mL Wheaton micro tissue grinder (Fisher Scientific, 08-414-15B). Homogenates were centrifuged at 4°C at 1600 × g for 10 min, and then at 6500 × g for 10 min, to remove debris and nuclei. The supernatants were then boiled for 7 min and incubated at 60°C for 30 min with dithiothreitol (Sigma-Aldrich, Inc., D0632) at a final concentration of 5 mM. Iodoacetamide (Sigma-Aldrich, Inc., I1149) was added to a final concentration of 15 mM, and the samples were incubated at room temperature in the dark for 30 min. Trypsin (Fisher Scientific, PR-V5111) was added at a ratio of 1 μg trypsin per 50 μg protein, and the samples were incubated for 1 h at 37°C with shaking. RapiGest was hydrolysed by adding hydrochloric acid (Fisher Scientific, SA56-1) to a final concentration of 200 mM, followed by incubation at 37°C with shaking for 45 min. The samples were then centrifuged for 10 min at 4°C at 20,000 × g, and the supernatant was collected.
Mass spectrometry
Liquid chromatography and mass spectrometry were performed as previously described [Citation25]. High-resolution MS data were processed with BullsEye to optimise precursor mass information [Citation83]. The MS/MS output was searched using SEQUEST [Citation84], with a differential modification of 3.0188325 Da for leucine and a static modification of 57.021461 Da for cysteine, against a FASTA database containing all protein sequences from FlyBase [Citation85] plus contaminant proteins. Peptide-spectrum match false discovery rates were determined using Percolator [Citation86] at a threshold of 0.01, and peptides were assembled into protein identifications using an in-house implementation of IDPicker [Citation87].
Annotation of Drosophila proteins
Drosophila protein localisation was determined from a variety of resources including gene and protein information databases (FlyBase [Citation88], MitoDrome [Citation89], NCBI [Citation90], UniProt [Citation91]), protein localisation prediction algorithms (WoLF PSORT [Citation92], MitoProt [Citation93], Predotar [Citation94], SignalP [Citation95], NucPred [Citation96], and PTS1 Predictor [Citation97,Citation98]), BLAST [Citation99] and primary literature.
Protein turnover rate calculations
Turnover rates for fly head proteins were calculated using Topograph software [Citation100] as described in Vincow et al. [Citation25]. A protein’s turnover rate was computed based on data from all peptides detected, and data points from all biological replicates were pooled for turnover calculations. All proteins included in the dataset had at least 15 measurements per genotype of percent turnover, derived from at least two peptides. Peptides that could be the product of more than one gene were excluded from analysis. For a small percentage of genes (2–5%), Topograph grouped peptides corresponding to a single gene into 2–3 non-overlapping ‘isoform groups’. For example, isoform group 1 might include peptides mapping only to the COX6B-PA isoform, while isoform group 2 peptides could have come from COX6B-PA, -PB, or -PC. While in most cases the isoform groups for a single protein had essentially identical turnover rates, occasionally they displayed significant differences. Each isoform group was therefore analysed as a separate protein.
We excluded proteins with excessive inter-replicate variability of turnover rates. To do this, we calculated the turnover rate separately for each biological replicate and determined the coefficient of variation across replicates. Proteins with coefficient of variation ≥ 0.25 were excluded from analysis. Proteins were analysed only if they met inclusion criteria in both mutants and WT controls. One ribosomal protein and one ER protein had faster turnover in mutants than in controls (negative autophagy-dependent turnover rates) and were outliers by the Tukey method [Citation101]; they were excluded from analysis.
In previous work, we had compared Atg7 and parkin null mutants to their respective heterozygotes. However, we later found that both Atg7 and parkin heterozygotes had mild but significant slowing of mitochondrial protein turnover compared to WT flies. The previously reported effects of Atg7 and parkin null mutations on turnover thus represent underestimates, and we substituted the current WT dataset as a more appropriate control for both mutants. The WT dataset is a composite derived from four separate groups of healthy flies (w1118, Pink1rv, CyOActGFP/+, and a mixture of CyO/Hsp70-GAL4 and CyO/UAS-Pink1#2). This approach maximised the number of mitochondrial proteins identified and minimised any influence of genetic background on turnover rate. Turnover rates are the mean values for all genotypes in which the protein was detected, and are highly consistent across genotypes, as previously reported [Citation25]. Five mitochondrial proteins showed excessive variability of turnover rates across genotypes (inter-genotype coefficient of variation ≥ 0.25) and were excluded from analysis.
Calculation of percent autophagic turnover and percent parkin-dependent turnover
We calculated percent autophagic turnover as described in the text, and we calculated parkin-dependent turnover by comparing turnover in parkin mutants with turnover in WT controls. For the sake of comparability, we restricted analyses to those proteins that also met quality standards in Atg7 mutants. All proteins in parkin-dependent turnover analyses were thus detected in WT, parkin and Atg7 flies. Five proteins had negative parkin-dependent turnover values and were excluded from analysis (final n = 168 proteins). Percent parkin-dependent turnover was calculated for each mitochondrial protein by adapting the equation used for Atg7 mutants:
A more conservative estimate of parkin-dependent autophagic turnover was also calculated by excluding proteins that appeared to undergo non-autophagic forms of parkin-dependent turnover (Table S1). As previously described [Citation25], proteins were designated potential selective parkin targets if their individual percent parkin-dependent turnover was greater than their percent autophagic turnover (n = 53).
Analysis of tissue-specific gene expression
Tissue expression of genes encoding mitochondrial and other organellar proteins was determined using FlyAtlas microarray data [Citation54]. If more than one probeset matched a given gene, we selected the best match based on signal level, exclusivity and/or location within the gene. Expression was analysed in all FlyAtlas tissues represented in the head: brain, fat body and eye. We were primarily interested in the proportion of a given mitochondrial protein that was expressed in each tissue (in other words, how much of the protein’s total abundance was found in that tissue). We therefore analysed the relative tissue expression (enrichment) of genes encoding the proteins of interest. To do this, we normalised each tissue RNA value to the RNA value for whole fly, as described by Robinson et al. [Citation102].
Of 186 mitochondrial proteins, 4 were mitochondrially encoded and 5 had no usable RNA data, leaving 177 proteins with RNA measurements. For other organellar proteins (ER, ribosome and peroxisome), the number of genes with usable RNA values varied slightly by tissue because a few genes were not reliably detected in fat body or eye. The final number of genes was 82 for brain, 79 for fat body and 80 for eye.
Microarray analysis
Gene expression in Atg7 mutants was evaluated by reanalysis of microarray data originally published by Erdi et al. [Citation103]. Raw data were downloaded from the ArrayExpress website (study E-MEXP-3352) using the Bioconductor ArrayExpress package [Citation104]. Microarray analysis was performed using 4 × 44 k format Drosophila Gene Expression Microarrays (Agilent, G2519F-021791). Atg7 mutants (third instar larvae) were compound heterozygous for null mutations (Atg7d14/Atg7d77), and controls were heterozygotes (Atg7d14/CG5335d30). CG5335 is an unrelated gene located within an exon of Atg7. Only data from fed larvae were used. Experimental design and procedures were otherwise as previously described [Citation103].
The data had been collected using two-colour arrays, but for this analysis we wished to compare samples that were not hybridised on the same array, so we analysed the data using a separate-channel analysis method implemented in the Bioconductor limma package [Citation105,Citation106]. Briefly, we background corrected the individual channel data using the ‘normexp’ method, with an offset of 50. This estimates an array-wide background value by modelling the data as a convolution between a lognormal and an exponential distribution. After subtracting the background estimate, we normalised within each array using a locally weighted (loess) fit, and then normalised between arrays using a so-called ‘Aquantile’ normalisation, which performs a quantile normalisation based on the average spot intensity, while keeping the log-ratios of each spot unchanged.
The separate-channel analysis is based on the observation that while the log-ratios for a given spot are correlated, the log-ratio (M value) and the average log spot intensity (A value) are not. We rescale the M and A values based on an estimate of the intra-spot correlation, and then fit a conventional linear model based on the rescaled M and A values. Since the M and A values can be expressed as linear combinations of the log expression values for each spot, it is straightforward to fit the model and then compute any contrast of interest.
For this experiment, we were only interested in the comparison between fed Atg7 nulls and fed controls. However, we fitted a linear model using all the array data, and then computed an empirical Bayes adjusted contrast between the two groups of interest. Using all arrays and the empirical Bayes adjustment allowed us to borrow information both across arrays and across genes, increasing power to detect differences. The p values were corrected for multiple testing using Benjamini and Hochberg’s original procedure (false discovery rate = 0.1) [Citation107]. After analysis was complete, we mapped the probe sequences to Drosophila transcripts using BLAST+ [Citation99], FlyBase [Citation88], and Entrez Gene [Citation90]. Of the 91 probes that showed significant difference in expression between genotypes, 69 matched known gene transcripts, and we obtained Gene Ontology information for these using FlyBase [Citation88].
Measurement of protein abundance
We measured protein abundance from the same raw mass spectrometry data used in the turnover study. Abundance comparisons were made at the second time point (240 h), when differences between genotypes were most marked. For this analysis we used the original heterozygote control flies rather than WT flies (see ‘Protein turnover rate calculations’ above). While the composite control group approach was appropriate for measurement of turnover (more consistent and less noisy than abundance [Citation25]), measurement of relative protein abundance required mutant and control samples that had been run at the same time. We calculated fold change in protein abundance between mutant and control using Skyline [Citation108] and MSstats [Citation109]. Prior to MSstats analysis, we computed total abundance (labelled plus unlabelled) for each peptide using an R script. The statistical significance of intergroup differences was calculated using a linear mixed model, then adjusted for multiple comparisons by the Benjamini–Hochberg procedure with a false discovery rate of 0.05.
Analysis of human ATG7 and ATG5 null fibroblast data
We analysed previously published sets of protein turnover rates from engineered human fibroblasts lacking either ATG7 or ATG5 [Citation55]. For each mutant vs. WT comparison, we included proteins that met either of two criteria: the protein was marked ‘selected’ in both genotypes, or its correlation coefficient for kdeg was ≥ 0.7 in both genotypes. ‘Selected’ means that the protein was chosen for analysis in the original publication on these datasets [Citation55]. Approximately 12% of mitochondrial proteins in the ATG7−/− dataset and 15% in the ATG5−/− dataset had negative autophagy-dependent turnover rates (faster turnover in the mutant), and were excluded from analysis. We classified a protein as mitochondrial if it met any of the following criteria:
1) The protein was identified as mitochondrial in the human version of MitoCarta 2.0 [Citation110] based on evidence types known, GFP [green fluorescent protein], proteomics, or strong computational. Proteins of the cytosolic ribosome were excluded.
2) The protein had ‘mitochondrion’ or ‘mitochondria[l]’ in its UniProt protein name or NCBI gene name.
3) The protein had an amply documented mitochondrial function (e.g. complex IV assembly).
Identification of proteasome and mitochondrial protease substrates
We identified probable substrates of mitochondrial proteases in both fly head and human fibroblast data based on the presence of degron sequences for mitochondrial proteases Lon and YME1L (YME1L in Drosophila, YME1L1 in Homo sapiens) [Citation49,Citation50]. We obtained sequences for the fly proteome from FlyBase and for the human proteome from NCBI, and searched both proteomes for degrons using an algorithm written in Python 2.7. Criteria for the YME1L degron were based on the hidden Markov model described by Rampello et al. [Citation50]. Lon degron motifs were FhhF and FhhFP, where ‘h’ is a hydrophobic amino acid on the Janin scale [Citation111]. A protein was designated as degron-bearing if any of its isoforms had at least one degron.
We identified proteins as proteasome substrates based on the presence of ubiquitinated sites as reported by Wagner et al. [Citation48]. These were sites that showed altered abundance of ubiquitinated peptides after proteasome inhibitor treatment. For the human ATG5−/− and ATG7−/− fibroblasts, we compared mitochondrial proteins with one or more ubiquitinated sites to the remaining mitochondrial proteins. For fly heads, we did the same using Drosophila orthologues of the Wagner et al. data. We obtained these orthologues with the DRSC Integrative Ortholog Prediction Tool [Citation112] (DIOPT) v6.0.3, minimum score 5.
Supplemental Material
Download Zip (1.6 MB)Acknowledgments
We thank J.K. Chung, A. Duttaroy, and T. Neufeld for providing fly stocks. We thank the Brewer Lab at the University of Washington for BB14-3A yeast and for their gracious assistance with yeast culture. We thank the Rabinovitch Lab for sharing unpublished data and providing feedback. We are also grateful to the University of Washington’s Proteomics Resource for mass spectrometry facilities and members of the Pallanck Lab for critical reading of the manuscript.
Disclosure statement
No potential conflict of interest was reported by the authors.
Supplemental material
Supplemental data for this article can be accessed here.
Additional information
Funding
Related Research Data
References
- Wang C, Youle RJ. The role of mitochondria in apoptosis. Annu Rev Genet. 2009;43:95–118.
- McBride HM, Neuspiel M, Wasiak S. Mitochondria: more than just a powerhouse. Curr Biol. 2006 Jul 25;16(14):R551–60.
- Wallace DC. Mitochondria and cancer. Nat Rev Cancer. 2012 Oct;12(10):685–698.
- Lill R, Hoffmann B, Molik S, et al. The role of mitochondria in cellular iron-sulfur protein biogenesis and iron metabolism. Biochim Biophys Acta. 2012 Sep;1823(9):1491–1508.
- Mari M, Morales A, Colell A, et al. Mitochondrial glutathione: features, regulation and role in disease. Biochim Biophys Acta. 2012 Oct 30;1830(5):3317–3328.
- Bratic A, Larsson NG. The role of mitochondria in aging. J Clin Invest. 2013 Mar;123(3):951–957.
- Kong Y, Trabucco SE, Zhang H. Oxidative stress, mitochondrial dysfunction and the mitochondria theory of aging. Interdiscip Top Gerontol. 2014;39:86–107.
- Dupuis L. Mitochondrial quality control in neurodegenerative diseases. Biochimie. 2014 May;100:177–183.
- Bulteau AL, Bayot A. Mitochondrial proteases and cancer. Biochim Biophys Acta. 2011 Jun;1807(6):595–601.
- Neutzner A, Youle RJ, Karbowski M. Outer mitochondrial membrane protein degradation by the proteasome. Novartis Found Symp. 2007;287:4–14; discussion 14–20.
- Clarke KJ, Adams AE, Manzke LH, et al. A role for ubiquitinylation and the cytosolic proteasome in turnover of mitochondrial uncoupling protein 1 (UCP1). Biochim Biophys Acta. 2012 Oct;1817(10):1759–1767.
- Margineantu DH, Emerson CB, Diaz D, et al. Hsp90 inhibition decreases mitochondrial protein turnover. PLoS One. 2007;2(10):e1066.
- Soubannier V, McLelland GL, Zunino R, et al. A vesicular transport pathway shuttles cargo from mitochondria to lysosomes. Curr Biol. 2012 Jan 24;22(2):135–141.
- Mizushima N. Autophagy: process and function. Genes Dev. 2007 Nov 15;21(22):2861–2873.
- Fletcher MJ, Sanadi DR. Turnover of rat-liver mitochondria. Biochim Biophys Acta. 1961 Aug;5(51):356–360.
- Ashford TP, Porter KR. Cytoplasmic components in hepatic cell lysosomes. J Cell Biol. 1962 Jan;12:198–202.
- Xie Z, Klionsky DJ. Autophagosome formation: core machinery and adaptations. Nat Cell Biol. 2007 Oct;9(10):1102–1109.
- Tolkovsky AM. Mitophagy. Biochim Biophys Acta. 2009 Sep;1793(9):1508–1515.
- Ney PA. Mitochondrial autophagy: origins, significance, and role of BNIP3 and NIX. Biochim Biophys Acta. 2015 Oct;1853(10Pt B):2775–2783.
- Lemasters JJ Selective mitochondrial autophagy, or mitophagy, as a targeted defense against oxidative stress, mitochondrial dysfunction, and aging. Rejuvenation Res. Spring 2005;8(1):3–5.
- Kim I, Rodriguez-Enriquez S, Lemasters JJ. Selective degradation of mitochondria by mitophagy. Arch Biochem Biophys. 2007 Jun 15;462(2):245–253.
- Narendra D, Tanaka A, Suen DF, et al. Parkin is recruited selectively to impaired mitochondria and promotes their autophagy. J Cell Biol. 2008 Dec 1;183(5):795–803.
- Narendra DP, Jin SM, Tanaka A, et al. PINK1 is selectively stabilized on impaired mitochondria to activate Parkin. PLoS Biol. 2010 Jan;8(1):e1000298.
- Rub C, Wilkening A, Voos W. Mitochondrial quality control by the Pink1/Parkin system. Cell Tissue Res. 2017 Jan;367(1):111–123.
- Vincow ES, Merrihew G, Thomas RE, et al. The PINK1-Parkin pathway promotes both mitophagy and selective respiratory chain turnover in vivo. Proc Natl Acad Sci USA. 2013 Apr 16;110(16):6400–6405.
- Gross NJ. Control of mitochondrial turnover under the influence of thyroid hormone. J Cell Biol. 1971 Jan;48(1):29–40.
- Khan AA, Wilson JE. Studies of turnover in mammalian subcellular particles: brain nuclei, mitochondria and microsomes. J Neurochem. 1965 Feb;12:81–86.
- Swick RW, Rexroth AK, Stange JL. The metabolism of mitochondrial proteins. 3. The dynamic state of rat liver mitochondria. J Biol Chem. 1968 Jul 10;243(13):3581–3587.
- Lusena CV, Depocas F. Heterogeneity and differential fragility of rat liver mitochondria. Can J Biochem. 1966 May;44(5):497–508.
- Von Hungen K, Mahler HR, Moore WJ. Turnover of protein and ribonucleic acid in synaptic subcellular fractions from rat brain. J Biol Chem. 1968 Apr 10;243(7):1415–1423.
- Dai DF, Karunadharma PP, Chiao YA, et al. Altered proteome turnover and remodeling by short-term caloric restriction or rapamycin rejuvenate the aging heart. Aging Cell. 2014 Jun;13(3):529–539.
- Karunadharma PP, Basisty N, Dai DF, et al. Subacute calorie restriction and rapamycin discordantly alter mouse liver proteome homeostasis and reverse aging effects. Aging Cell. 2015 Aug;14(4):547–557.
- Karunadharma PP, Basisty N, Chiao YA, et al. Respiratory chain protein turnover rates in mice are highly heterogeneous but strikingly conserved across tissues, ages, and treatments. Faseb J. 2015 Aug;29(8):3582–3592.
- Kruse SE, Karunadharma PP, Basisty N, et al. Age modifies respiratory complex I and protein homeostasis in a muscle type-specific manner. Aging Cell. 2016 Feb;15(1):89–99.
- Kim TY, Wang D, Kim AK, et al. Metabolic labeling reveals proteome dynamics of mouse mitochondria. Mol Cell Proteomics. 2012 Dec;11(12):1586–1594.
- Price JC, Guan S, Burlingame A, et al. Analysis of proteome dynamics in the mouse brain. Proc Natl Acad Sci USA. 2010 Aug 10;107(32):14508–14513.
- Nelson CJ, Li L, Jacoby RP, et al. Degradation rate of mitochondrial proteins in Arabidopsis thaliana cells. J Proteome Res. 2013 Jul 5;12(7):3449–3459.
- Suzuki CK, Suda K, Wang N, et al. Requirement for the yeast gene LON in intramitochondrial proteolysis and maintenance of respiration. Science. 1994 May 13;264(5161):891.
- Hughes AL, Hughes CE, Henderson KA, et al. Selective sorting and destruction of mitochondrial membrane proteins in aged yeast. Elife. 2016;5.
- Abeliovich H, Zarei M, Rigbolt KTG, et al. Involvement of mitochondrial dynamics in the segregation of mitochondrial matrix proteins during stationary phase mitophagy. Nat Commun. 2013 Nov;4.
- Hamalainen RH, Manninen T, Koivumaki H, et al. Tissue- and cell-type-specific manifestations of heteroplasmic mtDNA 3243A>G mutation in human induced pluripotent stem cell-derived disease model. Proc Natl Acad Sci USA. 2013 Sep 17;110(38):E3622–30.
- Le Guerroue F, Eck F, Jung J, et al. Autophagosomal content profiling reveals an LC3C-dependent piecemeal mitophagy pathway. Mol Cell. 2017 Nov 16;68(4):786–796 e6.
- Juhasz G, Erdi B, Sass M, et al. Atg7-dependent autophagy promotes neuronal health, stress tolerance, and longevity but is dispensable for metamorphosis in Drosophila. Genes Dev. 2007 Dec 1;21(23):3061–3066.
- Tanaka A, Cleland MM, Xu S, et al. Proteasome and p97 mediate mitophagy and degradation of mitofusins induced by Parkin. J Cell Biol. 2010 Dec 27;191(7):1367–1380.
- Yoshii SR, Kishi C, Ishihara N, et al. Parkin mediates proteasome-dependent protein degradation and rupture of the outer mitochondrial membrane. J Biol Chem. 2011 Jun 3;286(22):19630–19640.
- McLelland GL, Soubannier V, Chen CX, et al. Parkin and PINK1 function in a vesicular trafficking pathway regulating mitochondrial quality control. Embo J. 2014 Feb 18;33(4):282–295.
- Hammerling BC, Najor RH, Cortez MQ, et al. A Rab5 endosomal pathway mediates Parkin-dependent mitochondrial clearance. Nat Commun. 2017 Jan 30;8:14050.
- Wagner SA, Beli P, Weinert BT, et al. A proteome-wide, quantitative survey of in vivo ubiquitylation sites reveals widespread regulatory roles. Mol Cell Proteomics. 2011 Oct;10(10):M111 013284.
- Shi H, Rampello AJ, Glynn SE. Engineered AAA+ proteases reveal principles of proteolysis at the mitochondrial inner membrane. Nat Commun. 2016 Oct;27(7):13301.
- Rampello AJ, Glynn SE. Identification of a degradation signal sequence within substrates of the mitochondrial i-AAA Protease. J Mol Biol. 2017 Mar 24;429(6):873–885.
- Pagliarini DJ, Calvo SE, Chang B, et al. A mitochondrial protein compendium elucidates complex I disease biology. Cell. 2008 Jul 11;134(1):112–123.
- Sun N, Yun J, Liu J, et al. Measuring in vivo mitophagy. Mol Cell. 2015 Nov 19;60(4):685–696.
- McWilliams TG, Prescott AR, Allen GF, et al. mito-QC illuminates mitophagy and mitochondrial architecture in vivo. J Cell Biol. 2016 Aug 1;214(3):333–345.
- Chintapalli VR, Wang J, Dow JA. Using FlyAtlas to identify better Drosophila melanogaster models of human disease. Nat Genet. 2007 Jun;39(6):715–720.
- Zhang T, Shen S, Qu J, et al. Global analysis of cellular protein flux quantifies the selectivity of basal autophagy. Cell Rep. 2016 Mar 15;14(10):2426–2439.
- Mathis AD, Naylor BC, Carson RH, et al. Mechanisms of in vivo ribosome maintenance change in response to nutrient signals. Mol Cell Proteomics. 2017 Feb;16(2):243–254.
- Hoeller D, Dikic I. How the proteasome is degraded. Proc Natl Acad Sci USA. 2016 Nov 22;113(47):13266–13268.
- Augustin S, Nolden M, Muller S, et al. Characterization of peptides released from mitochondria: evidence for constant proteolysis and peptide efflux. J Biol Chem. 2005 Jan 28;280(4):2691–2699.
- Collins ML, Eng S, Hoh R, et al. Measurement of mitochondrial DNA synthesis in vivo using a stable isotope-mass spectrometric technique. J Appl Physiol (1985). 2003 Jun;94(6):2203–2211.
- Poovathingal SK, Gruber J, Lakshmanan L, et al. Is mitochondrial DNA turnover slower than commonly assumed? Biogerontology. 2012 Oct;13(5):557–564.
- Nishida Y, Arakawa S, Fujitani K, et al. Discovery of Atg5/Atg7-independent alternative macroautophagy. Nature. 2009 Oct 1;461(7264):654–658.
- Juenemann K, Reits EA. Alternative macroautophagic pathways. Int J Cell Biol. 2012;2012:189794.
- Matsuda N, Sato S, Shiba K, et al. PINK1 stabilized by mitochondrial depolarization recruits Parkin to damaged mitochondria and activates latent Parkin for mitophagy. J Cell Biol. 2010 Apr 19;189(2):211–221.
- Sumpter R Jr., Sirasanagandla S, Fernandez AF, et al. Fanconi anemia proteins function in mitophagy and immunity. Cell. 2016 May 5;165(4):867–881.
- Kawajiri S, Saiki S, Sato S, et al. PINK1 is recruited to mitochondria with parkin and associates with LC3 in mitophagy. FEBS Lett. 2010 Mar 19;584(6):1073–1079.
- Daniele JR, Esping DJ, Garcia G, et al. High-throughput characterization of region-specific mitochondrial function and morphology. Sci Rep. 2017 Jul 27;7(1):6749.
- Wikstrom JD, Twig G, Shirihai OS. What can mitochondrial heterogeneity tell us about mitochondrial dynamics and autophagy? Int J Biochem Cell Biol. 2009 Oct;41(10):1914–1927.
- Kuznetsov AV, Margreiter R. Heterogeneity of mitochondria and mitochondrial function within cells as another level of mitochondrial complexity. Int J Mol Sci. 2009 Apr 24;10(4):1911–1929.
- Ferreira R, Vitorino R, Alves RM, et al. Subsarcolemmal and intermyofibrillar mitochondria proteome differences disclose functional specializations in skeletal muscle. Proteomics. 2010 Sep;10(17):3142–3154.
- Choe SC, Hamacher-Brady A, Brady NR. Autophagy capacity and sub-mitochondrial heterogeneity shape Bnip3-induced mitophagy regulation of apoptosis. Cell Commun Signal. 2015;13(1):37.
- Twig G, Elorza A, Molina AJ, et al. Fission and selective fusion govern mitochondrial segregation and elimination by autophagy. Embo J. 2008 Jan 23;27(2):433–446.
- Barsoum MJ, Yuan H, Gerencser AA, et al. Nitric oxide-induced mitochondrial fission is regulated by dynamin-related GTPases in neurons. Embo J. 2006 Aug 23;25(16):3900–3911.
- Youle RJ, van der Bliek AM. Mitochondrial fission, fusion, and stress. Science. 2012 Aug 31;337(6098):1062–1065.
- Shirihai OS, Song M, Dorn GW 2nd. How mitochondrial dynamism orchestrates mitophagy. Circ Res. 2015 May 22;116(11):1835–1849.
- Abeliovich H, Dengjel J. Mitophagy as a stress response in mammalian cells and in respiring S. cerevisiae. Biochem Soc Trans. 2016 Apr 15;44(2):541–545.
- Burman JL, Pickles S, Wang C, et al. Mitochondrial fission facilitates the selective mitophagy of protein aggregates. J Cell Biol. 2017 Oct 2;216(10):3231–3247.
- Yang JY, Yang WY. Bit-by-bit autophagic removal of parkin-labelled mitochondria. Nat Commun. 2013;4:2428.
- Khalil B, El Fissi N, Aouane A, et al. PINK1-induced mitophagy promotes neuroprotection in Huntington’s disease. Cell Death Dis. 2015;6:e1617.
- Greene JC, Whitworth AJ, Kuo I, et al. Mitochondrial pathology and apoptotic muscle degeneration in Drosophila parkin mutants. Proc Natl Acad Sci USA. 2003 Apr 1;100(7):4078–4083.
- Park J, Lee SB, Lee S, et al. Mitochondrial dysfunction in Drosophila PINK1 mutants is complemented by parkin. Nature. 2006 Jun 29;441(7097):1157–1161.
- Sherman F Getting started with yeast [Internet]. [ cited 2003 22 Aug]. http://dbb.urmc.rochester.edu/labs/sherman_f/StartedYeast.html.
- McCune HJ, Danielson LS, Alvino GM, et al. The temporal program of chromosome replication: genomewide replication in clb5{Delta} Saccharomyces cerevisiae. Genetics. 2008 Dec;180(4):1833–1847.
- Hsieh EJ, Hoopmann MR, MacLean B, et al. Comparison of database search strategies for high precursor mass accuracy MS/MS data. J Proteome Res. 2010 Feb 5;9(2):1138–1143.
- Ducret A, Van Oostveen I, Eng JK, et al. High throughput protein characterization by automated reverse-phase chromatography/electrospray tandem mass spectrometry. Protein Sci. 1998 Mar;7(3):706–719.
- Marygold SJ, Crosby MA, Goodman JL. Using flybase, a database of drosophila genes and genomes. Methods Mol Biol. 2016;1478:1–31.
- Kall L, Canterbury JD, Weston J, et al. Semi-supervised learning for peptide identification from shotgun proteomics datasets. Nat Methods. 2007 Nov;4(11):923–925.
- Zhang B, Chambers MC, Tabb DL. Proteomic parsimony through bipartite graph analysis improves accuracy and transparency. J Proteome Res. 2007 Sep;6(9):3549–3557.
- Attrill H, Falls K, Goodman JL, et al. FlyBase: establishing a gene group resource for drosophila melanogaster. Nucleic Acids Res. 2016 Jan 4;44(D1):D786–92.
- Sardiello M, Licciulli F, Catalano D, et al. MitoDrome: a database of Drosophila melanogaster nuclear genes encoding proteins targeted to the mitochondrion. Nucleic Acids Res. 2003 Jan 1;31(1):322–324.
- Brown GR, Hem V, Katz KS, et al. Gene: a gene-centered information resource at NCBI. Nucleic Acids Res. 2015 Jan;43(Database issue):D36–42.
- UniProt Consortium. UniProt: a hub for protein information. Nucleic Acids Res. 2015 Jan;43(Database issue):D204–12.
- Horton P, Park KJ, Obayashi T, et al. WoLF PSORT: protein localization predictor. Nucleic Acids Res. 2007 Jul;35(Web Server issue):W585–7.
- Claros MG, Vincens P. Computational method to predict mitochondrially imported proteins and their targeting sequences. Eur J Biochem. 1996 Nov 1;241(3):779–786.
- Small I, Peeters N, Legeai F, et al. Predotar: A tool for rapidly screening proteomes for N-terminal targeting sequences. Proteomics. 2004 Jun;4(6):1581–1590.
- Petersen TN, Brunak S, von Heijne G, et al. SignalP 4.0: discriminating signal peptides from transmembrane regions. Nat Methods. 2011;8(10):785–786.
- Brameier M, Krings A, MacCallum RM. NucPred–predicting nuclear localization of proteins. Bioinformatics. 2007 May 1;23(9):1159–1160.
- Neuberger G, Maurer-Stroh S, Eisenhaber B, et al. Prediction of peroxisomal targeting signal 1 containing proteins from amino acid sequence. J Mol Biol. 2003 May 2;328(3):581–592.
- Neuberger G, Maurer-Stroh S, Eisenhaber B, et al. Motif refinement of the peroxisomal targeting signal 1 and evaluation of taxon-specific differences. J Mol Biol. 2003 May 2;328(3):567–579.
- Camacho C, Coulouris G, Avagyan V, et al. BLAST+: architecture and applications. BMC Bioinformatics. 2009;10:421.
- Hsieh EJ, Shulman NJ, Dai DF, et al. Topograph, a software platform for precursor enrichment corrected global protein turnover measurements. Mol Cell Proteomics. 2012 Nov;11(11):1468–1474.
- Tukey JW. Exploratory data analysis. Reading (MA): Addison-Wesley; 1977.
- Robinson SW, Herzyk P, Dow JA, et al. FlyAtlas: database of gene expression in the tissues of Drosophila melanogaster. Nucleic Acids Res. 2013 Jan;41(Database issue):D744–50.
- Erdi B, Nagy P, Zvara A, et al. Loss of the starvation-induced gene Rack1 leads to glycogen deficiency and impaired autophagic responses in Drosophila. Autophagy. 2012 Jul 1;8(7):1124–1135.
- Kauffmann A, Rayner TF, Parkinson H, et al. Importing ArrayExpress datasets into R/Bioconductor. Bioinformatics. 2009 Aug 15;25(16):2092–2094.
- Smyth GK, Altman NS. Separate-channel analysis of two-channel microarrays: recovering inter-spot information. BMC Bioinformatics. 2013;14:165.
- Ritchie ME, Phipson B, Wu D, et al. limma powers differential expression analyses for RNA-sequencing and microarray studies. Nucleic Acids Res. 2015 Apr 20;43(7):e47.
- Benjamini Y, Hochberg Y. Controlling the false discovery rate: a practical and powerful approach to multiple testing. J Royal Stat Soc Ser B (Methodological). 1995;57(1):289–300.
- MacLean B, Tomazela DM, Shulman N, et al. Skyline: an open source document editor for creating and analyzing targeted proteomics experiments. Bioinformatics. 2010 Apr 1;26(7):966–968.
- Choi M, Chang CY, Clough T, et al. MSstats: an R package for statistical analysis of quantitative mass spectrometry-based proteomic experiments. Bioinformatics. 2014 Sep 1;30(17):2524–2526.
- Calvo SE, Clauser KR, Mootha VK. MitoCarta2.0: an updated inventory of mammalian mitochondrial proteins. Nucleic Acids Res. 2016 Jan 4;44(D1):D1251–7.
- Janin J. Surface and inside volumes in globular proteins. Nature. 1979 Feb 8;277(5696):491–492.
- Hu Y, Flockhart I, Vinayagam A, et al. An integrative approach to ortholog prediction for disease-focused and other functional studies. BMC Bioinformatics. 2011 Aug 31;12:357.