
ABSTRACT
Macroautophagy/autophagy is a degradative process essential for various cellular processes. We previously demonstrated that autophagy-deficiency causes myoblast apoptosis and impairs myotube formation. In this study, we continued this work with particular emphasis on mitochondrial remodelling and stress/apoptotic signaling. We found increased (p < 0.05) autophagic (e.g., altered LC3B levels, increased ATG7, decreased SQSTM1) and mitophagic (e.g., BNIP3 upregulation, mitochondrial localized GFP-LC3 puncta, and elevated mitochondrial LC3B-II) signaling during myoblast differentiation. shRNA-mediated knockdown of ATG7 (shAtg7) decreased these autophagic and mitophagic responses, while increasing CASP3 activity and ANXA5/annexin V staining in differentiating myoblasts; ultimately resulting in dramatically impaired myogenesis. Further confirming the importance of mitophagy in these responses, CRISPR-Cas9-mediated knockout of Bnip3 (bnip3-/-) resulted in increased CASP3 activity and DNA fragmentation as well as impaired myoblast differentiation. In addition, shAtg7 myoblasts displayed greater endoplasmic reticulum (e.g., increased CAPN activity and HSPA) and mitochondrial (e.g., mPTP formation, reduced mitochondrial membrane potential, elevated mitochondrial 4-HNE) stress. shAtg7 and bnip3-/- myoblasts also displayed altered mitochondria-associated signaling (e.g., PPARGC1A, DNM1L, OPA1) and protein content (e.g., SLC25A4, VDAC1, CYCS). Moreover, shAtg7 myoblasts displayed CYCS and AIFM1 release from mitochondria, and CASP9 activation. Similarly, bnip3-/- myoblasts had significantly higher CASP9 activation during differentiation. Importantly, administration of a chemical inhibitor of CASP9 (Ac-LEHD-CHO) or dominant-negative CASP9 (ad-DNCASP9) partially recovered differentiation and myogenesis in shAtg7 myoblasts. Together, these data demonstrate an essential role for autophagy in protecting myoblasts from mitochondrial oxidative stress and apoptotic signaling during differentiation, as well as in the regulation of mitochondrial network remodelling and myogenesis.
Abbreviations: 3MA: 3-methyladenine; 4-HNE: 4-hydroxynonenal; ACT: actin; AIFM1/AIF: apoptosis-inducing factor, mitochondrion-associated 1; ANXA5: annexin V; ATG7: autophagy related 7; AU: arbitrary units; BAX: BCL2-associated X protein; BCL2: B cell leukemia/lymphoma 2; BECN1: beclin 1, autophagy related; BNIP3: BCL2/adenovirus E1B interacting protein 3; CAPN: calpain; CASP: caspase; CASP3: caspase 3; CASP8: caspase 8; CASP9: caspase 9; CASP12: caspase 12; CAT: catalase; CQ: chloroquine; CYCS: cytochrome c, somatic; DCF; 2’,7’-dichlorofluorescein; DNM1L/DRP1: dynamin 1-like; DM: differentiation media; DMEM: Dulbecco’s modified Eagle’s medium; ER: endoplasmic reticulum; GAPDH: glyceraldehyde-3-phosphate dehydrogenase; GFP: green fluorescent protein; GM: growth media; p-H2AFX: phosphorylated H2A histone family, member X; H2BFM: H2B histone family, member M; HBSS: Hanks balanced salt solution; HSPA/HSP70: heat shock protein family A; JC-1: tetraethylbenzimidazolylcarbocyanine iodide; MAP1LC3B/LC3B: microtubule-associated protein 1 light chain 3 beta; mPTP: mitochondrial permeability transition pore; MYH: myosin heavy chain; MYOG: myogenin; OPA1: OPA1, mitochondrial dynamin like GTPase; PI: propidium iodide; PINK1: PTEN induced putative kinase 1; PPARGC1A/PGC1α: peroxisome proliferative activated receptor, gamma, coactivator 1 alpha; ROS: reactive oxygen species; SLC25A4/ANT1: solute carrier family 25 (mitochondrial carrier, adenine nucleotide translocator), member 4; SOD1: superoxide dismutase 1, soluble; SOD2: superoxide dismutase 2, mitochondrial; SQSTM1/p62: sequestosome 1; VDAC1: voltage-dependent anion channel 1
Introduction
Skeletal muscle differentiation and formation occurs along with a significant level of cellular stress [Citation1–Citation3]. In particular, skeletal muscle development requires proteolytic CASP (caspase) activation, which also has a well-established role in apoptosis [Citation1,Citation4]. Importantly, the level of CASP activation is maintained at a ‘sub-apoptotic’ threshold in differentiating myoblasts [Citation5,Citation6]. Thus, the need for CASP activation coupled with the potential detrimental action of these signals, suggests that CASP activity must be tightly regulated during differentiation [Citation5,Citation6]. Currently, the mechanisms regulating apoptotic-related signaling during skeletal muscle differentiation, and how they contribute to cell specialization rather than cell death, are not well understood. Evidence suggests that canonical apoptotic pathways may be involved in CASP3 (caspase 3) activation [Citation7]. For example, the apoptotic proteases CASP12 (caspase 12) and CASP8 (caspase 8) are activated during myoblast differentiation [Citation3,Citation8]. Of particular interest is the observation that CASP9 (caspase 9) activity contributes to the activation of CASP3 during myogenesis [Citation7]. However, engagement of the mitochondrial-mediated apoptotic pathway and activation of CASP9 are typically considered a point of no return in cell death signaling [Citation9]. Accordingly, we previously found no involvement of CASP9 during myoblast differentiation [Citation10].
Autophagy is a degradative process intimately involved with the cellular stress response [Citation11]. Interestingly, inhibition of autophagy through 3-methyladenine (3MA) administration or knockdown of ATG7 (autophagy related 7) impairs myoblast differentiation, and results in cell death [Citation6]; demonstrating both a critical role of autophagy in myogenesis, and a mechanism of cellular stress regulation during myoblast differentiation. Although autophagy was originally characterized a bulk degradation system, autophagy is now considered to be a specialized process which allows for the selective removal of damaged, unnecessary, or dysfunctional proteins and organelles [Citation12]. One such specialized function is the clearance of mitochondria through the autophagic process known as mitophagy [Citation13,Citation14]. Interestingly, differentiating C2C12 cells require autophagy to degrade mitochondria [Citation15], and knockdown of PINK1 (PTEN induced putative kinase 1) results in decreased levels of Myog (myogenin) mRNA in differentiating C2C12 cells [Citation16]. Moreover, during myoblast differentiation autophagy is critical for mitochondrial remodelling [Citation15], while PPARGC1A/PGC1α (peroxisome proliferative activated receptor, gamma, coactivator 1 alpha) plays an important role in regulating the expression of key mitophagy-related proteins [Citation16]. In addition, mitophagy plays an important role in removing damaged mitochondria before mitochondria-mediated apoptotic signaling can be induced, thus mitigating cell stress and death [Citation17]. Therefore, it is likely that autophagy and more specifically mitophagy, is critical in regulating multiple aspects of the mitochondria during skeletal muscle differentiation. Thus, the purpose of this study was to investigate the role of mitophagy in regulating the mitochondrial network and stress/death signaling during myoblast differentiation and myogenesis.
Results
Autophagy-deficiency impairs myoblast differentiation and myogenesis
A number of proteins are critical in autophagosome formation and ultimately autophagy. Similar to our previous work [Citation6], differentiation in C2C12 myoblasts stably transfected with a scramble control vector (SCR) was accompanied by an increase (p < 0.05) in MAP1LC3B-I/LC3B-I and LC3B-II (microtubule-associated protein 1 light chain 3 beta), as well as an elevated (p < 0.05) LC3B-II:I ratio (,), and dramatic disappearance of SQSTM1/p62 (sequestosome 1) (). Moreover, ATG7 increased (p < 0.05) early and throughout differentiation, while BECN1 (beclin 1, autophagy related) and BNIP3 (BCL2/adenovirus E1B interacting protein 3) were elevated (p < 0.05) later on during differentiation (). To confirm the autophagic response, flux experiments demonstrated that LC3B-II and SQSTM1 were maintained during differentiation in the presence of chloroquine (CQ) ().
Figure 1. Autophagy is upregulated and required during myoblast differentiation. Representative immunoblots (a) and quantitative analysis (b, c) of MAP1LC3B (LC3B-I, LC3B-II, as well as calculated LC3B-II:I ratio) ATG7, BECN1, and BNIP3 during myoblast differentiation. Representative immunoblots (d) and quantitative analysis (e, f) of LC3B-I, LC3B-II, and SQSTM1 in CTRL (Vehicle) and chloroquine (CQ) treated myoblasts during differentiation. Also shown are representative ACT, GAPDH, and ponceau stained loading control blots/membranes. Representative immunoblots (g) of ATG7, LC3B-I, and LC3B-II in SCR and shAtg7 myoblasts and myotubes. Representative immunoblot (h) and quantitative analysis (i) of MYOG in SCR and shAtg7 cells during differentiation. Also shown is a representative ACT loading control blot. Representative images (j) of myotube formation in SCR and shAtg7 cells during differentiation. Cells were stained with DAPI (blue) and MF20 (red) to visualize nuclei and MYH, respectively. Scale bar = 100 µm. Quantitative analysis of the differentiation index (k) and fusion index (l) in SCR and shAtg7 cells during differentiation. *p < 0.05 compared to D0 (within group). †p < 0.05 between groups at the same time point.
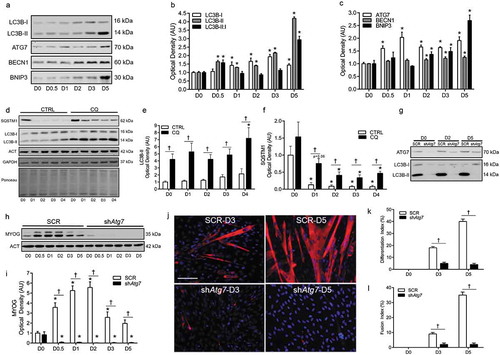
In a previous study, we found that inhibition of autophagy through 3MA administration or knockdown of ATG7 impairs differentiation and myogenesis [Citation6]. Here, we show that although MYOG increased (p < 0.05) during differentiation in SCR cells, this did not occur () in cells with stable knockdown of ATG7 (shAtg7) (). In addition, shAtg7 cells had a dramatically impaired (p < 0.05) ability to form multinucleated, MYH (myosin heavy chain) positive myotubes ().
Autophagy-deficiency during myoblast differentiation results in apoptosis
We previously found that inhibition of autophagy during myoblast differentiation results in cell death [Citation6]. In agreement with this, here we show that the number of early apoptotic cells (ANXA5/annexinV+ PI−), but not late apoptotic cells (ANXA5+ PI+) was higher (p < 0.05) in shAtg7 compared to SCR cells during differentiation, despite lower levels at baseline (D0) (). Only a small number of cells (0–3%) throughout differentiation in both SCR and shAtg7 cells were ANXA5− PI+ (data not shown), indicating that necrotic cell death was not a contributing mechanism in this observed response. In support of this, although CASP3 activity increased during differentiation (a well-established phenomenon in myoblasts), levels were significantly higher (p < 0.05) in shAtg7 compared to SCR cells ().
Figure 2. Autophagy-deficiency during myoblast differentiation augments apoptotic signaling, ER-stress responses, and cell death. Quantitative analysis of early apoptotic (ANXA5+ PI−) cells (a), late apoptotic (ANXA5+ PI+) cells (b), and CASP3 activity (c) in SCR and shAtg7 cells during differentiation. Representative immunoblots (d) and quantitative analysis (e, f, g, h) of BAX, BCL2, and HSPA (as well as calculated BAX:BCL2 ratio) in SCR and shAtg7 cells during differentiation. Quantitative analysis of CAPN activity (i) in SCR and shAtg7 cells during differentiation. *p < 0.05 compared to D0 (within group). †p < 0.05 between groups at the same time point.
The BCL2 (B cell leukemia/lymphoma 2) family proteins play a critical role in regulating apoptosis [Citation18]. Although we found some differences in BAX (BCL2-associated X protein) between SCR and shAtg7 cells at specific time points, levels tended to decrease during differentiation (). In contrast, BCL2 was increased (p < 0.05) early during differentiation in SCR but not shAtg7 cells (). Together, these changes resulted in a decreased (p < 0.05) BAX:BCL2 ratio in SCR cells at several time points throughout differentiation, but not in shAtg7 cells ().
CAPN (calpain) activation and upregulation of heat-shock proteins are a hallmark of cellular and endoplasmic reticulum (ER) stress [Citation19,Citation20]. Interestingly, while HSPA/HSP70 (heat shock protein family A) decreased (p < 0.05) in SCR cells, levels dramatically increased (p < 0.05) in shAtg7 cells throughout differentiation (). In addition, shAtg7 cells displayed higher (p < 0.05) CAPN proteolytic activity early during differentiation (D0.5, D1, D1.5 and D2) compared to SCR cells ().
Autophagy regulates ROS generation and prevents mitochondrial oxidative damage in myoblasts and differentiating myoblasts
In the absence of autophagy, changes to the redox environment can contribute to cellular stress and apoptosis [Citation14]. The antioxidants SOD1 (superoxide dismutase 1, soluble) and CAT (catalase) were several fold higher in shAtg7 myoblasts (D0). SOD1 was not dramatically affected in SCR cells during differentiation (). However, CAT levels decreased (p < 0.05) dramatically in shAtg7 cells during differentiation (). In contrast, SOD2 (superoxide dismutase 2, mitochondrial), a critical mitochondrial antioxidant, increased (p < 0.05) later in differentiation but to a much greater extent (p < 0.05) in shAtg7 cells (). In support of this altered cellular redox environment, we found that reactive oxygen species (ROS) generation decreased (p < 0.05) during differentiation in SCR cells, but increased (p < 0.05) in shAtg7 cells (). Further supporting the notion that autophagy is critical in regulating mitochondrial redox signaling, we found that the level of 4-HNE (4-hydroxynonenal) in mitochondria-enriched subcellular fractions () was 4.5–6.2-fold higher (p < 0.05) in shAtg7 compared to SCR cells on D0 and D0.5 ().
Figure 3. Autophagy-deficiency during myoblast differentiation alters cellular and mitochondrial redox status. Representative immunoblots (a) and quantitative analysis of SOD1 (b), CAT (c), and SOD2 (d) in SCR and shAtg7 cells during differentiation. Quantitative analysis of ROS generation (e) in SCR and shAtg7 myoblasts during differentiation. Representative immunoblot (f) and quantitative analysis (g) of mitochondrial 4-HNE content in SCR and shAtg7 cells during differentiation. *p < 0.05 compared to D0 (within group). †p < 0.05 between groups at the same time point.
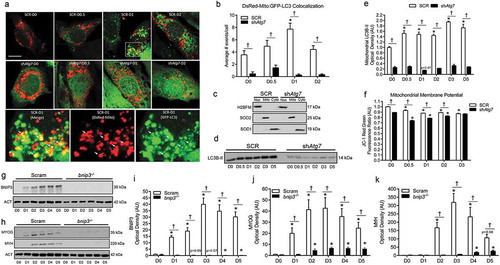
Figure 4. Mitophagy is upregulated and required during myoblast differentiation. Representative images (a) and quantitative analysis (b) of colocalization (yellow) of LC3 (green) and mitochondria (red) in ad-GFP-LC3 and DsRed-Mito co-transfected SCR and shAtg7 cells during differentiation. Scale bar = 10 µm. Inset shows merged, DsRed-Mito, and GFP-LC3 zoomed images of SCR cells at D1 (SCR-D1). Arrows demonstrate colocalized (yellow) mitochondria (red) and LC3 puncta (green). Representative immunoblots (c) of H2BFM, SOD2, and SOD1 demonstrating nuclear- (Nuc), mitochondria- (Mito), and cytosolic-enriched (Cyto) subcellular fractions. Representative immunoblot (d) and quantitative analysis (e) of LC3B-II in mitochondria-enriched subcellular fractions of SCR and shAtg7 cells during differentiation. Quantitative analysis (f) of the JC-1 red:green fluorescence ratio (where a decrease is indicative of membrane depolarization) in SCR and shAtg7 cells during differentiation. Representative immunoblots (g, h) and quantitative analysis of BNIP3 (i), MYOG (j), and MYH (k) in Scram and bnip3-/- cells during differentiation. Also shown are representative ACT loading control blots. *p < 0.05 compared to D0 (within group). †p < 0.05 between groups at the same time point.
Mitophagy is upregulated and required during myoblast differentiation
Previous work suggests that mitophagy occurs during myoblast differentiation [Citation15]. To investigate mitophagy specifically, we measured GFP-LC3 (green fluorescent protein-microtubule-associated protein 1 light chain 3) and DsRed-Mito colocalization, as well as mitochondrial LC3B-II levels. We found increased (p < 0.05) colocalization of mitochondria and autophagic puncta early during differentiation in SCR but not shAtg7 cells (). In agreement with this, mitochondria-enriched subcellular fractions () had increased (p < 0.05) LC3B-II in SCR but not shAtg7 cells throughout differentiation (). Mitophagy is regulated by a diverse array of signals, one being a reduction in mitochondrial membrane potential [Citation13]. Both SCR and shAtg7 cells displayed a significant reduction (p < 0.05) in mitochondrial membrane potential throughout differentiation; however, shAtg7 cells had significantly lower (p < 0.05) membrane potential at all time points ().
As further confirmation of the role and effect of mitophagy in myoblast differentiation, we generated bnip3-/- myoblasts using CRISPR/Cas9 technology. Similar to the results mentioned above (), the critical regulator of mitophagy, BNIP3, increased (p < 0.05) in Scram myoblasts during differentiation; an effect not observed in bnip3-/- myoblasts (). Importantly, and consistent with the effects observed in shAtg7 cells, bnip3-/- myoblasts had impaired differentiation, as demonstrated by dramatically (p < 0.05) depressed MYOG and MYH levels (, ).
Mitophagy plays a critical role in mitochondria-associated signaling and development of the mitochondrial network during myoblast differentiation
To further investigate the importance of autophagy and mitophagy in regulating mitochondrial signaling and development of the mitochondrial network, we measured the levels of several proteins indicative of mitochondrial content [VDAC1 (voltage-dependent anion channel 1); SLC25A4/ANT1 (solute carrier family 25 (mitochondrial carrier, adenine nucleotide translocator), member 4); CYCS (cytochrome c, somatic)], biogenesis (PPARGC1A), and fission/fusion [DNM1L/DRP1 (dynamin 1-like); OPA1 (OPA1, mitochondrial dynamin like GTPase)]. In general, there was an upregulation and/or maintenance of higher levels of these proteins in control cells (SCR) during differentiation compared to shAtg7 cells (), suggesting that both mitochondria-related network signaling and mitochondrial content were lower during differentiation in the autophagy-deficient state. Although not as severe, similar responses were noted in bnip3-/- compared to Scram cells (). Moreover, the mitochondrial antioxidant SOD2 was significantly higher () in bnip3-/- cells early during differentiation, possibly suggesting increased oxidative stress signaling; an effect that is consistent with data in shAtg7 myoblasts ().
Figure 5. shAtg7 and bnip3-/- myoblasts display altered mitochondrial network-related signaling and content. Representative immunoblots (a) and quantitative analysis (b, c, d, e, f, g) of PPARGC1A, DNM1L, OPA1, VDAC1, SLC25A4, and CYCS in SCR and shAtg7 cells during differentiation. Representative immunoblots (h) and quantitative analysis (i, j, k, l, m, n, o) of PPARGC1A, DNM1L, OPA1, VDAC1, SLC25A4, CYCS, and SOD2 in Scram and bnip3-/- cells during differentiation. Also shown are representative GAPDH and ACT loading control blots. *p < 0.05 compared to D0 (within group). †p < 0.05 between groups at the same time point.
Mitophagy regulates mitochondria-mediated apoptotic signaling during myoblast differentiation
Opening of the mitochondrial permeability transition pore (mPTP) and loss of mitochondrial membrane integrity can result in CASP-dependant and -independent apoptotic signaling via factors such as CYCS and AIFM1/AIF (apoptosis-inducing factor, mitochondrion-associated 1) [Citation21,Citation22]. We found that mitochondrial membrane permeability (i.e., mPTP) was higher (p < 0.05) during differentiation in shAtg7 compared to SCR cells (shown by lower calcein fluorescence) (). In agreement with this data, we found that cytosolic CYCS and AIFM1 levels were significantly greater (p < 0.05) in shAtg7 compared to SCR cells during differentiation (,)). Furthermore, differentiating shAtg7 myoblasts displayed CASP9 activation (p < 0.05) during differentiation; an effect not observed in SCR cells (). Moreover, levels of the DNA fragmentation marker, p-H2AFX (phosphorylated H2A histone family, member X) (), and CASP3 activity () were greater (p < 0.05) in bnip3-/- myoblasts during early differentiation. Importantly, CASP9 activity () was higher in bnip3-/- relative to Scram cells during early differentiation, suggesting greater mitochondria-mediated apoptotic signaling. Collectively, these data demonstrate that autophagy and mitophagy protect against mitochondrial apoptotic signaling during myoblast differentiation.
Figure 6. Mitochondria-mediated apoptotic signaling is augmented in shAtg7 and bnip3-/- myoblasts during differentiation. Quantitative analysis (a) of calcein fluorescence in SCR and shAtg7 cells during differentiation, where a decrease in fluorescence is indicative of an increase in mPTP formation. Representative immunoblots (b) and quantitative analysis (c) of cytosolic CYCS and AIFM1 in SCR and shAtg7 cells during differentiation. Also shown is a representative ponceau stained membrane. Quantitative analysis of CASP9 activity (d) in SCR and shAtg7 cells during differentiation. Representative immunoblot (e) and quantitative analysis (f) of p-H2AFX in Scram and bnip3-/- cells during differentiation. Also shown is a representative ACT loading control blot. Quantitative analysis of CASP3 (g) and CASP9 (h) activity in Scram and bnip3-/- cells during differentiation. *p < 0.05 compared to D0 (within group). †p < 0.05 between groups at the same time point.
Reducing CASP9 or CASP3 activity partially recovers myoblast differentiation and myogenesis
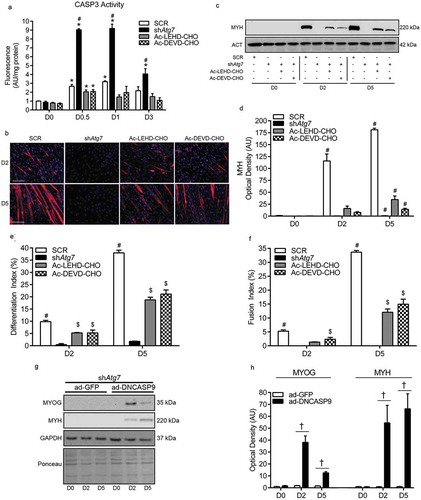
In our previous work, we showed that 3MA administration augments CASP3 activity and causes cell death in differentiating myoblasts; ultimately resulting in impaired differentiation and myogenesis [Citation6]. To test whether elevated CASP activity is directly linked to the impaired differentiation in autophagy/mitophagy-deficient myoblasts, shAtg7 cells were treated with a pharmacological CASP3 or CASP9 inhibitor. At the concentrations used, each CASP inhibitor (Ac-LEHD-CHO and Ac-DEVD-CHO) reduced (p < 0.05) CASP3 activity in shAtg7 myoblasts to levels near those observed in SCR cells (). Importantly, attenuating CASP3 activity in shAtg7 cells either directly (through Ac-DEVD-CHO) or indirectly by inhibiting CASP9 (through Ac-LEHD-CHO) partially recovered (p < 0.05) MYH expression () as well as formation of multinucleated, MYH-positive myotubes (). In agreement with this, MYOG and MYH expression during differentiation was partially recovered in shAtg7 cells transfected with dominant-negative CASP9 (ad-DNCASP9) (). These results directly support that autophagy/mitophagy is critical in myoblast differentiation and myogenesis, and regulates mitochondrial CASP9-mediated activation of CASP3 and cell death.
Figure 7. Attenuation of CASP activity in autophagy-deficient cells partially recovers myoblast differentiation and myogenesis. Quantitative analysis of CASP3 activity (a), representative images of myotube formation (b), representative immunoblot and quantitative analysis of MYH (c, d), as well as quantitative analysis of the differentiation index (e) and the fusion index (f) in SCR, shAtg7, Ac-LEHD-CHO-treated shAtg7, and Ac-DEVD-CHO-treated shAtg7 cells during differentiation. Also shown is a representative ACT control blot. Scale bar = 100 µm. Representative immunoblots (g) and quantitative analysis (h) of MYOG and MYH in shAtg7 cells transfected with a control adenovirus (ad-GFP) or adenovirus expressing dominant-negative CASP9 (ad-DNCASP9) during differentiation. Also shown are representative GAPDH and ponceau control blots/membranes. *p < 0.05 compared to D0 (within group). #p < 0.05 compared to all groups at the same time point. $p < 0.05 compared to shAtg7 at the same time point. †p < 0.05 between groups at the same time point.
Discussion
Autophagy/mitophagy is required for myoblast differentiation, and is critical in regulating mitochondrial signaling and remodelling
A rapid way to achieve cellular specialization is through the degradation of unnecessary or damaged proteins and organelles through processes such as autophagy [Citation23]. For example, autophagy can directly degrade MYOD, a myogenic regulatory factor (MRF) whose transient upregulation is essential for myogenesis [Citation24]. We previously reported that autophagy is upregulated and is required for skeletal myoblast differentiation and myogenesis [Citation6]. Importantly, autophagy-deficiency during myoblast differentiation increases DNA fragmentation and morphological features of apoptosis [Citation6]. Here we found that stable knockdown of ATG7 or CRISPR/Cas9-mediated deletion of Bnip3 reduced myotube formation; a consequence that was preceded by mitochondrial oxidative stress and mitochondria-mediated cell death signaling. Importantly, there was reduced expression of mitochondrial signaling proteins such as PPARGC1A, DNM1L, and OPA1, as well as lower mitochondrial content proteins (VDAC1, SLC25A4, CYCS) during differentiation in shAtg7 or bnip3-/- cells, demonstrating a critical role for autophagy and mitophagy in regulating mitochondrial biogenesis, fission/fusion, and network development during myogenesis. This is consistent with work in the literature [Citation15] demonstrating that bafilomycin A1-treated differentiating myoblasts display alterations in PPARGC1A, DNM1L, and OPA1 levels and impaired mitochondrial network remodelling. Similarly, knockdown of PINK1 results in decreased Myog mRNA while elevating Fbxo32 mRNA (an atrophy-related ubiquitin ligase) in differentiating C2C12 myoblasts [Citation16]. Interestingly, this same study found that PPARGC1A is critical in regulating the expression of key mitophagy-related proteins during differentiation, and suggests that PPARGC1A maintains appropriate mitophagic rate during myogenesis. Nevertheless, the present data together with these previous reports [Citation15,Citation16] suggest a critical role for mitophagy in myogenesis, and also underscores the intimate interplay between mitochondrial biogenesis, fission/fusion, and mitophagy in regulating the mitochondrial network and myogenic development.
Autophagy regulates oxidative stress and ER-associated stress during myoblast differentiation
Autophagy is crucial in regulating cellular and mitochondrial oxidative stress [Citation14,Citation25]. Throughout myoblast differentiation, autophagy-deficient cells displayed higher cellular ROS generation compared to control myoblasts. In agreement with this, two antioxidants (CAT and SOD1) known to respond to oxidative challenges during muscle differentiation and mitigate ROS production [Citation26,Citation27], were dramatically elevated in autophagy-deficient myoblasts; suggesting an altered redox environment. Importantly, mitochondrial-specific 4-HNE content and the mitochondrial antioxidant, SOD2, were elevated in autophagy-deficient myoblasts. Similarly, SOD2 levels were higher in bnip3-/- myoblasts during differentiation. 4-HNE is a reactive lipid species that can induce oxidative modifications to other proteins and lipids and is an established marker of oxidative stress [Citation28,Citation29], while SOD2 has a critical antioxidant function against superoxide anion in the mitochondria [Citation30]. Therefore, our data nicely demonstrates that autophagy and mitophagy are critical in regulating mitochondrial oxidative stress in myoblasts. Autophagy is also able to attenuate ER-stress by degrading aggregated/misfolded proteins [Citation31,Citation32]. HSPA is a critical cellular chaperone induced during the unfolded protein response [Citation19], whereas CAPN activity is elevated during ER stress [Citation20]. We found that autophagy-deficient myoblasts had dramatically elevated levels of HSPA and higher CAPN activity, suggesting that autophagy is critical in mitigating ER-stress during myoblast differentiation. The consequence of CAPN activation is several-fold as they participate in CASP activation, cleavage of several muscle-specific contractile proteins, and mitochondria-mediated apoptotic signaling [Citation33–Citation35]. Collectively, these data suggest that autophagy is critical in mitigating cellular and more specifically, organelle stress during myoblast differentiation.
Mitophagy regulates mitochondria-mediated apoptotic signaling during myoblast differentiation
BCL2 possesses a number of well-characterized anti-apoptotic capabilities [Citation36,Citation37]. While BCL2 increased during differentiation in control myoblasts, this was not the case in autophagy-deficient cells. It is known that oxidative stress and ROS generation can reduce BCL2 levels through UPS-mediated degradation [Citation38], which is in agreement with the altered redox environment observed in autophagy-deficient cells; however, this remains to be determined in this context. Regardless, this altered anti-apoptotic profile could sensitize differentiating autophagy-deficient myoblasts to apoptotic stress.
Consistent with the greater mitochondrial oxidative stress noted above, mitochondrial membrane potential was lower while mitochondrial membrane permeability was higher in shAtg7 cells throughout differentiation. It is well established that loss of mitochondrial membrane potential and integrity occur along with mitochondrial release of AIFM1 and CYCS during apoptosis [Citation21,Citation22,Citation39,Citation40]. Accordingly, shAtg7 myoblasts displayed increased CYCS and AIFM1 release, as well as CASP9 and CASP3 activation; all well-established events during mitochondrial apoptotic signaling. Consistent with this, bnip3-/- myoblasts displayed greater p-H2AFX levels as well as CASP9 and CASP3 activity, indicating greater apoptotic signaling during differentiation. This suggests that impaired mitophagy-mediated clearance of dysfunctional and damaged mitochondria in shAtg7 and bnip3-/- myoblasts during differentiation resulted in the accumulation of mitochondria with a greater propensity for apoptotic cell death signaling. Interestingly, control myoblasts displayed reduced membrane potential during differentiation without CASP9 activation; a response that was accompanied by elevated mitophagy. Overall, these data suggest that mitophagy plays a normal physiological role during myoblast differentiation, acting to regulate mitochondrial dynamics and stress. Moreover, we expand on this to show that mitophagy mitigates mitochondrial oxidative stress and apoptotic signaling during myoblast differentiation.
Mitophagy regulates the magnitude of CASP activation during myoblast differentiation
CASP signaling, particularly CASP3 activation is required for myoblast differentiation [Citation1]. Although low levels of mitochondrial-mediated apoptotic signaling could support CASP3 activation during differentiation of some cell types [Citation7], non-apoptotic myocytes display low levels of cleaved CASP9 [Citation3] compared to cells that die during differentiation. Further, our previous work shows that CASP9 activation is not observed during myoblast differentiation [Citation10]. Collectively with the new data reported here, we suggest that CASP9 activation is not a typical feature of normal myoblast differentiation, and is not the source of physiological CASP3 activation during myoblast differentiation. Rather, we provide strong evidence that the CASP9 activation that occurred in shAtg7 and bnip3-/- myoblasts contributed to augmented CASP3 activation, resulting in cell death and reduced differentiation/myogenesis. Thus, we suggest that autophagy and mitophagy are critical mechanisms regulating the level of CASP activation originating at the mitochondria, and are thus required to regulate the balance between physiological apoptosis-related signaling and cell death during myoblast differentiation [Citation5,Citation6]. In agreement with this, we among others have demonstrated that autophagy regulates CASP3 activation and apoptotic cell death during myoblast differentiation [Citation6], CASP-mediated cell death during macrophage specialization [Citation41], and apoptosis during endothelial precursor cell differentiation [Citation42]. Together, our findings suggest that mitophagy regulates the magnitude of CASP activity during myoblast differentiation by attenuating the level of mitochondrial stress.
Augmented CASP activation impairs myoblast differentiation
In order to directly examine the influence of augmented CASP activation on myogenesis, we utilized several CASP inhibitors and found that correcting CASP3 or CASP9 activity in autophagy-deficient cells to levels typically observed during differentiation partially recovered myogenesis. This strongly supports our interpretation that augmented CASP activation is at least partially linked to the reduction in myoblast differentiation observed in autophagy-deficient cells. Importantly, use of a selective CASP9 inhibitor in autophagy-deficient cells both reduced CASP3 activity and partially recovered myogenesis, demonstrating that the augmented CASP3 activity is CASP9-dependent. Further, transfection of autophagy-deficient cells with a dominant-negative CASP9 (ad-DNCASP9) also improved myogenic differentiation. This suggests that autophagy/mitophagy is critical in controlling CASP3 activity to allow differentiation to occur without triggering excessive apoptosis. Importantly, inhibition of mitochondrial apoptotic signaling only partially recovered differentiation and myogenesis. This partial recovery is not surprising given that other differentiation-associated signaling would likely be altered in the autophagy-deficient state [Citation23]. Moreover, it is likely that the autophagy-deficient myotubes that do form have a number of alterations given the role of autophagy/mitophagy in regulating normal cellular functions [Citation43,Citation44]. Nevertheless, our data demonstrate that autophagy and mitophagy are critical in controlling apoptosis-associated signaling, particularly mitochondria-mediated events, during myoblast differentiation.
Conclusion
Overall, we show that both autophagic and mitophagic signaling are upregulated and required for skeletal muscle differentiation and myogenesis. Importantly, our data demonstrate that autophagy and mitophagy are essential mechanisms regulating mitochondrial network-related signaling, mitochondrial oxidative stress, and mitochondria-associated cell death events during myoblast differentiation.
Materials and methods
Cell culture, transfections, and attenuation of CASP activity
Mouse C2C12 skeletal myoblasts (ATCC, CRL-1772) were plated in polystyrene cell culture dishes (BD Biosciences) in growth media (GM) consisting of low-glucose Dulbecco’s Modified Eagle’s Medium (DMEM; ThermoFisher Scientific, SH30021) containing 10% fetal bovine serum (FBS; ThermoFisher Scientific, SH30396) with 1% penicillin/streptomycin (ThermoFisher Scientific, SV30010) and incubated at 37ºC in 5% CO2. Myoblast differentiation was induced by replacing GM with differentiation media (DM) consisting of DMEM supplemented with 2% horse serum (ThermoFisher Scientific, SH30074) and 1% penicillin/streptomycin. Cells were collected prior to the addition of DM (D0) as well as at 12 h (D0.5), 24 h (D1), 36 h (D1.5), 48 h (D2), 72 h (D3), 96 h (D4), and 120 h (D5) following the addition of DM. In some experiments, CQ (10 μM; Sigma-Aldrich, C6628) was added to assess autophagic flux.
C2C12 cells stably expressing shRNA against Atg7 (shAtg7) or a scramble (SCR) control sequence were generated as previously described [Citation6]. Knockout of Bnip3 in C2C12 cells was achieved with CRISPR/Cas9 vectors targeting mouse Bnip3. Briefly, candidate guide RNA (gRNA) targets were identified using available online tools including: Zhang Lab, MIT (http://crispr.mit.edu/), CCTop (http://crispr.cos.uni-heidelberg.de/), and Off-Spotter (https://cm.jefferson.edu/Off-Spotter/). From these, two common gRNA sequences were identified (PAM in brackets): First: 5ʹGAGCCACCATGTCGCAGAGC(GGG), and Second: 5ʹGGAGGAGAACCTGCAGGGTG(AGG). As a control, the following scramble sequence was used: 5ʹGCACTACCAGAGCTAACTCA. Corresponding oligonucleotides were constructed (Sigma Aldrich) to allow cloning into the CRISPR/Cas9 vector pSpCas9(BB)-2A-Puro (PX459) V2.0 (Addgene, 62988), which uses a single gRNA. Correct gRNA cloning was confirmed by sequencing constructed vectors (The Center for Applied Genomics, Hospital for Sick Kids, Toronto, Ontario, Canada).
To investigate mitophagy during differentiation, the colocalization of autophagic puncta with mitochondria was measured by co-transfecting cells with pDsRed2-Mito vector (generously provided by Dr. Douglas Green, St Jude’s Children’s Research Hospital, Memphis, TN; Citation45) and GFP-LC3 adenovirus (ad-GFP-LC3; kindly provided by Dr. Gökhan S. Hotamisligil, Harvard School of Public Health, Boston, MA; Citation46). Cells were transfected upon reaching 60–70% confluence on glass coverslips coated with Cultrex BME (Trevigen, 3432–010-01), and induced to differentiate the following day. pDsRed2-Mito transfection was performed with jetPRIME Transfection Reagent (Polyplus-transfection, 114–07) according to the manufacturer’s instructions, and ad-GFP-LC3 was added for overnight incubation. Coverslips were removed the next day (D0) or following induction of differentiation (D0.5, D1, D2), washed, and mounted on glass slides using Prolong Gold Antifade Reagent (ThermoFisher Scientific, P36930) and imaged on a Zeiss LSM 800 (Carl Zeiss). In order to assist with counting colocalization events, 10 μM CQ was added to each well one day prior to imaging.
Attenuation of CASP activity was achieved with either a CASP3 inhibitor (Ac-DEVD-CHO; Enzo Life Sciences, ALX-260–030) or CASP9 inhibitor (Ac-LEHD-CHO; Enzo Life Sciences, ALX-260–079) made up in DMSO. Pilot work was performed to ensure that the activity was attenuated to similar levels of SCR cells rather than complete inhibition, resulting in effective doses of 1.5 µM and 1 µM for Ac-LEHD-CHO and Ac-DEVD-CHO, respectively. Cells were treated with CASP inhibitors or vehicle (equal volume of DMSO) during differentiation, with media/drug replaced every 24 hours.
Cells were incubated with adenoviruses expressing GFP (ad-GFP; kindly provided by Dr. Gökhan S. Hotamisligil, Harvard School of Public Health, Boston, MA; Citation46) or dominant-negative CASP9 (ad-DNCASP9; MOI = 60) generously provided by Dr. Paul Dent (Virginia Commonwealth University, Richmond, VA; Citation47) for 24 h prior to differentiation, then washed, and provided fresh GM. Several hours later, cells were collected (D0) or induced to differentiate by replacing GM with DM. Adenoviruses were amplified using HEK293 cells and viral titer was determined using the Adeno-X Rapid Titer Procedure (Clontech Laboratories, Inc.).
Cell isolations and acquisition of enriched subcellular fractions
For whole cell lysates, cells were removed from culture dishes by trypsinization (0.25% trypsin with 0.2 g/L EDTA; ThermoFisher Scientific, SH30042) and collected by centrifugation (800 x g for 5 min) as previously described [Citation6,Citation10]. Cell pellets were resuspended and washed in ice cold PBS, centrifuged, and frozen at −80°C until further analysis.
Cytosolic-, mitochondria-, and nuclear-enriched subcellular fractions were obtained by resuspending trypsinized cells in digitonin buffer [PBS with 250 mM sucrose, 80 mM KCl, and 50 µg/mL digitonin (Sigma Aldrich, D141)] for 5 min on ice as previously described [Citation10]. Cells were then centrifuged at 1000 x g for 10 min, the supernatant then centrifuged at 16,000 x g for 10 min, and the resulting supernatant frozen as the cytosolic-enriched fraction. The pellet from the 1000 x g spin was washed, resuspended in lysis buffer [LB; 20 mM HEPES, 10 mM NaCl, 1.5 mM MgCl, 1 mM DTT, 20% glycerol and 0.1% Triton X-100 (BioShop, TRX506); pH 7.4], and incubated on ice for 5 min before being centrifuged at 1000 x g for 10 min. The supernatant was isolated and centrifuge for 10 min at 1000 x g, and the resulting supernatant frozen as the mitochondria-enriched fraction. The pellet was twice resuspended in LB and centrifuged at 1000 x g for 10 min followed by sonication for 20 s, and then frozen as the nuclear-enriched fraction. Protein content of whole cell and subcellular-enriched fractions was determined using the BCA protein assay. Purity of subcellular fractions was determined by immunoblotting for SOD1 (cytosolic), SOD2 (mitochondrial), and H2BFM (H2B histone family, member M) (nuclear).
Immunoblotting
Immunoblotting was conducted as previously described [Citation6]. Briefly, cells were lysed in ice cold LB with protease inhibitors (Roche Applied Sciences, 04693116001). Cell lysates were loaded and separated on 7.5–15% SDS-PAGE gels, transferred onto PVDF membranes (Bio-Rad Laboratories), and blocked for 1 h at room temperature or overnight at 4°C with 5% milk-Tris-buffered saline (20 mM Tris, 137 mM NaCl, pH 7.5)-0.1% Tween 20 (BioShop, TWN508) (milk-TBST). Membranes were incubated either overnight at 4°C or for 1 h at room temperature with primary antibodies against: ATG7, BECN1, DNM1L, GADPH (glyceraldehyde-3-phosphate dehydrogenase), MAP1LC3B (Cell Signaling Technology, 8558, 3738, 8570, 2118, 2775, respectively), AIFM1, ACT/actin, SLC25A4, BAX, BCL2, CYCS, p-H2AFX, OPA1, PPARGC1A, VDAC1 (Santa Cruz Biotechnology, sc-13116, sc-47778, sc-9299, sc-493, sc-7382, sc-13156, sc-101696, sc-393296, sc-13067, sc-390996, respectively), MYOG, MYH (Developmental Studies Hybridoma Bank, F5D, MF20, respectively), ACT, BNIP3 (Sigma-Aldrich, A2066, B7931, respectively), CAT, HSPA, SOD1, SOD2 (Enzo Life Sciences, BML-SA115, SPA-810, ADI-SOD-101, ADI-SOD-110, respectively), H2BFM (Millipore, 07–371), SQSTM1 (MBL, PM045), or 4-HNE (Abcam, ab46545). Membranes were then washed with TBST, incubated with the appropriate horseradish peroxidase (HRP)-conjugated secondary antibodies (Santa Cruz Biotechnology, sc-2004, sc-2005, sc-2020) for 1 h at room temperature, washed with TBST, and bands visualized using enhanced chemiluminescence western blotting detection reagents (BioVision, K820-500) and the ChemiGenius 2 Bio-Imaging System (Syngene). The approximate molecular weight for each protein was estimated using Precision Plus Protein WesternC Standards and Precision Protein Strep-Tactin HRP Conjugate (Bio-Rad Laboratories, 161–0385). Equal loading and quality of transfer was confirmed by staining membranes with Ponceau S (BioShop, PON002).
Flow cytometry
Cells were harvested and washed/resuspended in Hank’s Balanced Salt Solution (HBSS). Mitochondrial membrane depolarization was monitored by changes in the tetraethylbenzimidazolylcarbocyanine iodide (JC-1) red:green fluorescence ratio, where a decreased ratio is indicative of decreased mitochondrial membrane potential [Citation48]. Briefly, cells were incubated with 2 μM JC-1 (Enzo Life Sciences, ENZ-52304) in HBSS for 15 min at 37°C, washed by centrifugation, and resuspended in HBSS. Formation of the mPTP occurs during mitochondrial-mediated apoptosis prior to mitochondrial apoptotic protein release. The fluorescent dye calcein AM accumulates in intact mitochondria, but is quenched by cobalt in membrane permeabilized mitochondria [Citation48]. Thus, a decrease in calcein fluorescence indicates mPTP formation. Briefly, cells were incubated with 1 μM calcein AM (Enzo Life Sciences, ALX-610–026) and 1 mM CoCl2 in HBSS for 15 min at 37°C, washed by centrifugation, and resuspended in 500 μl HBSS. For analysis of cell death, ANXA5-propidium iodide (PI) staining was performed [Citation48]. Isolated cells were washed in PBS, resuspended in ANXA5 binding buffer (10 mM HEPES/NaOH, 150 mM NaCl, 1.8 mM CaCl2, pH 7.4) and incubated with 5 µL of ANXA5-FITC (ThermoFisher Scientific; A13199) and 10 µL of 50 µg/mL of PI (Sigma-Aldrich, P4170). All analyses were performed on a flow cytometer (BD FACSCalibur) equipped with Cell Quest Pro software (BD Bioscience).
Proteolytic enzyme activity and ROS generation
Enzymatic activity of CASP3, CASP9, and CAPN was determined in whole cell lysates without the use of protease inhibitors, as previously described [Citation48,Citation49] using the substrates Ac-DEVD-AMC (Enzo Life Sciences, ALX-260–031) or Ac-DEVD-AFC (AAT Bioquest, 13401), Ac-LEHD-AMC (Enzo Life Sciences, ALX-260–080) or Ac-LEHD-AFC (Tocris Bioscience, 1575), and Suc-LLVY-AMC (Enzo Life Sciences, BML-P802), respectively. In the case of CAPN activity, assays were performed in conjunction with the CAPN inhibitor Z-LL-CHO (Enzo Life Sciences, BML-PI116). ROS generation was measured through 2ʹ,7ʹ-dichlorofluorescein (DCF) fluorescence using 2ʹ,7ʹ-dichlorodihydrofluorescein diacetate (ThermoFisher Scientific; D399) similar to previously demonstrated [Citation50]. CASP3, CASP9, CAPN, and DCF fluorescence was normalized to total protein content, and expressed as arbitrary units (AU) per milligram protein.
Immunofluorescence analysis of MYH, and determination of differentiation and fusion index
Briefly, cells grown on coverslips were washed in PBS, fixed with 4% formaldehyde-PBS for 10 min at room temperature, washed with PBS, permeabilized for 10 min with 0.5% Triton X-100, and further washed in PBS. Cells were then blocked with 10% goat serum (Sigma-Aldrich, G9023) (in PBS) for 30 min, incubated with a primary antibody against MYH (Developmental Studies Hybridoma Bank; MF20) for 2 h, washed with PBS, and then incubated with an anti-mouse PE-conjugated secondary antibody (Santa Cruz Biotechnology, sc-3738) for 1 h. Cells were then washed in PBS, counterstained with 4′,6-diamidino-2-phenylindole (DAPI) nuclear stain (ThermoFisher Scientific, D3571) for 5 min, washed in PBS, and mounted with Prolong Gold Antifade Reagent (ThermoFisher Scientific). Slides were visualized with an Axio Observer Z1 structured-illumination fluorescent microscope, an AxioCam HRm camera, and AxioVision software (Carl Zeiss). The fusion index was calculated as the percentage of nuclei present in multinucleated (two or more nuclei) cells relative to total nuclei. The differentiation index was calculated as the percentage of cells expressing MYH relative to total cell number.
Statistics
A one-way ANOVA was used to assess the effect of differentiation within groups, with post hoc analysis to determined differences from D0. Differences between time-matched SCR and shAtg7, Scram and bnip3-/-, or ad-GFP and ad-DNCASP9 groups were assessed using a Students T-test. A one-way ANOVA was used to assess time-matched group differences in the CASP inhibitor experiments, with post-hoc analysis as appropriate. For all experiments p < 0.05 was considered statistically significant and p < 0.10 considered a statistical trend.
Correction Statement
This article has been republished with minor changes. These changes do not impact the academic content of the article.
Acknowledgments
Some contents of the manuscript presented here are part of a doctoral thesis completed by Michael Elliott McMillan (MEM). The doctoral thesis of MEM can be found online (Michael Elliott McMillan, 2015. Examining the Role of Autophagy in Skeletal Muscle Cell Death and Differentiation. UWSpace. http://hdl.handle.net/10012/9045). MEM, BLB, and JQ conceived and designed the studies. MEM, BLB, and DB performed experiments, data collection, and data analysis. MEM, DB, and JQ initially wrote and/or edited the thesis chapter pertaining to this data. BLB, DB, and JQ further wrote, edited, and consent to submission of the current manuscript for publication.
Although the authors acknowledge the substantive contributions of MEM to this manuscript, the authors were not able to correspond with MEM to obtain authorship consent. Given our obligation to disseminate important findings from publicly funded research (see below), the authors, guided by the University of Waterloo administration felt it was necessary to proceed without inclusion of MEM as an author. BLB was supported by an Ontario Graduate Scholarship. DB was supported by a NSERC CGS-M scholarship and an Ontario Graduate Scholarship.
Disclosure statement
No potential conflict of interest was reported by the authors.
Additional information
Funding
References
- Fernando P, Kelly JF, Balazsi K, et al. Caspase 3 activity is required for skeletal muscle differentiation. Proc Natl Acad Sci U S A. 2002 Aug 20;99(17):11025–11030.
- Jahnke VE, Sabido O, Freyssenet D. Control of mitochondrial biogenesis, ROS level, and cytosolic Ca2+ concentration during the cell cycle and the onset of differentiation in L6E9 myoblasts. Am J Physiol Cell Physiol. 2009 May;296(5):C1185–94.
- Nakanishi K, Sudo T, Morishima N. Endoplasmic reticulum stress signaling transmitted by ATF6 mediates apoptosis during muscle development. J Cell Biol. 2005 May 23;169(4):555–560.
- Lüthi AU, Martin SJ. The CASBAH: a searchable database of caspase substrates. Cell Death Differ. 2007 Apr;14(4):641–650.
- Fernando P, Megeney LA. Is caspase-dependent apoptosis only cell differentiation taken to the extreme? FASEB J. 2007 Jan;21(1):8–17.
- McMillan EM, Quadrilatero J. Autophagy is required and protects against apoptosis during myoblast differentiation. Biochem J. 2014 Sep 1;462(2):267–277.
- Murray TV, McMahon JM, Howley BA, et al. A non-apoptotic role for caspase-9 in muscle differentiation. J Cell Sci. 2008 Nov 15;121(Pt 22):3786–3793.
- Freer-Prokop M, O’Flaherty J, Ross JA, et al. Non-canonical role for the TRAIL receptor DR5/FADD/caspase pathway in the regulation of MyoD expression and skeletal myoblast differentiation. Differentiation. 2009 Nov;78(4):205–212.
- Green DR, Amarante-Mendes GP. The point of no return: mitochondria, caspases, and the commitment to cell death. Results Probl Cell Differ. 1998;24:45–61.
- Bloemberg D, Quadrilatero J. Mitochondrial pro-apoptotic indices do not precede the transient caspase activation associated with myogenesis. Biochim Biophys Acta. 2014 Dec;1843(12):2926–2936.
- Kroemer G, Mariño G, Levine B. Autophagy and the integrated stress response. Mol Cell. 2010 Oct 22;40(2):280–293.
- Klionsky DJ. Autophagy: from phenomenology to molecular understanding in less than a decade. Nat Rev Mol Cell Biol. 2007 Nov;8(11):931–937.
- Mishra P, Chan DC. Mitochondrial dynamics and inheritance during cell division, development and disease. Nat Rev Mol Cell Biol. 2014 Oct;15(10):634–646.
- Lee J, Giordano S, Zhang J. Autophagy, mitochondria and oxidative stress: cross-talk and redox signalling. Biochem J. 2012 Jan 15;441(2):523–540.
- Sin J, Andres AM, Taylor DJ, et al. Mitophagy is required for mitochondrial biogenesis and myogenic differentiation of C2C12 myoblasts. Autophagy. 2016;12(2):369–380.
- Baldelli S, Aquilano K, Ciriolo MR. PGC-1α buffers ROS-mediated removal of mitochondria during myogenesis. Cell Death Dis. 2014 Nov 6;5:e1515.
- Kubli DA, Gustafsson ÅB. Mitochondria and mitophagy: the yin and yang of cell death control. Circ Res. 2012 Oct 12;111(9):1208–1221.
- Chipuk JE, Moldoveanu T, Llambi F, et al. The BCL-2 family reunion. Mol Cell. 2010 Feb 12;37(3):299–310.
- Saibil H. Chaperone machines for protein folding, unfolding and disaggregation. Nat Rev Mol Cell Biol. 2013 Oct;14(10):630–642.
- Rasheva VI, Domingos PM. Cellular responses to endoplasmic reticulum stress and apoptosis. Apoptosis. 2009 Aug;14(8):996–1007.
- Goldstein JC, Waterhouse NJ, Juin P, et al. The coordinate release of cytochrome c during apoptosis is rapid, complete and kinetically invariant. Nat Cell Biol. 2000 Mar;2(3):156–162.
- Susin SA, Lorenzo HK, Zamzami N, et al. Molecular characterization of mitochondrial apoptosis-inducing factor. Nature. 1999 Feb 4;397(6718):441–446.
- Mizushima N, Levine B. Autophagy in mammalian development and differentiation. Nat Cell Biol. 2010 Sep;12(9):823–830.
- Kim CH, Kim KH, Yoo YM. Melatonin-induced autophagy is associated with degradation of MyoD protein in C2C12 myoblast cells. J Pineal Res. 2012 Oct;53(3):289–297.
- Mei Y, Thompson MD, Cohen RA, et al. Autophagy and oxidative stress in cardiovascular diseases. Biochim Biophys Acta. 2015 Feb;1852(2):243–251.
- Franco AA, Odom RS, Rando TA. Regulation of antioxidant enzyme gene expression in response to oxidative stress and during differentiation of mouse skeletal muscle. Free Radic Biol Med. 1999 Nov;27(9–10):1122–1132.
- Zhou LZ, Johnson AP, Rando TA. NF kappa B and AP-1 mediate transcriptional responses to oxidative stress in skeletal muscle cells. Free Radic Biol Med. 2001 Dec 1;31(11):1405–1416.
- Uchida K. 4-Hydroxy-2-nonenal: a product and mediator of oxidative stress. Prog Lipid Res. 2003 Jul;42(4):318–343.
- Xiao M, Zhong H, Xia L, et al. Pathophysiology of mitochondrial lipid oxidation: role of 4-hydroxynonenal (4-HNE) and other bioactive lipids in mitochondria. Free Radic Biol Med. 2017 Oct;111:316–327.
- Bresciani G, Da Cruz IB, González-Gallego J. Manganese superoxide dismutase and oxidative stress modulation. Adv Clin Chem. 2015;68:87–130.
- Høyer-Hansen M, Jäättelä M. Connecting endoplasmic reticulum stress to autophagy by unfolded protein response and calcium. Cell Death Differ. 2007 Sep;14(9):1576–1582.
- Madaro L, Marrocco V, Carnio S, et al. Intracellular signaling in ER stress-induced autophagy in skeletal muscle cells. FASEB J. 2013 May;27(5):1990–2000.
- Goll DE, Thompson VF, Li H, et al. The calpain system. Physiol Rev. 2003 Jul;83(3):731–801.
- Polster BM, Basañez G, Etxebarria A, et al. Calpain I induces cleavage and release of apoptosis-inducing factor from isolated mitochondria. J Biol Chem. 2005 Feb 25;280(8):6447–6454.
- Nakagawa T, Yuan J. Cross-talk between two cysteine protease families. Activation of caspase-12 by calpain in apoptosis. J Cell Biol. 2000 Aug 21;150(4):887–894.
- Kluck RM, Bossy-Wetzel E, Green DR, et al. The release of cytochrome c from mitochondria: a primary site for Bcl-2 regulation of apoptosis. Science. 1997 Feb 21;275(5303):1132–1136.
- Green DR, Llambi F. Cell death signaling. Cold Spring Harb Perspect Biol. 2015 Dec 1;7(12):pii: a006080.
- Breitschopf K, Haendeler J, Malchow P, et al. Posttranslational modification of Bcl-2 facilitates its proteasome-dependent degradation: molecular characterization of the involved signaling pathway. Mol Cell Biol. 2000 Mar;20(5):1886–1896.
- Tait SW, Green DR. Mitochondria and cell death: outer membrane permeabilization and beyond. Nat Rev Mol Cell Biol. 2010 Sep;11(9):621–632.
- Youle RJ, Strasser A. The BCL-2 protein family: opposing activities that mediate cell death. Nat Rev Mol Cell Biol. 2008 Jan;9(1):47–59.
- Zhang Y, Morgan MJ, Chen K, et al. Induction of autophagy is essential for monocyte-macrophage differentiation. Blood. 2012 Mar 22;119(12):2895–2905.
- Wang HJ, Zhang D, Tan YZ, et al. Autophagy in endothelial progenitor cells is cytoprotective in hypoxic conditions. Am J Physiol Cell Physiol. 2013 Apr 1;304(7):C617–26.
- Mizushima N, Klionsky DJ. Protein turnover via autophagy: implications for metabolism. Annu Rev Nutr. 2007;27:19–40.
- Mizushima N. Physiological functions of autophagy. Curr Top Microbiol Immunol. 2009;335:71–84.
- Tait SW, Parsons MJ, Llambi F, et al. Resistance to caspase-independent cell death requires persistence of intact mitochondria. Dev Cell. 2010 May 18;18(5):802–813.
- Yang L, Li P, Fu S, et al. Defective hepatic autophagy in obesity promotes ER stress and causes insulin resistance. Cell Metab. 2010 Jun 9;11(6):467–478.
- Booth L, Roberts JL, Cruickshanks N, et al. Phosphodiesterase 5 inhibitors enhance chemotherapy killing in gastrointestinal/genitourinary cancer cells. Mol Pharmacol. 2014;85(3):408–419.
- Dam AD, Mitchell AS, Quadrilatero J. Induction of mitochondrial biogenesis protects against caspase-dependent and caspase-independent apoptosis in L6 myoblasts. Biochim Biophys Acta. 2013 Dec;1833(12):3426–3435.
- Paré MF, Baechler BL, Fajardo VA, et al. Effect of acute and chronic autophagy deficiency on skeletal muscle apoptotic signaling, morphology, and function. Biochim Biophys Acta. 2017 Apr;1864(4):708–718.
- McMillan EM, Graham DA, Rush JW, et al. Decreased DNA fragmentation and apoptotic signaling in soleus muscle of hypertensive rats following 6 weeks of treadmill training. J Appl Physiol (1985). 2012 Oct;113(7):1048–1057.