
ABSTRACT
Aging-related, nonresolving inflammation in both the central nervous system (CNS) and periphery predisposes individuals to the development of neurodegenerative disorders (NDDs). Inflammasomes are thought to be especially relevant to immune homeostasis, and their dysregulation contributes to inflammation and NDDs. However, few agents have been clinically shown to reduce NDD incidence by targeting inflammasomes. Our study indicated that NLRP3 (NLR family, pyrin domain containing 3) inflammasome is involved in Parkinson disease (PD) progression in patients and various murine models. In addition, the small molecule kaempferol (Ka) protected mice against LPS- and SNCA-induced neurodegeneration by inhibiting NLRP3 inflammasome activation as evidenced by the fact that Ka reduced cleaved CASP1 expression and disrupted NLRP3-PYCARD-CASP1 complex assembly with concomitant decreased IL1B secretion. Mechanically, Ka promoted macroautophagy/autophagy in microglia, leading to reduced NLRP3 protein expression, which in turn deactivated the NLRP3 inflammasome. Intriguingly, ubiquitination was involved in Ka-induced autophagic NLRP3 degradation. These findings were further confirmed in vivo as knockdown of Atg5 expression or autophagy inhibitor treatment significantly inhibited the Ka-mediated NLRP3 inflammasome inhibition and neurodegeneration amelioration. Thus, we demonstrated that Ka promotes neuroinflammatory inhibition via the cooperation of ubiquitination and autophagy, suggesting that Ka is a promising therapeutic strategy for the treatment of NDDs.
Abbreviations: 3-MA: 3-methyladenine; AAV: adeno-associated virus; ACTB: actin, beta; AIF1/IBA1: allograft inflammatory factor 1; ATG5: autophagy related 5; ATG7: autophagy related 7; BafA1: bafilomycin A1; BECN1: beclin 1, autophagy related; CASP1: caspase 1; CNS: central nervous system; CQ: chloroquine; DA neurons: dopaminergic neurons; DAMPS: damage-associated molecular patterns; DAPI: 4’,6-diamidino-2-phenylindole; GAPDH: glyceraldehyde-3-phosphate dehydrogenase; GFP: green fluorescent protein; GFAP: glial fibrillary acidic protein; IP: immunoprecipitation; i.p.: intraperitoneally; Ka: kaempferol; KD: knockdown; KO: knockout; LPS: lipopolysaccharide; IL1B: interleukin 1 beta; IL6: interleukin 6; Ly: lysate; MAP1LC3B/LC3B: microtubule-associated protein 1 light chain 3 beta; MPTP: 1-methyl-4-phenyl-1,2,3,6-tetrahydropyridine; NC: negative control; NDD: neurodegenerative diseases; NLRP3: NLR family, pyrin domain containing 3; OE: overexpression; PD: Parkinson disease; poly-Ub: poly-ubiquitin; PTM: post-translational modification; PYCARD/ASC: PYD and CARD domain containing; Rapa: rapamycin; RFP: red fluorescent protein; SN: supernatant; SNCA: synuclein alpha; SNpc: substantia nigra pars compacta; SQSTM1: sequestosome 1; TH: tyrosine hydroxylase; TNF/TNF-alpha: tumor necrosis factor; Ub: ubiquitin; WT: wild type
Introduction
Neurodegenerative disorders (NDDs) are a common degenerative response to numerous systemic-level processes, but the exact etiology has yet to be fully clarified; however, aging is widely accepted as the greatest risk factor [Citation1]. Parkinson disease (PD), a common NDD, is characterized by the preferential loss of dopaminergic (DA) neurons in the substantia nigra (SNpc) and intracellular inclusions containing SNCA aggregates and affects 2–3% of the population over the age of 65 [Citation2]. However, in individuals over 85, this prevalence reaches 5% [Citation3], highlighting the impact of aging in the pathological process. The association between aging and increased inflammation has been well established. Both men and women over the age of 65 have increased serum IL6 (interleukin 6), TNF (tumor necrosis factor), and IL18 (interleukin 18) levels [Citation4,Citation5]. Moreover, emerging evidence suggests that systemic low-grade inflammation contributes to the development of degenerative changes in the brain, particularly as aging progresses [Citation1,Citation6]. In the brain, the ‘hypothalamus-microinflammation’ theory predominately highlights the fundamental role of inflammation in aging-related NDD development [Citation7,Citation8]. Collectively, inflammation represents the key regulator in both aging and degenerative disorders [Citation9], further rendering inflammation as a principal mechanism underlying PD [Citation10]. Thus, manipulating the mechanisms of age-related inflammation may potentially slow the development of all NDDs [Citation11]. However, despite extensive efforts, various chemicals that target inflammation, such as IL1B (interleukin 1 beta) neutralizing antibody and CASP1 inhibitors, have all failed to induce the predicted clinical benefits in recent high-profile clinical trials [Citation12,Citation13]. Epidemiological studies on the use of nonsteroidal anti-inflammatory drugs (NSAIDs) to reduce PD risk have shown conflicting results [Citation14,Citation15] due to the fact that our understanding of the pathogenic mechanisms underlying PD is incomplete and inaccurate diagnosis during the course of illness. Moreover, inhibiting systemic inflammation may disturb immunity architecture and brain function in addition to inducing adverse side effects [Citation16]. Therefore, precise control of excessive neuroinflammation remains difficult and is urgently needed.
The inflammasome is a cytosolic multimeric protein complex that serves as a platform for CASP1 activation and proinflammatory cytokine IL1B maturation [Citation17]. Excessive inflammasome activation is involved in the pathogenesis of several aging-related inflammatory disorders, including type 2 diabetes (T2D), atherosclerosis and gout, as well as in NDDs such as PD [Citation11,Citation18], suggesting that this activation needs to be tightly controlled. Although a number of inflammasomes have been described, NLRP3 (NLR family, pyrin domain containing 3) inflammasome is especially relevant to aging and has been extensively studied as it is activated in response to structurally diverse damage-associated molecular patterns (DAMPs), such as extracellular ATP, excess glucose, ceramides, amyloids, urate, and cholesterol crystals, all of which increase with age and contribute to neurodegeneration [Citation19]. After activation, NLRP3 confers chronic low-grade inflammation [Citation20], which is seen during NDDs. Many regulatory mechanisms have been identified that attenuate NLRP3 inflammasome signaling at multiple steps. Among them, the induction of autophagy, which results in the inactivation or selective clearance of harmful substrates or secondary signals, such as damaged mitochondria in cells, is reported to negatively regulate NLRP3 inflammasome activation [Citation18,Citation21,Citation22]. Although accumulating evidence indicates that the NLRP3 and autophagy pathways are linked by reciprocal regulation, recent studies have shown autophagy-dependent degradation of NLRP3 [Citation23,Citation24] through a yet-to-be defined mechanism.
Predominantly, several distinguished studies have documented that NLRP3 immunoactivity can be post-transcriptionally modified. Among all post-transcriptional modifications (PTMs), ubiquitination represents a new potential strategy for NLRP3 regulation. Studies have shown that deubiquitination of NLRP3 is critically involved in NLRP3 inflammasome activation, whereas inhibition of NLRP3 deubiquitination blocks both mouse and human NLRP3 activation [Citation21,Citation25], suggesting that ubiquitination is a key brake on NLRP3 inflammasome activation. Thus, although many studies have extensively investigated NLRP3 inflammasomes, the related regulatory networks, especially the link between autophagy, NLRP3 and ubiquitination, still remain unknown. Therefore, a better understanding of the mutual regulation and PTMs of NLRP3 inflammasomes is essential for discovering new therapeutics for chronic neuroinflammatory diseases.
Kaempferol (Ka) is a natural polyphenolic small molecule that is found in a number of dietary sources [Citation26] and is especially enriched in many of the herbs that have been used as herbal medicines in China for thousands of years. Ka has been reported to exert antibacterial, kinase-regulatory, antioxidant, and neuroprotective activities [Citation27–Citation29]. Previously, Ka was reported to inhibit inflammation in BV2 microglial cells in vitro [Citation30]. Nevertheless, the effect of Ka on inflammatory-associated NDDs, especially the development of PD, has not yet been investigated.
In the present study, we demonstrated that the small molecule Ka significantly protected mice against neurodegeneration in various murine PD models through inhibiting NLRP3 inflammasome activation and was well tolerated. Further study revealed that Ka triggered selective autophagic NLRP3 protein degradation via ubiquitination, thereby deactivating the NLRP3 inflammasome. The findings obtained in this study suggested that Ka regulated multiple targets, linking autophagy promotion and inflammation inhibition for NDD prevention. Accordingly, these findings may help direct clinical decisions regarding the use of Ka in both the aging population and patients with systemic inflammation, ultimately reducing PD incidence.
Results
NLRP3 inflammasome activation correlates with PD progression
Low-grade inflammation has been reported to contribute the development of degenerative changes in the brain, and the subsequent increase in inflammatory cytokine levels, such as IL18, IL1B, and IL6, has been proposed to be the driver behind NDD pathology [Citation31]. Our previous study also indicated that metabolic inflammation exacerbates acute MPTP (1-methyl-4-phenyl-1,2,3,6-tetrahydropyridine)-induced DA neuronal degeneration [Citation6]. Furthermore, one of our recent studies directly demonstrated that inflammation was significantly activated during the pathological course of PD by examining the matured IL1B and activated CASP1 levels in the human serum from normal control patients and patients with PD [Citation32]. In the current study, to further investigate the relation between inflammation and PD pathology, we performed various PD mouse models. Consistent with the clinical data, the same results were confirmed in the serum of MPTP/p toxicity-induced PD mice ()). Western blotting also revealed high expression levels of CASP1 and IL1B in the midbrain homogenates of PD mice (( and )), indicating that inflammation was actually activated during the pathological course of PD in both patients and mouse models.
Figure 1. NLRP3 inflammasome activation correlates with PD progression. (a) i-ii: ELISA analysis of IL1B and CASP1 secretion in the serum of the saline and MPTP/p PD mouse model. Data are representative of eight independent experiments (means ± SEM, n = 6). **P < 0.01 vs. control group, as determined by the Student’s t-test. (b) Expression of pro-CASP1, CASP1, pro-IL1B and IL1B in the midbrain extracts of the indicated mice, and the densitometric analysis is shown in (c). Data are representative of 4 independent experiments (means ± SEM). ***P < 0.001 vs. control group, as determined by the Student’s t-test. (d) Expression of NLRP1, NLRP2, NLRP3, NLRC4 and AIM2 in the midbrain extracts of NC and MPTP/p mice. Densitometric analysis of protein expression levels in the acute MPTP (e) and subacute MPTP/p (f) PD model midbrains. Data are representative of four independent experiments (means ± SEM). *P < 0.05, **P < 0.01, ***P < 0.001 compared with the corresponding saline group, as determined by the Student’s t-test. (g) The midbrain sections of subacute MPTP/p mice were fixed and analyzed by immunofluorescence for NLRP3 and TH expression levels. Appropriate magnifications were selected, as indicated by the scale bars. Data are representative of 3 independent experiments (means ± SEM). **P < 0.01 compared with the saline group, as determined by the Student’s t-test.
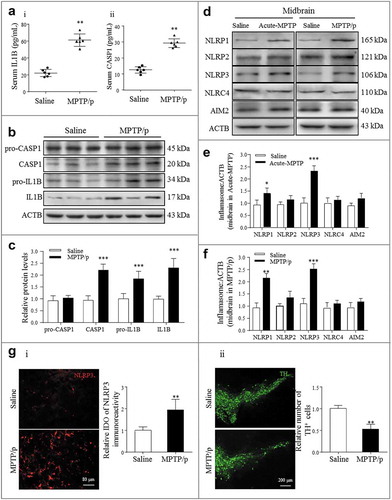
Pattern recognition receptors are considered key regulators of neuroinflammation in the sterile inflammatory response to endogenous stimuli, referred to as DAMPs, and specifically emphasize the effect of NLRs [Citation18,Citation23]. Currently, NLRP1, AIM2 (absent in melanoma 2), NLRP2, NLRP3 and NLRC4 have been identified to function in the CNS, especially with NLRP3 inflammasomes, and are most highly expressed in microglia, the tissue-specific brain macrophages [Citation33]. Then, to confirm the participation of the inflammasome in PD progression, we further established both acute and canonical subacute MPTP/p PD mouse models. Notably, NLRP1 and NLRP3 expression levels were increased in both models ()). In addition, compared with NLRP1, NLRP3 was more upregulated and more positively correlated with the pathological process ( and ). Immunohistofluorescence (IHF) also revealed high NLRP3 (red) expression in diseased brains (SNpc) ()) positive for both AIF1 (allograft inflammatory factor 1)/IBA1 (green) and GFAP (green) and negative for TH (tyrosine hydroxylase) (green) ( and S1)), further supporting the contribution of activated glial NLRP3 to DA neuron degeneration in the SNpc. Collectively, these results suggested that NLRP3 inflammasome activation positively correlated with the pathological course of PD. Therefore, targeting NLRP3 inflammasome regulation may represent a potential strategy for preventing and treating PD.
Ka prevents neurodegeneration in an inflammation-associated PD model
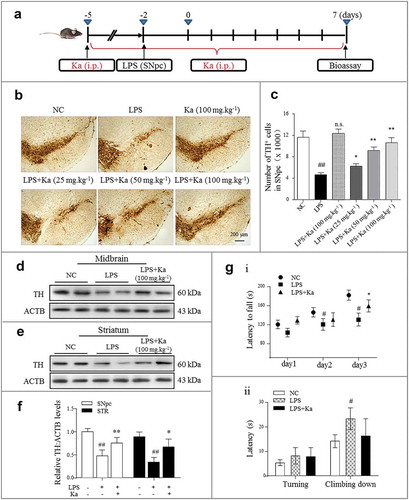
Since inflammation plays a critical role in PD, we generated a lipopolysaccharide (LPS)-induced PD mouse model to investigate the direct mechanisms of inflammation in PD pathology and to evaluate potential inhibitors. Briefly, LPS was stereotaxically microinjected into the mouse SNpc, as elaborated and well verified previously [Citation6,Citation34]. For pharmacological evaluation, the Ka intervention (i.p., daily) was initiated 3 days before and 7 days after the LPS challenge, as shown in the schedule ()). The mice were sacrificed on day 10 post inflammation induction. The Ka was well tolerated, as 100% of the mice survived the treatment (data not shown) and the serum GPT/ALT (glutamic–pyruvic transaminase) and serum GOT1/AST (glutamic-oxaloacetic transaminase 1) levels were not significantly different after treatment (Figure S2A). To determine whether Ka is neuroprotective, DA neuron loss was examined by immunohistochemistry (IHC) with TH and Nissl’s staining (Figure S2B). As shown in (b and c), compared with the control mice, the LPS-injected mice presented with severe nigral DA neuron loss, but the Ka treatment attenuated this insult in a dose-dependent manner. Since the 100 mg.kg−1 Ka dose was well tolerated and induced a substantial protective effect, we used this dose in the following studies, except where specifically indicated. Moreover, apart from the number of DA neurons, the TH protein expression levels in both the midbrain ((d)) and striatum ((e)) extracts were markedly upregulated by the Ka (100 mg.kg−1) treatment ((f)). We also examined the performance of the Ka-treated mice in behavioral coordination and muscle strength tests. The data obtained for the rotarod test demonstrated that after proper training, Ka improved the LPS-inhibited movement performance ()), but the pole test did not indicate significant alleviation between these two groups ()). Together, these results indicated that Ka administration attenuated inflammation-triggered neurodegeneration without obvious side effects in LPS-treated mice.
Figure 2. Ka prevents neurodegeneration in an inflammation-associated PD model. (a) Schedule of animal treatments. Four-month-old C57BL/6 mice were intraperitoneally treated with dimethyl sulfoxide (vehicle) or Ka (25, 50 or 100 mg.kg−1 body weight) daily during the experiment period. Three days later, the inflammatory responses were induced by one LPS (0.5 μg, bilaterally) microinjection into the SNpc. (b) Immunohistochemical staining for TH (tyrosine hydroxylase) on the ventral mesencephalon of mice treated with LPS plus (or) Ka. Scale bar: 200 μm. (c) Quantitative data of the TH+ neurons described in (b). (d and e) Western blotting analysis of TH in both mesencephalon and striatum extracts of experimental mice, with densitometric analysis shown in (f). (g) Rotarod test and pole test of mice. i: Rotarod test in different groups (n = 8) at the end of the experiment, which was continuously performed for 3 days. ii: Pole test in mice (n = 8). Data in (c, f and g) are representative of three independent experiments (means ± SEM). #P < 0.05, ##P < 0.01 vs. control group, as determined by the Student’s t-test, ns.P > 0.05, *P < 0.05, **P < 0.01 vs. LPS group, as determined by the Student’s t-test. Ka, kaempferol.
Ka prevents neurodegeneration by attenuating neuroinflammation in LPS-induced PD mice
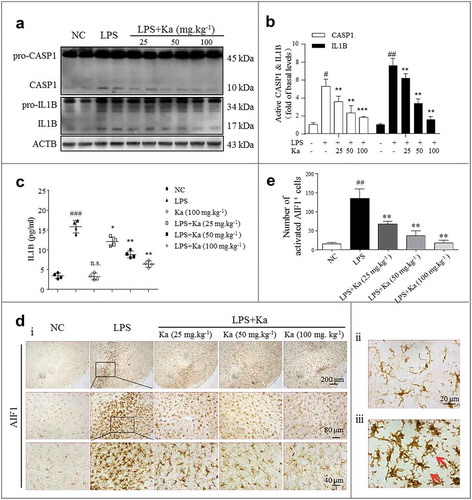
After determining that Ka induced neuroprotective effects in LPS-injected mice, we next examined the role of Ka in neuroinflammation activation. In addition to the reduced loss of DA neurons in LPS-insulted mice, we also found that the inflammatory level was greatly decreased by the Ka treatment. Consistent with the immunoblotting results revealing the cleaved CASP1 (p10), pro-IL1B and IL1B expression levels, the activated inflammatory subunits were markedly reduced by Ka ( and ). In addition, the expression of proinflammatory cytokines, such as IL1B, was also suppressed in the brain homogenates, as detected by ELISA ((c)). When injured, microglia and astrocytes both overexpress NLRP3 and secrete IL1B in an NLRP3 inflammasome-dependent manner. Microglia share many of the phenotypic and functional characteristics of macrophages and function as the robust resident immune cells of the CNS [Citation3,Citation33]. Therefore, we investigated whether Ka inhibits inflammasome activation in microglia. IHC staining for the microglia marker AIF1 indicated that once activated, microglia switch from a resting ()) to activated ()) state, and the Ka treatment inhibited this LPS-induced microglia activation ( and ) in vivo.
Figure 3. Ka attenuates neuroinflammation in an LPS-induced PD mouse model. (a and b) Differential inflammatory protein expression levels in the midbrain were measured post LPS challenge by western blotting and quantitative analysis. (c) ELISA analysis of IL1B level in the midbrain extracts of mice treated with LPS or LPS plus Ka (25, 50 or 100 mg.kg−1 body weight, daily, i.p.). (d) Representative sections (ventral mesencephalon, SNpc) prepared from brain tissues were stained with the microglia marker AIF1. (Upper and lower right magnified images represent resting and activated microglia, respectively.) Scale bars represent the indicated length. (e) Quantitative analysis of the activated microglia described in (d). Data in (b and e) are representative of 3 independent experiments with replications. Data in (c) are representative of 4 independent experiments (means ± SEM. n = 4). n.s.P > 0.05, #P < 0.05, ##P < 0.01, ###P < 0.001 vs. control group, as determined by the Student’s t-test. *P < 0.05, **P < 0.01, ***P < 0.001 vs. LPS group, as determined by the Student’s t-test. Ka, kaempferol.
Ka attenuates neuroinflammation in a SNCA model of PD
SNCA aggregates, the main pathological factor of both familial and sporadic PD, dementia with Lewy’s bodies (DLB) and multiple system atrophy (MSA) [Citation35], have also been reported as endogenous inflammatory activators [Citation36]. Our previous work demonstrated that NLRP3 inflammasomes are activated by aggregated SNCA both in vivo and in vitro [Citation32]. To determine whether the anti-neuroinflammatory property of Ka extends to a broader range of NDDs, a transgenic A53Ttg/tg mouse model with the human A53T mutant for overexpressing SNCA was used in our study. From 7 months old, the A53Ttg/tg mice were treated with Ka (i.p., 100 mg.kg−1) or vehicle for 8 continuous weeks ()). At the endpoint, compared with the wild-type (WT) littermates, the A53Ttg/tg mice exhibited upregulated SNCA expression (()) concomitant with aggregated morphological changes ()) in the nigrostriatal region. Accordingly, histological analysis revealed increased pathological severity, including dramatic nigral TH+ neuron loss ()) and microglia activation ((d)). Ka (100 mg.kg−1) administration attenuated both DA neuron damage and microglial activation ((, )) during the natural pathological progression without affecting the total amount of SNCA.
Figure 4. Ka attenuates neuroinflammation in a transgenic model of PD. (a) Diagram of the experimental design. Seven-month-old A53Ttg/tg mice and matched WT control mice were grouped as indicated. All mice were treated with dimethyl sulfoxide (vehicle) or Ka (100 mg.kg−1 body weight, i.p.) daily during the experimental period. Mice were transcardially perfused at the endpoint. (b and d) The expression of TH, SNCA and AIF1 were analyzed by immunochemistry in the midbrain sections, and the statistical data are shown on the right. Scale bars are as indicated. Quantification of SNCA immunofluorescence intensity using ImageJ software. IOD, integrated optical density. (c) The protein levels of TH and SNCA in the midbrain tissues were examined by western blotting (c i), and the statistical data are shown in (c ii-iii). (e) The expression levels of NLRP3 and CASP1/p10 in the midbrain were examined by western blotting (e i), and the statistical data are shown in (e ii-iii). Data in (b, c, d and e) are presented as the means ± SEM (n = 5–6). #P < 0.05, ##P < 0.01, ###P < 0.001 vs. WT-vehicle group by one-way ANOVA. n.s.P > 0.05, *P < 0.05, **P < 0.01 vs. A53Ttg/tg-vehicle group, as determined by one-way ANOVA. Ka, kaempferol.
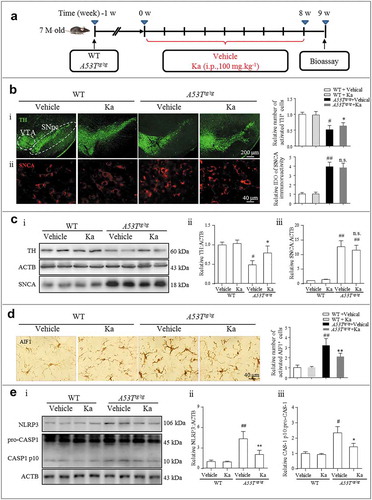
The up-regulation and assembly of NLRP3 act as the ‘first’ and ‘second’ signals, respectively, during NLRP3 inflammasome activation [Citation23]. Mice with SNCA overexpression exhibited a cytokine profile similar to that in human PD, including the overproduction of proinflammatory cytokines such as TNF, IL1B and IL17A (interleukin 17A) [Citation37]. We indeed found that the levels of both NLRP3 and the cleaved active protein IL1B were markedly increased in the mesencephalon of the A53Ttg/tg group relative to that of the WT control, and Ka significantly suppressed the upregulation (()).
The administration of Ka also resulted in significantly decreased DA neuron damage, microglia activation, and NLRP3-CASP1 levels in toxin (MPTP)-induced brain injury (Fig S3), which is a well-established animal model for assessing DA neuronal degeneration and damage response to injury. Thus, consistent with the LPS-based PD model, the anti-inflammatory and neuroprotective effects of Ka also contributed to the prevention of both SNCA- and MPTP-induced degeneration in vivo.
NLRP3 inflammasome inhibition contributes to the anti-inflammatory effect of Ka
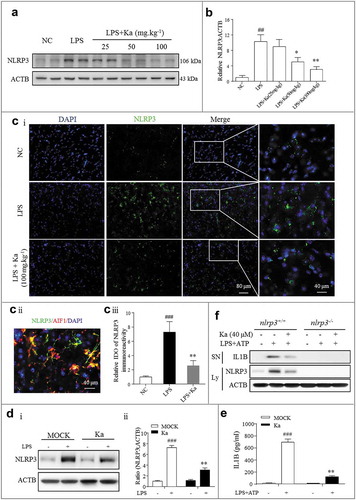
To investigate the mechanism by which Ka protects against neuroinflammation, we examined NLRP3 inflammasome activation in vivo and in vitro. The results from and ) showed that compared with the vehicle treatment, the Ka treatment (25–100 mg.kg−1) substantially inhibited NLRP3 protein expression in the midbrain of LPS-challenged mice. In addition, NLRP3 immunoreactivity (green) was much lower in the Ka-treated mice than in the LPS-treated mice (Fig. 5Ci and 5Ciii), as detected by IHF. As shown in Fig. 5Cii and Fig. S4 as well as Fig. S1, both MPTP- and LPS-induced NLRP3 activity were mostly localized to microglia. To confirm this result in vivo, primary microglia were cultured and then stimulated with NLRP3 inflammasome activators. Consistently, Ka reduced LPS-induced NLRP3 protein expression (()) and suppressed IL1B secretion after specific NLRP3 inflammasome stimulation with ATP, as determined by ELISA (()). Moreover, the inhibitory effect of Ka on IL1B secretion was totally abolished in the primary microglia isolated from the nlrp3 knockout (nlrp3−/-) mice (()), which further confirmed the key role of NLRP3 in the anti-inflammatory effect of Ka. Collectively, these in vivo and in vitro results indicated that Ka administration reduces LPS-induced NLRP3 protein expression in CNS.
Figure 5. NLRP3 inflammasome inhibition accounts for the anti-inflammatory effect of Ka. (a) NLRP3 protein expression in the midbrain was measured by western blotting and the quantitative analysis data shown in (b). Data are representative of 3 independent experiments (means ± SEM). ##P < 0.01 vs. control group, *P < 0.05, **P < 0.01 vs. LPS group, as determined by the Student’s t-test. (ci) NLRP3 expression was analyzed by immunohistofluorescence (IHF) and counterstained with DAPI in the midbrain sections of the indicated mice. Scale bar as indicated. (cii) Localization analysis showed that NLRP3 immunoactivity was mainly in the microglia. (ciii) Quantification of NLRP3 immunofluorescence intensity using ImageJ software. IOD, integrated optical density. Data shown are representative of 3 experiments (means ± SEM, n = 4). ###P < 0.001 vs. control group, **P < 0.01 vs. LPS group, as determined by the Student’s t-test. (D and E) LPS-primed primary microglia from WT mice were cultured with (or without) Ka (40 μM) for 5 h, followed by a 30-min incubation with ATP (5 mM). NLRP3 in the cell extracts was analyzed by immunoblotting, and supernatants were analyzed by ELISA for IL1B maturation (e). (f) Primary microglia from nlrp3+/+ and nlrp3−/- mice were treated as described in (e); NLRP3 expression and IL1B secretion were then measured by western blotting. Data in (d and e) are representative of 4 to 5 independent experiments with repetitions (means ± SEM). ###P < 0.001 vs. NC group, **P < 0.01 vs. LPS- and (or) ATP-stimulated group by one-way ANOVA. Ka, kaempferol.
Ka inhibits CASP1 activation and IL1B maturation by interrupting NLRP3 inflammasome formation in vitro
After identifying the NLRP3 inhibitory effect of Ka in vivo, we next examined the direct effect of Ka on NLRP3 inflammasome activation in vitro. Both primary microglia and BV2 cells were cultured and primed with LPS for ‘first signal’ activation. Both cells were then treated with different doses of Ka before ATP stimulation, which triggers ‘the second signal’ for NLRP3 inflammasome assembly. NLRP3 inflammasome-dependent CASP1 maturation and IL1B production were indeed inhibited by Ka in a dose-dependent manner in both primary microglia ()) and BV2 cells (Fig. S5A) without affecting cell survival (Fig. S5B). Next, the ELISA analysis of IL1B secretion into the microglia supernatant (SN) after different treatments further confirmed the immunoblotting results (()). Similar results were observed in bone marrow-derived macrophages (BMDMs) and Raw264.7 cells, mouse macrophage cells, by immunoblotting (Fig. S5C and D). The NLRP3 inflammasome can be activated by many different endogenous and exogenous substances. Then, to test whether Ka affects only ATP-induced NLRP3 inflammasome activation, we examined other NLRP3 agonists. The results revealed that Ka inhibited the CASP1 cleavage and IL1B secretion induced by all examined agonists, including monosodium urate (MSU) and nigericin, similar to that of ATP (()), suggesting that Ka is a potent and broad inhibitor of NLRP3 inflammasomes. ATP triggers K+ efflux, an endogenous danger signal, through the P2X7 receptor to activate CASP1, resulting in cell membrane rupture and protein excretion [Citation38]. To exclude this potential impact on cytokine release, LPS-primed BV2 cells stimulated with or without ATP were harvested for analysis, and the results shown in () indicated that the cytokine inhibitory effect of Ka was not due to membrane rupture but to inflammasome inactivation.
Figure 6. Ka inhibits CASP1 activation and IL1B maturation by interrupting NLRP3 inflammasome formation in vitro. (a) LPS-primed primary microglia were treated with different doses of Ka for 5 h and then stimulated with ATP for 30 min. Supernatants (SN) and cell extracts were analyzed by immunoblotting (Ai), and the quantitative analysis of activated CASP1/p10 is shown in Aii. (b) SN samples from (a) were analyzed by ELISA for IL1B maturation. Data in (a and b) are representative of 5 independent experiments with repetitions (means ± SEM). *P < 0.05, **P < 0.01, ***P < 0.001 vs. ATP group by the Student’s t-test. (c) LPS-primed BV2 cells were treated with Ka (40 μM) and then stimulated with ATP, nigericin or MSU. SN and cell extracts (lysate) were analyzed by immunoblotting, and the quantitative analysis of activated CASP1/p10 and IL1B is shown in (Cii). Data are representative of 3 independent experiments with repetitions (means ± SEM). **P < 0.01,***P < 0.001 vs. NC group, as determined by the Student’s t-test. (d) LPS-primed BV2 cells were treated with 40 μM Ka for 5 h, followed by a 30-min incubation with or without ATP (5 mM); the immunoblotting analysis was performed as described in (c). (e and f) LPS-primed BV2 cells were treated with 40 μM Ka and then stimulated with ATP. The NLRP3 complex specks were indicated by immunocytofluorescence (f), and the NLRP3-PYCARD interaction was analyzed by immunoprecipitation and immunoblotting (e). Scale bar: 20 μm. Data in (f) are representative of 3 independent experiments with repetitions (means ± SEM). ###P < 0.001 vs. control group, **P < 0.01 vs. ATP group, as determined by the Student’s t-test. Ka, kaempferol; SN, supernatant; Ly, lysate.
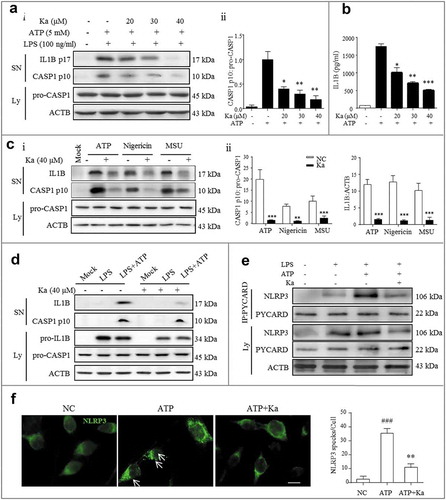
NLRP3-dependent PYCARD nucleation-induced oligomerization is considered a common mechanism of NLRP3 inflammasome activation [Citation20]. Upon NLRP3 inflammasome activation by ATP, NLRP3-oligomerized PYCARD condense into large cytosolic specks in each cell, and this NLRP3-complex formation was markedly attenuated by Ka in BV2 cells (()). Consistent with these data, the ATP-induced interaction between NLRP3 and PYCARD, which is critical for NLRP3 oligomerization, was attenuated by Ka (()). Taken together, these results demonstrated that Ka universally inhibited NLRP3 inflammasome activation and, subsequently, CASP1 maturation and IL1B production through PYCARD-mediated NLRP3 oligomerization disruption.
Ka promotes NLRP3 autophagic degradation to inhibit NLRP3 inflammasome
Next, we asked how Ka inhibits NLRP3 inflammasome activation. Interestingly, in LPS-primed BV2 cells, we found that the Ka treatment reduced NLRP3 expression in a dose-dependent manner ()). Since all cells primed with LPS for the common upregulation of NLRP3 included ‘first signal’ protein levels, NLRP3 downregulation may mostly be due to degradation. Moreover, the NLRP3 protein level was not changed by ATP-induced secretion ()), further suggesting that the NLRP3 inhibitory effect was due to Ka-induced degradation. In addition, the Ka-induced protein degradation was specific to NLRP3 because PYCARD and pro-CASP1 expression were stable in the Ka-treated BV2 cells (( and )). Since both the autophagy and proteasome pathways are involved in protein degradation [Citation39], we wondered which pathway accounts for NLRP3 degradation. Our results revealed that the autophagy inhibitor 3-methyladenine (3-MA) suppressed the Ka-induced NLRP3 reduction, while the proteasome inhibitor MG-132 did not (()), supporting NLRP3 degradation via autophagy.
Figure 7. Ka promotes NLRP3 protein autophagic degradation, which inhibits NLRP3 inflammasome activation. (a) Immunoblotting analysis of NLRP3, PYCARD, pro-CASP1, and ACTB from LPS-primed BV2 cells treated with various doses of Ka for 5 h. Data are representative of 4 independent experiments with repetitions (means ± SEM). ###P < 0.001 vs. control group, as determined by the Student’s t-test. *P < 0.05, **P < 0.01 vs. LPS group, as determined by the Student’s t-test. (b) Immunoblotting analysis of NLRP3, PYCARD, and pro-CASP1 from LPS-primed BV2 cells treated with 40 μM Ka for 5 h and then stimulated with or without ATP for 30 min. Data are representative of 3 independent experiments with repetitions (means ± SEM). ###P < 0.001 vs. control group, as determined by the Student’s t-test. *P < 0.05, **P < 0.01 vs. LPS group, as determined by the Student’s t-test. n.s.P > 0.05 vs. corresponding MOCK group by one-way ANOVA, followed by the Holm-Sidak test. (c) LPS-primed BV2 cells were cultured with MG-132 (10 μM) or 3-MA (5 mM) for 1 h and then treated with Ka (40 μM) for 5 h, followed by a 30-min incubation with 5 mM ATP. Supernatants (SN) and cell extracts (lysate) were analyzed by immunoblotting. (d) Immunoblotting analysis of MAP1LC3B and ACTB levels in cell lysates from LPS-primed BV2 cells cultured with 3-MA (5 mM), BafA1 (100 nM) or CQ (10 μM) and then treated with Ka (40 μM) for 5 h. Data in (c and d) are representative of 3 independent experiments with repetitions (means ± SEM). ###P < 0.001 vs. control group, as determined by the Student’s t-test. **P < 0.01 vs. LPS group, as determined by the Student’s t-test. &P < 0.05, &&P < 0.01 vs. Ka group by one-way ANOVA, followed by the Holm-Sidak test. Ka, kaempferol.
To further characterize the underlying autophagic mechanisms, we examined the effect of Ka on MAP1LC3B/LC3B-II expression, which is a cleaved MAP1LC3B–phosphatidylethanolamine conjugate and a general autophagosomal marker [Citation40]. Moreover, during the autophagic process, SQSTM1/p62 acts as a receptor protein that links MAP1LC3B with ubiquitinated-proteins for clearance. In BV2 microglia cells, Ka treatment promoted autophagy as indicated by higher MAP1LC3B-II production in a time-dependent manner (Fig. S6A), which was further abolished by 3-MA and blunted by bafilomycin A1 (BafA1), as evidenced by greater SQSTM1 and MAP1LC3B-II accumulation (Fig. S6B). This autophagy promotion capacity of Ka could then counteract LPS-induced (100 ng.ml−1) autophagy inhibition (Fig. S6C and D) and reduce LPS-induced NLRP3 expression (()). Moreover, in primary microglia, Ka treatment increased ATG5 (autophagy related 5) and ATG7 expression, as well as MAP1LC3B-II production, in a dose-dependent manner concomitantly with reduced SQSTM1 accumulation. Finally, all these Ka-induced autophagy-promoting changes were further reversed by the 3-MA autophagy inhibitor ( and ). This effect was also confirmed by immunofluorescence staining, which showed that the Ka treatment increased the number of vacuoles, as indicated by the endogenous MAP1LC3B-II expression levels (( and S6e)).
Figure 8. Ka induces autophagy to inhibit NLRP3 activation in microglia. (a) The expression of SQSTM1, ATG5, ATG7 and MAP1LC3B induced by Ka in primary mouse microglia. Cells were treated with Ka (20, 30, 40 μM) for 6 h. (b) Densitometric data of SQSTM1, ATG5, ATG7 and M AP1LC3B-II expression using ImageJ. Data are presented as the means ± SEM of 4 independent experiments with repetitions. #P < 0.05 vs. LPS group, as determined by the Student’s t-test; *P < 0.05 and **P < 0.01 vs. the LPS + Ka (40 μM) group, as determined by the Student’s t-test. (c) Effect of Ka on the formation of MAP1LC3B puncta. LPS-primed cells were treated with Ka (40 μM) for an additional 12 h. MAP1LC3B puncta were then analyzed by confocal microscopy. Scale bar: 10 μm. The number of puncta per cell is presented as the means ± SEM of 5 independent experiments with repetitions. #P < 0.05, ##P < 0.01 vs. NC group, *P < 0.05 vs. Ka group, as determined by the Student’s t-test. (d) HEK293T cells were infected with an RFP-GFP-MAP1LC3B adenovirus and were then treated with 40 μM Ka (with or without BafA1 [100 nM] or rapamycin [10 nM] as a positive control for 12 h. Effects of Ka on RFP- and GFP-MAP1LC3B puncta (left panel). Scale bar: 10 μm. The number of RFP- and GFP-MAP1LC3B puncta per cell was counted, and the results are shown in the right panel. The number of puncta per cell is presented as the mean ± SEM of 4 independent experiments with repetitions. #P < 0.05, ##P < 0.01 vs. the NC group; *P < 0.05, **P < 0.01 vs. the Ka group, && P < 0.01 vs. the BafA1 group, as determined by one-way ANOVA, followed by the Holm-Sidak test. (e) MAP1LC3B-II and SQSTM1 levels were analyzed by western blotting of LPS-primed BV2 cells treated with Ka (with or without BafA1) and rapamycin. Data are presented as the means ± SEM of three independent experiments with repetitions. #P < 0.05, ###P < 0.001 vs. the NC group; **P < 0.01, ***P < 0.001 vs. the LPS group. Ka, kaempferol.
![Figure 8. Ka induces autophagy to inhibit NLRP3 activation in microglia. (a) The expression of SQSTM1, ATG5, ATG7 and MAP1LC3B induced by Ka in primary mouse microglia. Cells were treated with Ka (20, 30, 40 μM) for 6 h. (b) Densitometric data of SQSTM1, ATG5, ATG7 and M AP1LC3B-II expression using ImageJ. Data are presented as the means ± SEM of 4 independent experiments with repetitions. #P < 0.05 vs. LPS group, as determined by the Student’s t-test; *P < 0.05 and **P < 0.01 vs. the LPS + Ka (40 μM) group, as determined by the Student’s t-test. (c) Effect of Ka on the formation of MAP1LC3B puncta. LPS-primed cells were treated with Ka (40 μM) for an additional 12 h. MAP1LC3B puncta were then analyzed by confocal microscopy. Scale bar: 10 μm. The number of puncta per cell is presented as the means ± SEM of 5 independent experiments with repetitions. #P < 0.05, ##P < 0.01 vs. NC group, *P < 0.05 vs. Ka group, as determined by the Student’s t-test. (d) HEK293T cells were infected with an RFP-GFP-MAP1LC3B adenovirus and were then treated with 40 μM Ka (with or without BafA1 [100 nM] or rapamycin [10 nM] as a positive control for 12 h. Effects of Ka on RFP- and GFP-MAP1LC3B puncta (left panel). Scale bar: 10 μm. The number of RFP- and GFP-MAP1LC3B puncta per cell was counted, and the results are shown in the right panel. The number of puncta per cell is presented as the mean ± SEM of 4 independent experiments with repetitions. #P < 0.05, ##P < 0.01 vs. the NC group; *P < 0.05, **P < 0.01 vs. the Ka group, && P < 0.01 vs. the BafA1 group, as determined by one-way ANOVA, followed by the Holm-Sidak test. (e) MAP1LC3B-II and SQSTM1 levels were analyzed by western blotting of LPS-primed BV2 cells treated with Ka (with or without BafA1) and rapamycin. Data are presented as the means ± SEM of three independent experiments with repetitions. #P < 0.05, ###P < 0.001 vs. the NC group; **P < 0.01, ***P < 0.001 vs. the LPS group. Ka, kaempferol.](/cms/asset/448f9645-d20e-4d92-ab0d-d063deb4fe35/kaup_a_1596481_f0008_oc.jpg)
Autophagic flux was further monitored in HEK293T cells transduced with a tandem fluorescent-mRFP-GFP-MAP1LC3B-adenovirus, a specific autophagosome formation marker that relies on the differences in GFP and RFP fluorescence under acidic conditions. GFP fluorescence is sensitive to the acidic lysosome lumen conditions, while RFP is relatively stable under acidic conditions. Thus, GFP and RFP signal colocalization (yellow dots) indicates the lack of phagophore or autophagosome fusion with lysosomes, whereas RFP-only signals (red puncta) indicate the presence of autolysosomes. As shown in (), the Ka treatment significantly increased the number of yellow dots per cell, with a concomitant, greater increase in RFP-only MAP1LC3B dots in cells transduced with tandem fluorescence-tagged mRFP-GFP-MAP1LC3B. This autophagy flux promotion capacity was confirmed by SQSTM1 and MAP1LC3B-II protein accumulation analysis in BV2 microglia with both the autophagy flux inhibitor BafA1 and the autophagy promoter rapamycin (()).
Thus, these results suggested that Ka promoted both the initiation and integrity of the autophagic flux, which may underlie its ability to promote autolysosome-mediated NLRP3 protein degradation. Collectively, robust autophagic degradation accounted for inhibitory capacity of Ka on NLRP3 inflammasomes.
Ka-promoted ubiquitination is responsible for NLRP3 degradation
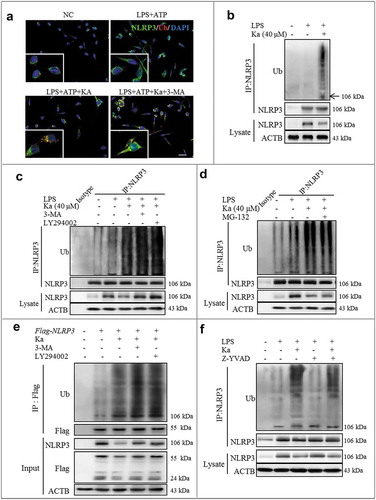
Recent studies have revealed that ubiquitination is a key brake in NLRP3 inflammasome activation [Citation18,Citation21]. Interestingly, based on the above results, we have determined that SQSTM1-related autophagy is involved in Ka-induced NLRP3 protein degradation. Indeed, during the autophagic process, SQSTM1 acts as a receptor protein that links MAP1LC3B with ubiquitin moieties on misfolded proteins [Citation41,Citation42]. Therefore, autophagy mediates the clearance of SQSTM1 along with ubiquitin-modified substrates [Citation43]. Thus, we next investigated the role of Ka in microglia ubiquitination. Consistent with NLRP3 degradation, we found by immunofluorescence analysis that the Ka treatment indeed induced NLRP3 polyubiquitination in BV2 cells ()). Moreover, we immunoprecipitated NLRP3 from BV2 cell lysates in denaturing conditions, suggesting that the Ka-induced high molecular weight NLRP3 species most likely represent polyubiquitinated NLRP3 (()). Ubiquitinated protein can be cleared by both autophagy and proteasome pathways [Citation43,Citation44]. Further studies revealed that the Ka-induced NLRP3 ubiquitination-modified degradation was abolished by 3-MA (( and )) and LY294002 (()), resulting in more ubiquitinated NLRP3 sequestration in the cytosol. In contrast, NLRP3 ubiquitination in Ka-treated cells did not increase further upon the addition of MG-132 (()), suggesting that Ka triggered NLRP3 degradation via autophagy not proteasome-mediated proteolysis. Consistently, the Ka-induced decrease in NLRP3 protein expression in BV2 cells was reversed by 3-MA and LY294002 and was unaffected by MG-132 treatments (( and )). Furthermore, we transfected HEK293T cells with Flag-tagged-NLRP3 plasmids; similarly, Ka markedly reduced the ubiquitinated NLRP3 levels in an autophagy-mediated degenerative manner (()). In addition, the CASP1 deficiency induced by Z-YVAD did not affect Ka-induced NLRP3 ubiquitination (()). Taken together, Ka inhibited NLRP3 activation by promoting the ubiquitinated proteolysis of NLRP3 protein in an autophagy-dependent manner.
Figure 9. Ka-promoted ubiquitination is responsible for NLRP3 degradation. (a) LPS-primed BV2 cells were treated with 40 μM Ka for 5 h, followed by treatment with 5 mM ATP for 30 min. Cells were analyzed by NLRP3 and ubiquitin immunofluorescence. Scale bar: 40 μm. (b) LPS-primed-BV2 cells were treated with Ka (40 µM). Immunoblotting analysis of Ub protein levels in cell lysates immunoprecipitated with NLRP3 antibody. (c) LPS-primed BV2 cells were cultured with 3-MA (5 mM) or LY294002 (10 µM) for 1 h and then treated with Ka (40 μM) for 5 h. Immunoblotting analysis of Ub protein levels in cell lysates immunoprecipitated with NLRP3 antibody. (d) LPS-primed BV2 cells were cultured with MG-132 (10 μM) and then treated with Ka (40 μM) for 5 h. Immunoblotting analysis of Ub proteins in cell lysates immunoprecipitated with NLRP3 antibody. (e) HEK293T cells expressing Flag-NLRP3 were treated with 3-MA (5 mM) or LY294002 (10 µM) for 1 h and then treated with Ka (40 μM) for 5 h. Flag-NLRP3 immunoprecipitate was analyzed for ubiquitination. (f) LPS-primed BV2 cells were cultured with Z-YVAD (10 μM) and then treated with Ka (40 μM) for 5 h. Immunoblotting analysis of Ub proteins in cell lysates immunoprecipitated with NLRP3 antibody.
Ka and autophagy signaling prevent LPS-induced NLRP3 inflammasome-related neurodegeneration in vivo
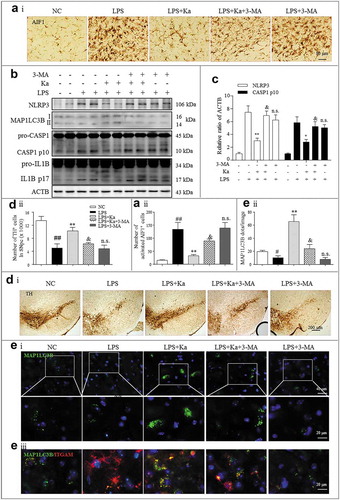
The above results strongly supported autophagy as one of the main mechanisms of Ka-mediated NLRP3 inflammasome inhibition in vitro. We then wondered whether Ka and its mediated autophagic signaling prevent neuroinflammation-induced DA neuron loss in vivo. For confirmation, the autophagy inhibitor 3-MA was used in the murine models of experimental inflammatory PD induced by LPS injections into the SNpc. We found that the ameliorative effects of Ka on murine neuroinflammation (–) and the related TH+ neuronal damage (()) were significantly blocked by 3-MA. This inhibition was closely related to autophagy inhibition and NLRP3 inflammasome activation aggravation in microglia (( and )).
Figure 10. Ka and autophagy signaling prevent LPS-induced NLRP3 inflammasome-related neurodegeneration in vivo. Mice were treated with stereotaxic LPS injections into the SNpc to induce neuroinflammation. Ka (100 mg.kg−1) was administered i.p. daily beginning 3 days before the LPS challenge. 3-MA (10 mg.kg−1) was administered (i.p., 12 h before Ka) daily during the experiment. Mice were sacrificed 7 days after the LPS induction. Values are the means ± SEM of 6 mice per group. (a) Microglia activation was examined by IHC detection of AIF1. (b) The NLRP3, CASP1, IL1B, MAP1LC3B and ACTB protein levels in the midbrain homogenates from the indicated mice were examined by immunoblotting. Statistical data of the NLRP3 and CASP1 expression levels from 6 mice are shown in (c). Data are representative of three independent experiments (means ± SEM). n.s.P > 0.05, *P < 0.05, **P < 0.01 vs. LPS group, as determined by the Student’s t-test; &P < 0.05 vs. LPS + Ka group, as determined by the Student’s t-test. (d) Expression of TH-positive DA neurons was examined by IHC staining of midbrain sections. (e) Formation of MAP1LC3B puncta in ITGAM/CD11b+ microglia in vivo was examined by IHF staining of midbrain sections and then analyzed by confocal microscopy. Scale bar is as indicated. Data in Aii, Dii and Eii are representative of 3 independent experiments (mean ± SEM, n = 4). ns.P > 0.05, #P < 0.05, ##P < 0.01 vs. NC group, **P < 0.01 vs. LPS group,,&P < 0.05 vs. LPS + Ka group, as determined by the Student’s t-test.
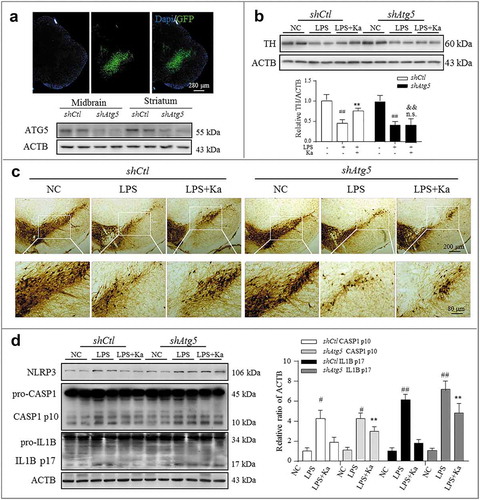
Therefore, we next sought to further confirm the autophagy-mediated anti-inflammatory effect of Ka, which was accomplished by expressing a previously characterized shRNA against Atg5 [Citation44] in microglia together with the AAV-EGFP vector. In preliminary experiments, we observed that transfection of the shRNA against Atg5 (shAtg5) for 2 weeks achieved sufficient GFP expression in microglia and compromised the expression of ATG5 in the SNpc of the injected mice ()). We thus designed our experiment to knockdown Atg5 via transfection at 2 weeks before LPS delivery and Ka treatment, as stated above. We found that the neuroinflammation inhibition and neuroprotective effects of Ka were relatively blunted in shAtg5 mice compared to shCtl controls ((–)), which further supported the contribution of autophagy to these immunomodulatory effects of Ka. Collectively, all these results indicated that Ka and autophagic signaling ameliorated LPS-induced and NLRP3-mediated neuroinflammation.
Figure 11. Atg5 knockdown blunted Ka-conferred neuroprotective effects in vivo. The SNpc of mice were transfected with AAV-EGFP-shRNA against Atg5 or Control (1 μl of 1013 viral genomes μl−1, bilaterally), followed by LPS injury or Ka treatment, as described previously. (a) Atg5 transfection was verified by IHF and knockdown was confirmed using immunoblotting. Nuclei staining of brain sections from mice expressing EGFP/shAtg5 are shown. Atg5 knockdown causes a reduction of ATG5 in both the midbrain and striatum. (b) Western blotting and densitometric analysis of TH in mesencephalon extracts of experimental mice. Data are representative of 3 independent experiments (mean ± SEM). ##P < 0.01 vs. corresponding NC group, n.s. P > 0.05, **P < 0.01 vs. corresponding LPS group, as determined by Student’s t-test. && P < 0.01 vs. shCtl LPS + Ka group by one-way ANOVA, followed by the Holm-Sidak test. (c) TH-positive DA neurons were examined by IHC staining in midbrain sections. Scale bar is as indicated. (d) NLRP3-CASP1 activation in the midbrain was analyzed by immunoblotting, as indicated. Values represent the means ± SEM of 4 mice per group. Data are representative of 3 independent experiments. #P < 0.05, ##P < 0.01 vs. the corresponding NC group, as determined by the Student’s t-test. **P < 0.01 vs. shCtl LPS + Ka group, as determined by one-way ANOVA, followed by the Holm-Sidak test.
Discussion
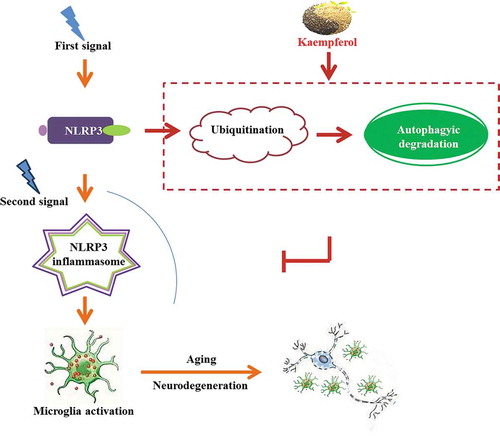
This study identified the small molecule Ka as a key link that allows autophagic signaling to inhibit NLRP3 inflammasome activation. Our results demonstrated that the ubiquitin-autolysosome pathway represents a key regulatory loop through which Ka orchestrates NLRP3 inflammasome activation and cytokine release, thereby focusing autophagy-regulated microglia-mediated immunity on eliminating DAMPs while preventing long-lasting neuroinflammation and neuron damage due to excessive IL1B secretion ().
Figure 12. Schematic diagram: Kaempferol, a naturally derived small molecule, functions as both a ubiquitination and autophagy promoter to degrade and reduce NLRP3 expression, which inhibits microglia activation and, consequently, the neurodegenerative process via NLRP3 inflammation deactivation.
Chronic nonresolving inflammation, including systemic-metabolic inflammation and in situ neuroinflammation, contributes to the initiation, promotion, and progression of NDDs [Citation6,Citation45]. One of the best clinically characterized examples of the association between inflammation and neurodegeneration is the increased incidence of NDD in aging populations [Citation46] and in patients suffering metabolic disorders, which present with the common characteristic of sustained, low-grade inflammation activation [Citation47,Citation48]. Therefore, new anti-inflammatory interventions for preventing inflammation-associated NDDs are desperately needed [Citation45,Citation49]. We report herein that the small molecule Ka protected mice against neurodegeneration by reducing IL1B release from microglia via ubiquitination-autophagy-mediated NLRP3 inflammasome inhibition.
PD is the second-most common NDD and is characterized by the preferential loss of DA neurons in the SNpc and intracellular SNCA aggregate inclusions named Lewy’s body [Citation49]. A large amount of evidence indicates that immune system abnormalities and neuroinflammation sustain and exacerbate DA neuron loss and dopamine deficiency [Citation24,Citation45,Citation50]. NLRP3 inflammasomes have been reported to be involved in the progression of several human diseases including PD [Citation19,Citation45]. In the CNS, NLRP3 inflammasomes are activated by aggregated SNCA, which has been suggested to be directly linked to the pathogenesis of many synucleinopathies, especially in PD [Citation36]. After toll-like receptor stimulation (signaling I), IL1B is translated as an inactive 31-kDa precursor (pro-IL1B) that is then cleaved into its activated 17-kDa form by the NLRP3 inflammasome-activated CASP1 (signaling II). High levels of the proinflammatory cytokine IL1B, secreted by microglia in the CNS, have been detected in both PD patients and experiment animal models and are suggested to correlate with the severity of inflammation and neuronal damage [Citation12,Citation37]. Thus, this mechanism indicates the NLRP3-IL1B axis as a potential therapeutic target for NDDs. Although the NLRP3 inflammasome has been extensively studied, our understanding of its function is elusive [Citation47,Citation51]. For instance, as a defensive reaction, NLRP3-mediated immunity is also responsible for eliminating infectious agents to prevent excessively activated and long-lasting brain inflammation; thus, the role of NLRP3 inflammasomes in acute or chronic NDD is sometimes controversial [Citation45]. Moreover, recently, NLRP3-IL1B targeted-therapeutic efforts in PD turned out to be impracticable or ineffective clinically [Citation12]. However, several lines of data from gene-deleted mouse models have revealed that NLRP3-PYCARD-CASP1-mediated IL1B maturation is essential for MPTP-induced experimental PD, and compared with WT mice, nlrp3−/− mice develop less severe neurodegeneration [Citation24]. Regrettably, these protective effects induced by genetic manipulation will not be attainable in patients for a long time. In contrast, unlike the protections resulting from gene-deletion in mouse models, IL1B neutralization or chemical CASP1 inhibitor treatments have not demonstrated outstanding disease resolution abilities [Citation52], and IL18 and pyroptosis are predicted to continue unabated in these patients. Thus, identifying new mechanisms and proteins that are specific to regulating NLRP3 inflammasome assembly may represent a more effective strategy than genetic manipulation [Citation52]. Athauda, D et al. noted another consideration that may account for these failures: all the interventions are executed behind the pathological changes, since most damage cannot be reversed once it occurs [Citation12]. Therefore, safe and well-tolerated inhibitors of NLRP3-mediated IL1B secretion are urgently needed in clinics to prevent the development and progression of PD and may also serve as a useful prevention option for patients with metabolic inflammation [Citation47].
Ka can decrease cytokine production in vitro by affecting signaling I via inhibiting mitogen-activated protein kinases and AKT/protein kinase B activation [Citation30]. In addition to the effect on signaling I, in the present study, we found that Ka disrupted signaling II and inhibited CASP1 activation, which resulted in reduced IL1B secretion in vivo ((); ( and )) and in vitro ((–)).
Reciprocal interactions between the autophagic system and immune cells play pivotal roles in the pathogenesis of neurodegeneration, metabolic disorders, and aging. Studies have suggested that NLRP3 inflammasome activity is negatively regulated by autophagy. With dysfunctional mitophagy-induced mitochondrial damage, mtROS [Citation51] and autolysosome dysfunction-generated cathepsin B [Citation53] both act as ‘signaling II’ stimuli to active NLRP3 inflammasomes. Here, we showed that Ka-promoted autophagy inactivated NLRP3 inflammasomes and thus ameliorated neuroinflammation and degeneration in mice, which was mostly due to NLRP3-PYCARD-CASP1 complex assembly disruption, resulting from reduced NPRP3 protein levels, instead of reduced ‘signaling II’ stimuli. Our conclusions were based on the following observations: First, the Ka-mediated inhibition of CASP1 activation and IL1B release in microglia was accompanied by the reduced expression of NLRP3 but not of other complex assembly proteins (()). Moreover, this effect was significantly blocked by the autophagy inhibitors 3-MA and BafA1 (( and )) in vitro. Second, the autophagy inhibitor 3-MA markedly reversed the ameliorative effect of Ka on LPS-induced neuroinflammation in mice through inhibiting autophagy (, and )). Finally, the Ka-induced inhibition of IL1B secretion (()) was also blunted by Atg5 knockdown in vivo. These data strongly suggest that Ka-driven autophagy-mediated NLRP3 inflammasome inhibition is responsible for the amelioration of experimental neuroinflammation and inflammation-associated neurodegeneration in mice. Autophagy-regulated NLRP3-dependent inflammation was reversed by both autophagy and lysosome dysfunction [Citation39], which was also demonstrated in our study by using 3-MA and Atg5 silencing. We next found that Ka not only promoted autophagy during the initiation phase but also contributed to autophagic flux integrity (( and )), thereby inhibiting CASP1 activation. However, the detailed molecular mechanisms of the effect of Ka on autophagy and NLRP3 degradation, especially the relation between them, still require further investigation.
Inflammatory substrates can be recognized by ubiquitin ligases, which decorate them with poly-Ub chains. Then, SQSTM1 binds poly-Ub chains through its UBA domain and can direct protein aggregates and organelles bearing such modifications to autophagic clearance [Citation54]. Studies have identified NLRP3 protein sites that can be ubiquitinated. However, the ubiquitin function of NLRP3 has been questioned because NLRP3 deubiquitination is required for NLRP3 inflammasome assembly and activation [Citation39,Citation55]. Subsequent data also demonstrated that both dopamine and bile acid induce NLRP3 ubiquitination via the cAMP-PKA pathway, which is critical for their inhibitory effect on systemic and neuronal inflammation [Citation24,Citation45]. Thus, NLRP3 ubiquitination is important for both the activation and inactivation of NLRP3 inflammasomes at the assembly stage. Collectively, the ubiquitination-modified NLRP3 protein shows different outcomes in different contexts. Moreover a recent study documented that the E3 ubiquitin ligase TRIM31 [Citation55] targets NLRP3 for ubiquitination and proteasomal degradation. In addition, another E3 ubiquitin ligase MARCH7 has been reported in K48-linked ubiquitination and autophagic NLRP3 degradation [Citation24], highlighting the complex tripartite relations among ubiquitination, autophagy, and NLRP3 inflammation. Here, we demonstrated that Ka induced NLRP3 protein ubiquitination (( and )) and resulted in NLRP3 inflammasome deactivation (()). Moreover, ubiquitinated NLRP3 might further undergo autophagy but not proteasomal degradation, as the decreased NLRP3 expression was reversed by the autophagy inhibitors 3-MA, LY294002 and BafA1, but not the proteasome inhibitor MG-132 (() and ( and )). Collectively, our results suggested an inhibitory mechanism for NLRP3 inflammasome activation by the combinatorial regulation of NLRP3 protein by Ka-induced ubiquitination and autophagic degradation.
Another PTM associated with NLRP3 inflammasome transcription independent priming is phosphorylation [Citation39]. As reported, Ser291 phosphorylation mediates PRKAA/PKA-induced ubiquitination, which serves as a critical brake for NLRP3 inflammasome activation in BMDMs [Citation21]. Ka promotes cAMP-PRKAA/PKA activation to maintain energy homeostasis in skeletal myocytes [Citation28], as well as decreases the phosphorylated activation of p90RSK to reduce profibrogenic action in hepatocytes [Citation27]. These findings suggest that Ka can promote or inhibit the phosphorylation of substrates in various kinds of cells via different mechanisms. Thus, we speculate that the reported regulatory function of Ka on phosphorylation may be also involved in and contribute to the Ka-induced ubiquitination of NLRP3, which remains to be further explored.
Dysregulation of the NLRP3 inflammasome is frequently associated with diverse inflammatory, metabolic, neurodegenerative and malignant diseases [Citation45,Citation47]. Therefore, proper control of NLRP3 inflammasome activity is critical for preventing disease development. Besides Parkinsonism, almost all age-related NDDs are linked to both NLRP3 inflammasome activation and autophagy dysfunction [Citation56,Citation57], therefore, it is plausible that insufficient autophagy promotes excessive inflammasome-mediated IL1B production by microglia, which may exacerbate neuronal cell death and inflammation. The aging process itself is linked to elevated low-grade inflammation or neuro-inflammation, characterized by constitutive production of low amounts of IL1B, TNF, and IL6 [Citation7,Citation58]. Thus, based on the observed inhibitory effects of Ka on ubiquitination-autophagy-mediated NLRP3 inflammasomes, we suggested that Ka exhibited multitarget neuroprotective potency and was well tolerated in vivo, which may provide a new option for the treatment and prevention of neuroinflammation and related NDDs.
In conclusion, our results in this study provide strong evidence for the chemopreventive activity of Ka against inflammation-associated neurodegeneration in mice. The mechanisms underlying the activity of Ka involve ubiquitin-autophagy-lysosome pathway-mediated, degradation-dependent NLRP3 inflammasome inactivation during the assembly stage, thus leading to decreased NLRP3-PYCARDCASP1-mediated IL1B secretion from microglia. Our data presented here may help guide decisions regarding the use of Ka as an anti-inflammatory agent in aging populations and in patients with metabolic or systemic inflammation, ultimately reducing the incidence and slowing the progression of NDD.
Methods
Chemicals, reagents
The adenoviral vector that carried Atg5 siRNA was obtained from HANBIO (Shanghai, China). LPS (L-4130, L2630), 3-MA (M-9281), MPTP (M-0896), kaempferol (HPLC> 99.0%, 96,353), nigericin (N-7143), MG-132 (C-2211), penicilin-streptomycin (V900929), and MSU (U-2875) were obtained from Sigma-Aldrich. Fetal bovine serum (10,100,147) and LY294002 (440,202) were obtained from Gibco ®. Lipofectamine 3000 Transfection Reagent (L3000-015) and Proteinase and Phosphatase Inhibitor Mini Tablets (88,668) were obtained from Invitrogen Thermo Fisher Scientific. Pentobarbital sodium (F2002045) was purchased from Shanghai Clinical Research Center. Kaempferol (HPLC> 95%) was purchased from Nanjing Jingzhu Bio-technology Co.,Ltd. PrimeScript™ RT Master Mix (RR036A) was purchased from Takara Bio Nic. Adenosine triphosphate (A8270) was purchased from Beijing solarbio science & technology co.,ltd. ELISA kits for murine IL1B (EM004-96) was purchased from ExCell Bio. Rapamycin (53/23–88-9) was purchased from Gene operation. Bafilomycin A1 (S1413) was purchased from Selleck.cn.
Mice
nlrp3 KO mice (nlrp3−/-, male, 4 months) were obtained from the Laboratory Animal Center of Southeast University (Nanjing, China). These mice were backcrossed for 10 generations on a C57BL/6J inbred background. SNCAA53T-overexpressing [tg(Prnp-SNCA*A53T)83Vle/J] mice (A53Ttg/tg) were purchased from the Model Animal Resource Center (MARC, Nanjing, China). The age-matched littermate WT male mice were used as controls and were purchased from the Laboratory Animal Center of Nanjing Medical University (Nanjing, China). All animals were maintained with free access to pellet food and water under specific pathogen-free conditions. Animals were anesthetized by sodium pentobarbital (40 mg.kg−1, i.p.), followed by blood collection, before perfusion. Animal welfare and experimental procedures were performed in accordance with the Guide for the Care and Use of Laboratory Animals (National Institutes of Health, the United States) and the related ethical regulations of Nanjing Medical University. All efforts were made to minimize the number of animals used and animal suffering.
Cell culture and treatment
The authenticated mouse microglia BV2 cell line and mouse macrophage RAW 264.7 cell line were purchased from the Shanghai Institute of Cell Biology (Shanghai, China) and cultured at 37°C in a 5% (v:v) CO2 atmosphere and used at passages 4 to 14. Primary microglia were obtained from postnatal (P1 to P2) mice. Whole brains were removed, dissected and then mechanically dissociated using gauze to remove the membranes and large blood vessels. Next, the dissected brains were placed in medium supplemented with phosphate-buffered serum, digested with trypsin-EDTA (Gibco, 25200056) and then filtered through a 100-µm filter to obtain a single cell suspension. Subsequently, the cells were plated on poly-L-lysine-precoated cell culture flasks containing Dulbecco’s modified Eagle’s medium (DMEM; Corning, 32016001) supplemented with fetal bovine serum (10% v:v) and penicillin/streptomycin (1% v:v). The cultures were maintained in a humidified chamber (37°C, 5% CO2 incubator). After 7 to 10 days, the microglia were dissociated by shaking the flasks several times, harvested by centrifugation (300 g × 10 min) and then plated on poly-L-lysine-precoated 24-/96-well plates at 5 × 10⁵ cells/ml in complete cell culture medium for subsequent use. For NLRP3 plasmid transfection into HEK293T cells, HEK293T cells were seeded into 6-well plates at 5 × 10⁵ per well in complete cell culture medium. After 24 h, the cells were transfected with plasmids expressing Flag-NLRP3; 48 h later, the cells were treated with the indicated stimuli. The cultured cells were negative for HIV-1, HBV, HCV, mycoplasma, bacteria, yeast, and fungi.
Induction and treatment of MPTP/p PD mouse models
To evaluate the inflammatory reaction in the PD model of MPTP/p-toxicity, eighteen mice were divided into 3 groups (n = 6/group; male, 4 months old). One group was treated with MPTP (30 mg.kg−1, injected every 2 h for a total of 4 times, i.p.) for 24 h to induce the acute MPTP/p PD model. For the subacute MPTP/p-PD model, the second mouse group received 30 mg.kg−1 MPTP (s.c., daily) for 5 days. The third group was treated with saline, as the negative control. At the endpoint, all animals were anesthetized, and plasma was prepared for ELISA. Then, mice were perfused and sectioned, followed by western blotting and IHC staining to assess inflammatory activation.
Stereotaxic surgery and treatment of the LPS-induced PD model
Stereotaxic surgery under sodium pentobarbital anesthesia (40 mg.kg−1, i.p.) was performed as described previously [Citation34,Citation59]. The SNpc of matched 4-month-old nlrp3−/-, shAtg5 and WT control mice were microinjected bilaterally with LPS (Sigma, 0.5 µg in 1 µl of saline, 0.2 µl.min−1) using the following coordinates relative to the bregma: A/P −3.0 mm, R/L ± 1.3 mm, and D/V −4.5 mm. The respective controls were injected with equivalent volumes of saline. To evaluate the effect of LPS on microglia activation, sixteen mice (n = 8/group; male) were perfused and sectioned 1 week after the LPS injection, followed by AIF1 staining to assess microglia activation. To evaluate the effect of Ka on LPS-induced microglia activation, the mice were divided into 3 different dosage groups (n = 8/group; male). In addition, for the pharmacological evaluation of 3-MA, another 2 groups were created (n = 8/group; male). The 3-MA and Ka were dissolved in DMSO (100 mg.ml−1). For the animal injections, the stock solution was diluted with 100 μl of water containing 5% polyethylene glycol 400 (Damas-beta, 41713B) and 5% Tween-80 (Aladdin, T104866) immediately before the injection. The Ka injections (25,50,100 mg.kg−1, a single injection.day−1 during experiments) were started at 3 days prior to the LPS challenge. For the pharmacological evaluation, 3-MA (10 mg.kg−1, i.p.) was injected on the same day but 12 h before the Ka was administered. Then, the animals were anesthetized for perfusion, and the tissues were harvested for the following bioassay.
For the genetic PD model, A53Ttg/tg and matched WT mice (male, 7-month-old) were injected with Ka (100 mg.kg−1, i.p.) daily for 8 weeks. For the MPTP/p-induced PD model, C57BL6 mice (male, 4-month-old) were administered Ka (100 mg.kg−1, i.p.) starting 3 days before and 5 days after the MPTP-induced (30 mg.kg−1, s.c., daily for 5 consecutive days) neurodegeneration. After the Ka treatment, the mice were sacrificed one week later for the indicated bioassays.
Behavioral analyses and unbiased stereology
The protocols for the behavioral analyses were carried out according to a previous report [Citation59]. The total number of TH+ neurons and Nissl+ neurons was quantified by unbiased stereology using the optical fractionator method as described previously [Citation59,Citation60]. For the cell quantification in vivo studies, the number of TH and AIF1-immunoreactive (AIF1+) cells in the SNpc of the midbrain was assessed using an optical fractionator (Stereo Investigator 7, MBF bioscience, Williston, VT, USA) as previously described [Citation32]. Briefly, frozen brains were sectioned at 30 μm and the SNpc regions in the midbrain sections were outlined at low magnification (40×). For the TH immunoreactive (TH+) neurons, the counting frame size was 40 μm×40 μm and the sampling grid size was 80 μm×80 μm. For the AIF1+ microglia, the counting frame size was 50 μm×50 μm and the sampling grid size was 100 μm×100 μm. All stereological analyses were performed under the 200× objective of an Olympus BX52 microscope (Olympus America Inc., Melville, NY, USA). Within one counting frame, positive cells must show both TH and AIF1 staining in the cell body and blue staining in the nuclei to be counted. The sampling scheme was designed to have a coefficient of error (CE) of less than 10% to obtain reliable results. The total number of TH+ neurons and AIF1+ microglia in the entire extent of the SNpc was counted from 4 mouse brains per group. Each brain contained at least 12 serial sections at three intervals. The stereologer was blinded to all genotypes and treatment groups for each experiment.
Histological analysis, IHC, and immunofluorescence
For IHC or immunofluorescence staining, the brain sections were dehydrated with a gradient post fixation. As described in our previous study [Citation32], the sections encompassing the entire SNpc were cut into 30-μm-thick slices with a cryostat (Leica, Model M1950–1–0-0-1-1). Then, the sections were incubated with 0.3% Triton X-100 (Sigma, T9284) in phosphate-buffered saline (135 mM NaCl, 4.7 mM KCl, 10 mM Na2HPO4, 2 mM NaH2PO4, pH 7.4) for 15 min (and then treated with 3% hydrogen peroxide, if needed) and blocked with 5% goat serum (Life Technology, 16,210–064) for 1 h at room temperature. Next, the sections were incubated with the following primary antibodies at 4°C overnight: anti-TH (Sigma, T1299; 1:800), anti-GFAP (Millipore, MAB360; 1:800), anti-AIF1/IBA1 (Wako, 019–1974; 1:1000), anti-ITGAM/CD11b (AbD Serotec, MCA275R; 1:250), anti-NLRP3 (AdipoGen, AG-20B-0014-C100; 1:500), anti-ubiquitin (Abcam, ab7780; 1:250), anti-MAP1LC3B (Cell Signaling Technology, 2775; 1:400), and anti-SNCA (BD-Biosci, 610,787; 1:250). For the immunofluorescence assays, the sections were then washed and incubated with Alexa Fluor 488-conjugated donkey anti-mouse IgG (Invitrogen, A21202; 1:1000), Alexa Fluor 488-conjugated goat anti-rabbit (Invitrogen, A11008; 1:1000), Alexa Fluor 555-conjugated goat anti-rabbit IgG (Invitrogen, 21,432; 1:1000) or Alexa Fluor 555 goat anti-mouse IgG (Invitrogen, 21,422; 1:1000) for 1 h at room temperature. After a final wash step with PBS, the sections were mounted onto glass slides, and ProLong gold anti-fade reagent containing DAPI (Life Technologies, P36931) was applied for visualizing nuclei. For the IHC, the slides were incubated with streptavidin-HRP (Thermo, SA10001; 1:1000) for 40 min and then stained with DAB (Shanghai Gene Company, GK500705) substrate. Slides were observed and images were taken under a confocal microscope (Axiovert LSM510, Carl Zeiss Co., Germany). The immunostaining signals were quantitatively analyzed using the Optical Fractionator method with Microbrightfield Stereo-Investigator software (Stereo Investigator software; Microbrightfield). The average SNCA and NLRP3 intensities were calculated using ImageJ by sampling a 30 × 30 pixel area, and 36 images were captured from six consecutive mesencephalon sections. The values were reported as the average intensity above the background ± SD. -
Western blotting analysis and co-immunoprecipitation
The protocols for western blotting were reported previously [Citation60] The brain tissues and cells were homogenized in RIPA lysis buffer (50 mM Tris, pH 7.4, 150 mM NaCl, 1% NP-40 (Thermo, FNN0021), 0.5% sodium deoxycholate (Sigma, D6750), 0.1% SDS (Sigma, 74255). The amount of total extracted protein was determined by BCATM protein assay kit (Thermo, 23235). A 30-μg protein aliquot of each sample was separated using sodium dodecyl sulfate-polyacrylamide gel electrophoresis (10–12%) and was electrophoretically transferred onto PVDF membranes (Millipore, IPVH00010). The membranes were blocked with 10% nonfat dry milk in Tris-buffered saline (20 mM Tris-HCl, 500 mM NaCl, pH 7.4) with Tween 20 (Aladdin, T104863), and then probed with the following primary antibodies overnight at 4°C: anti-TH (1:1,000; Abcam, ab6211), anti-CASP1 (1:1,000; AdipoGen, AG-20B-0042), anti-IL1B (1:1,000; Sigma, I-3767); anti-CASP1/p10 (sc-514), PYCARD/ACS (sc-22514-R), NLRP1 (sc-166368), AIM2 (sc-137967), NLRP2 (sc-365935), NLRC4 (sc-49395) (all at 1:1,000; Santa Cruz Biotechnology), anti-Ub (1:800; Santa Cruz Biotechnology, c-166553), anti-ACTB (1:2,000; Santa Cruz Biotechnology, sc-47778); anti-NLRP3 (1:1,000; AdipoGen, AG-20B-0014-C100); anti-MAP1LC3B (2775), SQSTM1 (5114), ATG5 (2630) (all at 1:1,000; Cell Signaling Technology); anti-ATG7 (1:1,000; ABGENT, AP1813a); and anti-SNCA (1:1,000; BD-Biosci, 610787). The membranes were next incubated with a horseradish peroxidase-conjugated goat anti-mouse or rabbit IgG secondary antibody (1:2,000; Thermo, 31430 and 31460). Detection was performed using an ImageQuant LAS 4000 mini (Uppsala, Sweden) luminescent image analyzer. The band intensity was quantified using ImageJ software (NIH). Protein levels were determined by normalizing to the level of ACTB and are presented relative to that in the control.
For co-immunoprecipitation, cells were collected and lysed with lysis buffer on ice for 30 min and centrifuged at 21,000 g at 4°C for 15 min. The supernatant (SN) fractions were collected and incubated with 1 μg of appropriate antibody at 4°C overnight and precipitated with protein A/G-agarose beads (Santa Cruz Biotechnology, sc-2003) for another 4 h at 4°C. The beads were washed with the lysis buffer 3 times by centrifugation at 300 g at 4°C. The immunoprecipitated proteins were separated by SDS-PAGE, and western blotting was performed as previously described. The primary antibodies were as follows: anti-Ub (1:500; Santa Cruz Biotechnology, c-166553), anti-NLRP3 (1:1,000; AdipoGen, AG-20B-0014-C100), anti-Flag (1:1,000; Sigma, F1804), and anti-ACTB (1:2,000; Santa Cruz Biotechnology, SC-47,778).
Purification of cell culture SN protein
The cell culture SN protein analysis experiments were carried out as described previously [Citation53]. Briefly, the cell culture SN was collected and centrifuged to remove the dead cells. Then, 500 μL of SN was transferred into new tubes, 500 μL of methanol and 125 μL of chloroform were added, and the tube was vortexed and centrifuged at 21,000 g for 5 min to precipitate the SN proteins. The upper phase was discarded without touching the protein layer, another 500 μL of methanol was added and then the mixture was centrifuged at 21,000 g for 5 min for washing. The SN was removed, and the pellet was dried at 37°C for 5 min. Ultimately, 30 μL of 2× loading buffer was added and vortexed. The samples were boiled and loaded onto 12–15% gels for western blotting analysis. The primary antibodies were as follows: anti-IL1B (1:500; Sigma, I-3767) and anti-CASP1/p10 (1:500; Santa Cruz Biotechnology, c-514).
Cytokine analysis by ELISA
Cultured cell supernatant samples were collected after stimuli. As to in vivo analysis, brain tissues from mice in each group were homogenized with lysis buffer to extract total protein. The homogenate was centrifuged at 21,000 g at 4°C for 30 min. The concentration of IL1B in vivo and in vitro was measured by mouse IL1B ELISA kits (ExCell Bio, EM004-96) according to the manufacturer’s instructions.
Tandem fluorescent-mRFP-GFP-MAP1LC3B-adenovirus transduction of HEK293T cells
HEK293T cells were transfected with a tandem fluorescent-mRFP-GFP-MAP1LC3B adenovirus (HanBio, HB-AP2100001; donated by professor H.H.Y.) that expresses a specific marker of autophagosome formation to detect autophagy, according to the manufacturer’s instructions as reported [Citation61]. Six fields were chosen from 3 different cell preparations. GFP- and mRFP-expressing spots, which were indicated by fluorescent puncta and DAPI-stained nuclei were counted manually. The number of spots per cell was determined by dividing the total number of spots by the number of nuclei in each field.
Sequence-based reagents
Atg5 shRNA was obtained from Hanbio Biotechnology (Shanghai, China) Co., Ltd.,
siRNA Atg5 sequence: AGCCGAAGCCTTTGCTCAATG
shRNA Atg5 sequence:
Topstrand:
AATTCGAGCCGAAGCCTTTGCTCAATGTTCAAGAGACATTGAGCAAAGGCTTCGGCTTTTTTTG
Bottom strand:
GATCCAAAAAAAGCCGAAGCCTTTGCTCAATGTCTCTTGAACATTGAGCAAAGGCTTCGGCTCG
Statistical analysis
All data are presented as the means ± SEM and were collected and analyzed in a blinded manner. Statistical analysis was performed using the Student’s t-test or one-way analysis of variance (ANOVA), followed by the Holm-Sidak test (SigmaPlot 11.0). The tests used are indicated in the figure legends. The ANOVA results were considered significant at P < 0.05. In all studies, ‘n’ indicates the number of samples per group.
PYCARD
Supplemental Material
Download Zip (20.7 MB)Acknowledgments
We thank Dr. Honghong Yao (School of Medicine, Southeast University) for providing the mRFP-GFP-MAP1LC3B-adenovirus and nlrp3−/- mice and for her helpful discussion and guidance. We also thank Dr. Ming Xiao (Nanjing Medical University) for his helpful discussion.This work was supported by the National Natural Science Foundation of China [No.81630099, No.81573403, No.81773706]; The Drug Innovation Major Project [2018ZX09711001-003-007].
Disclosure statement
No potential conflict of interest was reported by the authors.
Supplemental material
Supplementary material data for this article can be accessed here.
Additional information
Funding
Related Research Data
References
- Goldberg EL, Dixit VD. Drivers of age-related inflammation and strategies for healthspan extension. Immunol Rev. 2015;265:63–74. PMID:25879284.
- Poewe W, Seppi K, Tanner CM, et al. Parkinson disease. Nat Rev Dis Primers. 2017;3:17013. PMID:28332488.
- Block ML, Zecca L, Hong J. Microglia-mediated neurotoxicity: uncovering the molecular mechanisms. Nat Rev Neurosci. 2007;8:57–69. PMID: 17180163.
- Pedersen M, Bruunsgaard H, Weis N, et al. Circulating levels of TNF-alpha and IL-6-relation to truncal fat mass and muscle mass in healthy elderly individuals and in patients with type-2 diabetes. Mech Ageing Dev. 2003;124:495–502. PMID:12714258.
- Ferrucci L, Corsi A, Lauretani F, et al. The origins of age-related proinflammatory state. Blood. 2005;105:2294–2299. PMID:15572589.
- Wang L, Zhai Y, Xu L, et al. Metabolic inflammation exacerbates dopaminergic neuronal degeneration in response to acute MPTP challenge in type 2 diabetes mice. Exp Neurol. 2014;251:22–29. PMID: 24220636.
- Zhang G, Li J, Purkayastha S, et al. Hypothalamic programming of systemic ageing involving IKK-β, NF-κB and GnRH. Nature. 2013;497:211–216. PMID: 23636330.
- Zhang Y, Kim MS, Jia B, et al. Hypothalamic stem cells control ageing speed partly through exosomal miRNAs. Nature. 2017;548:52–57. PMID: 28746310.
- Blaylock RL. Parkinson‘s disease: microglial/macrophage-induced immunoexcitotoxicity as a central mechanism of neurodegeneration. Surg Neurol Int. 2017;8:65. PMID:28540131.
- Calabrese V, Santoro A, Monti D, et al. Aging and Parkinson‘s Disease: inflammaging, neuroinflammation and biological remodeling as key factors in pathogenesis. Free Radic Biol Med. 2017;115:80–91. PMID:29080843.
- Guo H, Callaway JB, Ting JP. Inflammasomes: mechanism of action, role in disease, and therapeutics. Nat Med. 2015;21:677–687. PMID:26121197.
- Athauda D, Foltynie T. The ongoing pursuit of neuroprotective therapies in Parkinson disease. Nat Rev Neurol. 2015;11:25–40. PMID:25447485.
- Rider P, Carmi Y, Cohen I. Biologics for targeting inflammatory cytokines, clinical uses, and limitations. Int J Cell Biol. 2016;2016:1–11. PMID: 28083070.
- Rees K, Stowe R, Patel S, et al. Non-steroidal anti-inflammatory drugs as disease-modifying agents for Parkinson‘s disease: evidence from observational studies. Cochrane Database Syst Rev. 2011:D8454. PMID:22071848. DOI:10.1002/14651858.CD008454.pub2.
- Driver JA, Logroscino G, Lu L, et al. Use of non-steroidal anti-inflammatory drugs and risk of Parkinson‘s disease: nested case-control study. BMJ. 2011;342:d198. PMID:21252104.
- Bassani TB, Vital MA, Rauh LK. Neuroinflammation in the pathophysiology of Parkinson‘s disease and therapeutic evidence of anti-inflammatory drugs. Arq Neuropsiquiatr. 2015;73:616–623. PMID:26200058.
- Lamkanfi M, Dixit VM. Mechanisms and functions of inflammasomes. Cell. 2014;157:1013–1022. PMID:24855941.
- Patel MN, Carroll RG, Galván-Peña S, et al. Inflammasome priming in sterile inflammatory disease. Trends Mol Med. 2017;23:165–180. PMID: 28109721.
- Youm YH, Grant RW, McCabe LR, et al. Canonical Nlrp3 inflammasome links systemic low-grade inflammation to functional decline in aging. Cell Metab. 2013;18:519–532. PMID:24093676.
- Lu A, Magupalli VG, Ruan J, et al. Unified polymerization mechanism for the assembly of PYCARD-dependent inflammasomes. Cell. 2014;156:1193–1206. PMID:24630722.
- Guo C, Xie S, Chi Z, et al. Bile acids control inflammation and metabolic disorder through inhibition of NLRP3 inflammasome. Immunity. 2016;45:802–816. PMID: 27692610.
- Guo W, Sun Y, Liu W, et al. Small molecule-driven mitophagy-mediated NLRP3 inflammasome inhibition is responsible for the prevention of colitis-associated cancer. Autophagy. 2014;10:972–985. PMID: 24879148.
- Afonina IS, Zhong Z, Karin M, et al. Limiting inflammation—the negative regulation of NF-κB and the NLRP3 inflammasome. Nat Immunol. 2017;18:861–869. PMID: 28722711.
- Yan Y, Jiang W, Liu L, et al. Dopamine Controls Systemic Inflammation through Inhibition of NLRP3 Inflammasome. Cell. 2015;160:62–73. PMID: 25594175.
- Py BF, Kim MS, Vakifahmetoglu-Norberg H, et al. Deubiquitination of NLRP3 by BRCC3 critically regulates inflammasome activity. Mol Cell. 2013;49:331–338. PMID:23246432.
- Manach C, Scalbert A, Morand C, et al. Polyphenols: food sources and bioavailability. Am J Clin Nutr. 2004;79:727–747. PMID:15113710.
- Morales-Ibanez O, Affò S, Rodrigo-Torres D, et al. Kinase analysis in alcoholic hepatitis identifies p90RSK as a potential mediator of liver fibrogenesis. Gut. 2016;65:840–851. PMID: 25652085. .
- Da-Silva WS, Harney JW, Kim BW, et al. The small polyphenolic molecule kaempferol increases cellular energy expenditure and thyroid hormone activation. Diabetes. 2007;56:767–776. PMID: 17327447.
- Nabavi SF, Sureda A, Dehpour AR, et al. Regulation of autophagy by polyphenols: paving the road for treatment of neurodegeneration. Biotechnol Adv. 2017. PMID: 29221764. DOI:10.1016/j.biotechadv.2017.12.001.
- Park SE, Sapkota K, Kim S, et al. Kaempferol acts through mitogen-activated protein kinases and protein kinase B/AKT to elicit protection in a model of neuroinflammation in BV2 microglial cells. Brit J Pharmacol. 2011;164:1008–1025. PMID: 21449918.
- Franceschi C, Campisi J. Chronic inflammation (inflammaging) and its potential contribution to age-associated diseases. J Gerontol A Biol Sci Med Sci. 2014;69(Suppl 1):S4–9. PMID:24833586.
- Zhou Y, Lu M, Du RH, et al. MicroRNA-7 targets Nod-like receptor protein 3 inflammasome to modulate neuroinflammation in the pathogenesis of Parkinson‘s disease. Mol Neurodegener. 2016;11:28. PMID:27084336.
- Kigerl KA, de Rivero Vaccari JP, Dietrich WD, et al. Pattern recognition receptors and central nervous system repair. Exp Neurol. 2014;258:5–16. PMID: 25017883. .
- Gao HM, Zhang F, Zhou H, et al. Neuroinflammation and alpha-synuclein dysfunction potentiate each other, driving chronic progression of neurodegeneration in a mouse model of Parkinson‘s disease. Environ Health Perspect. 2011;119:807–814. PMID:21245015.
- Wong YC, Krainc D. SNCA toxicity in neurodegeneration: mechanism and therapeutic strategies. Nat Med. 2017;23:1–13. PMID: 28170377. .
- Codolo G, Plotegher N, Pozzobon T, et al. Triggering of inflammasome by aggregated alpha-synuclein, an inflammatory response in synucleinopathies. PLoS One. 2013;8:e55375. PMID:23383169.
- Koprich JB, Kalia LV, Brotchie JM. Animal models of SNCAopathy for Parkinson disease drug development. Nat Rev Neurosci. 2017;18:515–529. PMID: 28747776.
- Di Virgilio F, Dal Ben D, Sarti AC, et al. The P2X7 Receptor in Infection and Inflammation. Immunity. 2017;47:15–31. PMID:28723547.
- Baker PJ, De Nardo D, Moghaddas F, et al. Posttranslational Modification as a Critical Determinant of Cytoplasmic Innate Immune Recognition. Physiol Rev. 2017;97:1165–1209. PMID: 28615462. .
- Klionsky DJ, Cuervo AM, Seglen PO. Methods for monitoring autophagy from yeast to human. Autophagy. 2007;3:181–206. PMID:17224625;PMID: 17224625.
- Cha-Molstad H, Lee SH, Kim JG, et al. Regulation of autophagic proteolysis by the N-recognin SQSTM1/p62 of the N-end rule pathway. Autophagy. 2017:1–6. PMID:29261001. DOI:10.1080/15548627.2017.1415190.
- Cha-Molstad H, Yu JE, Feng Z, et al. p62/SQSTM1/Sequestosome-1 is an N-recognin of the N-end rule pathway which modulates autophagosome biogenesis. Nat Commun. 2017;8:102. PMID:28740232.
- Demishtein A, Fraiberg M, Berko D, et al. SQSTM1/p62-mediated autophagy compensates for loss of proteasome polyubiquitin recruiting capacity. Autophagy. 2017;13:1697–1708. PMID:28792301.
- Lee JA, Gao FB. Inhibition of autophagy induction delays neuronal cell loss caused by dysfunctional ESCRT-III in frontotemporal dementia. J Neurosci. 2009;29:8506–8511. PMID:19571141.
- Mamik MK, Power C. Inflammasomes in neurological diseases: emerging pathogenic and therapeutic concepts. Brain. 2017;140:2273–2285. PMID: 29050380.
- Reeve A, Simcox E, Turnbull D. Ageing and Parkinson‘s disease: why is advancing age the biggest risk factor? Ageing Res Rev. 2014;14:19–30. PMID: 24503004. .
- Prattichizzo F, De Nigris V, Spiga R, et al. Inflammageing and metaflammation: the yin and yang of type 2 diabetes. Ageing Res Rev. 2018;41:1–17. PMID: 29081381.
- Zou YM, Liu J, Tian ZY, et al. Systematic review of the prevalence and incidence of Parkinson‘s disease in the People‘s Republic of China. Neuropsychiatr Dis Treat. 2015;11:1467–1472. PMID:26109861.
- PYCARDherio A, Schwarzschild MA. The epidemiology of Parkinson‘s disease: risk factors and prevention. Lancet Neurol. 2016;15:1257–1272. PMID:27751556.
- Shao W, Zhang SZ, Tang M, et al. Suppression of neuroinflammation by astrocytic dopamine D2 receptors via alphaB-crystallin. Nature. 2013;494:90–94. PMID:23242137.
- Zhong Z, Umemura A, Sanchez-Lopez E, et al. NF-κB Restricts Inflammasome Activation via Elimination of Damaged Mitochondria. Cell. 2016;164:896–910. PMID: 26919428.
- Goldbach-Mansky R, Dailey NJ, Canna SW, et al. Neonatal-onset multisystem inflammatory disease responsive to interleukin-1beta inhibition. N Engl J Med. 2006;355:581–592. PMID:16899778.
- Qiao C, Yin N, Gu HY, et al. Atp13a2 Deficiency Aggravates Astrocyte-Mediated Neuroinflammation via NLRP3 Inflammasome Activation. Cns Neurosci Ther. 2016;22:451–460. PMID:26848562.
- Komatsu M, Kageyama S, Ichimura Y. p62/SQSTM1/A170: physiology and pathology. Pharmacol Res. 2012;66:457–462. PMID:22841931.
- Song H, Liu B, Huai W, et al. The E3 ubiquitin ligase TRIM31 attenuates NLRP3 inflammasome activation by promoting proteasomal degradation of NLRP3. Nat Commun. 2016;7:13727. PMID: 27929086. .
- Labzin LI, Heneka MT, Latz E. Innate Immunity and Neurodegeneration. Annu Rev Med. 2018;69:437–449. PMID:29106805.
- Colonna M, Butovsky O. Microglia Function in the Central Nervous System During Health and Neurodegeneration. Annu Rev Immunol. 2017;35:441–468. PMID:28226226.
- Chung HY, Cesari M, Anton S, et al. Molecular inflammation: underpinnings of aging and age-related diseases. Ageing Res Rev. 2009;8:18–30. PMID:18692159.
- Brichta L, Shin W, Jackson-Lewis V, et al. Identification of neurodegenerative factors using translatome-regulatory network analysis. Nat Neurosci. 2015;18:1325–1333. PMID:26214373.
- Lu M, Sun X, Qiao C, et al. Uncoupling protein 2 deficiency aggravates astrocytic endoplasmic reticulum stress and nod-like receptor protein 3 inflammasome activation. Neurobiol Aging. 2014;35:421–430. PMID: 2404197.
- Huang R, Zhang Y, Han B, et al. Circular RNA HIPK2 regulates astrocyte activation via cooperation of autophagy and ER stress by targeting MIR124-2HG. Autophagy. 2017. PMID: 28786753. DOI:10.1080/15548627.2017.1356975.