
ABSTRACT
Lysosomes influence dynamic cellular processes such as nutrient sensing and transcriptional regulation. To explore novel transcriptional pathways regulated by lysosomes, we performed microarray analysis followed by qPCR validation in a mouse hepatocyte cell line, AML12, treated with bafilomycin A1 (lysosomal v-type H+-translocating ATPase inhibitor). Pathway enrichment analysis revealed significant downregulation of gene sets related to peroxisomal biogenesis and peroxisomal lipid oxidation upon lysosomal inhibition. Mechanistically, pharmacological inhibition of lysosomes as well as genetic knockdown of Tfeb led to downregulation of the peroxisomal master regulator PPARA and its coactivator PPARGC1A/PGC1α. Consistently, ectopic induction of PPARA transcriptional activity rescues the effects of lysosomal inhibition on peroxisomal gene expression. Collectively, our results uncover a novel metabolic regulation of peroxisomes by lysosomes via PPARA-PPARGC1A transcriptional signalling.
Abbreviations
Acox1: acyl-Coenzyme A oxidase 1, palmitoyl; Acot: acyl-CoA thioesterase; ACAA: acetyl-Coenzyme A acyltransferase; ABCD3/PMP70: ATP-binding cassette, sub-family D (ALD), member 3; BafA1: bafilomycin A1; Crot: carnitine O-octanoyltransferase; CTSB: cathepsin B; Decr2: 2-4-dienoyl-Coenzyme A reductase 2, peroxisomal; Ech1: enoyl coenzyme A hydratase 1, peroxisomal; Ehhadh: enoyl-Coenzyme A, hydratase/3-hydroxyacyl Coenzyme A dehydrogenase; FDR: false discovery rate; Hsd17b4: hydroxysteroid (17-beta) dehydrogenase 4; NES: normalized enrichment score; NOM: nominal; Pex: peroxin; PPARA: peroxisome proliferator activated receptor alpha; PPARGC1A: peroxisome proliferator activated receptor, gamma, coactivator 1 alpha; TFEB: transcription factor EB.
Introduction
Lysosomes are the terminal cellular degradation sites where macromolecules such as carbohydrates, lipids, and proteins are catabolized to meet cellular energy needs [Citation1,Citation2]. These catabolic events occur in the highly acidic lumen (pH of ∼4.5–5.0) of the lysosome, and are separated from the cytoplasm by a single lipid bilayer. Maintenance of the acidic environment required for lysosomal internal hydrolytic activities\ requires the activity of a vacuolar H+-ATPase (v-ATPase) that constantly pumps in protons (H+ ions) across its limiting membrane [Citation3]. It appears that lysosomes are not only limited to degradative functions but also may communicate closely with other cellular organelles to maintain metabolic homeostasis. Recent studies have identified a retrograde signalling pathway that extends from lysosomes to the nuclear transcriptional machinery [Citation4]. This lysosome-to-nucleus signalling may be critical for the execution of mitochondrial lipid catabolic programs in the liver [Citation5]. Currently, little is known about other lysosomal signalling mechanisms that enable lysosomes to communicate with various cellular compartments.
In this study, we utilized a genomic approach to uncover the effect of lysosomes on the cellular transcriptome when lysosomal activity was pharmacologically blocked. Surprisingly, pathway analysis of our dataset identified several peroxisomal gene sets that were down-regulated due to lysosomal inhibition. These findings suggested that lysosomes might regulate lipid metabolism and cellular redox maintenance through their actions on peroxisome activity [Citation6]. In particular, we found that inhibition of cellular lysosomal function decreased the expression of genes involved in peroxisomal biogenesis and lipid catabolism through effects on PPARGC1A-PPARA mediated transcription.
Results
To explore the effect of lysosomal inhibition on cellular transcriptome and signalling pathways, mouse hepatic cells AML12 cells were treated with bafilomycin A1 (BafA1). BafA1 increases lysosomal pH by binding to the interface between the transmembrane helices of ATP6V0C/subunit c of the V0 domain of the v-ATPase, preventing helical swivelling and inhibiting the latter’s activity [Citation7]. We initially observed BafA1 inhibition of lysosomal activity via the loss of LysoTracker staining (Figure 1(a)) and reduced activation of CTSB (cathepsin B), a lysosomal protease activated in acidic pH (b,c). We then performed microarray analyses on AML12 cells treated with or without BafA1. Bioinformatics pathway enrichment analysis revealed several gene datasets involved in peroxisome biogenesis, peroxisomal lipid metabolism, and PPARA signalling pathways as significantly down-regulated in cells treated with BafA1 () and Tables S1–S3).
Figure 1. Lysosomal inhibition impairs peroxisomal gene expression. (a) Lysotracker staining of AML12 cells treated with ± BafA1(10 nM/24 h). (b and c) Representative immunoblot and densitometry showing cellular levels of active CTSB± BafA1 (10 nM/24 h). Values are means ±SD (n = 3), *P < 0.05. (d) Gene ontology-KEGG & Reactome Pathway analysis of the genes obtained from AML12 cells ± BafA1 (10 nM/24 h). (e) qRT-PCR validation of peroxisomal genes ± BafA1 (10 nM/24 h) in AML12 cells. Values are means ±SD (n = 3), *P < 0.05. (f and g) Representative immunoblot and densitometry analysis showing cellular levels of active ABCD3 levels ± BafA1 (10 nM/24 h). Values are means ±SD (n = 3), *P < 0.05. (h) Catalase (CAT) activity ± BafA1 (10 nM/24 h) in AML12 cells. Values are means ±SD (n = 5), *P < 0.05. (i and j) Representative immunoblot and densitometry showing cellular levels of PPARA, ACOX1 and CPT1A ±BafA1 (10 nM/24 h). Values are means ±SD (n = 3),*P < 0.05. (k and l) Representative Immunoblot and densitometry showing protein levels of PPARGC1A ±BafA1 (10 nM) for indicated time of treatment. Values are means ±SD (n = 3), *P < 0.05. (m) qRT-PCR results showing the effect of PPARA, PPARGC1A overexpression on peroxisomal gene transcription in the presence of BafA1. Briefly, cells were transfected with 500 ng of PPARA- and/or PPARGC1A-expressing plasmids using Lipofectamine 3000 and after 24 h of transfection BafA1 (10 nM) was added with or without WY14643 (15 µM, PPARA agonist) for the next 24 h before RNA isolation. Values are means ±SD (n = 3), *P < 0.05 between BafA1 vs Control, #P < 0.05 between PPARA/PPARGC1A overexpression vs. BafA1 group. (n) Model for lysosomal inhibition-induced peroxisomal defect. Based on our results we propose that pharmacological inhibition of lysosomes leads to reduced PPARGC1A and PPARA levels in cells. This reduction may explain the observed attenuation in the expression of peroxisomal genes.
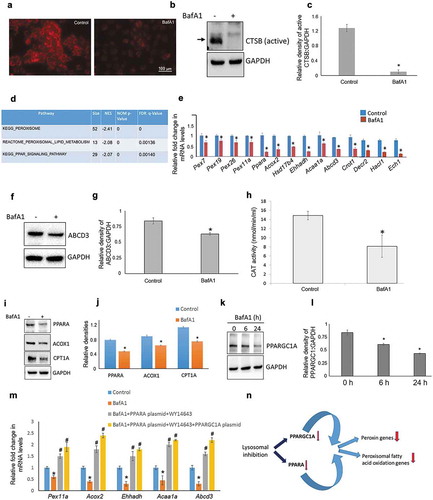
We next validated the genes enriched in the KEGG and Reactome pathways by performing qRT-PCR. Our results showed significant down-regulation of several peroxisomal genes involved in peroxisomal biogenesis (Pex genes) and lipid metabolism, including Ppara itself, in BafA1-treated cells (e)). In concordance, peroxisomal markers such as ABCD3/PMP70 and CAT (catalase) expression and enzyme activity were significantly decreased in BafA1-treated cells (f–h) and S1). These findings strongly suggested a link between lysosomal activity and peroxisomal gene transcription.
Because we observed decreased levels of peroxisomal gene expression after lysosomal inhibition, we examined the protein levels of the master peroxisomal transcription factor, PPARA, and its co-activator, PPARGC1A [Citation8]. We found that PPARA protein expression was lower in cells treated with BafA1, consistent with its decrease in mRNA level (i,j)). We also observed that the expression of several major target genes of PPARA [Citation9,Citation10], such as Acox1 and Cpt1a were decreased at both RNA and protein levels (Figures S2 & i,j)), suggesting that PPARA-transcriptional activity was reduced after lysosomal inhibition. PPARGC1A is a major coactivator of PPARA and is required for peroxisomal biogenesis in both a PPARA-dependent and PPARA-independent manner [Citation11]. Similar to our findings on PPARA, we found a significant time-dependent decrease in PPARGC1A protein expression in BafA1-treated cells (k,l)). Moreover, other lysosomal inhibitors such as concanamycin A (ConA) and chloroquine (CQ) also showed similar inhibitory effects on PPARGC1A levels (Figure S3). Additionally, the effects of BafA1 on peroxisomal gene expression as well as on PPARA and PPARGC1A levels were also mimicked by the knockdown of the master lysosomal biogenesis regulator Transcription factor EB (Tfeb) (Figure S4).
We next examined whether downregulation of PPARGC1A protein by BafA1 was primarily due to its decreased transcription as was observed in the case of Ppara. To our surprise, Ppargc1a mRNA levels increased after 24 h of BafA1 treatment but later decreased after 72 h of treatment (Figure S5(a)). We thus examined whether the downregulation of PPARGC1A protein at early time periods (24 h post BafA1 treatment) was due to increased proteasomal degradation. Indeed, the attenuation in PPARGC1A protein levels in BafA1-treated cells was prevented by the proteasome inhibitor, MG132 (Figure S5(b)). These results suggest that during lysosomal inhibition, the ubiquitin-proteasomal pathway is involved in the early downregulation of PPARGC1A protein; however, the decrease in Ppargc1a mRNA expression may also contribute to the downregulation of PPARGC1A protein at later time periods.
Furthermore, in order to provide direct evidence for the involvement of PPARGC1A-PPARA transcriptional signalling pathway in BafA1 suppression of peroxisomal gene expression we overexpressed PPARA and PPARGC1A (Figure S6). Our results clearly showed that PPARA ligand rescued the suppressive effect of BafA1 on peroxisomal gene transcription in PPARA overexpressing cells, and induced a further increase in their transcription when PPARGC1A was co-expressed in these latter cells (m)).
Discussion
In this study, we uncovered a signalling pathway that links lysosomes to peroxisomes, 2 intracellular organelles that were discovered by de Duve more than 50 y ago [Citation12]. The conventional model considers lysosomes as intracellular organelles that primarily recycle, degrade, and release building blocks such as amino acids and free fatty acids after autophagosome-lysosome fusion. However, lysosomes may be more complex than previously thought, and able to modulate the function of other organelles. In this connection, previous studies showed that lysosomes regulated nuclear transcriptional signalling to increase their own biogenesis as well as lipid catabolism within the cell [Citation4,Citation5].
Here, we found that cellular pathways containing genes involved in peroxisomal biogenesis and peroxisomal lipid metabolism were significantly down-regulated after lysosomal inhibition, including the peroxin (Pex) genes that are involved in peroxisomal biogenesis and growth [Citation13]. Among the peroxins that were decreased by BafA1 treatment, PEX7 and PEX26 are required for the peroxisomal matrix protein import, PEX11A is mainly involved in peroxisome division, and PEX19, which has different functions in yeast and mammals (budding of pre-peroxisomal vesicles and insertion of the peroxisomal membrane proteins in the peroxisomal membrane, respectively [Citation14–Citation17]. We further confirmed that lysosomal inhibition reduced peroxisomal biogenesis by observing decreases in the ABCD3/PMP70 expression [Citation18] and CAT activity [Citation19]. Similarly, gene expression of several peroxisomal lipid-metabolizing enzymes such as Acox1/2, Crot, Acaa1, Hsd17b4, etc. was reduced. Peroxisomal β-oxidation in rodents, especially in the liver, is highly inducible in a PPARA (peroxisome proliferator activated receptor alpha)-dependent manner in animals fed with peroxisome proliferators [Citation20]. Of note, several of the downregulated peroxisomal genes that we observed were PPARA transcriptional targets. Consistent with this observation, we found that PPARA expression also was transcriptionally suppressed in BafA1-treated cells, and likely contributed to the decrease in peroxisomal gene expression and activity. The precise mechanism for how lysosome inhibition represses PPARA expression is not known; however, it is possible that lysosomal degradation of lipids could provide endogenous ligands for PPARA and thus provide an additional layer for regulation of PPARA activity.
PPARGC1A is the major coactivator in PPAR-mediated transcriptional induction of genes involved in lipid oxidation [Citation21]. Expression of PPARGC1A is itself highly regulated at both the transcriptional as well as the post-translational levels [Citation22]. Our results showed that lysosomal inhibition down-regulated PPARGC1A protein expression despite up-regulating its mRNA level during the early time periods. This decrease in PPARGC1A involved proteasomal degradation since proteasomal inhibition completely abolished the effect of lysosomal inhibition. Because lysosomal inhibition may lead to a general increase in proteasomal activity [Citation23], it is not clear whether there is a selective degradation of PPARGC1A in BafA1-treated cells. Interestingly, in contrast to BafA1, Tfeb knockdown significantly decreased Ppargc1a mRNA levels, most likely due to TFEB direct regulation of Ppargc1a expression as shown previously [Citation5,Citation24].
Lysosomes play a key role in regulating peroxisomal number in cells via pexophagy [Citation24]. Moreover, there is observed impairment of peroxisomal function in the lysosomal storage disorders, Neimann-Pick disease and X-linked adrenal leukodystrophy [Citation25]. It is possible that inhibition of peroxisomal biogenesis due to lysosomal inhibition may be an adaptive response to avoid accumulation of peroxisomes under stress, especially when there may be an underlying defect in lysosome-mediated pexophagy as has been shown previously for mitophagy [Citation26–Citation28]. In mammals, very long chain fatty acids and their derivatives are β-oxidized specifically by peroxisomes [Citation6]. In animal models of genes involved in peroxisomal β-oxidation, peroxisomes appear to play a critical role in energy metabolism, since their deficiency can cause hepatic steatosis, steatohepatitis, and liver cancer [Citation20]. Additionally, it is possible that hepatic lipid accumulation caused by pharmacological inhibition of lysosomal activity [Citation29] may be partly due to defective peroxisomal lipid handling.
The novel connection between lysosomal function and peroxisomal gene transcription via PPARGC1A-PPARA nuclear receptor activity (n)) raises the possibility that peroxisomal activity can be enhanced by increasing lysosomal activity. This strategy could potentially be applied to disorders where there is impairment of peroxisomal function such as Neimann-Pick disease and X-linked adrenal leukodystrophy. Finally, PPARGC1A also regulates several other nuclear hormone receptors, so we speculate that lysosomal inhibition could modulate other cellular and metabolic pathways mediated by these other nuclear receptors [Citation30].
Material and methods
Reagents
Bafilomycin A1 (B1793), concanamycin (27689), chloroquine (C6628), MG132 (M8699), WY14643 (C7081) and anti-PPARGC1A antibody (SAB2500781) were purchased from SIGMA-ALDRICH. Anti-PPARA antibody (PA1-822A), LysoTracker Red DND-99 (L7528) and DMEM-F12 (11330057) were from ThermoFisher Scientific. Anti-CPT1A (ab128568), anti-GAPDH (ab9485) and anti-ACOX1 (ab9964) antibodies were from ABCAM. Ppara (NM_011144) plasmid was from ORIGENE, GFP-PGC1 was a gift from Bruce Spiegelman (Addgene, 4).
Cell culture
AML12 (CRL-2254) cells were maintained at 37°C in DMEM-F12 1:1 containing 10% fetal bovine serum, 1x ITS (ThermoFisher Scientific, 41400), 10 nM dexamethasone and 1x penicillin/streptomycin in a 5% CO2 humidified incubator. For siRNA transfection, cells were transfected using RNAiMAX (ThermoFisher Scientific, 13778150) with Tfeb (ThermoFisher Scientific, 4390771) siRNA (10 nM) for 96 h followed by harvesting cells for RNA and protein extraction. Lipofectamine 3000 (ThermoFisher Scientific, L3000001) was used for plasmid transfections.
Microarray and pathway analysis
Gene expression microarray profiling was performed using GeneChip Mouse Gene 2.0 ST Array (Affymatrix) on pool of 3 samples. cRNA generation, labeling and hybridization were performed at Duke-NUS Genome Biology Facility, Duke-NUS Graduate Medical School, Singapore. Gene expression signals were quantile normalized, and differentially expressed genes were identified via analysis of variance, using treatment specific contrasts (Partek Genomics Suite software, version 6.6). Statistical significance of differentially expressed genes was ascertained in terms of the false discovery rate. Pathway enrichment analysis was conducted via the Gene Set Enrichment Analysis tool using a list of KEGG and Reactome pathways extracted from the Molecular Signatures Database. Significance of pathway enrichment was ascertained by permutation testing of gene sets and calculation of the false discovery rate (FDR q value <0.050).
RNA isolation and real-time PCR
Total RNA was isolated and qRT-PCR was performed using the QuantiTect SYBR Green PCR Kit (Qiagen, 204141) in accordance with the manufacturer’s instructions. Primer sequence available upon request.
Western blotting
Cells or tissue samples were lysed using CelLytic™ M Cell Lysis Reagent (Sigma, C2978) and immunobloting was performed as per manufacturer’s guidelines (Bio-Rad Laboratories, USA). Image acquisition was done using ChemiDoc (Bio-Rad ChemiDoc™ MP System, 1708280). Densitometry analysis was performed using ImageJ software (NIH, Bethesda, MD, USA).
LysoTracker staining
Cells were grown on glass coverslips and treated with BafA1 for the required period. Thereafter, cells were incubated with 100 nM of LysoTracker Red DND-99 for 15–30 min at 37°C, followed by three phosphate-buffered saline (PBS) washes, and then immediately observed under a fluorescence microscope.
CAT assay
CAT activity was measured using commercial kit (Catalase Assay Kit; Cayman Chemicals, 707002).
Calculations and statistics
Results are expressed as mean ± SD. The statistical significance of differences (*P < 0.05) was assessed by unpaired student t-test when comparing different groups.
Supplemental Material
Download MS Word (986.1 KB)Acknowledgments
The authors thank their funding agencies, National Medical Research Council, Singapore, grants NMRC/CSA/0054/2013 to Paul M. Yen. This work was supported by NMRC/BNIG/2025/2014, Singapore and the Wellcome Trust/DBT India Alliance Fellowship [IA/I/16/2/502691] awarded to Rohit A. Sinha.
Disclosure statement
No potential conflict of interest was reported by the authors.
Supplementary materials
Supplementary materials data can be accessed here.
Additional information
Funding
References
- de Duve C. The lysosome turns fifty. Nat Cell Biol. 2005 Sep;7(9):847–849. PubMed PMID: 16136179.
- Mony VK, Benjamin S, O’Rourke EJ. A lysosome-centered view of nutrient homeostasis. Autophagy. 2016;12(4):619–631. PubMed PMID: 27050453; PubMed Central PMCID: PMCPMC4836021. eng.
- Colacurcio DJ, Nixon RA. Disorders of lysosomal acidification-The emerging role of v-ATPase in aging and neurodegenerative disease. Ageing Res Rev. 2016 Dec;32:75–88. PubMed PMID: 27197071; PubMed Central PMCID: PMCPMC5112157. eng.
- Settembre C, Zoncu R, Medina DL, et al. A lysosome-to-nucleus signalling mechanism senses and regulates the lysosome via mTOR and TFEB. Embo J. 2012 Mar 7;31(5):1095–1108. PubMed PMID: 22343943; PubMed Central PMCID: PMCPMC3298007.
- Settembre C, De Cegli R, Mansueto G, et al. TFEB controls cellular lipid metabolism through a starvation-induced autoregulatory loop. Nat Cell Biol. 2013 Jun;15(6):647–658. PubMed PMID: 23604321; PubMed Central PMCID: PMCPMC3699877. eng.
- Lodhi IJ, Semenkovich CF. Peroxisomes: a nexus for lipid metabolism and cellular signaling. Cell Metab. 2014 Mar 4;19(3):380–392. PubMed PMID: 24508507; PubMed Central PMCID: PMCPMC3951609.
- Oda K, Nishimura Y, Ikehara Y, et al. Bafilomycin A1 inhibits the targeting of lysosomal acid hydrolases in cultured hepatocytes. Biochem Biophys Res Commun. 1991 Jul 15;178(1):369–377. PubMed PMID: 2069575.
- Schrader M, Bonekamp NA, Islinger M. Fission and proliferation of peroxisomes. Biochim Biophys Acta. 2012 Sep;1822(9):1343–1357. PubMed PMID: 22240198.
- Mandard S, Muller M, Kersten S. Peroxisome proliferator-activated receptor alpha target genes. Cell Mol Life Sci. 2004 Feb;61(4):393–416. PubMed PMID: 14999402.
- Rakhshandehroo M, Knoch B, Müller M, et al. Peroxisome proliferator-activated receptor alpha target genes. PPAR Res. 2010;2010:1–20. PubMed PMID: 20936127; PubMed Central PMCID: PMCPMC2948931.
- Bagattin A, Hugendubler L, Mueller E. Transcriptional coactivator PGC-1alpha promotes peroxisomal remodeling and biogenesis. Proc Natl Acad Sci U S A. 2010 Nov 23;107(47):20376–20381. PubMed PMID: 21059926; PubMed Central PMCID: PMCPMC2996647. eng.
- Bowers WE. Christian de Duve and the discovery of lysosomes and peroxisomes. Trends Cell Biol. 1998 Aug;8(8):330–333. PubMed PMID: 9704410; eng.
- Eckert JH, Erdmann R. Peroxisome biogenesis. Rev Physiol Biochem Pharmacol. 2003;147:75–121. PubMed PMID: 12687401.
- Agrawal G, Fassas SN, Xia Z-J, et al. Distinct requirements for intra-ER sorting and budding of peroxisomal membrane proteins from the ER. J Cell Biol. 2016 Feb 1;212(3):335–348. PubMed PMID: 26833788; PubMed Central PMCID: PMCPMC4748575.
- Koch J, Pranjic K, Huber A, et al. PEX11 family members are membrane elongation factors that coordinate peroxisome proliferation and maintenance. J Cell Sci. 2010 Oct 1;123(Pt 19):3389–3400. PubMed PMID: 20826455.
- Rodrigues TA, Grou CP, Azevedo JE. Revisiting the intraperoxisomal pathway of mammalian PEX7. Sci Rep. 2015 Jul 3;5:11806. PubMed PMID: 26138649; PubMed Central PMCID: PMCPMC4490337.
- Weller S, Cajigas I, Morrell J, et al. Alternative splicing suggests extended function of PEX26 in peroxisome biogenesis. Am J Hum Genet. 2005 Jun;76(6):987–1007. PubMed PMID: 15858711; PubMed Central PMCID: PMCPMC1196456.
- Kamijo K, Taketani S, Yokota S, et al. The 70-kDa peroxisomal membrane protein is a member of the Mdr (P-glycoprotein)-related ATP-binding protein superfamily. J Biol Chem. 1990 Mar 15;265(8):4534–4540. PubMed PMID: 1968461.
- Beier K. Light microscopic morphometric analysis of peroxisomes by automatic image analysis: advantages of immunostaining over the alkaline DAB method. J Histochem Cytochem. 1992 Jan;40(1):115–121. PubMed PMID: 1370307.
- Reddy JK, Hashimoto T. Peroxisomal beta-oxidation and peroxisome proliferator-activated receptor alpha: an adaptive metabolic system. Annu Rev Nutr. 2001;21:193–230. PubMed PMID: 11375435.
- Vega RB, Huss JM, Kelly DP. The coactivator PGC-1 cooperates with peroxisome proliferator-activated receptor alpha in transcriptional control of nuclear genes encoding mitochondrial fatty acid oxidation enzymes. Mol Cell Biol. 2000 Mar;20(5):1868–1876. PubMed PMID: 10669761; PubMed Central PMCID: PMCPMC85369.
- Fernandez-Marcos PJ, Auwerx J. Regulation of PGC-1alpha, a nodal regulator of mitochondrial biogenesis. Am J Clin Nutr. 2011 Apr;93(4):884S–90. PubMed PMID: 21289221; PubMed Central PMCID: PMCPMC3057551.
- Wang XJ, Yu J, Wong SH, et al. A novel crosstalk between two major protein degradation systems: regulation of proteasomal activity by autophagy. Autophagy. 2013 Oct;9(10):1500–1508. PubMed PMID: 23934082.
- Honsho M, Yamashita S, Fujiki Y. Peroxisome homeostasis: mechanisms of division and selective degradation of peroxisomes in mammals. Biochim Biophys Acta. 2016 May;1863(5):984–991. PubMed PMID: 26434997.
- Schedin S, Sindelar PJ, Pentchev P, et al. Peroxisomal impairment in Niemann-Pick type C disease. J Biol Chem. 1997 Mar 7;272(10):6245–6251. PubMed PMID: 9045641; eng.
- Scott I, Webster BR, Chan CK, et al. GCN5-like protein 1 (GCN5L1) controls mitochondrial content through coordinated regulation of mitochondrial biogenesis and mitophagy. J Biol Chem. 2014 Jan 31;289(5):2864–2872. PubMed PMID: 24356961; PubMed Central PMCID: PMCPMC3908418.
- Sinha RA, Singh BK, Zhou J, et al. Thyroid hormone induction of mitochondrial activity is coupled to mitophagy via ROS-AMPK-ULK1 signaling. Autophagy. 2015;11(8):1341–1357. PubMed PMID: 26103054; PubMed Central PMCID: PMCPMC4590606.
- Lesmana R, Sinha RA, Singh BK, et al. Thyroid hormone stimulation of autophagy is essential for mitochondrial biogenesis and activity in skeletal muscle. Endocrinology. 2016 Jan;157(1):23–38. PubMed PMID: 26562261.
- Fredman P, Klinghardt GW, Nilsson O, et al. Lipid accumulation in liver, spleen, lungs and kidneys of miniature-pigs after chloroquine treatment. Biochem J. 1982 Mar 1;201(3):581–588. PubMed PMID: 7092813; PubMed Central PMCID: PMCPMC1163684.
- Sinha RA, Singh BK, Yen PM. Reciprocal crosstalk between autophagic and endocrine signaling in metabolic homeostasis. Endocr Rev. 2017 Feb 1;38(1):69–102. PubMed PMID: 27901588.