
ABSTRACT
The non-receptor tyrosine kinase SRC is a key mediator of cellular protumorigenic signals. SRC is aberrantly over-expressed and activated in more than 80% of colorectal cancer (CRC) patients, therefore regulation of its stability and activity is essential. Here, we report a significant down regulation of SNX10 (sorting nexin 10) in human CRC tissues, which is closely related to tumor differentiation, TNM stage, lymph node metastasis and survival period. SNX10 deficiency in normal and neoplastic colorectal epithelial cells promotes initiation and progression of CRC in mice. SNX10 controls SRC levels by mediating autophagosome-lysosome fusion and SRC recruitment for autophagic degradation. These mechanisms ensure proper controlling of the activities of SRC-STAT3 and SRC-CTNNB1 signaling pathways by up-regulating SNX10 expression under stress conditions. These findings suggest that SNX10 acts as a tumor suppressor in CRC and it could be a potential therapeutic target for future development.
Abbreviations: ACTB: actin beta; ATG5: autophagy related 5; ATG12: autophagy related 12; CQ: chloroquine; CRC: colorectal cancer; CTNNB1: catenin beta 1; EBSS: Earle’s balanced salt solution; KO: knockout; LAMP1: lysosomal associated membrane protein 1; LAMP2: lysosomal associated membrane protein 2; MAP1LC3: microtubule associated protein 1 light chain 3; MKI67: marker of proliferation Ki-67; mRNA: messenger RNA; PX: phox homology; RT-qPCR: real time quantitative polymerase chain reaction; siRNA: small interfering RNA; SNX10: sorting nexin 10; SQSTM1: sequestosome 1; SRC: SRC proto-oncogene, non-receptor tyrosine kinase; STAT3: signal transducer and activator of transcription 3; WT: wild type.
Introduction
Colorectal cancer (CRC) is a leading cause for cancer deaths due to its poor survival outcome in advanced stages, and its incidence is increasing rapidly in both developed and developing countries [Citation1]. Therefore, clarification of the mechanisms underlying CRC tumorigenesis and progression is essential for developing new therapeutic agents. Various factors including hereditary components, predisposing mutations, inflammation and diet were reported to drive the development of CRC [Citation2]. SRC is a member of the super-family of non-receptor protein tyrosine kinases, activated by receptors of growth hormone, cytokines and adipokines. It is aberrantly over-expressed and activated in more than 80% of human CRC and closely related to its progression [Citation3]. Activating mutations of SRC are rare in CRC patients, which suggest activated SRC as a more likely mediator of cellular protumorigenic signals [Citation4–Citation6]. SRC can activate STAT3 signaling, which is a key factor in determining the fate of intestinal epithelial cells (IECs) in colitis and colitis-associated cancer (CAC) [Citation7–Citation9]. Importantly, SRC is required for CTNNB1/β-Catenin nuclear localization and transcriptional activity through tyrosine 654 phosphorylation [Citation10–Citation12]. Therefore, inhibition of SRC is considered as a promising approach for CRC treatment.
SNX10 (sorting nexin 10) belongs to the large SNX family that contains conserved PX-domain through which SNXs bind to the specific phosphorylated phosphatidylinositols (PIs) present in the cell membranes and regulate protein sorting, trafficking and endosomal homeostasis [Citation13]. SNX10 interacts with V-ATPase and has a critical role in osteoclast functions, macrophage polarization and endosomal homeostasis [Citation14–Citation16]. Our recent study demonstrated promotion of colorectal tumorigenesis by global snx10 knockout (KO), which increases chaperone mediated autophagy degradation of CDKN1A/p21Cip/WAF1 [Citation17]. However, the precise role and mechanisms of SNX10 in IECs during CRC tumorigenesis remain unknown. In the present study, we analyzed the expression levels and clinical significance of SNX10 in CRC patients, and investigated the impact of SNX10 on initiation and progression of CRC by using intestinal epithelium-specific snx10 conditional KO mice. Furthermore, we explored the possible role of SNX10 in mediating cross-talk between two protumorigenic signaling pathways (SRC-STAT3 and SRC-CTNNB1) and macroautophagy/autophagy.
Results
SNX10 is downregulated in human CRC tissues and closely related to clinicopathological factors
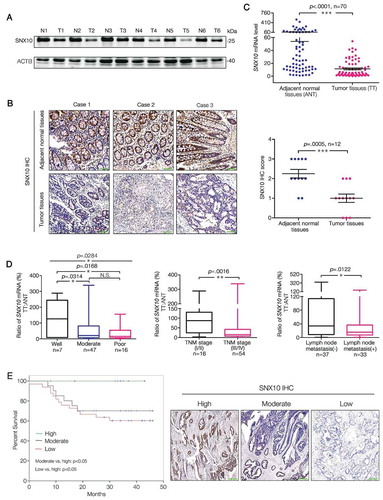
At first, we analyzed SNX10 protein levels in tumor (T) and paired adjacent normal (ANT) tissues of primary CRC patients. Interestingly, SNX10 protein () and mRNA levels were dramatically decreased in tumor tissues () from 70 primary CRC patients, which was also found in our previous study [Citation17]. Correlation between clinicopathological factors and the ratio of SNX10 mRNA level in tumor tissues (TT) to adjacent normal tissues (ANT) from 70 CRC patients was summarized in Table S1. The ratio of SNX10 mRNA was significantly correlated with tumor differentiation, TNM stage and lymph node metastasis but not with distant metastasis despite an observed decrease in this ratio ( and Table S1). Increasing the cases of distant metastasis may bring statistical difference. No significant correlation was found between the ratio of SNX10 mRNA and other clinicalpathological variables including gender, age, and size and location of the tumors (Table S1). Interestingly, CRC patients with lower expression of SNX10 in tumor tissues were found to have worse cancer-specific survival rate (). These data demonstrate a critical role for SNX10 in CRC development.
Figure 1. SNX10 is down regulated in tumor tissues of CRC patients and closely related to clinicopathological factors. (A and B) Representative immunoblots and IHC images of SNX10 in tumor tissues (T) and paired adjacent normal tissues (ANT; N) of CRC patients. Scale bar in (B): 100 μm. (C) SNX10 mRNA levels in TT and paired ANT from 70 CRC patients were measured using RT-qPCR. (D) The ratio of SNX10 mRNA level in TT to paired ANT was calculated, and its clinical correlations with clinicopathological factors were analyzed. (E) The Kaplan-Meier survival curve of 70 CRC patients grouped based on the levels of SNX10 expression in tumor tissues. Survival analysis was performed using log-rank test. Right panel: Representative IHC images of SNX10 in tumor tissues. Scale bar: 100 μm. Data are represented as mean ± SEM (B, C) or median with upper/lower quartile and maximum/minimum values (D). NS, not significant; *, p < 0.05; **, p < 0.01; ***, p < 0.001; by 2-tailed, unpaired t-test.
SNX10 deficiency protects against colitis but enhances tumor growth by activating STAT3 in colorectal epithelial cells
To further explore the impact of SNX10 on CRC development, we established Vil1-cre+Snx10fl/fl (hereafter referred to as snx10-cKO mice), and Vil1-cre−Snx10fl/fl mice (hereafter referred to as control mice) (Figure S1(A)). In the colorectal epithelium of snx10-cKO mice, Snx10 mRNA and protein levels were almost (but not all) abolished (Figure S1(A-C)). As expected, snx10-cKO mice had a significant increase in number and size of tumors after CRC induction by azoxymethane (AOM) and dextran sulfate sodium (DSS) (). The tumor load, which represents a sum of diameters of all tumors in a given mouse, was significantly increased in snx10-cKO mice compared to the controls (Figure S1(D)). Moreover, snx10-cKO CRC mice show a poor survival rate (Figure S1(E)). Since AOM and DSS induced mouse model is characterized as colitis-induced CRC, our data suggest intestinal epithelium specific SNX10 deficiency could enhance colorectal tumor growth in vivo. Inflammation plays a critical role in CRC development, and influences all the stages (initiation, progression and metastasis) of CRC pathogenesis [Citation2]. Therefore, we investigated the acute colitis model induced by a single 5 days course of DSS treatment [Citation18]. Unexpectedly, after AOM and DSS treatment, snx10-cKO mice exhibited decrease in weight loss, less reduction of colon length, lower degree of mucosal damage, and decreased incidence of ulceration (, Figure S1(F-G)), which are typical phenotypes of low level inflammatory response. Correspondingly, pro-inflammatory (Il1b, Il6, Il11, Tnf, and Ptgs2) genes were significantly down-regulated in colonic mucosa of snx10-cKO mice (). Thus, the enhanced tumor growth in snx10-cKO mice is not due to increased inflammation, but possibly by the activation of downstream pathways that are important in CRC tumorigenic functions.
Figure 2. SNX10 deficiency protects against colitis but enhances tumor growth due to increased STAT3 activation in colorectal epithelial cells. (A) From left to right: Representative photograph of tumors in colorectum of control and snx10-cKO CRC mice; Representative H&E images of CRC tissues from control and snx10-cKO mice; Tumor size and number were measured (n = 8). Scale bar: 200 μm. (B) Left panel: Weight loss of mice was measured daily and expressed as the average percentage of initial body weight (n = 10). Middle panel: Length of colons from control and snx10-cKO mice was measured at day 15 of the CAC model. Right panel: Representative H&E images of colon inflammation of control and snx10-cKO mice at day 15. Scale bar: 500 μm. (C) Relative cytokine mRNA levels in colorectal epithelium from control and snx10-cKO mice at day 0 and day 15 (n = 10). (D) Representative immunoblots of the indicated proteins in colorectal epithelium at the indicated times. (E and F) Representative IHC images of p-STAT3 and MKI67 in colorectum at day 0 and day 15 from control and snx10-cKO mice. Scale bar: 500 μm. Data are represented as mean ± SEM. NS, not significant; *, p < 0.05; **, p < 0.01; ***, p < 0.001; by 2-tailed, unpaired t-test.
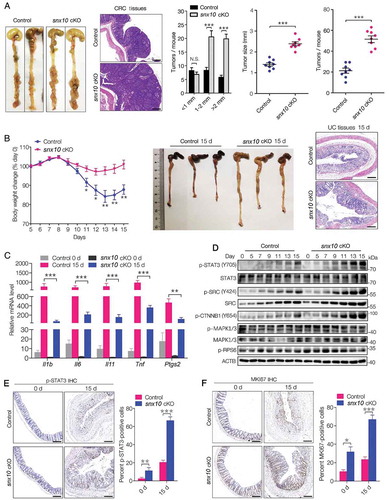
Since IL6 and IL11 are STAT3 activators, it is reasonable to speculate decreased STAT3 activation in pre-malignant IECs of snx10-cKO mice. However, contrary to our expectations, we observed an increase in STAT3 activation within snx10 knockout IECs at 7–15 days after induction of colitis (), a time period considered to be critical for the initiation of tumorigenesis [Citation18]. STAT3 target genes, Birc5, Bcl2, Mcl1 and Bcl2l1, were also highly up-regulated in snx10-cKO mice (Figure S1(H)). Immunohistochemical analysis of MKI67 revealed hyperproliferation of colonic epithelium in snx10-cKO mice (). Taken together, these data suggest enhanced tumor growth in snx10-cKO mice is due to increased epithelial cell proliferation and survival, despite the accompanying decrease in inflammatory response, a paradoxical disconnection as reported earlier [Citation2,Citation18].
Growth factors and oncogenic tyrosine kinases, like SRC can also activate STAT3 [Citation19]. Unlike cytokine induced transient activation of STAT3, SRC mediated STAT3 activation is constitutive and persistent [Citation19]. Interestingly, pan-SRC and active SRC (p-SRC) were highly upregulated in snx10-cKO mice (). Importantly, SRC is required for CTNNB1 nuclear localization and transcriptional activity by Y654 phosphorylation that is uniquely phosphorylated by an active-SRC in mammalian cells [Citation10–Citation12]. As expected, p-CTNNB1 (Y654) was highly up-regulated in snx10-cKO mice (). By contrast, activation of several other signaling pathway mediators like RPS6KB/S6K (ribosomal protein S6 kinase) and MAPK/ERK, remained unchanged (). The alteration of SRC-mediated STAT3 and CTNNB1 activation provides a molecular explanation for the stimulative effects of SNX10 deficiency during initiation of CRC.
SNX10 deficiency enhances the activation of src-mediated STAT3 and CTNNB1 signaling in tumors and promotes colon cancer cell proliferation and survival
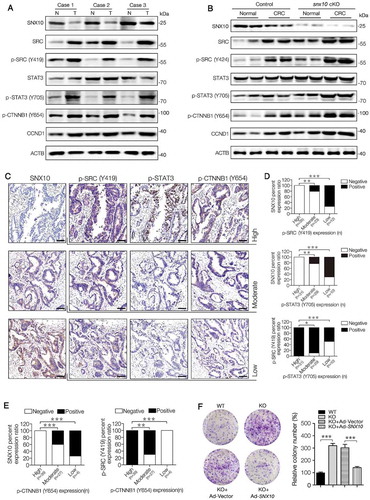
To explore whether SNX10 is continuously influencing CRC progression after tumor initiation, we further investigated the activation of SRC-mediated STAT3 and CTNNB1 in tumors. The levels of pan-SRC, active-SRC (p-SRC), p-STAT3 (Y705), p-CTNNB1 (Y654) and CCND1 (cyclin D1) proteins, as well as STAT3 and CTNNB1 target genes, were highly up-regulated both in human and mouse CRC tissues (,). These results suggest a high level activation of SRC-mediated STAT3 and CTNNB1 in CRC tissues. In snx10-cKO mice, a further enhancement in the activation of SRC-mediated STAT3 and CTNNB1 was observed (,, Figure S2(A-C)). Active-SRC, p-STAT3 (Y705) and p-CTNNB1 (Y654) were more frequently expressed in human CRC tissues having lower SNX10 level, whereas p-STAT3 (Y705) and p-CTNNB1 (Y654) were more frequently expressed in CRC tissues having higher active-SRC level (–). Interestingly, abolished up-regulation of STAT3 and CTNNB1 target genes in SNX10 knockout Caco-2 and HCT116 cells by SRC silencing was observed (Figure S2(D-E)). These results suggest accumulation of SRC is mainly responsible for SNX10 deficiency enhanced STAT3 and CTNNB1 protumorigenic signals in CRC tissues. As a next step, we explored the effects of SNX10 knockout on the proliferation and survival of colon cancer cells. As expected, SNX10 deficiency promoted Caco-2, HCT116 and HT29 cell colony formation and proliferation, which could be partially reversed by reintroduction of SNX10 gene (, Figure S3(A-B)). Similar results were found in trypan blue staining and cell viability assays (Figure S3(C-E)). These data demonstrate promotion of proliferation and survival of colon cancer cells by SNX10 deficiency.
Figure 3. SNX10 deficiency enhances the activation of SRC-mediated STAT3 and CTNNB1 signaling in tumors and promotes colon cancer cell proliferation and survival. (A) Representative immunoblots of indicated proteins in tumor tissues (T) and paired adjacent normal tissues (N) of CRC patients. (B) Representative immunoblots of indicated proteins in normal colorectal epithelium and CRC tissues from control and snx10-cKO mice. (C–E) Representative IHC images of SNX10, p-SRC (Y419), p-STAT3 (Y705) and p-CTNNB1 (Y654) in human CRC tissues, and the clinical relevance of the expression of indicated proteins in human CRC tissues. Scale bar: 100 μm. (F) The colony-forming ability of WT, SNX10 knockout Caco-2 cells and SNX10 knockout Caco-2 cells infected with Ad-vector or Ad-SNX10. Right panel: Quantification of colony numbers. Data are represented as mean ± SEM. *, p < 0.05; **, p < 0.01; ***, p < 0.001; by Fisher’s exact test (D and E) and 2-tailed, unpaired t-test (F).
Impaired autophagic degradation of SRC is responsible for SNX10 deficiency induced accumulation and over-activation of SRC
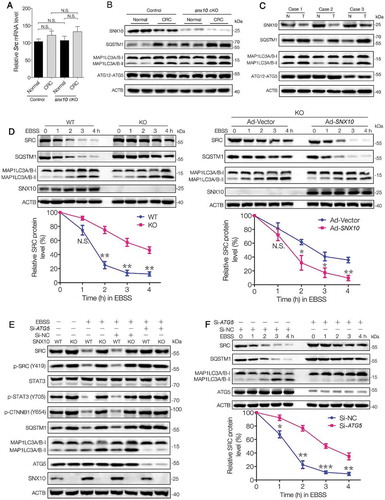
It is worth noting that there was no difference in Src mRNA levels between control and snx10-cKO mice (), indicating a post-transcriptional regulation mechanism underlying snx10 knockout-induced accumulation of SRC. Interestingly, MAP1LC3-II and SQSTM1/p62 were significantly upregulated in snx10-cKO mice (). Similarly, increased levels of MAP1LC3-II and SQSTM1 also were found in human CRC tissues, which exhibited a reduced SNX10 level (). These findings suggest SNX10 deficiency can lead to impaired autophagic degradation of SRC. To confirm this hypothesis, wild type (WT) and SNX10 knockout colon cancer cells, including Caco-2, HCT116 and HT29 were treated with EBSS at indicated time points. As expected, SNX10 knockout cells had a sluggish autophagic degradation of SRC, resulting in its prolonged half-life, which was partially reversed by reintroduction of SNX10 gene (, Figure S4(A-B)). Blockage of autophagic process by ATG5 silencing mimicked the effects of SNX10 knockout on SRC degradation, and also abolished EBSS-induced SRC reduction in WT cells (, Figure S4(D-E)). The levels of p-STAT3 (Y705) and p-CTNNB1 (Y654) correspond to the changes of SRC and active-SRC, while, no difference in SRC mRNA level was observed between WT and SNX10 knockout cells (Figure S4(C-E)). The half-life of SRC protein under starvation was also prolonged by ATG5 silencing in Caco-2 cells (). Taken together, these data demonstrate the importance of SNX10 deficiency in impairing autophagic degradation of SRC and in enhancing SRC-mediated signaling of STAT3 and CTNNB1.
Figure 4. Impaired autophagic degradation of SRC is responsible for the accumulation and overactivation of SRC caused by SNX10 deficiency. (A and B) Src mRNA and the indicated proteins levels in normal colorectal epithelium and CRC tissues from control and snx10-cKO mice were measured by RT-qPCR and immunoblot. (C) Representative immunoblots of indicated proteins in tumor tissues (T) and paired adjacent normal tissues (N) from CRC patients. (D) WT and SNX10 knockout Caco-2 cells and SNX10 knockout Caco-2 cells infected with Ad-Vector or Ad-SNX10 were subjected to EBSS for the indicated duration and then harvested for immunoblotting analysis. SRC levels were quantified by densitometry (Lower panel). (E) WT and SNX10 knockout Caco-2 cells transfected with non-targeting siRNA (Si-NC) or ATG5-siRNA (Si-ATG5) were treated with EBSS for 6 h, followed by immunoblotting experiment. (F) Caco-2 cells transfected with non-targeting siRNA (Si-NC) or ATG5-siRNA (Si-ATG5) were subjected to starvation for the indicated duration and harvested for immunoblotting analysis. SRC levels were quantified (Lower panel). Data are represented as mean ± SEM. NS, not significant; *, p < 0.05; **, p < 0.01; ***, p < 0.001; by 2-tailed, unpaired t-test.
SNX10 interacts with SRC and recruits it to autophagosomes for degradation
The above data reveals a crucial role of SNX10 in regulating SRC autophagic degradation. We next asked the question whether SNX10 is involved in the recruitment of SRC to autophagosomes. Flag-tagged SNX10 plasmid was constructed and transfected into HCT116 cells followed by immunoprecipitation. Interestingly, we found endogenous SRC and active-SRC, but not SQSTM1 or MAP1LC3 were pulled down by Flag-tagged SNX10 (), and this interaction was significantly increased under starvation conditions (, Figure S5(A-B)). Co-localization of SNX10 and SRC further supported this interaction hypothesis ().
Figure 5. SNX10 interacts with SRC and recruits it to autophagosomes for degradation. (A) Cell lysates of SNX10-Flag transfected HCT116 cells were subjected to immunoprecipitation. (B) Cell lysates of SNX10-Flag transfected HCT116 cells treated with or without EBSS for 3 h were subjected to immunoprecipitation. (C) HCT116 cells expressing GFP-SNX10 were treated with or without EBSS for 3 h, followed by confocal imaging analysis. Scale bar: 5 μm. Colocalization of GFP-SNX10 and SRC were quantified. (D) Left panel: Lysates of Flag-tagged full-length SNX10 or its different truncated mutants transfected HCT116 cells were subjected to immunoprecipitation. Right panel: Lysates of MYC-tagged full-length SRC or its different truncated mutants transfected HCT116 cells were subjected to immunoprecipitation. (E) Total and autophagosome-associated proteins from WT and SNX10 knockout HCT116 cells treated with or without EBSS for 3 h were isolated and subjected to immunoblotting analysis. SRC and p-SRC were quantified by densitometry (right panel). (F) WT and SNX10 knockout HCT116 cells were treated with or without EBSS for 3 h, followed by confocal imaging analysis. Scale bar: 10 μm. Right panel: Internalized SRC and colocalized MAP1LC3 and SRC were quantified. Data are obtained by assessing at least 200 cells from three independent experiments (C and F) and represented as mean ±SEM. NS, not significant; *, p < 0.05; **, p < 0.01; ***, p < 0.001; by 2-tailed, unpaired t-test (C, E, F).
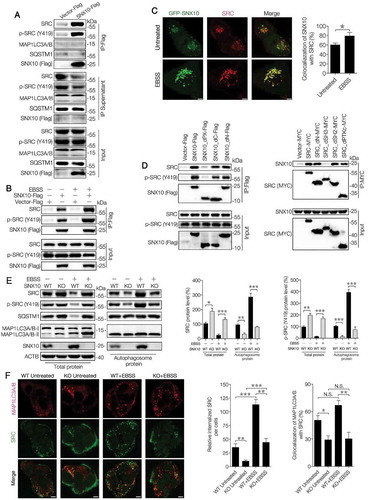
To investigate which region is responsible for the interaction of SNX10 with SRC and active-SRC, deletion mutagenesis was done (Figure S5(C-D)). Deletion of PX domain, but not C or N terminus region of SNX10 abolished the interactions of SNX10 with SRC, whereas deletion of SH3 domain, but not others, could abolish the interactions of SRC with SNX10 (). A significant decrease in autophagosome-associated SRC and active-SRC levels in SNX10 knockout cells (both basal and EBSS conditions) was observed (, Figure S5(E-F)). Unlike SRC and active-SRC, the autophagosome-associated SQSTM1 and MAP1LC3-II had no significant differences between WT and SNX10 knockout cells. On the other hand, total SNX10 and autophagosome-associated SNX10 were significantly increased in starved WT cells (, Figure S5(E-F)). SNX10 deficiency has diminished both the amount and intensity of intracellular punctate localized SRC and a reduced co-localization of SRC and MAP1LC3 was observed in SNX10 knockout cells (). These results further support SNX10 involvement in the recruitment of SRC to autophagosomes.
Autophagy induction upregulates SNX10, which is required for autophagosome-lysosome fusion
In order to study the possible role of SNX10 in mediating autophagy, HCT116, Caco-2 and HT29 cells were treated with EBSS or MTOR kinase inhibitor, PP242 for different time periods. As expected, MAP1LC3-II was increased in a time-dependent manner along with a decreased level of SQSTM1, indicating an activated autophagy process (). Interestingly, SNX10 was found to be increased during autophagy induction in a time-dependent manner similar to MAP1LC3-II (, Figure S6(A-B)). RT-qPCR analysis confirmed that the increased SNX10 protein level was transcriptionally up-regulated by EBSS or PP242 treatment (). Blockage of autophagic process by ATG5 silencing has abolished the up-regulation of EBSS or PP242 induced SNX10 (Figure S6(C)), which suggests autophagy-dependent regulation of SNX10 expression. The reduced expression of SNX10 in ATG5 knockdown cells after EBSS or PP242 is on the transcriptional level (Figure S6(D)). Besides, we have also observed an increase in LAMP1 but not LAMP2 expression in HCT116 cells treated with EBSS or PP242 (, Figure S6(A)). When the last stage of autophagy was blocked by chloroquine (CQ), both MAP1LC3-II and SQSTM1 were markedly accumulated (Figure S6(E)). SNX10 was mostly co-localized with endogenous MAP1LC3 punctate in starved HCT116 cells, and CQ treatment caused a ring-like structure of SNX10 encircling MAP1LC3 (Figure S6(F)). The up-regulation of MAP1LC3-II and SQSTM1 under basal conditions in SNX10 knockout cells was exacerbated after EBSS or PP242 treatment, which was abolished by CQ treatment (, Figure S7(A-B)) or reintroduction of SNX10 gene (Figure S7(C)).
Figure 6. SNX10 is up-regulated during autophagy induction and required for autophagosome-lysosome fusion. (A) HCT116 cells were treated with EBSS or PP242 (1 μM) for 0, 1, 2, 3 or 4 h, followed by immunoblotting analysis. (B) HCT116 cells were treated with EBSS or PP242 (1 μM) for 3 h and SNX10 mRNA level was determined by RT-qPCR. (C) Representative immunoblots of indicated proteins in WT and SNX10 knockout HCT116 cells at 3 h following exposure to EBSS or PP242 (1 μM), with or without CQ (50 μM) treatment. (D) WT and SNX10 knockout HCT116 cells 72 h after infection of StubRFP-SensGFP-MAP1LC3 lentivirus were treated with EBSS and/or CQ (50 μM) for 3 h, then autophagic flux was examined. Scale bar: 10 μm. (E) Intensity of MAP1LC3 punctate in (D) was analyzed. (F) Autophagosomes in starved WT and SNX10 knockout HCT116 cells were analyzed using transmission electron microscope. The arrows indicate double- or multi-membrane autophagosomes. Scale bars, 1 μm. Right panel: Quantification of at least 100 cells from three independent experiments. Data are represented as mean ± SEM. NS, not significant; **, p < 0.01; ***, p < 0.001; by 2-tailed, unpaired t-test.
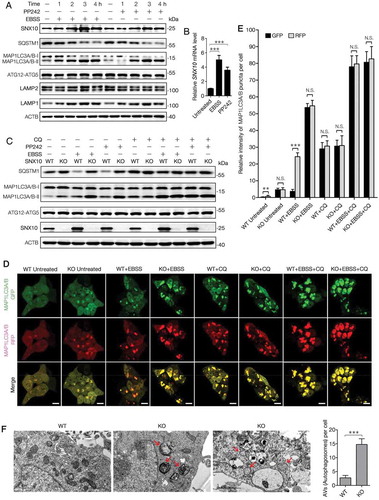
In order to investigate whether SNX10 deficiency blocked the fusion of autophagosomes and lysosomes, autophagic flux was monitored by tandem fluorescent-tagged MAP1LC3 based on different pH stability conditions of GFP and RFP fluorescent proteins. As shown in ,E, in starved WT cells, the intensity of RFP was stronger than that of GFP, and most of MAP1LC3 punctate were nearly red; while in SNX10 knockout cells, the intensity of GFP was similar to RFP and approximately 100% of MAP1LC3 punctate were yellow (merging of green and red signals) and massively accumulated in cytoplasm, suggesting an impaired autophagic flux. Similarly, there was no difference in fluorescence intensity between WT and SNX10 knockout cells after CQ treatment. The impaired fusion of autophagosomes and lysosomes in SNX10 knockout cells was directly confirmed by LysoTracker labeling method (Figure S7(D)). In addition, transmission electron microscopy was used to observe the ultramicrostructure of starved WT and SNX10 knockout HCT116 cells. Remarkably, numerous double- or multi-membrane autophagosomes were found in starved SNX10 knockout cells (), which further confirms the impaired fusion of autophagosomes and lysosomes in SNX10 knockout cells. Taken together, these findings strongly suggest that SNX10 is essential for the fusion of autophagosomes and lysosomes.
The PX-domain and C terminus of SNX10 are critical for its function in autophagy-lysosomal pathway
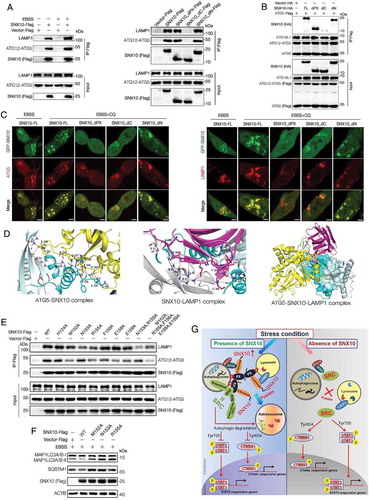
To further understand the mechanisms of SNX10 in mediating autophagosome-lysosome fusion, HCT116 cells transfected with SNX10-Flag were maintained in basal or starvation conditions, followed by immunoprecipitation. Interestingly, ATG12–ATG5 conjugate and LAMP1 were pulled down. This interaction was enhanced by EBSS-induced autophagy, which was abolished by the deletion of C terminus but not PX-domain or N terminus of SNX10 (). The interaction of SNX10 with LAMP1 was also found in our previous study [Citation17]. Accordingly, ATG5-Flag could not pull down C terminus deleted SNX10 (). An intensive co-localization of GFP-SNX10 with ATG5 or LAMP1 was observed and CQ treatment resulted in enlarged and massive vacuole formation of these proteins, along with an increased colocalization between SNX10 and ATG5 or SNX10 and LAMP1 (Figure S8(A-B)). Previous studies have reported that ATG12–ATG5 conjugate on the surface of autophagosomes is involved in the fusion of autophagosomes and lysosomes [Citation20]. Besides, LAMP1 is a transmembrane protein that is also involved in autophagosomes-lysosomes fusion [Citation21]. These results demonstrate SNX10 may mediate fusion of autophagosome and lysosome occurs via ATG12–ATG5 conjugate and LAMP1.
Figure 7. Both PX-domain and C-terminus of SNX10 are critical for its function in autophagy-lysosomal pathway. (A) Left panel: Lysates of SNX10-Flag transfected HCT116 cells treated with or without EBSS for 3 h were subjected to immunoprecipitation analysis. Right panel: Lysates of Flag-tagged full-length SNX10 or its different truncated mutants transfected HCT116 cells were subjected to immunoprecipitation analysis. (B) HCT116 cells were co-transfected with Flag-tagged ATG5 and HA-tagged different lengths of SNX10. Whole cell lysates were subjected to immunoprecipitation analysis. (C) HCT116 cells were transfected with GFP-tagged full-length SNX10 or its different truncated mutants, followed by EBSS and/or CQ (50 μM) treatment for 3 h. Antibodies were used to detect endogenous ATG5 or LAMP1. Scale bar: 5 μm. (D) Cartoon model of ATG5-SNX10-LAMP1 complex. SNX10 dimer is pale cyan and shows two extending helices; the PXe domain is cyan; ATG5 is yellow; LAMP1 is magenta. Crucial amino acid numbers in ATG5-SNX10 and SNX10-LAMP1 complex were marked. Hydrogen bonds and salt bridges formed among these amino acids were depicted as red dash lines. A part of the crystal surface structure of ATG5-SNX10-LAMP1 complex was shown. (E) Pull-down assay of ATG12-ATG5 and LAMP1 by Flag-tagged WT SNX10 or its different point mutants. (F) HCT116 cells transfected with SNX10 point mutants (M152A or N153A or R155A) plasmids were treated with EBSS for 3 h, followed by immunoblotting analysis. (G) Proposed mechanisms for SNX10 in integrating autolysosomal formation and SRC targeted autophagic degradation to control SRC and downstream STAT3 and CTNNB1 signaling activation cascade.
LAMP1 and autophagosome-associated ATG12–ATG5 conjugate were decreased in SNX10 knockout cells (Figure S8(C)). Moreover, over-expression of full length SNX10 has obviously decreased SQSTM1, while increasing LAMP1 levels in total proteins. At the same time, the autophagosome-associated ATG12–ATG5 conjugate was increased by SNX10 overexpression (Figure S8(D)), indicating an increased autophagosome-lysosome fusion. Similar results were also observed in cells over-expressed with N terminus depleted SNX10, however, cells transfected with PX-domain or C terminus depleted SNX10 showed effects similar to SNX10 deficiency (Figure S8(D)). These results were confirmed by immunofluorescence staining of HCT116 cells transfected with GFP-tagged full-length SNX10 or its different truncated mutants ().
In order to investigate which amino acids in the C terminus of SNX10 are crucial for the interactions between SNX10 and ATG5 or SNX10 and LAMP1, protein-protein docking analyses were conducted. Three-dimensional structures of SNX10, ATG5 and LAMP1 () confirmed the interactions of SNX10 with ATG5 and LAMP1. Hydrogen bonds and salt bridges formed by the residues including His124, Met152, Arg155, Phe156, Glu158 and Glu159 in the C terminus of SNX10 are critical for the interactions of SNX10 and ATG5, whereas Asn153 and Arg155 in the C terminus of SNX10 are important for SNX10 and LAMP1 interactions (). To further determine which amino acid is important for the interactions between SNX10 and ATG5 or SNX10 and LAMP1, we used site-directed mutagenesis to generate point mutants of SNX10 (Figure S9(A)). SNX10-ATG5 interactions were diminished when amino acids at 152, 155, 156, 158 or 159 were mutated and the interactions were almost abolished when the above amino acids were simultaneously mutated. Both the amino acids at positions 153 and 155 were found to be crucial for SNX10-LAMP1 interactions (). In order to further confirm that the interactions of SNX10 with ATG12–ATG5 conjugate and LAMP1 are needed for the observed effect of SNX10 on autophagosome-lysosome fusion, SNX10 plasmids containing point mutants that impair the interactions with ATG12–ATG5 conjugate as well as LAMP1 were transfected into HCT116 cells. As shown in , HCT116 cells transfected with SNX10 point mutants (M152A or N153A or R155A) were suffered with impaired autophagosome-lysosome fusion. Previous studies on crystal structure of human SNX10 revealed that SNX10 is able to form dimers [Citation22], and the dimerization of zebrafish SNX25 is mediated by the PX-domain [Citation23]. In our study, SNX10 interacts with itself through PX-domain (Figure S9(B-C)), suggesting SNX10 could form dimers or polymers via PX-domain in our system.
As shown in , SNX10 serves as an adapter protein to integrate autolysosome formation and autophagosome recruitment of SRC for autophagic degradation, thereby controlling the activation of SRC-mediated STAT3 and CTNNB1 signaling pathways. SNX10 deficiency is not only diminishing the transport of SRC into autophagosomes but also impairs autolysosome formation, resulting in the inhibition of autophagic degradation of SRC. This could cause SRC accumulation and overactivation of STAT3 and CTNNB1 protumorigenic signals, which in turn further promotes initiation and progression of CRC.
Discussion
Several mechanisms were reported earlier that are involved in the modulation of SRC signaling, including phosphorylation, ubiquitination and degradation [Citation24–Citation26]. Previous studies have shown that autophagy promotes active-SRC degradation through ubiquitination-induced aggregation and CBL/c-Cbl- mediated recruitment when PTK2/FAK signaling is defective, and thereby sustain mouse squamous cancer cell viability [Citation25]. Our present study revealed that autophagy is negatively regulating SRC signal by promoting pan-SRC (including active-SRC) degradation in CRC through SNX10-dependent pathway. This conclusion is supported by the data from CRC patients showing higher SRC frequency in tumor tissues having low SNX10 expression, defective autophagic process and worse cancer-specific survival. Importantly, we demonstrate control of SRC level by SNX10 through integrating two critical steps in the autophagic degradation process: one is the autophagosome recruitment of SRC and another is at autophagosome-lysosome fusion stage. These novel mechanisms can ensure controlled activity of SRC-mediated STAT3 and CTNNB1 signaling pathways through upregulation of SNX10 expression under stress conditions. While, SNX10 loss, for example in colonic carcinoma according to our current data, inhibits the autophagic degradation of SRC by interfering with both the autophagosome recruitment of SRC and the autophagosome-lysosome fusion. This results in SRC accumulation and overactivation of STAT3 and CTNNB1 signaling pathways, which in turn promotes initiation and progression of CRC. Currently, the mechanisms underlying reduced levels of SNX10 in human CRC tissues are being searched in our laboratory and hopefully will be reported soon.
STAT3 plays a critical role in cytokine signaling pathways as well as in cell proliferation and apoptosis through multiple ligands-mediated phosphorylation cascade [Citation27]. In addition to the receptor tyrosine kinases, IL6, IL11 and IL10 families, STAT3 can also be activated by non-receptor tyrosine kinases, such as SRC [Citation7–Citation9]. Persistent and aberrant activation of STAT3 is invariably associated with inflammation and cancer. Emerging evidences have shown that STAT3 is an oncogenic transcription factor, which promotes direct initiation of CRC by providing a transcriptional node for cancer cell-autonomous initiation of a tumor-promoting gene signature associated with survival, proliferation and angiogenesis [Citation28]. stat3 knockout in intestinal epithelium prevents tumor initiation and progression in a mouse model of colitis-associated cancer (CAC) [Citation28]. In our study, we found an aberrant activation of STAT3 in normal and neoplastic colorectal epithelial cells and tumor tissues with an accumulation of SRC. Indeed an impairment of SRC expression within colon cancer cells results in the repressive expression of STAT3 target genes, suggesting SNX10 deficiency induced CRC initiation and progression is possibly implemented through SRC-STAT3 signaling pathway.
Aberrantly increased CTNNB1 transcriptional activity, usually due to the mutations in the APC (APC regulator of WNT signaling pathway) gene, is known to be the main cause of human CRC [Citation29]. However, loss of APC function appears to be necessary, but not sufficient for human CRC tumorigenicity. Other protumorigenic signals, in addition to APC mutations, were suggested to be required for initiation and progression of CRC. Understanding the source of these additional protumorigenic signals promoting the initiation and progression of CRC will allow development of more effective approaches to treat CRC.
Y654-phosphorylated CTNNB1 has a greatly reduced affinity for CDH1/E-cadherin, which could be released from the cell membrane and translocate into nucleus with an increased affinity for TATA-binding protein, leading to more efficient transcriptional activation of target genes [Citation30,Citation31]. It is worth noting that Y654 of CTNNB1 is uniquely phosphorylated by the activated SRC in mammalian cells [Citation10–Citation12]. Blockage of CTNNB1 Y654 phosphorylation using SRC kinase inhibitors in the colon of APC deficient mice prevented the expression of WNT target genes [Citation12]. Widely overexpressed and activated SRC in CRC suggests a need for tight controlling of the activity and stability of SRC, and development of drugs targeting SRC is now an attractive approach for CRC prevention and treatment.
Recently, great attention has been focused on macroautophagy and CMA, which have been implicated in CRC tumorigenesis and progression [Citation32]. Although the functions of macroautophagy and CMA are distinct and non-redundant, they can still compensate for each other to sustain cell survival. Blockage of macroautophagy results in compensatory activation of CMA [Citation33,Citation34]. Cancer cells might take advantage of this cross-talk to keep their own survival [Citation35]. In our previous study [Citation17], by snx10 conventional knockout mice, we demonstrated that SNX10 deficiency overactivated CMA that accelerated CDKN1A/p21Cip1/Waf1 degradation, further promoting tumorigenesis and progression of CRC. In the present study, intestinal epithelium-specific snx10-cKO mice were used to illuminate a new role of SNX10 in mediating autolysosome formation and its impact on colorectal cancer initiation and progression through inhibiting SRC autophagic degradation. These results suggest SNX10 may act as a tumor suppressor in tumorigenesis and progression of CRC through mediating cross-talk between macroautophagy and CMA, and plays an important role in maintaining a balance between macroautophagy and CMA.
In order to illuminate the precise role of SNX10 in the initiation of CRC, intestinal epithelium-specific snx10-cKO mice were used. Although the two observed effects of SNX10 on autophagy (autophagosome recruitment of SRC and autophagosome-lysosome fusion) is based on measuring autophagy in cultured cells in response to EBSS or PP242, the results from CRC tissues of snx10-cKO mice as well as the tissues from colorectal cancer patients, actually showed consistent changes of SRC, p-SRC, SQSTM1 and MAP1LC3-II proteins, suggesting that SNX10 loss in colorectal epithelium is (at least partially) responsible for the impaired autophagic degradation pathway and the accompanying impaired autophagic degradation of SRC. Previous studies have shown that active SRC could be degraded via autophagy pathway, and thereby sustain mouse squamous cancer cell viability [Citation25], which supports the importance of SNX10-mediated autophagic degradation of SRC in CRC. Recently, it has been reported that autophagy has a dominant role in the death of epithelial cells during crisis, loss of autophagy function in epithelial cells is required for the initiation of cancer [Citation36], which also supports our finding showing the significance of autophagic degradation pathway mediated by SNX10 in the initiation of CRC.
Autophagy includes two consecutive stages: formation of autophagosomes and the maturation or degradation stage. Previous studies published on the molecular mechanisms of autophagy have mainly focused on the formation of autophagosomes in which most of the autophagy-related genes identified so far play critical roles. Among autophagy-related proteins, ATG5 is constantly conjugated to ATG12, which interacts with ATG16 and induces its oligomerization to form a ~ 800 kd complex. This complex is essential for autophagosome formation in mammals [Citation37]. Interestingly, recent studies found that ATG12–ATG5 conjugate is also involved in autophagosomes maturation through its interactions with TECPR1, indicating an important role for ATG12–ATG5 conjugate in the later stage of autophagy [Citation20]. In our study, under normal conditions, oligomeric SNX10 is docked on the outer autophagosome-lysosome membrane through binding of the PIs with PX-domain. This tethers autophagosomes to lysosomes via interactions of its C terminus with ATG12–ATG5 conjugate and LAMP1, which drives the actual fusion event to form autolysosomes. Both PX-domain and C terminus of SNX10 are critical for its function in autophagy-lysosomal pathway. Under stress conditions, SNX10 is upregulated, and the binding of SNX10 with ATG12–ATG5 conjugate and LAMP1 is enhanced, resulting in increased autophagic degradation. This regulatory mechanism is distinguished from other reported mechanisms by its ‘Double Security’ binding of autophagosomes and lysosomes. Deletion of either PX-domain or C terminus of SNX10 abolished the formation of autolysosomes, suggesting PX-PIs, ATG12–ATG5-SNX10 and SNX10-LAMP1 interactions are essential for the fusion of autophagosomes to lysosomes.
Consistent with the results from snx10-cKO mice, human CRC tissues which had lower level of SNX10 showed high expression of the membrane-bound MAP1LC3-II and SQSTM1, indicating an inhibitory autophagic degradation. This finding was also observed by other groups [Citation38,Citation39]. However, our current data cannot prove the increased levels of MAP1LC3-II and SQSTM1 is depended on the reduction of SNX10 in human CRC, but only showed the changes that can been logically explained by our proposed action mechanism. Further study is needed, however, to further address the precise role of SNX10 in human CRC.
In conclusion, we found an association between reduction of SNX10 in human CRC tissues and tumor differentiation, TNM stage, lymph node metastasis, malignant progress and survival rate from CRC. We verified the tumor suppressive role of SNX10 by using intestinal epithelium specific conditional knockout mice. We further demonstrate an essential role for SNX10 in determining intestinal epithelial cell fate during CRC genesis, and provide precise mechanisms for controlling SRC-mediated signaling pathways. These results provide an unequivocal evidence for SNX10 as a therapeutic target for treating CRC. Development of chemical modifiers capable of upregulating SNX10 could be quite useful as anti-CRC therapeutics in the near future.
Materials and methods
Antibodies and reagents
The following primary antibodies were used: anti-SNX10 (Santa Cruz Biotechnology, sc-104657; Novus Biologicals, NBP2-45894 and NBP1-86456; Abcam, ab115890), anti-ACTB (Cell Signaling Technology, 12262), anti-SRC (Cell Signaling Technology, 2109), anti-p-SRC (Y416) (Cell Signaling Technology, 6943), anti-p-CTNNB1 (Y654) (Santa Cruz Biotechnology, sc-57533), anti-STAT3 (Cell Signaling Technology, 9139), anti-p-STAT3 (Y705) (Cell Signaling Technology, 9145), anti-CCND1 (Cell Signaling Technology, 2978), anti-SQSTM1 (Cell Signaling Technology, 5114), anti-MAP1LC3 (Cell Signaling Technology, 12,741 and 83,506), anti-ATG5 (Cell Signaling Technology, 12,994; Abcam, ab108327), anti-ATG16L1 (Cell Signaling Technology, 8089), anti-Flag (Cell Signaling Technology, 14,793), anti-LAMP1 (Millipore Sigma, AB2971), anti-LAMP2 (GeneTex, GTX30881), anti-HA (Cell Signaling Technology, 3724) and anti-MYC (Cell Signaling Technology, 2276) antibodies. Chemical reagents used are as follows: Dextran sulfate sodium (MP Biomeicals, 02160110), azoxymethane (Sigma-Aldrich, A5486), Earle’s balanced salt solution (Sigma-Aldrich, E2888), PP242 (Sigma-Aldrich, P0037), chloroquine (Sigma-Aldrich, C6628) and dimethylsulfoxide (Sigma-Aldrich, D2650). Biological reagents used are as follows: MTT (Sigma-Aldrich, M5655), 0.4% trypan blue solution (Gibco, 15250061), McCoy’s 5A medium (Gibco, 12330–031), minimum essential medium (Gibco, 11090081), glutamax (Gibco, 35,050,061), MEM non-essential amino acids solution (Gibco, 11140050), sodium pyruvate (Gibco, 11360070), fetal bovine serum (Biological Industries, 04–001-1A-US), sucrose (Sigma-Aldrich, V900116), HEPES (Sigma-Aldrich, PHG0001), EDTA (Sigma-Aldrich, E6758), glycyl-l-phenylalanine 2-naphthylamide (Cayman-Chemical, 14634), nycodenz (Sigma-Aldrich, D2158), percoll (Sigma-Aldrich, P4937), iodixanol (Sigma-Aldrich, D1556) and LysoTracker™ Deep Red (Gibco, L12492).
Cell lines
Human colon carcinoma cell lines Caco-2, HCT116 and HT29 were purchased from American Type Culture Collection (ATCC). Caco-2 cells were cultured in MEM supplemented with 20% FBS, 1% glutamax, 1% non-essential amino acids solution and 1% sodium pyruvate 100 mM solution at 37°C under 5% (v/v) CO2 atmosphere. HCT116 and HT29 were cultured in McCoy’s 5A Medium supplemented with 10% FBS at 37°C under 5% (v/v) CO2 atmosphere.
Mice
Eight-week-old Vil1-cre and Snx10 floxed mice (C57Bl/6 background) were purchased from Shanghai Research Center for Model Organisms (Shanghai, China). Mice were maintained with free access to pellet food and water in plastic cages at 21 ± 2°C and kept on a 12 h light/dark cycle. All the animal procedures were performed following the ‘Guide for the Care and Use of Laboratory Animals’ published by the National Institutes of Health (NIH) and were approved by the ethics committee for experimental research, Shanghai Medical College, Fudan University. Vil1-cre mice were mated with Snx10 floxed mice to generate Vil1-cre+Snx10fl/fl mice and Vil1-cre−Snx10fl/fl mice. To induce CRC, mice were injected with a single dose (7.5 mg/kg) of AOM intraperitoneally followed by 3 cycles of 2% (wt/vol) DSS given in the drinking water for 5 days [Citation40].
Human samples
Seventy paired human primary CRC tissues and adjacent normal tissues were collected from Songjiang Hospital Affiliated Shanghai First People’s Hospital, Shanghai Jiao Tong University, from 2014 to 2016. All human samples were obtained with informed consent and approved by the ethical review committee of the World Health Organization of the Collaborating Center for Research in Human Production authorized by the Shanghai Municipal Government, China. None of the patients received preoperative chemotherapy or radiotherapy. Pathological staging was performed according to the American joint committee on Cancer/International Union against Cancer. Tissue specimens were collected and stored at liquid nitrogen immediately after surgery.
Autophagosome purification
We isolated autophagosomes from colon cancer cells using density gradient centrifugation as described previously [Citation41,Citation42]. Briefly, cultured colon cancer cells subjected to electro-disruption were re-suspended in 48 ml of 10% sucrose and mixed with 0.5 ml of a buffer concentrate (1 M HEPES, 0.1 M EDTA) and homogenized gently (10 ~ 20 strokes) using a Dounce homogenizer (Kimble-Kontes, 885300–0015). This homogenate was diluted with 24 ml of homogenization buffer (HB; 0.25 M sucrose, 10 mM HEPES, 1 mM EDTA, 1.5 mM glycyl-l-phenylalanine 2-naphthylamide, 1% DMSO, pH 7.3) and incubated for 6 min at 37°C to destroy the lysosomes. Then the homogenate was cooled to 4°C and subjected to density gradient centrifugation using Nycodenz and Percoll. Purified autophagosomes were lysed in 1 × RIPA buffer and BCA assay was performed on different autophagosome fractions to ensure equal amounts within different groups.
Colorectal epithelial cells isolation
Colorectal epithelial cells were isolated as follows: Colorectal tissues from WT and snx10 knockout mice were opened longitudinally and flushed with ice-cold PBS (Gibco, 10010023). Tissues were cut into small pieces (1 ~ 2 mm) and vigorously shaken in Hanks balanced salt solution (HBSS) containing 40 mM EDTA at 37°C for 15 min and then passed through a 100 μm cell strainer. The colorectal epithelial cells were present in the flowthrough and centrifuged at 300 g at 4°C for 10 min.
Small interfering RNA (SiRNA) and plasmid transfection
SiRNA, specifically targeting human ATG5 (Si-ATG5) and a negative control (Si-NC) were synthesized by GenePharma (Shanghai, China). The sequences are as follows: ATG5 SiRNA: AACCTTTGGCCTAAGAAGAAA; non-targeting siRNA: AATTCTCCGAACGTGTCACGT. SiRNA, specifically targeting human SRC (Si-SRC) was purchased from Origene (SR321884). Plasmids used in this study were listed in Table S2. Plasmids we constructed for this study were confirmed by DNA sequencing method. SiRNA and plasmids were transfected into cells by using Lipofectamine RNAi max (Invitrogen, 13778150) and Lipofectamine 3000 (Invitrogen, L3000015), respectively by following manufacturer’s instructions.
Construction of SNX10 knockout stable cell line
To generate SNX10 knockout stable colon cancer cell lines, we used CRISPR/Cas9 system. Small-guide RNA (sgRNA) targeting human SNX10 gene was designed using Optimized Crispr Design program (http://crispr.mit.edu/). The sgRNA sequence is as follows: GTGTCTGGGTTCGAGATCCT. Lentivirus (Lenti-CAS9-sgRNA-puro) encoding Cas9 nuclease and guide RNA targeting SNX10 or the vector for wild-type control were constructed and packed by Genechem (Shanghai, China). Cultured colon cancer cells were infected by Lentivirus-CAS9-sgRNA-puromycin. After 72 h, SNX10 knockout stable cells were selected using 2.0 μg/ml of puromycin (Yeasen, 60210ES25).
SNX10 reintroduction assay
Recombinant adenovirus vector (Ad-Vector served as a negative control) and adenovirus vector carrying SNX10 gene (Ad-SNX10) were constructed by Genechem (Shanghai, China). For SNX10 reintroduction assay, SNX10 knockout colon cancer cells were infected with Ad-SNX10 or Ad-Vector virus in the presence of 4 μg/ml of polybrene (Sigma-Aldrich, H9268) for 24 h.
Western blot
Total proteins from cells or tissue specimens, as well as autophagosome proteins, were isolated by lysing in RIPA buffer (Beyotime, P0013B) on ice. BCA Protein Assay Kit (Thermo Scientific, 23225) was used to determine the concentration of protein. Equal amounts of proteins (30 μg) were separated by 8 ~ 15% sodium dodecyl sulfate polyacrylamide gel electrophoresis (SDS-PAGE). The resolved proteins were then transferred onto nitrocellulose membranes. Membranes were blocked with 2% bovine serum albumin (Yeasen, 36101ES60) in Tris-buffered saline (Sangon Biotech, B040126) Tween-20 (1%; Yeasen, 60305ES76) solution and incubated with the desired primary antibody overnight at 4°C, followed by incubation with appropriate horseradish peroxidase-conjugated secondary antibodies (Promega, W4011, W4021 and V8051) for 1 h at room temperature. The immune complexes were detected with ECL kit (Yeasen, 36222ES76) and visualized using ChemiDoc™ XRS system from Bio-Rad (Shanghai, China). The intensities of the blots were quantified by densitometry using Quantity One software (Bio-Rad, Shanghai, China) according to the manufacturer’s instruction and a linear relationship between amount of loaded protein and density of the band was confirmed by Quantity One.
RNA isolation and RT-qPCR
Total RNA was extracted from cells and tissue specimens using RNAiso Plus reagent (Takara, 9109) and reverse transcription was performed using the PrimeScript™ RT Master Mix kit (Takara, RR036A) according to manufacturer’s instructions. RT-qPCR was performed using SYBR Premix Ex TaqTM II kit (Takara, DRR081A) in CFX96TM Real-Time PCR Detection System (Bio-Rad, Shanghai, China). The profile of thermal cycling consisted of initial denaturation at 95°C for 30 s, and 40 cycles at 95°C for 5 s and 60°C for 30 s. The specificity of each primer pair was confirmed by melting curve analysis and agarose-gel electrophoresis. ACTB was used as the loading control. All the primers used for RT-qPCR analysis were synthesized by HuanGen Biotech (Shanghai, China). All the primer sequences used in this study are listed in the Table S3.
Immunoprecipitation
For immunoprecipitation analysis, transfected cells were lysed in lysis buffer (50 mM Tris-HCl, pH 7.5, 150 mM NaCl, 1% Nonidet P40 [Amresco, M158], protease inhibitors (Roche Diagnostics, 04693 116 001) and 0.1% SDS-Na) for 30 min and centrifuged at 13,000 g for 15 min. Cell lysates were incubated with 30 μl of anti-FLAG M2 agarose (Sigma-Aldrich, A2220) for 6 h at 4°C. Immunocomplexes were washed three times with 1 ml of lysis buffer and then analyzed by western blot.
Immunofluorescence staining
After treatment with desired protein specific antibodies, cells in the chamber slide were fixed with Immunol staining fix solution (Beyotime, P0098) for 15 min, and then blocked for 30 min with 10% normal goat serum (Gibco, 16210064) in PBS containing 0.1% saponin (Sigma-Aldrich, 47036). Cells were further incubated with primary antibodies for 2 h at room temperature. After washing three times with PBS, cells were incubated with appropriate Alexa Fluor-labeled secondary antibodies (1:500, Invitrogen) in blocking buffer for 1 h at room temperature. The slides were sealed by mounting media and examined under laser scanning confocal microscope (Zeiss, Germany).
Cell proliferation assay
Cell proliferation was tested using BrdU ELISA kit according to the manufacturer’s instructions (Abcam, ab126556). For colony formation assay, cells were plated in 6-well plates (200 cells per well) with 2 ml of complete media. At the end point, cells were stained with 0.1% crystal violet and number of colonies was counted.
Trypan blue exclusion and MTT assay
After starvation, both live and dead cells were collected, subjected to trypan blue staining and counted by hemocytometer. The percentage of dead cells (stained)/total cells was determined by counting an average of 300 ~ 500 cells. MTT (3-[4,5-dimethylthiazol-2-yl]-2,5-diphenyltetrazolium bromide) was used to assess viability of the cells. Briefly, after starvation, cell plates were incubated with MTT medium (1.5 mM MTT dissolved in PBS) for 2 h at 37°C. The MTT medium was aspirated carefully and the dark-blue formazan crystals were solubilized with DMSO for 10 min at 37°C. Optical density was measured at 490 nm using a spectrometer (Tecan, Männedorf, Switzerland).
H&E staining and immunohistochemistry
Tissue samples were fixed in 4% paraformaldehyde and embedded in paraffin (Thermo Scientific, 8331). Colon was sectioned (5 μm) for H&E staining and the stained sections were analyzed by a pathologist using a light microscope (Olympus, Tokyo, Japan). For immunohistochemistry, the sections were deparaffinized, rehydrated, and washed in 1% PBS-Tween-20, and then treated with 2% hydrogen peroxide, blocked with 3% goat serum and incubated for 2 h at room temperature with specific primary antibodies. H&E staining and immunohistochemistry assay were performed by Servicebio Inc. (Shanghai, China). Immunohistochemistry analyses were performed by two independent observers who were blind to the clinical outcome. The immunostaining intensity was scored on a scale of 0 to 3: 0 (negative), 1 (weak), 2 (medium) or 3 (strong).
Autophagosome and autophagic flux detection
For transmission electron microscope analysis, cells were harvested in a 1.5 ml microcentrifuge tube, washed with cold PBS and fixed with fixation solution (4% paraformaldehyde, 0.25% glutaraldehyde in 0.1 M phosphate buffer) at 4°C overnight. Samples were embedded, sectioned and observed under transmission electron microscopy (Hitachi, Tokyo, Japan). For autophagic flux evaluation, StubRFP-SensGFP-MAP1LC3 lentivirus (Genechem, Shanghai, China) was used to infect WT and SNX10 knockout HCT116 cells for 72 h. Since GFP loses its fluorescence from de-protonation in acidic lysosomes, autophagosomes display both green and red fluorescence whereas autolysosomes are nearly red. For LysoTracker staining assay, WT and SNX10 knockout HCT116 cells transfected with GFP-MAP1LC3 were stained with LysoTracker Red (Gibco, L12492) at the final concentration of 50 nM for 1 h before imaging by using confocal fluorescence microscopy (Zeiss, Germany).
Protein-protein docking
ZDOCK associated with RDOCK was demonstrated as a highly successful method for making accurate protein-protein docking predictions. ZDOCK module of Discovery Studio 3.5 was used to perform docking studies with SNX10 (PDB ID:4PZG) and its interacting proteins, ATG5 (PDB ID:4TQ1) and LAMP1 (PDB ID:5GV0). In order to obtain near-native conformation, the predicted protein poses from ZDOCK were subjected to refinement and re-ranking using CHARMm program to remove clashes and, polar and charge interactions were optimized by using RDOCK.
Statistical analysis
Statistical analysis was done by GraphPad software, version 5. Unless indicated otherwise, data are presented as mean ± SEM. Differences in the quantitative data between groups were calculated using 2-tailed unpaired t-test, one-way analysis of variance (ANOVA) or Fisher’s exact test. Survival curves were calculated according to Kaplan-Meier method; survival analysis was performed using the logrank test. p < 0.05 was considered to be significant.
Supplemental Material
Download MS Word (9.6 MB)Disclosure statement
No potential conflict of interest was reported by the authors.
Supplementary material:
Supplemental data for this article can be accessed here.
Additional information
Funding
Related Research Data
References
- Siegel RL, Miller KD, Fedewa SA, et al. Colorectal cancer statistics, 2017. CA Cancer J Clin. 2017 May 06;67(3):177–193. PubMed PMID: 28248415.
- Kesselring R, Glaesner J, Hiergeist A, et al. IRAK-M expression in tumor cells supports colorectal cancer progression through reduction of antimicrobial defense and stabilization of STAT3. Cancer Cell. 2016 May 9;29(5):684–696. PubMed PMID: 27150039.
- Lieu C, Kopetz S. The SRC family of protein tyrosine kinases: a new and promising target for colorectal cancer therapy. Clin Colorectal Cancer. 2010 Apr;9(2):89–94. PubMed PMID: 20378502; PubMed Central PMCID: PMCPMC3091503
- Chen J, Elfiky A, Han M, et al. The role of Src in colon cancer and its therapeutic implications. Clin Colorectal Cancer. 2014 Mar;13(1):5–13. PubMed PMID: 24361441.
- Daigo Y, Furukawa Y, Kawasoe T, et al. Absence of genetic alteration at codon 531 of the human c-src gene in 479 advanced colorectal cancers from Japanese and Caucasian patients. Cancer Res. 1999 Sep 1;59(17):4222–4224. PubMed PMID: 10485460
- Laghi L, Bianchi P, Orbetegli O, et al. Lack of mutation at codon 531 of SRC in advanced colorectal cancers from Italian patients. Br J Cancer. 2001 Jan;84(2):196–198. PubMed PMID: 11161376; PubMed Central PMCID: PMCPMC2363715.
- Bromberg JF, Horvath CM, Besser D, et al. Stat3 activation is required for cellular transformation by v-src. Mol Cell Biol. 1998 May;18(5):2553–2558. PubMed PMID: 9566875; PubMed Central PMCID: PMCPMC110635
- Hodge DR, Hurt EM, Farrar WL. The role of IL-6 and STAT3 in inflammation and cancer. Eur J Cancer. 2005 Nov;41(16):2502–2512. PubMed PMID: 16199153
- Talbot JJ, Song X, Wang X, et al. The cleaved cytoplasmic tail of polycystin-1 regulates Src-dependent STAT3 activation. J Am Soc Nephrol. 2014 Aug;25(8):1737–1748. PubMed PMID: 24578126; PubMed Central PMCID: PMCPMC4116067.
- Benham-Pyle BW, Sim JY, Hart KC, et al. Increasing beta-catenin/Wnt3A activity levels drive mechanical strain-induced cell cycle progression through mitosis. Elife. 2016 Oct 26;5. DOI:10.7554/eLife.19799 PubMed PMID: 27782880; PubMed Central PMCID: PMCPMC5104517.
- Gayrard C, Bernaudin C, Dejardin T, et al. Src- and confinement-dependent FAK activation causes E-cadherin relaxation and beta-catenin activity. J Cell Biol. 2018 Mar 5;217(3):1063–1077. PubMed PMID: 29311227; PubMed Central PMCID: PMCPMC5839785.
- Whitehead J, Vignjevic D, Futterer C, et al. Mechanical factors activate beta-catenin-dependent oncogene expression in APC mouse colon. Hfsp J. 2008 Oct;2(5):286–294. PubMed PMID: 19404440; PubMed Central PMCID: PMCPMC2639941.
- Cullen PJ, Korswagen HC. Sorting nexins provide diversity for retromer-dependent trafficking events. Nat Cell Biol. 2011 Dec 22;14(1):29–37. PubMed PMID: 22193161; PubMed Central PMCID: PMCPMC3613977.
- Chen Y, Wu B, Xu L, et al. A SNX10/V-ATPase pathway regulates ciliogenesis in vitro and in vivo. Cell Res. 2012 Feb;22(2):333–345. PubMed PMID: 21844891; PubMed Central PMCID: PMCPMC3271581.
- You Y, Zhou C, Li D, et al. Sorting nexin 10 acting as a novel regulator of macrophage polarization mediates inflammatory response in experimental mouse colitis. Sci Rep. 2016 Feb;09(6):20630. PubMed PMID: 26856241; PubMed Central PMCID: PMCPMC4746623.
- Zhou C, You Y, Shen W, et al. Deficiency of sorting nexin 10 prevents bone erosion in collagen-induced mouse arthritis through promoting NFATc1 degradation. Ann Rheum Dis. 2016 Jun;75(6):1211–1218. PubMed PMID: 26141367.
- Zhang S, Hu B, You Y, et al. Sorting nexin 10 acts as a tumor suppressor in tumorigenesis and progression of colorectal cancer through regulating chaperone mediated autophagy degradation of p21(Cip1/WAF1). Cancer Lett. 2018 Apr;10(419):116–127. PubMed PMID: 29355659.
- Liu X, Wei W, Li X, et al. BMI1 and MEL18 promote colitis-associated cancer in mice via REG3B and STAT3. Gastroenterology. 2017 Dec;153(6):1607–1620. PubMed PMID: 28780076.
- Herrmann A, Vogt M, Monnigmann M, et al. Nucleocytoplasmic shuttling of persistently activated STAT3. J Cell Sci. 2007 Sep 15;120(Pt 18):3249–3261. PubMed PMID: 17726064.
- Chen D, Fan W, Lu Y, et al. A mammalian autophagosome maturation mechanism mediated by TECPR1 and the Atg12-Atg5 conjugate. Mol Cell. 2012 Mar 09;45(5):629–641. PubMed PMID: 22342342; PubMed Central PMCID: PMCPMC3299828.
- Eskelinen EL. Roles of LAMP-1 and LAMP-2 in lysosome biogenesis and autophagy. Mol Aspects Med. 2006 Oct–Dec;27(5–6):495–502. PubMed PMID: 16973206
- Xu T, Xu J, Ye Y, et al. Structure of human SNX10 reveals insights into its role in human autosomal recessive osteopetrosis. Proteins. 2014 Dec;82(12):3483–3489. PubMed PMID: 25212774.
- Su K, Xu T, Yu Z, et al. Structure of the PX domain of SNX25 reveals a novel phospholipid recognition model by dimerization in the PX domain. FEBS Lett. 2017 Jul;591(13):2011–2018. PubMed PMID: 28542875.
- Harris KF, Shoji I, Cooper EM, et al. Ubiquitin-mediated degradation of active Src tyrosine kinase. Proc Natl Acad Sci U S A. 1999 Nov 23;96(24):13738–13743. PubMed PMID: 10570142; PubMed Central PMCID: PMCPMC24134
- Sandilands E, Serrels B, McEwan DG, et al. Autophagic targeting of Src promotes cancer cell survival following reduced FAK signalling. Nat Cell Biol. 2011 Dec 4;14(1):51–60. PubMed PMID: 22138575.
- Yeatman TJ. A renaissance for SRC. Nat Rev Cancer. 2004 Jun;4(6):470–480. PubMed PMID: 15170449
- Santos CI, Costa-Pereira AP. Signal transducers and activators of transcription-from cytokine signalling to cancer biology. Biochim Biophys Acta. 2011 Aug;1816(1):38–49. PubMed PMID: 21447371
- Grivennikov S, Karin E, Terzic J, et al. IL-6 and Stat3 are required for survival of intestinal epithelial cells and development of colitis-associated cancer. Cancer Cell. 2009 Feb 3;15(2):103–113. PubMed PMID: 19185845; PubMed Central PMCID: PMCPMC2667107.
- Clevers H. Wnt/beta-catenin signaling in development and disease. Cell. 2006 Nov 3;127(3):469–480. PubMed PMID: 17081971.
- Lilien J, Balsamo J. The regulation of cadherin-mediated adhesion by tyrosine phosphorylation/dephosphorylation of beta-catenin. Curr Opin Cell Biol. 2005 Oct;17(5):459–465. PubMed PMID: 16099633
- van Veelen W, Le NH, Helvensteijn W, et al. beta-catenin tyrosine 654 phosphorylation increases Wnt signalling and intestinal tumorigenesis. Gut. 2011 Sep;60(9):1204–1212. PubMed PMID: 21307168; PubMed Central PMCID: PMCPMC3152867.
- Mokarram P, Albokashy M, Zarghooni M, et al. New frontiers in the treatment of colorectal cancer: autophagy and the unfolded protein response as promising targets. Autophagy. 2017 May 4;13(5):781–819. PubMed PMID: 28358273; PubMed Central PMCID: PMCPMC5446063.
- Cuervo AM, Wong E. Chaperone-mediated autophagy: roles in disease and aging. Cell Res. 2014 Jan;24(1):92–104. PubMed PMID: 24281265; PubMed Central PMCID: PMCPMC3879702
- Kaushik S, Cuervo AM. Chaperone-mediated autophagy: a unique way to enter the lysosome world. Trends Cell Biol. 2012 Aug;22(8):407–417. PubMed PMID: 22748206; PubMed Central PMCID: PMCPMC3408550
- Kon M, Kiffin R, Koga H, et al. Chaperone-mediated autophagy is required for tumor growth. Sci Transl Med. 2011 Nov 16;3(109):109ra117. PubMed PMID: 22089453; PubMed Central PMCID: PMCPMC4000261.
- Nassour J, Radford R, Correia A, et al. Autophagic cell death restricts chromosomal instability during replicative crisis. Nature. 2019 Jan;565(7741):659–663. PubMed PMID: 30675059.
- Mizushima N, Noda T, Yoshimori T, et al. A protein conjugation system essential for autophagy. Nature. 1998 Sep 24;395(6700):395–398. PubMed PMID: 9759731.
- Park JM, Huang S, Wu TT, et al. Prognostic impact of Beclin 1, p62/sequestosome 1 and LC3 protein expression in colon carcinomas from patients receiving 5-fluorouracil as adjuvant chemotherapy. Cancer Biol Ther. 2013 Feb;14(2):100–107. PubMed PMID: 23192274; PubMed Central PMCID: PMCPMC3571991.
- Ren F, Shu G, Liu G, et al. Knockdown of p62/sequestosome 1 attenuates autophagy and inhibits colorectal cancer cell growth. Mol Cell Biochem. 2014 Jan;385(1–2):95–102. PubMed PMID: 24065390.
- Neufert C, Becker C, Neurath MF. An inducible mouse model of colon carcinogenesis for the analysis of sporadic and inflammation-driven tumor progression. Nat Protoc. 2007;2(8):1998–2004. PubMed PMID: 17703211
- Fu MM, Nirschl JJ, Holzbaur ELF. LC3 binding to the scaffolding protein JIP1 regulates processive dynein-driven transport of autophagosomes. Dev Cell. 2014 Jun 9;29(5):577–590. PubMed PMID: 24914561; PubMed Central PMCID: PMCPMC4109720.
- Stromhaug PE, Berg TO, Fengsrud M, et al. Purification and characterization of autophagosomes from rat hepatocytes. Biochem J. 1998 Oct 15;335(Pt 2):217–224. PubMed PMID: 9761717; PubMed Central PMCID: PMCPMC1219772