
ABSTRACT
Hypothalamic glial cells named tanycytes, which line the 3rd ventricle (3V), are components of the hypothalamic network that regulates a diverse array of metabolic functions for energy homeostasis. Herein, we report that TSPO (translocator protein), an outer mitochondrial protein, is highly enriched in tanycytes and regulates homeostatic responses to nutrient excess as a potential target for an effective intervention in obesity. Administration of a TSPO ligand, PK11195, into the 3V, and tanycyte-specific deletion of Tspo reduced food intake and elevated energy expenditure, leading to negative energy balance in a high-fat diet challenge. Ablation of tanycytic Tspo elicited AMPK-dependent lipophagy, breaking down lipid droplets into free fatty acids, thereby elevating ATP in a lipid stimulus. Our findings suggest that tanycytic TSPO affects systemic energy balance through macroautophagy/autophagy-regulated lipid metabolism, and highlight the physiological significance of TSPO in hypothalamic lipid sensing and bioenergetics in response to overnutrition.
Abbreviations
3V: 3rd ventricle; ACAC: acetyl-Coenzyme A carboxylase; AGRP: agouti related neuropeptide; AIF1/IBA1: allograft inflammatory factor 1; AMPK: AMP-activated protein kinase; ARC: arcuate nucleus; Atg: autophagy related; Bafilo: bafilomycin A1; CAMKK2: calcium/calmodulin-dependent protein kinase kinase 2, beta; CCCP: carbonyl cyanide m-chlorophenylhydrazone; CNS: central nervous system; COX4I1: cytochrome c oxidase subunit 4I1; FFA: free fatty acid; GFAP: glial fibrillary acidic protein; HFD: high-fat diet; ICV: intracerebroventricular; LAMP2: lysosomal-associated membrane protein 2; LD: lipid droplet; MAP1LC3B/LC3B: microtubule-associated protein 1 light chain 3 beta; MBH: mediobasal hypothalamus; ME: median eminence; MEF: mouse embryonic fibroblast; NCD: normal chow diet; NEFM/NFM: neurofilament medium; NPY: neuropeptide Y; OL: oleic acid; POMC: pro-opiomelanocortin-alpha; PRKN/Parkin: parkin RBR E3 ubiquitin protein ligase; Rax: retina and anterior neural fold homeobox; RBFOX3/NeuN: RNA binding protein, fox-1 homolog (C. elegans) 3; RER: respiratory exchange ratio; siRNA: small interfering RNA; SQSTM1: sequestosome 1; TG: triglyceride; TSPO: translocator protein; ULK1: unc-51 like kinase 1; VCO2: carbon dioxide production; VMH: ventromedial hypothalamus; VO2: oxygen consumption
Introduction
Hypothalamus in the brain plays a key role in the control of metabolism and maintenance of energy homeostasis by integrating metabolic signals such as nutrients or hormones [Citation1,Citation2]. Besides hypothalamic neural circuits, the contribution of glial cells to the control of body weight and appetite in the hypothalamus is also gaining attention [Citation3,Citation4]. Tanycytes, a subtype of glial cells lining the ependymal surface of the 3rd ventricle (3V), have been suggested to play significant roles in the regulation of energy homeostasis [Citation5,Citation6]. Tanycytes extend the processes into neurosecretory terminals in the median eminence (ME) and neurons located in the parenchyma of the hypothalamus including the ventromedial hypothalamus (VMH) and arcuate nucleus (ARC), all of which are hypothalamic nuclei that regulate energy balance [Citation6]. Tanycytes sense nutrient signals [Citation7,Citation8], control the access of circulating hormones [Citation9,Citation10], and shuttle metabolic factors between blood and cerebrospinal fluid/other hypothalamic neurons [Citation11,Citation12], affecting the function of the neural circuits. Thus, integrative functions of tanycytes as sensors and gatekeepers are important to maintain energy homeostasis. However, what molecules/regulators in tanycytes are responsible for their functions in energy homeostasis remains largely unknown.
TSPO (translocator protein) is an outer-mitochondrial membrane protein, previously known as peripheral benzodiazepine receptor for its high affinity for benzodiazepines outside of the central nervous system (CNS) [Citation13]. Many functions have been proposed for TSPO, which include transport of cholesterol into the mitochondria for steroidogenesis [Citation14–Citation16], regulation of the mitochondrial permeability transition pore [Citation17,Citation18], apoptosis [Citation19], and inflammation [Citation20,Citation21]. In the CNS, TSPO expression is highly upregulated in glial cells in a variety of neurodegenerative diseases involving neuroinflammation [Citation22,Citation23]. Interestingly, a high level of TSPO is observed in organs and tissues related to lipid storage and metabolism such as the adrenal gland, kidney, adipose tissues, liver, and gonad [Citation24,Citation25]. Conditional knockout of Tspo in both gonads and adrenal glands of mice reduces lipid storage in testes and ovaries [Citation15]. Furthermore, global knockout of Tspo increases fatty acid oxidation–related gene expression in the adrenal gland [Citation25]. Despite these findings linking TSPO to energy and lipid metabolism, the mechanisms underlying TSPO function are largely unknown.
Autophagy is a lysosome-dependent catabolic process that is essential for the control of cell and organ homeostasis by removing and recycling toxic or obsolete intracellular components [Citation26]. Macroautophagy (the best known form of autophagy, hereafter simply referred to as autophagy) is conventionally considered as a non-selective, bulk degradation process. However, the selective clearance of cellular constituents by autophagy is also critical for the turnover of cellular constituents. Lipophagy is an autophagic degradation of cellular lipid droplets (LDs) and an important pathway for lipid metabolism and production of free fatty acids (FFAs) [Citation27–Citation29]. Cytosolic LDs are engulfed by autophagosomes and transported to lysosomes, where neutral fats are degraded by lysosomal acid lipase [Citation30–Citation32]. Lipophagy links autophagy and lipolysis, expanding its physiological relevance to a diverse range of cellular and organismal processes such as development [Citation33], differentiation [Citation34], cholesterol efflux [Citation35], lipid metabolism [Citation27,Citation36], cellular energy balance [Citation37], and feeding behavior [Citation38]. Dysregulation of lipophagy may underlie a complex metabolic disease state such as non-alcoholic fatty liver disease [Citation39,Citation40], whereas an exact role for lipophagy of LDs in obesity has yet to be identified. Therefore, delineation of the role of lipophagy in nutrient sensing and lipid metabolism will contribute to potential therapeutic designs modulating the turnover of LDs, a hallmark and etiological factor in metabolic diseases. To date, whether autophagy regulates lipid homeostasis through lipophagy in the brain remains to be determined.
In this study, we show that TSPO in tanycytes plays an important role in lipid metabolism by regulating lipophagy in an AMP-activated protein kinase (AMPK)-dependent manner. Furthermore, tanycyte-specific ablation of Tspo prevents obesity by inducing hypophagia and elevating energy expenditure on a high-fat diet (HFD). We suggest that tanycytic TSPO may have a novel role as a regulator of lipid and energy metabolism, thus affecting systemic energy balance.
Results
Hypothalamic TSPO is highly expressed in ependymal cells and tanycytes
We first examined the expression pattern of TSPO in the mediobasal hypothalamus (MBH) of the adult mice. Dorsal tanycytes located near the VMH are referred to as α-tanycytes and ventral tanycytes close to the ARC or ME as β-tanycytes [Citation41]. Immunostaining analysis revealed prominent TSPO expression in the ventricular region lining the 3V and ME floor, with similar levels between α- and β-tanycytes; TSPO expression was relatively low in the parenchymal region of the MBH (). Among the MBH nuclei, the TSPO level was higher in the dorsomedial hypothalamus than in the VMH or ARC (). Consistent with the pattern of the TSPO protein, in situ hybridization revealed that Tspo mRNA levels were also high in cells lining the 3V and ME floor when the antisense probe () but not the sense probe was used (data not shown).
Figure 1. TSPO is highly expressed in ependymal cells and tanycytes in the hypothalamus. (A) Distribution of TSPO (red) immunoreactivity and nuclear staining (Hoechst, blue) in a coronal section of the mediobasal hypothalamus (MBH) in adult mice. DMH, dorsomedial hypothalamus; VMH, ventromedial hypothalamus; ARC, arcuate nucleus. (B) In situ hybridization for Tspo mRNA in the MBH of adult mice. (C–F) Immunostaining for TSPO (red) and VIM (green, C), NES (green, D), AIF1 (green, E), or GFAP (green, F) with Hoechst (blue) staining in the MBH near the 3V of adult mice.
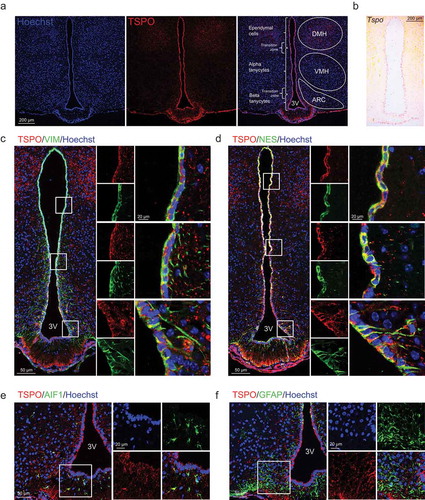
To further determine the cell type–specific TSPO localization, double immunostaining was performed for TSPO and cell type–specific markers: VIM/vimentin, NES/nestin (ependymal cell and tanycyte markers), AIF1/IBA1 (allograft inflammatory factor 1; a microglial marker), GFAP (glial fibrillary acidic protein; an astrocyte marker), and RBFOX3/NeuN (RNA binding protein, fox-1 homolog [C. elegans] 3), MAP2 (microtubule associated protein 2), and AGRP (agouti-related neuropeptide) (neuronal markers). TSPO was highly co-expressed with both VIM and NES in α- and β-tanycytes, in both cell bodies and basal processes that penetrate into the hypothalamic parenchyma (,). TSPO was also co-expressed with VIM and NES in ependymal cell bodies (,). AIF1-positive microglia in the ARC also expressed TSPO (). In contrast, TSPO was barely expressed in GFAP-positive astrocytes in the ARC, but several GFAP-positive tanycytes located on the dorsal 3V expressed TSPO (). Mature neurons expressing RBFOX3, MAP2, or AGRP did not express TSPO in the ARC (Figure S1). Taken together, the above data indicate that expression of TSPO in the hypothalamus is restricted to glial cells, most notably to 3V-lining cells including ependymal cells and tanycytes.
PK11195, a TSPO-specific ligand, in the hypothalamus induces negative energy balance
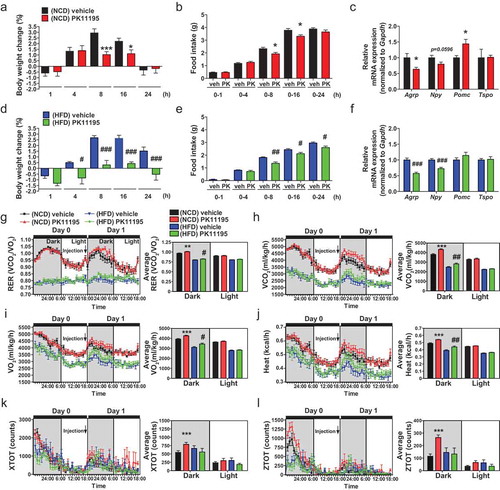
To examine whether the modulation of TSPO in the hypothalamus alters energy metabolism in mice under normal and overnutrition conditions, mice fed normal chow diet (NCD) or HFD for 4 weeks were administered a well-known TSPO ligand PK11195 into the 3V within the MBH. In NCD-fed mice, PK11195 reduced food intake at 8 and 16 h post-injection, resulting in weight loss compared to vehicle-injected control mice (,). This was consistent with decreased orexigenic Agrp and increased anorexigenic Pomc (pro-opiomelanocortin-alpha) mRNA levels (). In HFD-fed mice, food intake and weight gain were attenuated by PK11195 at 8, 16, and 24 h post–injection, with decreased expression of orexigenic Agrp and Npy (neuropeptide Y) (–), although the mRNA level of Pomc was not changed (). The hypothalamic Tspo mRNA level was not changed by intracerebroventricular (ICV) injection of PK11195 (,) or HFD feeding (Figure S2). Furthermore, indirect calorimetry showed that PK11195 administration increased respiratory exchange ratio (RER), oxygen consumption (VO2), and carbon dioxide production (VCO2) rates, and heat production in both NCD- and HFD-fed mice during the dark cycle (–). Locomotor activity was increased by PK11195 in NCD-, but not HFD-fed mice (,). These results indicate that injection of PK11195 in the hypothalamus results in negative energy balance.
Figure 2. Administration of the TSPO ligand PK11195 into the 3V reduces food intake and stimulates energy expenditure in NCD- and HFD-fed mice. Mice were fed NCD or HFD for 4 weeks, and PK11195 or vehicle (2% ethanol) was injected into the 3V through a cannula. (A–F) Body weight change (A and D), food intake (B and E), and hypothalamic Agrp, Npy, Pomc and Tspo mRNA expression (C and F) in mice fed NCD (A–C; n = 10) or HFD (D–F; n = 5). (G–L) RER (G), VCO2 (H), VO2 (I), heat production (J), locomotor activity x axis (XTOT) (K), and z axis (ZTOT) (L). (NCD, n = 12; HFD, n = 8). Data are mean ± SEM, *P ≤ 0.05, **P ≤ 0.01, and ***P ≤ 0.001 vs. NCD vehicle; #P ≤ 0.05, ##P ≤ 0.01, and ###P ≤ 0.001 vs. HFD vehicle as determined by Student’s t-test.
Blockade of TSPO increases AMPK activity through the CAMKK2 pathway in tanycyte-like cells
To elucidate the molecular mechanism underlying the regulation of energy homeostasis by tanycytic TSPO, we used a hypothalamic cell line, A2/29 which are immortalized cells generated from the hypothalamus of an adult male mouse [Citation42]. Immunocytochemistry showed that VIM and NES were highly expressed, while AIF1, GFAP, RBFOX3, and NEFM/NFM (neurofilament medium) were undetectable in A2/29 cells (). Furthermore, A2/29 cells robustly expressed Rax (retina and anterior neural fold homeobox), as shown by agarose gel electrophoresis of PCR products (Figure S3(a)). Rax is a specific tanycyte marker that distinguishes tanycytes from ependymal cells [Citation43,Citation44]. Therefore, the robust expression of Rax, as well as other markers, suggests that A2/29 have tanycyte-like characteristics. In addition, transfection of DsRed2-mito (a DsRed2 construct containing a mitochondrial targeting sequence) into A2/29 cells showed perfect colocalization of TSPO with mitochondria (). Hence, A2/29 were used as an in vitro hypothalamic tanycyte model in our study.
Figure 3. Inhibition of TSPO activates AMPK by blocking mitochondrial Ca2+ uptake in A2/29 cells. (A) Immunostaining for VIM or NES (green) with Hoechst (blue) staining. No staining was detectable for AIF1, GFAP, RBFOX3, and NEFM (all green). (B) Representative micrographs of DsRed2-mito and immunostaining for TSPO (green) with Hoechst (blue) staining. (C) Immunoblotting analysis and quantification of p-PRKAA in cells treated with vehicle (veh) or 10 μM PK11195 (n = 3). (D) Immunoblotting analysis and quantification of TSPO and p-PRKAA in si-scram- or si-Tspo-transfected cells (n = 8 or 9). (E) AMP:ATP ratio in vehicle- or 10 μM PK11195-treated cells determined by using UPLC (n = 5). All differences were not significant (N.S.). (F) Immunoblotting analysis and quantification of p-PRKAA and p-ACAC in cells treated with vehicle or 10 μM PK11195 for 2 h with or without 4 h pretreatment with STO-609 (STO), a CAMKK inhibitor (n = 4). (G) Time course of fluorescence intensity of Fluo-3/AM [Ca2+]cyto in cells treated with vehicle or 10 μM PK11195 (n = 89–139 cells). (H and I) Representative micrographs (H) and time course analysis (I) of Case12-mito and DsRed2-mito for measurement of [Ca2+]mito in cells treated with vehicle or 10 μM PK11195 (n = 89–141 cells). Case12-mito labeling intensity was normalized to that of DsRed2-mito. (J and K) Live imaging for fluorescence-based detection of [Ca2+]cyto (J) and [Ca2+]mito (K) in response to 1 mM ATP in cells pretreated with vehicle or PK11195 (10 nM or 10 μM) for 90 min (n = 11–15 cells from 3 independent experiments). (L and M) Live imaging for fluorescence-based detection of [Ca2+]cyto (L) and [Ca2+]mito (M) in response to 1 mM ATP in si-scram- or si-Tspo-transfected cells (n = 15 or 16 cells from 3 independent experiments). Data are mean ± SEM, *P ≤ 0.05, **P ≤ 0.01, and ***P ≤ 0.001 vs. si-scram, vehicle (veh), and PK11195 0 min; #P ≤ 0.05, ##P ≤ 0.01 vs. PK11195, as determined by Student’s t-test.
![Figure 3. Inhibition of TSPO activates AMPK by blocking mitochondrial Ca2+ uptake in A2/29 cells. (A) Immunostaining for VIM or NES (green) with Hoechst (blue) staining. No staining was detectable for AIF1, GFAP, RBFOX3, and NEFM (all green). (B) Representative micrographs of DsRed2-mito and immunostaining for TSPO (green) with Hoechst (blue) staining. (C) Immunoblotting analysis and quantification of p-PRKAA in cells treated with vehicle (veh) or 10 μM PK11195 (n = 3). (D) Immunoblotting analysis and quantification of TSPO and p-PRKAA in si-scram- or si-Tspo-transfected cells (n = 8 or 9). (E) AMP:ATP ratio in vehicle- or 10 μM PK11195-treated cells determined by using UPLC (n = 5). All differences were not significant (N.S.). (F) Immunoblotting analysis and quantification of p-PRKAA and p-ACAC in cells treated with vehicle or 10 μM PK11195 for 2 h with or without 4 h pretreatment with STO-609 (STO), a CAMKK inhibitor (n = 4). (G) Time course of fluorescence intensity of Fluo-3/AM [Ca2+]cyto in cells treated with vehicle or 10 μM PK11195 (n = 89–139 cells). (H and I) Representative micrographs (H) and time course analysis (I) of Case12-mito and DsRed2-mito for measurement of [Ca2+]mito in cells treated with vehicle or 10 μM PK11195 (n = 89–141 cells). Case12-mito labeling intensity was normalized to that of DsRed2-mito. (J and K) Live imaging for fluorescence-based detection of [Ca2+]cyto (J) and [Ca2+]mito (K) in response to 1 mM ATP in cells pretreated with vehicle or PK11195 (10 nM or 10 μM) for 90 min (n = 11–15 cells from 3 independent experiments). (L and M) Live imaging for fluorescence-based detection of [Ca2+]cyto (L) and [Ca2+]mito (M) in response to 1 mM ATP in si-scram- or si-Tspo-transfected cells (n = 15 or 16 cells from 3 independent experiments). Data are mean ± SEM, *P ≤ 0.05, **P ≤ 0.01, and ***P ≤ 0.001 vs. si-scram, vehicle (veh), and PK11195 0 min; #P ≤ 0.05, ##P ≤ 0.01 vs. PK11195, as determined by Student’s t-test.](/cms/asset/2de182ae-4894-4e3f-a33d-6d1b0c3c663a/kaup_a_1659616_f0003_oc.jpg)
As AMPK is a well-known master regulator of energy metabolism [Citation45], we posited that AMPK may mediate the effects of TSPO modulation. Indeed, treatment with PK11195 (10 nM-10 μM; 4 h) increased the level of phosphorylated PRKAA (p-PRKAA) in A2/29 cells (Figure S3(b)). Incubation of the cell with 10 μM PK11195 increased it until 8 h (). Furthermore, FGIN-127, another TSPO ligand with a nanomolar binding affinity [Citation46], also activated AMPK in the same range of PK11195 concentrations (Figure S3(c)). To corroborate the effects of pharmacological modulation of TSPO, we genetically inactivated TSPO using small interfering RNAs (siRNAs). Transfection of A2/29 cells with 4 different Tspo siRNAs (si-Tspo) increased the level of p-PRKAA compared to cells transfected with scrambled siRNAs (si-scram) (). The outcome of pharmacological action of TSPO ligands can be both agonistic and antagonistic depending on the cell type and context [Citation47]. Since the effects of PK11195, FGIN-127, and TSPO knockdown were similar, those ligands seem to act as an antagonist for tanycytic TSPO.
To identify the upstream modulators of AMPK activation by PK11195, we measured the AMP:ATP ratio in PK11195-treated A2/29 cells. Since PK11195 elicited a significant increase in p-PRKAA from 1 h, the AMP:ATP ratio was measured after treatment for 30 min and 1 h. However, PK11195 had no effect on the AMP:ATP ratio at the tested time points (). Since CAMKK2 (calcium/calmodulin dependent protein kinase kinase 2, beta) activates AMPK in an AMP-independent manner [Citation48], we tested whether CAMKK2 is involved in the activation of AMPK by PK11195. Pretreatment with STO-609, CAMKK inhibitor, blunted AMPK activation by PK11195. Consistent with a reduction in the p-PRKAA level, PK11195-induced increase in phosphorylation of ACAC (acetyl-Coenzyme A carboxylase), one of the downstream targets of p-AMPK, was blocked by STO-609 pretreatment ().
CAMKK2 is activated by an increase in intracellular Ca2+ concentration [Citation49]. We hypothesized that PK11195 blocks the uptake of Ca2+ into the mitochondria through TSPO located in the mitochondrial membrane. To assess the effect of PK11195 on the intracellular Ca2+ level, Fluo-3/AM (Fluo-3) and Case12-mito were used to measure cytosolic ([Ca2+]cyto) and mitochondrial Ca2+ ([Ca2+]mito) level, respectively. PK11195 treatment increased [Ca2+]cyto () and decreased [Ca2+]mito (,) at 90 min in A2/29 cells. The colocalization of Case12-mito and DsRed2-mito showed that Case12-mito was targeted to mitochondria (). We further investigated whether Ca2+ uptake by mitochondria was inhibited by PK11195 in ATP-induced Ca2+ elevation. Pre-incubation with PK11195 significantly increased [Ca2+]cyto () and decreased [Ca2+]mito influx () in response to ATP. Similarly, knockdown of Tspo reduced [Ca2+]mito uptake (), elevating [Ca2+]cyto when ATP is added (). Taken together, these results suggest that the antagonist of TSPO or knockdown of Tspo activates AMPK through elevation of intracellular Ca2+ signaling by blocking the [Ca2+]mito buffering system at both basal and ATP-evoked states.
Tspo knockdown increases autophagy through AMPK activation in A2/29 cells
As a sensor of cellular energy status, AMPK can also induce autophagy to accelerate catabolism [Citation50,Citation51]. We explored the possibility that AMPK activation by TSPO inhibition induces autophagy in A2/29 cells. Western blotting analysis showed that Tspo knockdown increased the phosphorylation level of ULK1 (unc-51 like kinase 1) at Ser555, a target of AMPK for autophagy initiation [Citation52] (). Autophagy induction was also examined by the level of MAP1LC3B/LC3B (microtubule-associated protein 1 light chain 3 beta) and SQSTM1 (sequestosome 1). When autophagy is induced, the MAP1LC3B-I form is converted into MAP1LC3B-II through lipidation [Citation53] and SQSTM1, an autophagy cargo receptor, is degraded [Citation54]. Consistent with activation of AMPK and ULK1, Tspo knockdown increased the MAP1LC3B-II levels and decreased the SQSTM1 levels (). In addition, Tspo knockdown increased the level of BECN1/Beclin 1, which is a downstream target of ULK1 critical for autophagy induction () [Citation55]. In PK11195-treated cells, the level of P-ULK1, MAP1LC3B-II and BECN1 were also elevated and SQSTM1 was reduced, indicating induction of autophagy by PK11195 (Figure S4(a)). Although PK11195 was reported to act in a TSPO-independent manner under certain circumstances [Citation56–Citation58], the induction of autophagy by PK11195 from the nanomolar range of concentrations in A2/29 cells suggests that the effects of PK11195 are most likely through TSPO under our experimental conditions.
Figure 4. Knockdown of Tspo induces autophagy through AMPK activation in A2/29 cells. (A) Immunoblotting analysis and quantification of TSPO, p-PRKAA, and autophagy markers in cells transfected with si-scram or si-Tspo (n = 5). (B) Immunoblotting analysis and quantification of SQSTM1, TSPO and MAP1LC3B-II in cells transfected with si-scram or si-Tspo and treated with vehicle or Bafilo (n = 3). (C) Representative micrographs showing decreased expression of TSPO (red) in si-Tspo-transfected cells. (D) The mRFP-GFP-MAP1LC3B assay in cells transfected with si-scram or si-Tspo (n = 30 cells). (E) Representative micrographs of TSPO (green) and LysoTracker (red) with Hoechst (blue) staining in cells transfected with si-scram or si-Tspo. Rapamycin (Rapa) and Bafilo were used to induce autophagy and to prevent lysosomal acidification in si-scram-transfected cells, respectively. Average number and size of LysoTracker puncta per cell were quantified (n = 20 cells). (F) Fluorescence-activated cell sorting analysis showing fluorescence intensity of LysoTracker in cells transfected with si-scram or si-Tspo (n = 4). (G) Representative micrographs and quantification of colocalization for GFP-PRKN (green) and DsRed2-mito (red) with Hoechst (blue) staining in cells transfected with si-scram or si-Tspo. CCCP was used to induce mitochondrial translocation of PRKN in si-scram and si-Tspo-transfected cells (n = 10–12 cells). (H) Immunoblotting analysis and quantification of COX4I1 and MAP1LC3B-II in cells transfected with si-scram or si-Tspo with or without CCCP (n = 3). (I) Immunoblotting analysis and quantification of PRKAA and p-ACAC in sh-scram- or sh-Ampk-expressing cells (n = 6). (J) Immunoblotting analysis and quantification of TSPO, p-PRKAA, and MAP1LC3B-II in sh-scram- or sh-Ampk-expressing cells that were further transfected with si-scram or si-Tspo (n = 3). Data are mean ± SEM, *P ≤ 0.05, **P ≤ 0.01, and ***P ≤ 0.001 vs. si-scram, sh-scram or vehicle; ##P ≤ 0.01 and ###P ≤ 0.001 vs. si-Tspo, as determined by Student’s t-test.
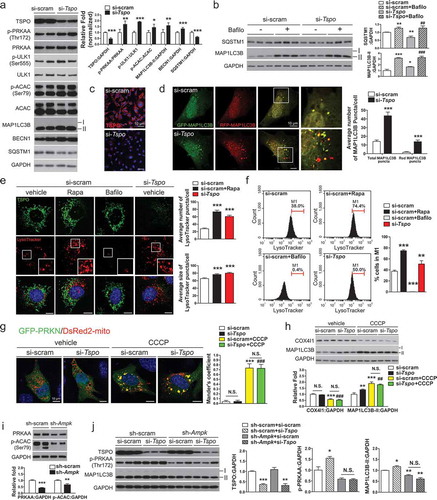
The autophagy flux in Tspo knockdown cells was examined by assessing changes in SQSTM1 and MAP1LC3B-II levels using bafilomycin A1 (Bafilo). Bafilo prevents fusion between the autophagosome and lysosome, thereby impairing autophagy flux and degradation of the substrates [Citation59]. More accumulation of SQSTM1 and MAP1LC3B-II after than before Bafilo treatment reflects increased autophagy flux. Tspo knockdown increased autophagy flux, as evidenced by a further increase in SQSTM1 and MAP1LC3B-II by Bafilo treatment in Tspo knockdown cells, compared with Tspo knockdown only (). In addition, the mRFP-GFP- MAP1LC3B fluorescent puncta assay also revealed an increase in autophagy flux in Tspo knockdown (,) and PK11195 treated cells (Figure S4(b)). Because GFP is less stable than RFP in an acidic environment, the autophagy flux can be assessed by counting yellow puncta (autophagosomes) and red puncta (autolysosomes) [Citation60]. The MTOR (mechanistic target of rapamycin kinase) inhibitor rapamycin (20 μM) was used as a positive control to induces autophagy (Figure S4(b)). The numbers of total and red puncta were significantly increased by Tspo knockdown () and PK11195 (Figure S4(b)), indicating an increased autophagy flux. To further verify autophagy induction, we also used LysoTracker DND Red (LysoTracker), acidic PH-sensitive fluorescence dye staining lysosomes, since it has been used to label acidic autophagic compartments [Citation61]. Fluorescence images showed significant increase in the number and size of LysoTracker-positive lysosomes in Tspo knockdown and rapamycin treatment, demonstrating increased acidification of lysosomes (). In addition, fluorescence-activated cell sorting analysis represented similar increase in lysosome numbers (). The treatment of Bafilo abolishing lysosomal acidification diminished LysoTracker-stained signal (,).
As the aberrant [Ca2+]mito buffering system induces mitochondrial autophagy (mitophagy) [Citation62], we tested whether mitophagy would be induced by Tspo knockdown. One important mitophagy pathway involves the translocation of the PRKN/Parkin (parkin RBR E3 ubiquitin protein ligase) from the cytosol to damaged mitochondria [Citation63]. To observe recruitment of PRKN to mitochondria in Tspo knockdown cells, si-scram- and si-Tspo-transfected cells were transfected with GFP-PRKN and DsRed2-mito. The mitochondrial uncoupler carbonyl cyanide m-chlorophenylhydrazone (CCCP) was used as a positive control for mitophagy induction. As expected, CCCP treatment induced translocation of GFP-PRKN to mitochondria. However, the cytosolic distribution of GFP-PRKN was not affected by Tspo knockdown in the presence and absence of CCCP (). Consistently, the protein level of COX4I1 (cytochrome c oxidase subunit 4I1), a mitochondrial marker protein, was decreased by CCCP but not changed by knockdown of Tspo (), indicating that reduction of Tspo expression does not cause mitophagy in A2/29 cells.
Next, to ascertain whether Tspo knockdown-induced autophagy occurs in an AMPK-dependent manner, Prkaa1/Ampkα1 (protein kinase, AMP-activated, alpha 1 catalytic subunit) and Prkaa2/Ampkα2 (protein kinase, AMP-activated, alpha 2 catalytic subunit) expression was knocked down in A2/29 cells by using lentivirus-mediated delivery of 4 (2 for each subunit) different short hairpin RNAs targeting Ampk (sh-Ampk). Compared to A2/29 cells infected with lentivirus expressing a non-targeting sh-RNA sequence (sh-scram), sh-Ampk-transfected cells had lower total AMPK and p-ACAC levels (). The effect of a decrease in TSPO on the induction of autophagy was abolished by Ampk knockdown (). Taken together, these data demonstrate that Tspo knockdown induces autophagy in an AMPK-dependent manner in A2/29 cells.
Tspo knockdown induces lipophagy and generates free fatty acids in A2/29 cells
As lipids are abundant and enzymes related to lipid metabolism are highly expressed in tanycytes [Citation64], we hypothesized that Tspo knockdown–induced autophagy targets LDs, leading to lipophagy. Since LDs contain triglyceride (TG) and esterified cholesterol, their degradation by autophagy is expected to generate FFAs and cholesterol [Citation30]. Consistent with our hypothesis, our metabolites analysis demonstrated that levels of FFAs and cholesterol were increased but TG was decreased without a change in amino acids in Tspo knockdown cells (Figure S5(a-d)), which suggests LDs as a main target of autophagy. To visualize LDs in Tspo knockdown cells, we stained LDs with BODIPY 493/503 (BODIPY). As expected, Tspo knockdown decreased the number and size of LDs (). A lipid challenge activates lipophagy that preferentially sequesters LDs [Citation27]. In the presence of oleic acid (OL; 0.06 mM; 4 h), which was added to increase the formation of LDs, Tspo knockdown resulted in a marked increase in LDs degradation, confirming lipophagy (). Although some levels of lipid degradation may occur by bulky autophagy, these data suggest that Tspo knockdown-induced autophagy preferentially targets LDs, leading to lipophagy. On the other hand, localization of GFP-PRKN into the mitochondria (Figure S6(a)) and the level of COX4I1 (Figure S6(b)) were not affected by Tspo knockdown or OL treatment, indicating ablation of Tspo or accumulation of LDs is not related to the regulation of mitophagy in A2/29.
Figure 5. Knockdown of Tspo generates free fatty acids by lipophagy in A2/29 cells. (A) Representative micrographs of BODIPY (green) in si-scram- or si-Tspo-transfected A2/29 cells with or without Bafilo or OL. Average number and size of LDs per cell were quantified (n = 14–21 cells). (B and C) Representative micrographs and quantification of colocalization for BODIPY (green) and LAMP2 (red; B) or mRFP-MAP1LC3B (red; C) in si-scram- or si-Tspo-transfected cells with or without Bafilo and OL (n = 11–16 cells). (D) Heatmap and box–whisker plot of free fatty acids analyzed by targeted GC-MS/MS metabolomics of si-scram- or si-Tspo-transfected cells with OL and with or without pre-transfection with si-Atg5 (n = 4). (E) Immunoblotting analysis and quantification of ATG5, TSPO, and MAP1LC3B-II in si-scram- or si-Tspo-transfected cells with OL and with or without pre-transfection with si-Atg5 (n = 3). (F) Cellular ATP level in si-scram- or si-Tspo-transfected cells with OL and with or without pre-transfection with si-Atg5 (n = 16). Data are mean ± SEM, *P ≤ 0.05, **P ≤ 0.01, ***P ≤ 0.001 vs. si-scram; #P ≤ 0.05, ##P ≤ 0.01, ###P ≤ 0.001 vs. si-Tspo; †P ≤ 0.05, ††P ≤ 0.01, †††P ≤ 0.001 vs. si-scram+OL; §P ≤ 0.05, §§P ≤ 0.01, §§§P ≤ 0.001 vs. si-Tspo+OL, as determined by Student’s t-test.
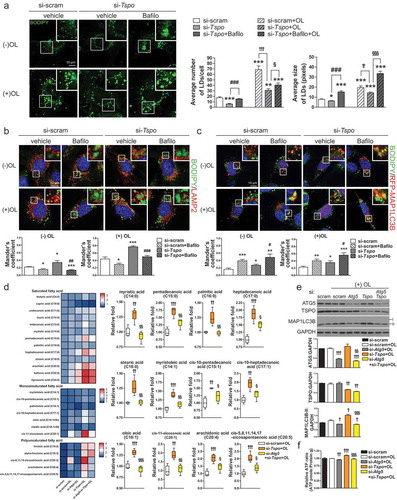
Degradation of LDs was blocked by Bafilo, suggesting that the decrease in LD contents in si-Tspo-transfected cells was caused by lipophagy-mediated degradation (). To further examine whether lipophagy is induced, we measured the colocalization of BODIPY and LAMP2 (lysosomal associated membrane protein 2; lysosomal marker). Tspo knockdown significantly increased BODIPY-LAMP2 colocalization in both the presence and absence of OL, whereas treatment with Bafilo decreased localization of LDs in lysosomes because the autophagosome–lysosome fusion was blocked (). Colocalization between BODIPY and MAP1LC3B puncta was also increased by Tspo knockdown, indicating increased localization of LDs in autophagosomes or autolysosomes (). Treatment with Bafilo increased BODIPY-MAP1LC3B colocalization, showing that LDs remained in autophagosomes due to blockade of autophagy ()).
FFAs generated by LDs breakdown through lipophagy can be used to generate ATP via fatty acid oxidation [Citation27–Citation29]. To determine whether lipophagy induced by Tspo knockdown produces FFAs, we used targeted metabolic profiling using gas chromatography-mass spectrometry (GC-MS/MS) to analyze FFAs under OL treatment (). Tspo knockdown increased the content of various intracellular FFAs, and this effect was significantly abolished by a double knockdown of Atg5 (autophagy related 5) and Tspo, indicating that FFA production was mediated by lipophagy (). Western blotting analysis confirmed an efficient knockdown of Tspo and Atg5 by si-RNA transfection, and the changes in the MAP1LC3B-II levels correlated with autophagy status (). To verify that increased FFA content is linked to higher energy production, we analyzed the intracellular ATP content under OL treatment. Reduced TSPO expression was sufficient to increase ATP production, which was reversed by the double knockdown of Atg5 and Tspo (). Taken together, the above data indicate that the knockdown of Tspo facilitates lipid degradation and ATP production through lipophagy in A2/29 cells.
Tanycyte-specific ablation of Tspo prevents obesity in diet-induced obese mice
To delineate the in vivo effect of tanycyte-specific ablation of Tspo on the regulation of energy balance, we generated tanycyte-specific Tspo-deficient mice. Adeno-associated virus expressing Cre recombinase and GFP under the control of the Rax promoter (AAV-Rax-Cre-GFP) was injected into the 3V of 6-week-old male Tspo floxed (Tspofl/fl) mice (hereafter referred to as Rax-TSPO-KO mice). As controls, we used littermates that received AAV-Rax-GFP (hereafter referred to as Rax-control mice). Three weeks after AAVs injection, mice were fed NCD or HFD for 4 weeks (). Since Rax expression in ventral tanycytes is higher in adult than in young mice [Citation65], AAV-Rax-Cre-GFP deleted Tspo specifically in medioventral () and posteroventral tanycytes (Figure S7(a)) near the ARC, including ventral α1, β1, and β2-tanycytes. On the other hand, Tspo in dorsal α1-tanycytes near the VMH (Figure S7(b)) and ependymal cells (Figure S7(c)) was not ablated. Rax-TSPO-KO mice showed GFP signals in the nuclei of tanycytes, and the expression of TSPO was dramatically reduced in GFP-expressing VIM-positive tanycytes, whereas robust TSPO expression and GFP signals were detected in the cytoplasm of tanycytes in Rax-control mice ().
Figure 6. Ablation of Tspo in tanycytes decreases food intake and increases energy expenditure in HFD-fed mice. (A) Strategy to generate conditional tanycyte-specific Tspo knockout mice by viral injection of AAV-Rax-Cre-GFP into the 3V in Tspofl/fl mice. (B) Immunostaining for TSPO (red) and VIM (magenta) with Hoechst (blue) staining in GFP-positive ventral tanycytes of AAV-Rax-Cre-GFP-injected Tspofl/fl mice. (C) High-magnification micrographs showing GFP (green), Hoechst (blue), and TSPO (red) in ventral tanycytes of Tspofl/fl mice injected with AAV-Rax-Cre-GFP or AAV-Rax-GFP. (D–K) Body weight change (D), accumulated food intake (E), RER (F), VCO2 (G), VO2 (H), heat production (I), XTOT (J), and ZTOT (K) of Tspofl/fl mice fed HFD for 4 weeks after injection with AAV-Rax-Cre-GFP or AAV-Rax-GFP into the 3V (n = 9). Data are mean ± SEM, *P ≤ 0.05, **P ≤ 0.01, ***P ≤ 0.001 vs. AAV-Rax-GFP, as determined by two-way ANOVA (D and E) or Student’s t-test (F-I).
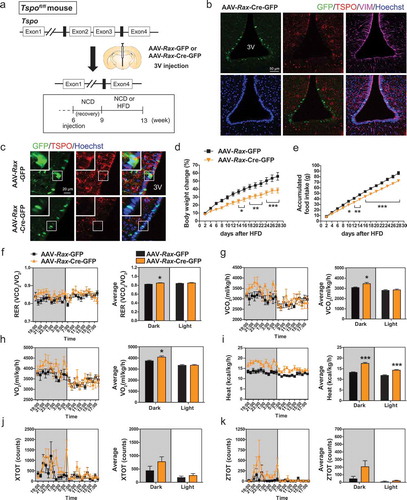
From 2 weeks of HFD feeding, weight gain and food intake were significantly lower in Rax-TSPO-KO than in Rax-control mice (,). However, Rax-TSPO-KO mice did not show changes in these parameters under NCD feeding (Figure S7(d,e)). In addition, RER, VO2 and VCO2 rates, and heat production were increased in HFD-fed Rax-TSPO-KO mice during the dark cycle (–), whereas locomotor activity was not changed (,). The glucose tolerance and INS (insulin) tolerance were not different between Rax-TSPO-KO and Rax-control mice in HFD feeding (Figure S7(f,g)). Taken together, these data suggest that tanycyte-specific ablation of Tspo reduces appetite and stimulates energy expenditure under overfat condition.
Inhibition of TSPO induces lipophagy through AMPK activation in tanycytes in vivo
We next investigated whether lean phenotypes in PK11195-injected or Rax-TSPO-KO mice are accompanied by lipophagy in tanycytes in vivo. Since PK11195 reduced food intake and elevated energy expenditure under both NCD and HFD feeding (), we evaluated PK11195-induced AMPK activation in tanycytes of mice fed NCD. The colocalization of p-PRKAA and VIM was significantly increased in tanycytes by PK11195 (). In contrast, the level of p-PRKAA in microglia was not increased by PK11195 (Figure S8), indicating that AMPK is activated by PK11195 in tanycytes rather than microglia. We further verified whether AMPK is required for PK11195-induced autophagy using compound C, an AMPK inhibitor. Compound C blunted PK11195-induced elevation of p-PRKAA, P-ULK1, MAP1LC3B-II, and ATG7 (autophagy related 7) (). This result is indicative of AMPK-dependent autophagy induction by PK11195 in the hypothalamus.
Figure 7. Intracerebroventricular (ICV) injection of PK11195 or ablation of Tspo induces lipophagy in tanycytes. (A) Representative micrographs and quantification of colocalization for p-PRKAA (red) and VIM (green) in ventral tanycytes of PK11195- or vehicle-injected mice fed NCD (n = 18 sections/3 mice). (B) Immunoblotting analysis and quantification of p-PRKAA and autophagy markers in the hypothalamus after ICV injection of PK11195 (PK), compound C (CC), or vehicle into the 3V of mice fed NCD (n = 6). (C) Immunostaining for LAMP2 (red) and VIM (magenta) with BODIPY (green) and Hoechst (blue) staining in ventral tanycytes of mice fed NCD with or without injection of PK11195 or OL, or fed HFD with or without PK11195. Average number and size of LDs per cell and colocalization of BODIPY and LAMP2 (white) were quantified (n = 15 sections/3 mice). (D–F) Tspofl/fl mice were injected with AAV-Rax-Cre-GFP or AAV-Rax-GFP and fed HFD for 4 weeks. (D and E) Immunostaining for p-PRKAA (red; D) or MAP1LC3B (red; E), and VIM (magenta) in GFP+-tanycytes. Colocalization of p-PRKAA and VIM (white) was quantified (D; n = 9 sections/3 mice). Aaverage number of MAP1LC3B puncta in the cytosol (arrowhead) was also quantified (E; n = 58–72 cells/3 mice). (F) Immunostaining for TSPO (red) and VIM (magenta) with BODIPY (green) and Hoechst (blue) staining in ventral tanycytes. Average number and size of LDs per cell were quantified (n = 88 or 89 cells/3 mice). Data are mean ± SEM, *P ≤ 0.05, **P ≤ 0.01, ***P ≤ 0.001 vs. PK11195, (NCD) vehicle, or AAV-Rax-GFP; ###P ≤ 0.001 vs. (NCD) OL; ††P ≤ 0.01, †††P ≤ 0.001 vs. (HFD) vehicle, as determined by Student’s t-test.
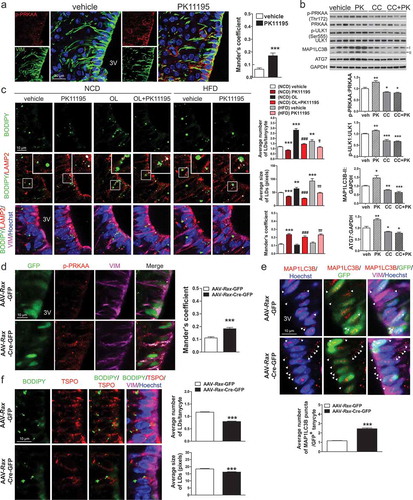
We examined the effect of PK11195 on LD degradation in ventral tanycytes under normal or LD-rich conditions in NCD-fed mice. Injection of OL into the 3V for 4 h significantly increased both the average size and number of LDs in tanycytes (). Injection of PK11195 decreased both the average size and number of LDs in ventral tanycytes regardless of OL injection (). The colocalization of BODIPY and LAMP2 in the absence or presence of OL was also increased in PK11195-injected ventral tanycytes of NCD-fed mice (). In addition, an elevated number of LDs observed in mice fed HFD for 4 weeks was efficiently reduced by PK11195, with an increase in BODIPY/LAMP2 colocalization in ventral tanycytes, similarly to NCD-fed mice ()).
Consistent with the results from PK11195-injected mice, Rax-TSPO-KO mice had negative energy balance upon HFD feeding (–). Immunostaining showed increased p-PRKAA levels in tanycytes of Rax-TSPO-KO mice fed HFD for 4 weeks (). In line with the in vitro results, tanycyte-specific ablation of Tspo increased the number of MAP1LC3B puncta () and decreased the number and size of LDs () in tanycytes, indicating induction of lipophagy. Collectively, our in vivo data show that pharmacological and genetic inhibition of TSPO in tanycytes drives lipophagy by activating AMPK.
Discussion
Tanycytes are emerging as a key player in the hypothalamic network that controls feeding and energy balance, as they are a key component of brain-endocrine interaction. However, further studies are warranted to understand how tanycytes elicit the responses to a variety of environmental changes such as overnutrition and what their regulatory mechanisms are. In this study, we report TSPO inhibition-mediated AMPK-dependent lipophagy as a novel mechanism by which tanycytes regulate feeding and energy expenditure in fat-rich conditions.
Lipophagy in tanycytes
Our knowledge of lipid metabolism in tanycytes is relatively poor, compared to the understanding of nutritional signals such as glucose. Tanycytes might be a potentially important cell type in hypothalamic lipid metabolism. Tanycytes have the gating function for the uptake of both saturated and unsaturated FFAs for lipid processing and exchange in the hypothalamus [Citation66]. In our in vivo experiments, HFD significantly increased the number and size of LDs in tanycytes, confirming the lipid storage capacity of tanycytes [Citation66]. Interestingly, LDs are detected mostly in ependymal cells and tanycytes within the hypothalamus, but rarely in other parenchymal regions of mice fed NCD or HFD. LDs not only store lipid precursors but also supply the cell with FFAs for functions related to energy demand [Citation67]. However, it is not known how LDs are further metabolized once they are stored in tanycytes. Our metabolomics data showed that Tspo knockdown elevated the levels of both saturated and unsaturated FFAs, whereas inhibition of autophagy reversed these effects, indicating lipophagy-mediated generation of FFAs. In line with the notion that FFAs generated via lipophagy are used for energy production in the mitochondria [Citation68], we observed that the ATP level was increased by Tspo knockdown. Thus, we suggest that TSPO can be a regulator of lipid storage and degradation for maintaining cellular lipid metabolism in tanycytes.
Tanycytic TSPO is a regulator of lipophagy
While the expression and function of TSPO in activated microglia, immune cells resident in the CNS, have been well documented in relation to neuronal injury and neuroinflammation [Citation20–Citation22,Citation69], the role of TSPO in other glial cells in the CNS remains poorly defined. Of note, the TSPO expression level is much higher in tanycytes than in microglia of the mouse hypothalamus at basal state, as shown in this study.
Whilst the knockdown of Tspo was reported to increase mitophagy induced by mitochondria uncoupler treatment in mouse embryonic fibroblasts (MEFs) or canine mammary gland epithelia (CF35) [Citation70], we observed an induction of lipophagy, not mitophagy by Tspo knockdown. Distinct outcomes of Tspo knockdown (mitophagy vs. lipophagy) may be due to differences in cell type and stimulus (uncoupler vs. metabolic stimulus). Although further study will be required to understand the related regulatory mechanisms, our results unveil a previously unknown role of TSPO in lipid metabolism through lipophagy, by which TSPO regulates energy homeostasis and fat storage in tanycytes under HFD conditions.
Mechanism underlying lipophagy induced by TSPO inhibition: blockade of mitochondrial Ca2+ uptake and AMPK-dependent autophagy
In this study, PK11195, the best characterized TSPO ligand, and knockout/knockdown of Tspo gene were used to modulate TSPO in tanycytes and tanycyte-like cells. PK11195 has a nanomolar affinity in binding to TSPO [Citation71,Citation72], and both 10 nM and 10 μM PK11195 similarly activated AMPK and autophagy via inhibiting Ca2+ influx of mitochondria, and those effects were corroborated by knockdown of TSPO in A2/29. Thus, it suggests that the action of PK11195 is specifically mediated by TSPO as an antagonist.
There are reports that micromolar concentrations of PK11195 show side effects, such as activation of apoptosis in a TSPO-independent manner in several cancer cell lines [Citation57,Citation58]. One interesting paper suggested that 10 μM PK11195 increased [Ca2+]cyto and [Ca2+]mito levels by elevating Ca2+ release from ER probably through BCL2 family proteins or their interactors, attributing to induction of apoptosis [Citation73]. Under our experimental conditions, however, either 10 nM or 10 μM PK11195 did not alter the levels of BCL2 family proteins or affect cell viability (data not shown). Therefore, unlike the reports in cancer cells, PK11195 does not trigger the side effects such as apoptosis in tanycytes.
In this study, 1 mM ATP was applied to spike [Ca2+]cyto. ATP at this concentration can mobilize Ca2+ through not only G-protein-coupled receptor family [Citation74,Citation75], but also ligand-gated ionotrophic family [Citation76,Citation77]. As of yet, it has not been known which pathway is activated by 1 mM ATP in A2/29. Our results showed that PK11195 decreased [Ca2+]mito and increased [Ca2+]cyto levels in the absence ATP. Furthermore, both PK11195 and knockdown of TSPO blocked the uptake of mitochondrial Ca2+ and elevated [Ca2+]cyto in the presence of ATP. These data suggest that PK11195 reduces [Ca2+]mito levels regardless of Ca2+ mobilizer and the increased [Ca2+]cyto level is probably due to decreased mitochondrial Ca2+ buffering capacity in A2/29.
Although the role of neuronal AMPK or autophagy within the hypothalamus has been highlighted [Citation38,Citation50], tanycytic AMPK or autophagy has not been studied yet. Here, we demonstrated that tanycytes contain the machinery for lipophagy and that TSPO inactivation induced lipophagy through AMPK activation. As an underlying mechanism, we revealed that TSPO inactivation blocked the uptake of Ca2+ into mitochondria, thereby increasing [Ca2+]cyto levels. This increase activated AMPK through CAMKK2. In line with our results, treatment of HT-29 cells with PK11195 increases the release of [Ca2+]mito, elevating [Ca2+]cyto levels [Citation78]. In addition, the TSPO ligand hemin decreases the uptake of Ca2+ into mitochondria and increases release of [Ca2+]mito in the rat heart when exogenous Ca2+ is applied [Citation79]. Our results suggest that TSPO maintains and tunes the intracellular Ca2+ level by controlling [Ca2+]mito buffering capacity in tanycytes. On the contrary, one study has shown that overexpression of TSPO inhibits [Ca2+]mito uptake induced by increased phosphorylation of VDAC1 (voltage dependent anion channel 1) in diverse mammalian cells such as MEFs, HeLa cells, CF35 cells, a microglial cell line (BV2), and primary rat microglia cultures [Citation80]. The opposite role of TSPO on the regulation of [Ca2+]mito homeostasis is probably due to different interacting molecules or binding partners depending on the physiological states or cell types, thereby leading to different actions of TSPO. As such, overexpression of TSPO increases the interaction with VDAC1 and elevates ROS levels in MEFs and CF35 cells [Citation70], while overexpression of TSPO suppresses the expression of VDAC1 leading to a decrease in ROS production in endothelial cells [Citation81,Citation82], suggesting that TSPO may act in a context-dependent manner.
Inhibition of tanycytic TSPO induces negative energy balance
Genetic deletion of Tspo in ventral tanycytes prevented obesity induced by HFD by reducing food intake and increasing energy expenditure. Furthermore, acute ICV injection of PK11195 into the 3V resulted in temporal improvement of energy metabolism by decreasing food intake and elevating energy expenditure in mice fed NCD or HFD. A previous study reported that intraperitoneal injection of PK11195 improves glucose tolerance and reduces pathology of obesity induced by HFD without changes in appetite or locomotor activity [Citation83], suggesting that PK11195 affects peripheral energy metabolism. However, the role of TSPO in central energy metabolism has not yet been explored. Tanycytes are suggested to have regulatory functions on appetite and energy balance via interaction with hypothalamic neurons [Citation6,Citation84], which control energy expenditure, glucose and lipid metabolism in peripheral tissues via the autonomic nervous system [Citation85,Citation86]. TSPO mediated-alteration in lipid metabolism in tanycytes may potentially trigger signal transduction from tanycytes to hypothalamic neurons, regulating the activity or function of those neurons. Notably, our work shows that metabolic changes induced by ICV injection of PK11195 were correlated with a reduced expression of orexigenic neuropeptides Agrp and Npy in both NCD- and HFD-fed mice. Since mature AGRP-expressing neurons do not express TSPO in the ARC (Figure S1(c)), these results implicate the alteration of cellular metabolism by modulation of tanycytic TSPO is involved, directly or indirectly, in the regulation of gene expression of orexigenic neuropeptides in ARC neurons. Thus, it is likely that the improvement of energy metabolism by inhibition of tanycytic TSPO occurs via transport of intermediate metabolites from tanycytes to neurons. Ventral tanycytes extend long basal processes onto neurons located in the ARC and ME and transfer paracrine factors such as lactate or ATP released from tanycytes to neurons [Citation7,Citation87,Citation88]. One study has demonstrated that AGRP neurons are inactivated by an increased level of adenosine, which is produced from ATP extracellularly [Citation89]. Based on our data showing elevated ATP generation through lipophagy in Tspo-deficient cells, we assume that ATP production and release from tanycytes following TSPO inhibition may decrease the activity of orexigenic neurons. As a result, tanycyte-derived ATP may decrease food intake and increase energy expenditure by sending an overnutrition signal that restores systemic energy balance in peripheral tissues including adipose tissue. It will be interesting to investigate whether ATP produced by lipophagy in tanycytes with specific ablation of Tspo is released and regulates neuronal activities for future studies.
Conclusion
In this study, we describe the role of tanycytic TSPO in regulation of cellular lipids and energy metabolism in response to overnutrition. In the context of a large supply of lipids, normally TSPO may block fat catabolism regulated by autophagy through maintaining intracellular Ca2+ homeostasis, resulting in fat preservation. TSPO inactivation in tanycytes increases the use of fat by AMPK-induced lipophagy, which overcomes energy surplus and improves the obese phenotype. The delineation of the role of tanycytic TSPO in the regulation of autophagy may help understanding the functions of tanycytes and highlights the importance of targeting tanycytic TSPO as a potential therapeutic strategy for metabolic diseases such as obesity.
Materials and methods
Mice
Male C57BL/6 mice at 4–7 weeks of age were purchased from Koatech (South Korea). Tspo-heterofloxed (Tspofl/+) mice (C57BL/6J background) were purchased from The Jackson Laboratory (024976). The Tspofl/+ mice were crossed to generate Tspo-homofloxed (Tspofl/fl) mice. Mice were sacrificed by cervical dislocation and part of the hypothalamus including ARC was quickly dissected and frozen in liquid nitrogen. Mice were maintained in specific-pathogen-free conditions in individually ventilated cages (one mouse per cage) under a 12-h light/dark cycle (lights on from 7:00 to 19:00) at 23 ± 3°C and humidity controlled at 50 ± 10%) with ad libitum access to water and NCD (12% kcal from fat; Lab Supply, 5053) or HFD (60% kcal from fat; Envigo, 06414). All animal studies followed National Institutes of Health guidelines and were approved by the Institutional Animal Care and Use Committee at the DGIST Laboratory Animal Resource Center.
Cell culture
The A2/29 (CLU189) cell line was purchased from Cellutions Biosystems and grown in DMEM (Sigma-Aldrich, D5796) supplemented with 10% fetal bovine serum (Hyclone Laboratories, SH30919.03) and 1% penicillin-streptomycin (Hyclone Laboratories, SV30010) at 37°C. PK11195 (Sigma-Aldrich, C0424) and FGIN-127 (TOCRIS, 0658) were dissolved in 100% ethanol and DMSO, respectively, to 20 mM and stored at – 20°C. Cells were treated with PK11195 or FGIN-127 (10 nM–10 μM) to block TSPO. STO-609 (5 μg/ml; Sigma-Aldrich, S1318) was used for blocking CAMKK2. To induce mitophagy, cells were treated with 100 nM CCCP (Sigma-Aldrich, C2759). To inhibit autophagy, 20 nM Bafilo (Sigma-Aldrich, B1793) was used. To induce autophagy, 20 μM rapamycin (Enzo Life Science, BML-A275) was used for treatment. To increase formation of LDs in cells, 0.06 mM oleic acid sodium salt (OL; Sigma-Aldrich, O7501) was added.
Antibodies
We used the antibodies against the following proteins: TSPO (ab109497), AIF1/IBA1 (ab5076), MAP2 (ab5392), and COX4I1 (Ab14744) from Abcam; VIM/vimentin (AB5733), RBFOX3/NeuN (MAB377), and GFAP (MAB360) from Millipore; NES/nestin (NB100-1604) and NEFM/NFM (NBP2-46,618) from Novus Biologicals; LAMP2 (L0668), MAP1LC3B/LC3B (L8918), SQSTM1 (P0067), and ATG7 (A2856) from Sigma-Aldrich; AGRP (AF634) from R&D Systems; p-PRKAA/p-AMPKα (Thr172, 2535), PRKAA/AMPKα (2532), p-ACAC (Ser79, 3661), ACAC (3662), p-ULK1 (Ser555, 5869), ULK1 (8054), BECN1/Beclin1 (3738), and GAPDH (2118) from Cell Signaling Technology
The following secondary antibodies were used: Cy3-conjugated anti-rabbit IgG (Jackson ImmunoResearch, 711–165-152), Alexa488-conjugated anti-rabbit (Thermo Fisher Scientific, A-11,008), Alexa488-conjugated anti-mouse (Jackson ImmunoResearch, 715–545-150), Alexa488-conjugated anti-goat (Molecular Probes, A-11,055), Alexa488-conjugated anti-chicken IgG (Jackson ImmunoResearch, 703–545-155). Alexa647-conjugated anti-chicken IgG (Jackson ImmunoResearch, 703–545-155), and horse radish peroxidase-conjugated anti-rabbit (Thermo Fisher Scientific, NCI460KR) and anti-mouse (Cell Signaling Technology, 7076) antibodies.
3rd ventricle (3V) cannulation
Male C57BL/6 mice were acclimated for 1 week and were anesthetized with an intraperitoneal injection of a mixture of Zoletil 50 (30 mg kg−1 bodyweight; Virbac) and Rompun (10 mg kg−1 bodyweight; Bayer Korea) in NaCl (0.9%). After the loss of reflexes, animals were fixed in a stereotaxic frame (David Kopf Instruments, Tujunga, CA, USA). A small hole was made in the skull using a dental drill and a 26-gauge guide cannula (Plastics One) was implanted into the 3V (1.3 mm posterior to the bregma, 5.2 mm below the bregma). The guide cannula was secured to the skull with dental cement (Dentsply, LAD010) and covered with a dust cap (Plastics One).
Intracerebroventricular (ICV) injection
Mice were fed HFD from 5 to 9 weeks of age to simulate diet-induced obesity. Cannulation was performed at the age of 8 weeks in both HFD- and NCD-fed mice. After 1-week recovery period, mice were administered 2 μl of PK11195 (2 nmoles diluted in 2% ethanol) or vehicle into the 3V 1 h before the beginning of the dark cycle. After PK11195 ICV injection, food consumption and body weight changes were measured up to 24 h. To determine relative mRNA expression, the hypothalami were harvested 6 h after injection. To confirm AMPK-mediated autophagy in tanycytes, 2 μl of PK11195 (2 nmole) and compound C (200 nmole; Calbiochem, 171,260) were injected into the 3V 1 h before the beginning of the dark cycle, and the hypothalami were collected 4 h later for western blotting assay. To assess the LD contents in tanycytes, mice received 2 μl of OL (34 mM) dissolved in 40% hydroxypropyl-β-cyclodextrin (Sigma-Aldrich, H107) through the implanted cannula 1 h before the beginning of the dark cycle and were sacrificed 4 h after ICV injection for immunohistochemical analysis.
Genotyping
Tspofl/fl mice were labeled by ear punching 21 d after birth and tail tips were used for genotyping. Genomic DNA was isolated by using a Rapid Extract PCR kit (PCRBIO, PB10.24–08) and was used for PCR. The primers for genotyping were synthesized by Integrated DNA Technologies: Tspo floxed forward, 5′-GGATTACCACACCCAACCAG-3′ and Tspo floxed reverse, 5′-TAGGAGTGCAAAGCCAGTCA-3ʹ. Genotyping was performed according to a protocol specified at The Jackson Laboratory.
Stereotaxic injection of adeno-associated virus
AAV-Rax-GFP (control) and AAV-Rax-Cre-GFP were purchased from SignaGen Laboratories. The plasmid pAAV-Rax-GFP was generated by synthesizing a small upstream fragment of the mouse Rax gene (–1100 to +149, Genbank, NM013833) and inserting it into pAAV-CMV-GFP to replace the CMV promoter. To generate pAAV-Rax-Cre-GFP, Cre-Nls was synthesized and inserted into pAAV-Rax-GFP before GFP. Mice carrying a floxed Tspo allele (Tspofl/fl) were used to knock out Tspo in tanycytes with AAV-Rax-Cre-GFP (serotype 1). Tspofl/fl male littermates at the age of 6 weeks were stereotaxically injected with AAV-Rax-GFP (control) or AAV-Rax-Cre-GFP into the 3V (1.2 mm posterior to the bregma, 5.4 mm below the bregma) at a rate of 0.2 μl per min with a microliter syringe (Hamilton). After injection, the syringe was kept in place for 10 min to avoid backflow of the injected vector during syringe retraction. The scalp was sutured, and the animal was placed on a heating pad until full recovery from surgery and then returned to the individual cage. The mice were fed NCD for 3 weeks after surgery and then were fed either NCD or HFD for 4 weeks. At 7 weeks after injection, energy expenditure was measured and the mice were sacrificed for checking TSPO protein level and lipophagy markers. After surgery, food consumption and body weight were measured before the beginning of the dark cycle every 2 d for 7 weeks.
Metabolic measurements
Mice were housed individually with free access to water and NCD or HFD in metabolic chambers of the Comprehensive Lab Animal Monitoring System (Columbus Instruments, Columbus, OH, USA). After a 24 h acclimation period, energy expenditure was measured for 24 h. Heat production, locomotor activity, and the rates of oxygen consumption (VO2), and carbon dioxide production (VCO2) were determined using an Oxymax system (Columbus Instruments). VO2, VCO2, and heat production were measured every 12 min during 24 h and were normalized to body weight. Respiratory exchange ratio (RER) was calculated as VCO2/VO2. Locomotor activity was determined by measuring interruptions in the infrared beams (total number of X- and Z-beam breaks).
Glucose tolerance test and insulin tolerance test
Glucose and insulin tolerance tests were measured in mice after a 16 h or 6 h fast, respectively. The glucose (2 g/kg) or human INS (insulin; 1 U/kg; Sigma-Aldrich, I9278) was injected intraperitoneally and blood glucose concentration was determined using a glucometer (Accu-Check) measuring blood drops obtained from tail vein.
In situ hybridization
In situ hybridization was performed using the ViewRNA ISH tissue assay (Affymetrix, QVT0012). Perfused mouse brains were embedded in paraffin as previously described [Citation90] with some modifications. Serial brain sections (5 μm) obtained from the paraffin-embedded brain blocks were deparaffinized with xylene, boiled in pretreatment solution for 10 min, and digested with Protease QF (Affymetrix) for 10 min at 40°C. Brain sections were then hybridized with mouse anti-sense Tspo (Affymetrix, VB1-19,644) and sense Tspo (Affymetrix, VB1-20,039) Fast Red probes for 2 h at 40°C. Slides were incubated with Label Probe 1-AP Type 1 solution and the Fast Red substrate. After mounting the coverslips, images were acquired under an ECLIPSE 90i light microscope (Nikon, Tokyo, Japan).
SiRNA and plasmid transfection
For siRNA experiments, A2/29 cells (0.3 × 10⁵/ml) were plated onto 12-well plates. After 24 h, cells were transfected with ON-TARGETplus mouse siRNAs (100 nM; Dharmacon): scrambled (D-001810–10-10–05), Tspo (L-040291–02-0005), or Atg5 (L-064838–00-0010), each composed of 4 different siRNAs to avoid off-target effects. The siRNAs were transfected using Lipofectamine 2000 (Invitrogen, 11,668–019) according to the manufacturer’s instructions. After 4 h, the medium was changed and the cells were incubated with fresh medium for 44 h.
For plasmids transfection, A2/29 cells seeded on coverslips were transfected with 1.5 µg of plasmid using TurboFect Transfection Reagent (Thermo Fisher Scientific, R0534) according to the manufacturer’s protocol. The following plasmids were used: pmRFP-GFP-MAP1LC3B (a gift from Dr. Inhee Mook-Jung, Seoul National University), pmRFP-MAP1LC3B (Addgene, 21,075; Tamotsu Yoshimori’s lab), pEGFP-PRKN generated by subcloning of Myc-PRKN from pRK5-Myc-PRKN (Addgene, 17,612; Ted Dawson’s lab) into pEGFP-C1 (Clontech, 6084–1), pCase12-mito (Evrogen, FP995), and pDsRed2-mito (Clontech, 55,858).
Lentivirus-mediated gene expression
The pLKO.1 lentiviral construct containing scrambled shRNA (Sigma-Aldrich, SHC216) or Ampk-targeting shRNAs were used to produce lentiviruses. To avoid off-target effects, 4 different shRNA plasmids targeting Prkaa1 (Sigma-Aldrich, TRCN0000360842 and TRCN0000360770) and Prkaa2 (Sigma-Aldrich, TRCN0000360775 and TRCN0000360848) were used. To produce lentiviruses, the Lenti-X 293T cell line (Clontech, 632,180) was transiently transfected with pLKO.1, the envelope vector pMD2.G (Addgene, 12,259; Didier Trono’s lab), and the packaging vector psPAX2 (Addgene, 12,260; Didier Trono’s lab) using TurboFect Transfection Reagent. Media containing virus were collected at 72 h post-transfection and filtered through a 0.45 μm syringe filter. Lentivirus was concentrated by ultracentrifugation at 40,000 × g for 90 min at 4°C. The pellet fractions were suspended with saline. Finally, the copy number of lentiviruses was measured using a Lenti-X qRT-PCR titration kit (Clontech, 631,235).
A2/29 cells (0.2 × 10⁵/ml) were seeded in 12-well plates. After 12 h, cells were infected with the lentiviruses expressing scrambled shRNA or Prkaa shRNAs in the presence of polybrene (8 μg/ml; Sigma-Aldrich, H9268) for 48 h. To remove uninfected cells, fresh medium containing 10 μg/ml puromycin was added to the cells for 48 h and living cells were subcultured several times in fresh medium.
Western blotting
Cell and hypothalamus samples were lysed in buffer containing 50 mM Tris-HCl, pH 7.4, 250 mM sucrose, 5 mM sodium pyrophosphate, 1 mM EDTA, 1 mM EGTA, 1% Triton X-100 (Sigma-Aldrich, T8787), 0.1 mM benzamidine (Sigma-Aldrich, B6506), 1 mM dithiothreitol (Sigma-Aldrich, 43,816), 0.5 mM phenylmethylsulfonyl fluoride (Sigma-Aldrich, P7626), 50 mM sodium fluoride, protease inhibitor cocktail (Millipore, 535,140), and phosphatase inhibitor cocktail (Sigma-Aldrich, P5726). Protein concentrations were measured by using the Pierce BCA assay kit (Thermo Fisher Scientific, 23,228). Lysates (10 µg) were resolved in SDS-polyacrylamide gels and blotted onto polyvinylidene difluoride membranes (Millipore, IPVH00010) for 35 min at 20 V in transfer buffer containing 25 mM Tris base and 192 mM glycine. The membranes were blocked with 5% skim milk in 1× TBST buffer (20 mM Tris, 125 mM NaCl, 0.1% Tween 20 [Sigma-Aldrich, P1379], pH 7.4) during 1 h and incubated with primary antibodies at room temperature (RT) for 1 h or at 4°C overnight. The membranes were washed three times with 1× TBST and incubated with horseradish peroxidase–linked secondary antibodies. Proteins were visualized with the Supersignal West Pico Chemiluminescent Substrate (Thermo Fisher Scientific, NCI4080KR) or WesternBright ECL (Advansta, K-12,045-D50) according to the manufacturer’s protocol. Band intensities were quantified using Image J software (National Institutes of Health).
ATP assay
A2/29 cells (0.2 × 10⁵/ml) were plated in 12 well plates. After 24 h, the cells were transfected with scrambled or Atg5 siRNA. After 24 h, cells were additionally transfected with scrambled or Tspo siRNA for 48 h. Before harvesting the cells, OL (0.06 mM) or vehicle was added for 4 h. The cells were then lysed in TE buffer (100 mM Tris, 4 mM EDTA, pH 7.5), heated at 95°C for 7 min then centrifuged (18,000 х g at 4°C) for 3 min. ATP levels in lysates were measured using an ATP bioluminescence assay kit (Roche, 11,699,695,001) according to the manufacturer’s protocol and normalized to that of protein content.
Ca2+ imaging
To detect [Ca2+]cyto, cells were grown to 80% confluence on a poly-L-lysine (PLL; Sigma-Aldrich, P4707)-coated coverslip and loaded for 50 min at 37°C with Fluo-3/AM (Invitrogen, F1242). After washing with PBS twice, the coverslip was transferred into a chamber slide and medium was replaced with fresh medium without phenol red. To detect [Ca2+]mito, the Case12-mito plasmid was used, which encodes a fluorescent Ca2+ sensor fused with a mitochondrial targeting sequence. Cells were seeded onto a PLL-coated coverslip and co-transfected with the Case12-mito and DsRed2-mito plasmids using TurboFect Transfection Reagent for 28 h.
After treatment with PK11195 or knockdown of Tspo, [Ca2+]cyto or [Ca2+]mito images were collected using a Zeiss LSM 7 Live or LSM 700 confocal microscope (Carl Zeiss, Oberkochen, Germany). In ATP-applied experiments, 1 mM ATP in medium without phenol red was directly added to the chamber slide during live cell imaging. Images were captured one per second and each peak of fluorescence intensity was normalized by the peak induced by the medium only to subtract noise.
Immunocytochemistry
Cells were grown on PLL-coated coverslips and fixed in 10% neutral phosphate-buffered formalin for 10 min. Cells were permeabilized with 0.01% Triton X-100 and 0.1 M glycine in PBS for 15 min. After washing with PBS, cells were blocked with antibody diluent (Invitrogen, 00–3118) for 10 min. The coverslips were incubated with primary antibodies diluted with antibody diluent in a wet chamber for 1 h and washed with PBS. Then, the cells were incubated with secondary antibodies for 3 h. After washing with PBS three times, Hoechst 33,342 dye (1 μg/ml; Invitrogen, H3570) was added for 10 min. Finally, coverslips were washed and mounted on microscope slides with Prolong Diamond Antifade Mountant (Life Technologies, P36961). Fluorescence images were captured using a Zeiss LSM 780 confocal laser-scanning microscope (Carl Zeiss).
Immunohistochemistry
Mice were deeply anesthetized with a cocktail containing Zoletil 50 and Rompun and then perfused transcardially with PBS, followed by 4% paraformaldehyde in PBS, pH 7.4. Mouse brains were quickly removed, post-fixed in 4% paraformaldehyde for 16 h at 4°C, and transferred to 30% sucrose in PBS. To prepare frozen sections, the brains were embedded in Optimal Cutting Temperature Compound (Leica, 3,801,480), frozen on dry ice, and stored at – 80°C until slicing. Serial coronal sections (10 μm for glass binding and 40 μm for free floating) were cut on a cryostat. The sections were then blocked in PBS with 5% donkey serum (Jackson ImmunoResearch, 017–000-121), 1% bovine serum albumin (Sigma-Aldrich, A6003), and 0.3% Triton X-100 for 2 h at RT, and incubated with primary antibodies diluted in PBS with 5% donkey serum and 0.3% Triton X-100 for 16–18 h at 4°C. For staining for p-AMPK, all solutions contained 50 mM NaF to inhibit phosphatase activity. To visualize primary antibodies, fluorophore-conjugated secondary antibodies were applied in PBS with 5% donkey serum and 0.1% Tween 20 for 90 min at RT. The sections were subsequently incubated for 10 min with 1 μg/ml Hoechst 33,342 in PBS for nuclear staining, and mounted with Vectashield mounting medium (Vector Laboratories, H-1000) on glass slides. Fluorescence images were captured using the Zeiss LSM 780 microscope.
MAP1LC3B puncta in tanycytes infected with Rax-AAVs were quantified using Pixcavator 6.0 software. We only considered MAP1LC3B puncta located in the cytosol of GFP- and VIM-positive tanycytes.
BODIPY 493/503 and lipid spot 610 staining
To stain LDs, 10 µg/ml BODIPY 493/503 (stock: 1 mg/ml in 100% ethanol; Thermo Fisher Scientific, D3922) or 1X Lipid spot 610 (stock: 1000X; Biotium, 70,069) was applied to fixed cells or hypothalamus sections for 20 min in the dark. Fluorescence images were acquired using the Zeiss LSM 780 microscope. Pixel size and number of LDs in confocal images were quantified using Pixcavator 6.0 software. The total number of LDs was divided by the number of nuclei, which was manually counted in each confocal section.
LysoTracker staining
To monitor lysosomes, LysoTracker Red DND-99 (LysoTracker; Invitrogen, L7528) was used. Cells were stained for 30 min with LysoTracker (300 nM) in growth media at 37°C incubator. For the assessment of lysosomal size and number, cells were fixed and analyzed using the Zeiss LSM 780 microscope. Pixel size and number of LysoTracker puncta in confocal images were quantified using Pixcavator 6.0 software. For flow cytometry assay, LysoTracker-stained cells were analyzed using the BD Accuri C6 Cytometer (BD Biosciences, San Jose, CA, USA). BD Accuri C6 software was used for analysis and representation of histograms.
Measurement of TG
TG levels were measured using the Triglyceride Quantification Colorimetric/Fluorometric Kit (BioVision, K622-100) following the manufacturer’s instructions. A2/29 cells were homogenized in solution containing 5% NP-40 (ELPIS biotech, EBA-1029) in water. The lysates were slowly heated to 90°C for 3 min and then cooled down toRT. This process was repeated twice, and samples were centrifuged at 4,000 × g for 2 min to remove insoluble material. 50 µl of samples were mixed with 50 µl of assay buffer containing 0.4 µl of TG probe and 2 µl of TG enzyme mix. Following the addition of lipase, the fluorescence was measured at Ex/Em = 537/587 nm. The concentration of TG was normalized by that of protein.
Metabolomic analysis by GC-MS/MS
Free fatty acids analysis
Cells were extracted with 800 μl of methanol:chloroform:water, 2:1:1 (v:v) containing an internal standard (20 nM D2-oleic acid). Samples were sonicated briefly and centrifuged (10,000 × g at 4°C) for 10 min, and 100 μl of the lower organic phases were transferred to new tubes and evaporated. Samples were reconstituted in 200 μl of hexane (Sigma-Aldrich, 34,859): 5% potassium hydroxide-methanol (Fluka, 03564), 1:1 (v:v), and incubated at RT for 10 min. For esterification/derivatization, 200 μl of BCl3-methanol (12% w/w) was added. The samples were heated at 70°C for 10 min, cooled on ice for 5 min, and then 150 μl of water and 300 μl of hexane were added. Samples were vortexed thoroughly and centrifuged (7,000 × g at RT) for 5 min. The supernatants (hexane phases) were transferred into autosampler vials.
Fatty acids methyl esters (FAMEs) were analyzed using an Agilent 7000B gas chromatograph coupled with a 7000C tandem mass spectrometric detector (Agilent GC-QQQ-MS/MS; Agilent Technologies, Santa Clara, CA, USA) and equipped with an ultra HP-5ms capillary column (30 m × 0.25 μm, i.d., 0.25 μm film thickness, Agilent J&W Scientific). The inlet temperature was set as follows: inlet, 250°C; transfer line, 290°C; the EI (70 eV) ion source, 230°C; the quadrupole, 150°C. The solvent delay was set at 2 min. The gradient was run at a flow rate of 1.2 ml He/min, 4°C/min with 4:1 split mode: 50°C for 1 min, and up to 240°C, equilibration for 10 min. The identification of FAMEs was based on the exact selected ion mass and the retention time of a FAME standard (Supelco 37 component FAME mix). Detected FAMEs were quantified using Agilent MassHunter software (Agilent Technologies).
Amino acids and cholesterol analysis
Cells were extracted with 800 μl of methanol:chloroform:water, 2:1:1 (v:v) containing an internal standard (20 nM 2-isopropylmalic acid [Sigma-Aldrich, 333,115]). Samples were sonicated briefly and centrifuged (10,000 × g at 4°C) for 10 min, and 200 μl of the upper organic phases were transferred to new tubes and evaporated. Samples were derivatized in 100 μl of MSTFA (Sigma-Aldrich, 69,479), and incubated at 100°C for 120 min. The samples were transferred into autosampler vials.
Amino acids and cholesterol were analyzed using an Agilent 7000B gas chromatograph coupled with a 7000C tandem mass spectrometric detector (Agilent GC-QQQ-MS/MS; Agilent Technologies) and equipped with an ultra HP-5ms capillary column (30 m × 0.25 μm, i.d., 0.25 μm film thickness, Agilent J&W Scientific). The inlet temperature was set as follows: inlet, 250°C; transfer line, 290°C; the EI (70 eV) ion source, 230°C; the quadrupole, 150°C. The solvent delay was set at 3.75 min. The gradient was run at a flow rate of 1.2 ml He/min, 10°C/min with 4:1 split mode: 100°C for 2 min, and up to 320°C, equilibration for 10 min. The identification of amino acids was based on the exact selected ion mass and the retention time of an amino acid standard (Supelco 79,248). Cholesterol was identified based on the library NIST14. Amino acids and cholesterol were quantified using Agilent MassHunter software (Agilent Technologies).
Assay of AMP: ATP ratio by UPLC
Cells were rapidly frozen on dry ice and extracted with 300 μl of ice-cold 0.3 M perchloric acid (Sigma-Aldrich, 311,421). The extraction mixture was centrifuged (18,000 × g at 4°C) for 20 min. The supernatant was collected, neutralized to pH 7 with 0.5 M potassium hydroxide, vortexed for 1 min, put on ice for 30 min, and centrifuged (18,000 × g at 4°C) for 20 min to precipitate potassium perchlorate. The supernatant was collected and filtered through a 0.22-μm syringe filter prior to the analysis.
Analysis was performed on an Agilent 1290 UPLC system that included a diode array detector (Agilent Technologies). AMP and ATP were separated on a Shiseido CAPCELL PAK ADME column (100 × 2.1 mm, 3 μm) kept at 30°C in a column oven. The mobile phase consisted of solution A (100 mM potassium dihydrogen phosphate in water) and solution B (100 mM potassium dihydrogen phosphate in 1:9 methanol:water). Both solutions were adjusted to pH 5.8 with potassium hydroxide solution. The gradient program was as follows: 0–2 min, 30% B; 2–7 min, linear gradient from 30% to 50% B; 7–10 min, 50% B; 10–13 min, linear gradient from 50% to 30% B; 13–15 min, 30% B for re-equilibration. The flow rate was 200 μl/min and the injection volume was 10 μl. The absorption wavelength of the detector was set at 254 nm. AMP and ATP were identified and quantified on the basis of the chromatograms of AMP and ATP standards using Agilent ChemStation software (Agilent Technologies).
Real time-PCR
Total RNA from the hypothalamus and A2/29 cells was extracted with TRIzol reagent (Invitrogen, 15,596,018), and its concentration was determined using a NanoDrop spectrophotometer (Thermo Scientific, Waltham, MA, USA). RNA (3 µg) was reverse transcribed using a GoScript Reverse Transcription System (Promega, A5004) as described previously [Citation50]. SYBR Green (TaKaRa Biotechnology, RR820A) was used for quantitative PCR estimation of the expression of Tspo, Agrp, Npy, Pomc, and Rax genes in a CFX 96 Real-Time system (Bio-Rad, Hercules, CA, USA). The following primers were synthesized by Integrated DNA Technologies: Tspo forward, 5ʹ-TGCAGAAACCCTCTTGGCATC-3ʹ; Tspo reverse, 5ʹ-GAAACCTCCCAGCTCTTTCC-3ʹ; Agrp forward, 5ʹ-CTGCAGACCGAGCAGAAGA-3ʹ; Agrp reverse, 5ʹ-TGCGACTACAGAGGTTCGTG-3ʹ; Npy forward, 5ʹ-CAGAAAACGCCCCCAGAA-3ʹ; Npy reverse, 5ʹ-AAAAGTCGGGAGAACAAGTTTCATT-3ʹ; Pomc forward, 5ʹ-GAACAGCCCCTGACTGAAAA-3ʹ; Pomc reverse, 5ʹ-ACGTTGGGGTACACCTTCAC-3ʹ; Rax forward, 5ʹ -TGGACCGACCCATCCATTTG-3ʹ; Rax reverse, 5ʹ-AGGTGTCTAGGATGCCGTCT-3ʹ; Gapdh forward, 5ʹ-ATCACTGCCACCCAGAAGAC-3ʹ and Gapdh reverse, 5ʹ-ACACATTGGGGGTAGGAACA-3ʹ. All expression levels were normalized to that of Gapdh as an endogenous control. All assays were performed in triplicate.
Statistical analysis
Statistical analysis was performed using Prism 5 software (GraphPad). All results were represented as mean ± standard error of the mean (SEM). Statistical significance was determined by Student’s t-test or two-way ANOVA with Bonferroni post-tests. A P value of <0.05 was considered statistically significant.
Supplemental Material
Download MS Power Point (5.6 MB)Supplemental Material
Download MS Word (34.3 KB)Disclosure statement
No potential conflict of interest was reported by the authors.
Supplementary material
Supplemental data for this article can be accessed here.
Additional information
Funding
References
- Schwartz MW, Woods SC, Porte D Jr. et al. Central nervous system control of food intake. Nature. 2000 Apr 06;404(6778):661–671. PubMed PMID: 10766253.
- Waterson MJ, Horvath TL. Neuronal regulation of energy homeostasis: beyond the hypothalamus and feeding. Cell Metab. 2015 Dec 1;22(6):962–970. PubMed PMID: 26603190.
- Garcia-Caceres C, Fuente-Martin E, Argente J, et al. Emerging role of glial cells in the control of body weight. Mol Metab. 2012;1(1–2):37–46. PubMed PMID: 24024117; PubMed Central PMCID: PMC3757650.
- Buckman LB, Ellacott KL. The contribution of hypothalamic macroglia to the regulation of energy homeostasis. Front Syst Neurosci. 2014;8:212. PubMed PMID: 25374514; PubMed Central PMCID: PMC4206078.
- Ebling FJP, Lewis JE. Tanycytes and hypothalamic control of energy metabolism. Glia. 2018 Jun;66(6):1176–1184. PubMed PMID: 29411421.
- Bolborea M, Dale N. Hypothalamic tanycytes: potential roles in the control of feeding and energy balance. Trends Neurosci. 2013 Feb;36(2):91–100. PubMed PMID: 23332797; PubMed Central PMCID: PMCPMC3605593.
- Elizondo-Vega R, Cortes-Campos C, Barahona MJ, et al. The role of tanycytes in hypothalamic glucosensing. J Cell Mol Med. 2015 Jul;19(7):1471–1482. PubMed PMID: 26081217; PubMed Central PMCID: PMCPMC4511346.
- Lazutkaite G, Solda A, Lossow K, et al. Amino acid sensing in hypothalamic tanycytes via umami taste receptors. Mol Metab. 2017 Nov;6(11):1480–1492. PubMed PMID: 29107294; PubMed Central PMCID: PMCPMC5681271.
- Balland E, Dam J, Langlet F, et al. Hypothalamic tanycytes are an ERK-gated conduit for leptin into the brain. Cell Metab. 2014 Feb 4;19(2):293–301. PubMed PMID: 24506870; PubMed Central PMCID: PMCPMC3936883.
- Gao Y, Tschop MH, Luquet S. Hypothalamic tanycytes: gatekeepers to metabolic control. Cell Metab. 2014 Feb 4;19(2):173–175. PubMed PMID: 24506860.
- Cortes-Campos C, Elizondo R, Llanos P, et al. MCT expression and lactate influx/efflux in tanycytes involved in glia-neuron metabolic interaction. PloS One. 2011 Jan 28;6(1):e16411. PubMed PMID: 21297988; PubMed Central PMCID: PMC3030577.
- Langlet F, Levin BE, Luquet S, et al. Tanycytic VEGF-A boosts blood-hypothalamus barrier plasticity and access of metabolic signals to the arcuate nucleus in response to fasting. Cell Metab. 2013 Apr 2;17(4):607–617. PubMed PMID: 23562080; PubMed Central PMCID: PMCPMC3695242.
- Braestrup C, Squires RF. Specific benzodiazepine receptors in rat brain characterized by high-affinity (3H)diazepam binding. Proc Natl Acad Sci U S A. 1977 Sep;74(9):3805–3809. PubMed PMID: 20632; PubMed Central PMCID: PMCPMC431738.
- Falchi AM, Battetta B, Sanna F, et al. Intracellular cholesterol changes induced by translocator protein (18 kDa) TSPO/PBR ligands. Neuropharmacology. 2007 Aug;53(2):318–329. PubMed PMID: 17631921.
- Fan J, Campioli E, Midzak A, et al. Conditional steroidogenic cell-targeted deletion of TSPO unveils a crucial role in viability and hormone-dependent steroid formation. Proc Natl Acad Sci U S A. 2015 Jun 9;112(23):7261–7266. PubMed PMID: 26039990; PubMed Central PMCID: PMCPMC4466704.
- Papadopoulos V, Mukhin AG, Costa E, et al. The peripheral-type benzodiazepine receptor is functionally linked to Leydig cell steroidogenesis. J Biol Chem. 1990 Mar 5;265(7):3772–3779. PubMed PMID: 2154488.
- Azarashvili T, Grachev D, Krestinina O, et al. The peripheral-type benzodiazepine receptor is involved in control of Ca2+-induced permeability transition pore opening in rat brain mitochondria. Cell Calcium. 2007 Jul;42(1):27–39. PubMed PMID: 17174393.
- Sileikyte J, Petronilli V, Zulian A, et al. Regulation of the inner membrane mitochondrial permeability transition by the outer membrane translocator protein (peripheral benzodiazepine receptor). J Biol Chem. 2011 Jan 14;286(2):1046–1053. PubMed PMID: 21062740; PubMed Central PMCID: PMCPMC3020711.
- Veenman L, Shandalov Y, Gavish M. VDAC activation by the 18 kDa translocator protein (TSPO), implications for apoptosis. J Bioenerg Biomembr. 2008 Jun;40(3):199–205. PubMed PMID: 18670869.
- Lee JW, Kim LE, Shim HJ, et al. A translocator protein 18 kDa ligand, Ro5-4864, inhibits ATP-induced NLRP3 inflammasome activation. Biochem Biophys Res Commun. 2016 Jun 3;474(3):587–593. PubMed PMID: 27103438.
- Bae KR, Shim HJ, Balu D, et al. Translocator protein 18 kDa negatively regulates inflammation in microglia. J Neuroimmune Pharmacol. 2014 Jun;9(3):424–437. PubMed PMID: 24687172.
- Chen MK, Guilarte TR. Translocator protein 18 kDa (TSPO): molecular sensor of brain injury and repair. Pharmacol Ther. 2008 Apr;118(1):1–17. PubMed PMID: 18374421; PubMed Central PMCID: PMCPMC2453598.
- Batarseh A, Papadopoulos V. Regulation of translocator protein 18 kDa (TSPO) expression in health and disease states. Mol Cell Endocrinol. 2010 Oct 7;327(1–2):1–12. PubMed PMID: 20600583; PubMed Central PMCID: PMCPMC2922062.
- Gavish M, Bachman I, Shoukrun R, et al. Enigma of the peripheral benzodiazepine receptor. Pharmacol Rev. 1999 Dec;51(4):629–650. PubMed PMID: 10581326.
- Tu LN, Zhao AH, Hussein M, et al. Translocator protein (TSPO) affects mitochondrial fatty acid oxidation in steroidogenic cells. Endocrinology. 2016 Mar;157(3):1110–1121. PubMed PMID: 26741196; PubMed Central PMCID: PMCPMC4769361.
- Levine B, Klionsky DJ. Development by self-digestion: molecular mechanisms and biological functions of autophagy. Dev Cell. 2004 Apr;6(4):463–477. PubMed PMID: 15068787.
- Singh R, Kaushik S, Wang Y, et al. Autophagy regulates lipid metabolism. Nature. 2009 Apr 30;458(7242):1131–1135. PubMed PMID: 19339967; PubMed Central PMCID: PMCPMC2676208.
- Schulze RJ, Sathyanarayan A, Mashek DG. Breaking fat: The regulation and mechanisms of lipophagy. Biochim Biophys Acta Mol Cell Biol Lipids. 2017 Oct;1862(10 Pt B):1178–1187. PubMed PMID: 28642194; PubMed Central PMCID: PMCPMC5595645.
- Singh R, Cuervo AM. Lipophagy: connecting autophagy and lipid metabolism. Int J Cell Biol. 2012;2012:282041. PubMed PMID: 22536247; PubMed Central PMCID: PMCPMC3320019.
- Liu K, Czaja MJ. Regulation of lipid stores and metabolism by lipophagy. Cell Death Differ. 2013 Jan;20(1):3–11. PubMed PMID: 22595754; PubMed Central PMCID: PMCPMC3524634.
- Dong H, Czaja MJ. Regulation of lipid droplets by autophagy. Trends Endocrinol Metab. 2011 Jun;22(6):234–240. PubMed PMID: 21419642; PubMed Central PMCID: PMCPMC3118855.
- Khaldoun SA, Emond-Boisjoly MA, Chateau D, et al. Autophagosomes contribute to intracellular lipid distribution in enterocytes. Mol Biol Cell. 2014 Jan;25(1):118–132. PubMed PMID: 24173715; PubMed Central PMCID: PMCPMC3873883.
- Tatsumi T, Takayama K, Ishii S, et al. Forced lipophagy reveals that lipid droplets are required for early embryonic development in mouse. Development. 2018 Feb 23; 145(4). PubMed PMID: 29475974
- Riffelmacher T, Clarke A, Richter FC, et al. Autophagy-dependent generation of free fatty acids is critical for normal neutrophil differentiation. Immunity. 2017 Sep 19;47(3):466–480 e5. PubMed PMID: 28916263; PubMed Central PMCID: PMCPMC5610174.
- Ouimet M, Franklin V, Mak E, et al. Autophagy regulates cholesterol efflux from macrophage foam cells via lysosomal acid lipase. Cell Metab. 2011 Jun 8;13(6):655–667. PubMed PMID: 21641547; PubMed Central PMCID: PMCPMC3257518.
- Sathyanarayan A, Mashek MT, Mashek DG. ATGL promotes autophagy/lipophagy via SIRT1 to control hepatic lipid droplet catabolism. Cell Rep. 2017 Apr 4;19(1):1–9. PubMed PMID: 28380348; PubMed Central PMCID: PMCPMC5396179.
- Minami S, Yamamoto T, Takabatake Y, et al. Lipophagy maintains energy homeostasis in the kidney proximal tubule during prolonged starvation. Autophagy. 2017 Oct 3;13(10):1629–1647. PubMed PMID: 28813167; PubMed Central PMCID: PMCPMC5640178.
- Kaushik S, Rodriguez-Navarro JA, Arias E, et al. Autophagy in hypothalamic AgRP neurons regulates food intake and energy balance. Cell Metab. 2011 Aug 3;14(2):173–183. PubMed PMID: 21803288; PubMed Central PMCID: PMCPMC3148494.
- Zubiete-Franco I, Garcia-Rodriguez JL, Martinez-Una M, et al. Methionine and S-adenosylmethionine levels are critical regulators of PP2A activity modulating lipophagy during steatosis. J Hepatol. 2016 Feb;64(2):409–418. PubMed PMID: 26394163; PubMed Central PMCID: PMCPMC4718902.
- Lin YC, Chang PF, Lin HF, et al. Variants in the autophagy-related gene IRGM confer susceptibility to non-alcoholic fatty liver disease by modulating lipophagy. J Hepatol. 2016 Dec;65(6):1209–1216. PubMed PMID: 27417217.
- Rodriguez EM, Blazquez JL, Pastor FE, et al. Hypothalamic tanycytes: a key component of brain-endocrine interaction. Int Rev Cytol. 2005;247:89–164. PubMed PMID: 16344112.
- Mayer CM, Fick LJ, Gingerich S, et al. Hypothalamic cell lines to investigate neuroendocrine control mechanisms. Front Neuroendocrinol. 2009 Aug;30(3):405–423. PubMed PMID: 19341762.
- Miranda-Angulo AL, Byerly MS, Mesa J, et al. Rax regulates hypothalamic tanycyte differentiation and barrier function in mice. J Comp Neurol. 2014 Mar;522(4):876–899. PubMed PMID: 23939786; PubMed Central PMCID: PMCPMC3947139.
- Chen R, Wu X, Jiang L, et al. Single-cell RNA-SEQ reveals hypothalamic cell diversity. Cell Rep. 2017 Mar 28;18(13):3227–3241. PubMed PMID: 28355573; PubMed Central PMCID: PMCPMC5782816.
- Hardie DG. AMPK: a key regulator of energy balance in the single cell and the whole organism. Int J Obes (Lond). 2008 Sep;32(Suppl 4):S7–12. PubMed PMID: 18719601.
- Srivastava P, Kaul A, Ojha H, et al. Design, synthesis and biological evaluation of methyl-2-(2-(5-bromo benzoxazolone)acetamido)3-(1H-indol-3-yl)propanoate: TSPO ligand for SPECT. RSC Adv. 2016;6(115):114491–114499. PubMed PMID: WOS:000391457400072; English.
- Totis M, Kremers P, Batt AM, et al. Induction of liver microsomal cytochrome P-450 isozymes by 1-(2-chlorophenyl)-N-methyl-N-(1-methylpropyl)-3-isoquinoline carboxamide. Xenobiotica. 1989 Aug;19(8):857–866. PubMed PMID: 2815828.
- Woods A, Dickerson K, Heath R, et al. Ca2+/calmodulin-dependent protein kinase kinase-beta acts upstream of AMP-activated protein kinase in mammalian cells. Cell Metab. 2005 Jul;2(1):21–33. PubMed PMID: 16054096.
- Hoyer-Hansen M, Bastholm L, Szyniarowski P, et al. Control of macroautophagy by calcium, calmodulin-dependent kinase kinase-beta, and Bcl-2. Mol Cell. 2007 Jan 26;25(2):193–205. PubMed PMID: 17244528.
- Oh TS, Cho H, Cho JH, et al. Hypothalamic AMPK-induced autophagy increases food intake by regulating NPY and POMC expression. Autophagy. 2016 Nov;12(11):2009–2025. PubMed PMID: 27533078; PubMed Central PMCID: PMCPMC5103348.
- Hardie DG. AMPK and autophagy get connected. Embo J. 2011 Feb 16;30(4):634–635. PubMed PMID: 21326174; PubMed Central PMCID: PMCPMC3041958.
- Egan DF, Shackelford DB, Mihaylova MM, et al. Phosphorylation of ULK1 (hATG1) by AMP-activated protein kinase connects energy sensing to mitophagy. Science. 2011 Jan 28;331(6016):456–461. PubMed PMID: 21205641; PubMed Central PMCID: PMCPMC3030664.
- Tanida I, Ueno T, Kominami E. LC3 conjugation system in mammalian autophagy. Int J Biochem Cell Biol. 2004 Dec;36(12):2503–2518. PubMed PMID: 15325588.
- Bjorkoy G, Lamark T, Pankiv S, et al. Monitoring autophagic degradation of p62/SQSTM1. Methods Enzymol. 2009;452:181–197. PubMed PMID: 19200883.
- Nazarko VY, Zhong Q. ULK1 targets Beclin-1 in autophagy. Nat Cell Biol. 2013 Jul;15(7):727–728. PubMed PMID: 23817237; PubMed Central PMCID: PMCPMC4442023.
- Kletsas D, Li W, Han Z, et al. Peripheral-type benzodiazepine receptor (PBR) and PBR drug ligands in fibroblast and fibrosarcoma cell proliferation: role of ERK, c-Jun and ligand-activated PBR-independent pathways. Biochem Pharmacol. 2004 May 15;67(10):1927–1932. PubMed PMID: 15130769.
- Gonzalez-Polo RA, Carvalho G, Braun T, et al. PK11195 potently sensitizes to apoptosis induction independently from the peripheral benzodiazepin receptor. Oncogene. 2005 Nov 17;24(51):7503–7513. PubMed PMID: 16091749.
- Hans G, Wislet-Gendebien S, Lallemend F, et al. Peripheral benzodiazepine receptor (PBR) ligand cytotoxicity unrelated to PBR expression. Biochem Pharmacol. 2005 Mar 1;69(5):819–830. PubMed PMID: 15710359.
- Klionsky DJ, Abdelmohsen K, Abe A, et al. Guidelines for the use and interpretation of assays for monitoring autophagy (3rd edition). Autophagy. 2016;12(1):1–222. PubMed PMID: 26799652; PubMed Central PMCID: PMCPMC4835977.
- Kimura S, Noda T, Yoshimori T. Dissection of the autophagosome maturation process by a novel reporter protein, tandem fluorescent-tagged LC3. Autophagy. 2007 Sep-Oct;3(5):452–460. PubMed PMID: 17534139.
- Zhou J, Tan SH, Nicolas V, et al. Activation of lysosomal function in the course of autophagy via mTORC1 suppression and autophagosome-lysosome fusion. Cell Res. 2013 Apr;23(4):508–523. PubMed PMID: 23337583; PubMed Central PMCID: PMCPMC3616426.
- Granatiero V, Giorgio V, Cali T, et al. Reduced mitochondrial Ca(2+) transients stimulate autophagy in human fibroblasts carrying the 13514A>G mutation of the ND5 subunit of NADH dehydrogenase. Cell Death Differ. 2016 Feb;23(2):231–241. PubMed PMID: 26206091; PubMed Central PMCID: PMCPMC4716301.
- Narendra D, Tanaka A, Suen DF, et al. Parkin is recruited selectively to impaired mitochondria and promotes their autophagy. J Cell Biol. 2008 Dec 1;183(5):795–803. PubMed PMID: 19029340; PubMed Central PMCID: PMCPMC2592826.
- Akmayev IG, Popov AP. Morphological aspects of the hypothalamic-hypophyseal system. VII. The tanycytes: Their relation to the hypophyseal adrenocorticotrophic function. An ultrastructural study. Cell Tissue Res. 1977 May 16;180(2):263–282. PubMed PMID: 194701.
- Pak T, Yoo S, Miranda-Angulo AL, et al. Rax-CreERT2 knock-in mice: a tool for selective and conditional gene deletion in progenitor cells and radial glia of the retina and hypothalamus. PloS One. 2014;9(4):e90381. PubMed PMID: 24699247; PubMed Central PMCID: PMCPMC3974648.
- Hofmann K, Lamberz C, Piotrowitz K, et al. Tanycytes and a differential fatty acid metabolism in the hypothalamus. Glia. 2017 Feb;65(2):231–249. PubMed PMID: 27726181.
- Gao Q, Goodman JM. The lipid droplet-a well-connected organelle. Front Cell Dev Biol. 2015;3:49. PubMed PMID: 26322308; PubMed Central PMCID: PMCPMC4533013.
- Weidberg H, Shvets E, Elazar Z. Lipophagy: selective catabolism designed for lipids. Dev Cell. 2009 May;16(5):628–630. PubMed PMID: 19460339.
- Da Pozzo E, Giacomelli C, Barresi E, et al. Targeting the 18-kDa translocator protein: recent perspectives for neuroprotection. Biochem Soc Trans. 2015 Aug;43(4):559–565. PubMed PMID: 26551693.
- Gatliff J, East D, Crosby J, et al. TSPO interacts with VDAC1 and triggers a ROS-mediated inhibition of mitochondrial quality control. Autophagy. 2014;10(12):2279–2296. PubMed PMID: 25470454; PubMed Central PMCID: PMCPMC4502750.
- Owen DR, Matthews PM. Imaging brain microglial activation using positron emission tomography and translocator protein-specific radioligands. Int Rev Neurobiol. 2011;101:19–39. PubMed PMID: 22050847.
- Lacapere JJ, Delavoie F, Li H, et al. Structural and functional study of reconstituted peripheral benzodiazepine receptor. Biochem Biophys Res Commun. 2001 Jun 8;284(2):536–541. PubMed PMID: 11394915.
- Campanella M, Szabadkai G, Rizzuto R. Modulation of intracellular Ca2+ signalling in HeLa cells by the apoptotic cell death enhancer PK11195. Biochem Pharmacol. 2008 Dec 1;76(11):1628–1636. PubMed PMID: 18929543; PubMed Central PMCID: PMCPMC2844953.
- Green AC, Dowdall MJ, Richardson CM. ATP acting on P2Y receptors triggers calcium mobilization in Schwann cells at the neuroelectrocyte junction in skate. Neuroscience. 1997 Sep;80(2):635–651. PubMed PMID: 9284364.
- Troadec JD, Thirion S, Petturiti D, et al. ATP acting on P2Y receptors triggers calcium mobilization in primary cultures of rat neurohypophysial astrocytes (pituicytes). Pflugers Arch. 1999 Apr;437(5):745–753. PubMed PMID: 10087153.
- James G, Butt AM. P2X and P2Y purinoreceptors mediate ATP-evoked calcium signalling in optic nerve glia in situ. Cell Calcium. 2001 Oct;30(4):251–259. PubMed PMID: 11587549.
- Layhadi JA, Turner J, Crossman D, et al. ATP Evokes Ca(2+) responses and CXCL5 secretion via P2X4 receptor activation in human monocyte-derived macrophages. J Immunol. 2018 Feb 1;200(3):1159–1168. PubMed PMID: 29255078; PubMed Central PMCID: PMCPMC5784824.
- Ostuni MA, Ducroc R, Peranzi G, et al. Translocator protein (18 kDa) ligand PK 11195 induces transient mitochondrial Ca2+ release leading to transepithelial Cl- secretion in HT-29 human colon cancer cells. Biol Cell. 2007 Nov;99(11):639–647. PubMed PMID: 17561806.
- Tamse C, Lu X, Mortel E. et al. The peripheral benzodiazepine receptor modulates ca2+ transport through the vdac in rat heart mitochondria. Int J Clin Basic Cardiol. 2008;11(1):24–29.
- Gatliff J, East DA, Singh A, et al. A role for TSPO in mitochondrial Ca(2+) homeostasis and redox stress signaling. Cell Death Dis. 2017 Jun 22;8(6):e2896. PubMed PMID: 28640253; PubMed Central PMCID: PMCPMC5520880.
- Joo HK, Lee YR, Lim SY, et al. Peripheral benzodiazepine receptor regulates vascular endothelial activations via suppression of the voltage-dependent anion channel-1. FEBS Lett. 2012 May 7;586(9):1349–1355. PubMed PMID: 22616995.
- Joo HK, Lee YR, Kang G, et al. The 18-kDa translocator protein inhibits vascular cell adhesion molecule-1 expression via inhibition of mitochondrial reactive oxygen species. Mol Cells. 2015 Dec;38(12):1064–1070. PubMed PMID: 26608360; PubMed Central PMCID: PMCPMC4696997.
- Gut P, Baeza-Raja B, Andersson O, et al. Whole-organism screening for gluconeogenesis identifies activators of fasting metabolism. Nat Chem Biol. 2013 Feb;9(2):97–104. PubMed PMID: 23201900; PubMed Central PMCID: PMCPMC3552031.
- Goodman T, Hajihosseini MK. Hypothalamic tanycytes-masters and servants of metabolic, neuroendocrine, and neurogenic functions. Front Neurosci. 2015;9:387. PubMed PMID: 26578855; PubMed Central PMCID: PMCPMC4624852.
- Kalsbeek A, Bruinstroop E, Yi CX, et al. Hypothalamic control of energy metabolism via the autonomic nervous system. Ann N Y Acad Sci. 2010 Nov;1212:114–129. PubMed PMID: 21070249.
- Roh E, Song DK, Kim MS. Emerging role of the brain in the homeostatic regulation of energy and glucose metabolism. Exp Mol Med. 2016 Mar 11;48:e216. PubMed PMID: 26964832; PubMed Central PMCID: PMCPMC4892882.
- Elizondo-Vega R, Cortes-Campos C, Barahona MJ, et al. Inhibition of hypothalamic MCT1 expression increases food intake and alters orexigenic and anorexigenic neuropeptide expression. Sci Rep. 2016 Sep 28;6:33606. PubMed PMID: 27677351; PubMed Central PMCID: PMCPMC5039692.
- Frayling C, Britton R, Dale N. ATP-mediated glucosensing by hypothalamic tanycytes. J Physiol. 2011 May 1;589(Pt 9):2275–2286. PubMed PMID: 21486800; PubMed Central PMCID: PMCPMC3098703.
- Yang L, Qi Y, Yang Y. Astrocytes control food intake by inhibiting AGRP neuron activity via adenosine A1 receptors. Cell Rep. 2015 May 5;11(5):798–807. PubMed PMID: 25921535.
- Yoo SJ, Lee JH, Kim SY, et al. Differential spatial expression of peripheral olfactory neuron-derived BACE1 induces olfactory impairment by region-specific accumulation of beta-amyloid oligomer. Cell Death Dis. 2017 Aug 10;8(8):e2977. PubMed PMID: 28796251; PubMed Central PMCID: PMCPMC5596540.