
ABSTRACT
AKT/PKB is downregulated by the ubiquitin-proteasome system (UPS), which plays a key role in cell survival and tumor progression in various types of cancer. The objective of this study was to determine the relationship between the sequential ubiquitination of lysine residues K284 to K214 in AKT and R-HSPA5 (the arginylated form of HSPA5), which contribute to the autophagic/lysosomal degradation of AKT when impaired proteasomal activity induces cellular stress. Results show that proteasome inhibitors (PIs) increased ATE1 (arginyltransferase 1)-mediated R-HSPA5 levels in a reactive oxygen species (ROS)-dependent manner. Further, binding of fully ubiquitinated AKT with R-HSPA5 induced AKT degradation via the autophagy-lysosome pathway. Specifically, the K48 (Lys48)-linked ubiquitinated form of AKT was selectively degraded in the lysosome with R-HSPA5. The deubiquitinase, USP7 (ubiquitin specific peptidase 7), prevented AKT degradation by inhibiting AKT ubiquitination via interaction with AKT. MUL1 (mitochondrial ubiquitin ligase activator of NFKB 1) also played a vital role in the lysosomal degradation of AKT by sequentially ubiquitinating AKT residues K284 to K214 for R-HSPA5-mediated autophagy. Consistent with this finding, despite HSPA5 arginylation, AKT was not degraded in mul1 KO cells. These results suggest that MUL1-mediated sequential ubiquitination of K284 to K214 may serve as a novel mechanism by which AKT is designated for lysosomal degradation. Moreover, binding of R-HSPA5 with fully ubiquitinated AKT is required for the autophagic/lysosomal degradation of AKT. Thus, modulating the MUL1-mediated non-proteasomal proteolysis mechanisms, such as sequential ubiquitination, may prove to be a novel therapeutic approach for cancer treatment.
Abbreviations: AKT1: thymoma viral proto-oncogene 1; ATE1: arginyltransferase 1; ATG5: autophagy related 5; CASP3: caspase 3; EGFP: enhanced green fluorescent protein; GAPDH: glyceraldehyde-3-phosphate dehydrogenase; GSK3B; glycogen synthase kinase 3 beta; HA: hemagglutinin; HSPA5/GRP78/BIP: heat shock protein 5; LAMP1: lysosomal-associated membrane protein 1; MAP1LC3B: microtubule-associated protein 1 light chain 3 beta; MEF: mouse embryonic fibroblast; MUL1: mitochondrial ubiquitin ligase activator of NFKB1; NAC: N-acetylcysteine; NEK2: NIMA (never in mitosis gene a)-related expressed kinase 2; NH4Cl: ammonium chloride; PARP1: poly(ADP-ribose) polymerase family, member 1; PI: proteasome inhibitor; R-HSPA5: arginylated HSPA5; ROS: reactive oxygen species; SQSTM1: sequestome 1; Ub: ubiquitin; USP7: ubiquitin specific peptidase 7.
Introduction
The ubiquitin-proteasome system (UPS) is an intricate, quality control pathway that degrades misfolded proteins and maintains protein homeostasis in eukaryotic cells [Citation1]. With the help of chaperone proteins that mediate substrate recognition, E3 ligase transfers ubiquitin to lysine side chains of the target substrate [Citation2], with K48 (Lys48)-linked ubiquitin chains accounting for the most common signal used to target proteins for proteasomal [Citation3] or autophagy-mediated degradation [Citation4]. In addition, atypical or mixed chains target substrates for selective autophagic degradation [Citation5]; therefore, proteasome inhibitors (PIs), such as bortezomib and carfilzomib, have been studied for as potential therapeutics for various human diseases [Citation6].
AKT/PKB, specifically, is a serine/threonine kinase that plays a vital role in cell survival, motility, and proliferation [Citation7]. Aberrant AKT activation promotes the growth and survival of tumor cells, with constitutively activated AKT observed in many types of human cancer [Citation8]. Aberrant AKT signaling can initiate not only tumor development but also confer resistance to conventional chemotherapy [Citation9]; therefore, AKT has been proposed as a potential target for cancer therapy [Citation7,Citation9].
AKT is subject to multiple post-translational modifications (PTMs) including phosphorylation [Citation10], sumoylation [Citation11], acetylation [Citation12], and ubiquitination [Citation13]. AKT ubiquitination plays a prominent role in inhibiting tumor cell survival [Citation14]. Further, a previous study demonstrated that MUL1/MULAN/GIDE/MAPL might negatively regulate AKT via the UPS [Citation15], and therefore, not surprisingly, MUL1 has been found to be suppressed in some cancers [Citation16,Citation17]. In an earlier study, we showed that MUL1 contributes to the progression of head and neck cancer by negatively regulating AKT [Citation16] or HSPA5/GRP78/BiP (heat shock protein 5), also known as [Citation17]. Moreover, MUL1 has been reported to induce K48-linked ubiquitination of AKT at K284, thereby inhibiting tumor cell proliferation and survival [Citation15]. Although the K48-linked ubiquitination of AKT promotes proteasomal degradation, it is unclear whether ubiquitination can also mediate the non-proteasomal degradation of AKT.
HSPA5 also plays a significant role in the unfolded protein response (UPR) [Citation18,Citation19] and protects the cells from various cellular stressors, such as reactive oxygen species (ROS) [Citation20]. In particular, HSPA5 is arginylated by ATE1 (arginyltransferase 1), which plays a crucial role in the clearance of aggregated proteins decorated with polyubiquitin through their interaction with SQSTM1/p62 (sequestosome 1) of stressed cells [Citation21]. However, the role of R-HSPA5 (arginylated HSPA5) in processing unfolded proteins for clearance has not been well-characterized.
In the present study, we report the lysosomal degradation of AKT and the essential role of R-HSPA5 in this activity. Moreover, we show that MUL1, an E3 ligase, can induce the sequential ubiquitination of amino acids K284 to K214 in AKT. Lastly, we show that the fully ubiquitinated form of AKT is targeted for lysosomal degradation through a novel proteolytic mechanism involving its interaction with R-HSPA5. These findings may suggest a new therapeutic approach to control various human diseases such as cancer.
Results
Proteasomal inhibitors (PIs) induce the lysosomal degradation of AKT
PTMs such as K48-linked ubiquitination, serve as critical steps in the proteasomal degradation of AKT [Citation14,Citation15,Citation22]. To determine if PTMs also modulate the non-proteasomal degradation of AKT, we treated JJN3 s, a myeloma cell line, with several PIs, including bortezomib, lactacystin, epoxomicin, and MG132, which are used to treat blood cancers, including multiple myeloma [Citation23]. We found that bortezomib decreased AKT protein levels in JJN3 cells and other cancer cell lines () and S1A, respectively). Further, both 1st- and 2nd-generation PIs reduced AKT protein levels ()). AKT downregulation was associated with apoptosis in a PI treatment- and time-dependent manner. By 4 h post-treatment, p-AKT expression was lower than pretreatment levels, while after 24 h, PIs significantly decreased the expression both of p-AKT and AKT ()). Also, in addition to their effect in blood cancer cell lines, bortezomib downregulated AKT in patient-derived primary cancer cells ()).
Figure 1. Proteasomal inhibition induces the lysosomal degradation of AKT. (a) The effect of first-generation proteasome inhibitors (PIs) on AKT levels. Representative western blot analysis of myeloma cells (JJN3) incubated with 10 nM of the first-generation proteasome inhibitors, bortezomib, lactacystin, epoxomicin, or MG132 for 24 h. (b) Second-generation PIs downregulate AKT levels. Representative western blot analysis of cells incubated with second-generation PIs, carfilzomib (10 nM), ixazomib (40 nM), oprozomib (25 nM), and delanzomib (20 nM), for 24 h. (c) The temporal effects of bortezomib on AKT levels in JJN3 cells. Representative western blot analysis of JJN3 cells incubated with 10 nM bortezomib, for indicated times. (d) The effect of 10 nM bortezomib on AKT levels in primary cancer cells. Patient-derived, primary cancer cells were treated with 10 nM bortezomib for 24 h and evaluated by western blot analysis. (n = 4 independent experiments). Data are means ± SD. Asterisks indicate statistically significant differences (*P < 0.05). (e) Lysosome inhibition prevents PI-induced AKT degradation. Representative western blot analysis of OPM2 cells pretreated with the lysosome inhibitors, E-64 (35 μM), NH4Cl (25 mM), bafilomycin (200 nM), or chloroquine (50 μM), for 1 h, and then incubated with 10 nM bortezomib for 24 h. (f) Proteasome inhibition quickly affects lysosome activation in JJN3 cells. JJN3 cells were incubated with 10 nM bortezomib for the indicated times, and lysosomal activity was measured by FACS analysis. Data represent the mean ± SD of three independent experiments; *P < 0.05. (g) The effects of lysosome inhibition on PI-induced colocalization of LAMP1 and AKT by confocal microscopy. RPMI8226 cells were pretreated with 50 μM chloroquine for 1 h, and then incubated with 10 nM bortezomib for an additional 8 h. Cells were fixed and labeled with anti-LAMP1 (red) or anti-AKT (green) antibodies, and images were captured. Yellow = merge/colocalization. Larger white boxes in the images are enlargements of the area indicated by the smaller white boxes; scale bars: 10 μm. (h) Quantification of the colocalization of LAMP1 and AKT. Merged images from Figure 1(g) were analyzed for LAMP1:AKT colocalization using NIS Elements software and Pearson’s correlation coefficient. Data represent the mean ± SD of 10 randomly selected cells per condition; *P < 0.05. (i) PIs induce the accumulation of AKT aggregates in a PI dose-dependent manner. JJN3 cells were incubated with bortezomib at the indicated concentrations and for the indicated times prior to extracting the proteins and separating them into Triton X-100 soluble and insoluble fractions. Ubiquitin blot was used as an aggregated protein fraction control. (j) Lysosome inhibition prevents PI-induced AKT degradation in patient samples. Primary, patient-derived, multiple myeloma cells were pretreated with 50 μM chloroquine for 1 h, then incubated with 10 nM bortezomib for 12 h before p-AKT and AKT levels were assessed by western blot analysis. GAPDH was used as a loading control. Blots (described in Fig. S1L) were scanned, and protein levels were quantified. Data represent the mean ± SD of four independent experiments; *P < 0.05
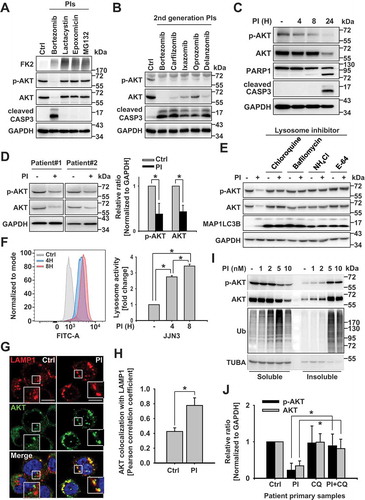
PTMs can induce either proteasomal or lysosomal degradation of proteins [Citation24]; however, it is currently unclear how cells decide whether or not to commit to degradation. Certain proteins become degraded by lysosomes via autophagy [Citation25,Citation26]; however, the specific proteolytic route selected for a given protein quality control target remains unclear. Notably, although PIs decreased AKT protein levels, there was no change in the gene expression level (Fig. S1B). Based on these data, we hypothesized that AKT could become degraded by the lysosomes since the AKT level was decreased without alteration to its gene expression despite proteasome inhibition (Fig. S1B).
Lysosome-associated AKT degradation has not been previously reported; therefore, to explore the potential lysosomal degradation of AKT, we pretreated OPM2 cells, a multiple myeloma cell line, with several lysosome inhibitors, including chloroquine, bafilomycin, NH4 Cl, and E-64, prior to incubating them with bortezomib (). We also pretreated RPMI8226, JJN3, OPM2, and U266 cells with leupeptin prior to bortezomib incubation (Fig. S1C). We found that lysosome inhibitors blocked the PI-induced reduction of AKT protein levels in OPM2 cells ()) and other myeloma cell lines (Fig. S1C) while exerting no significant effect on AKT1 gene expression (Fig. S1D). Lysosome-associated AKT degradation was also observed in other cancer cells (Fig. S1E). Proteasome inhibition led to lysosome activation within 4 h of PI treatment ( and S1F). Since proteasome inhibition induces AKT phosphorylation within hours [Citation27], prior studies have suggested that AKT activation may induce autophagy [Citation28], as well as lysosome-related pathways such as the PLEKHF2-AKT-VRK2 complex [Citation29,Citation30] and the lysosomal MTORC2-PHLPP1-AKT signaling pathway [Citation31] (Fig. S1G). Moreover, in RPMI8226 cells pretreated with chloroquine, followed by incubation with bortezomib, AKT colocalized with LAMP1 (lysosomal-associated membrane protein 1) ()). These results suggest that AKT may become degraded in lysosomes even if the proteasomal activity is blocked.
Lysosomes play a vital role in the clearance of aggregated proteins [Citation32], such as those ubiquitinated by the ubiquitin E3 ligase, MUL1 [Citation15]. These aggregated and ubiquitinated proteins then often localize to the insoluble cellular fraction [Citation33–35]. We found that incubating JJN3 cells with increasing concentrations of bortezomib enhanced levels of ubiquitinated p-AKT and AKT in the insoluble cellular fraction ()). Also, ubiquitination of AKT is associated with several aggresomal proteins, while the modified form of AKT may be involved in the lysosomal degradation of AKT. Accordingly, we found that lysosomal activity decreased after incubating the cells for 24 h with bortezomib, whereas this decrease in lysosomal activity was prevented by AKT overexpression under the same experimental conditions (Fig. S1H and S1I). These results suggest that PI-induced lysosome activation causes subsequent lysosomal degradation of AKT; while AKT degradation ultimately leads to programmed cell death if the lysosomal activity cannot be sustained (Fig. S1I-S1K). Moreover, PI-induced lysosomal degradation of AKT also occurred in patient-derived primary cancer cells () and S1L). These results assume that AKT could become subjected to a proteasome-independent mechanism, such as lysosomal proteolysis, in multiple myeloma cells; therefore, its reduction was related to cell death through failure to maintain lysosome activity.
Autophagy plays a crucial role in AKT degradation
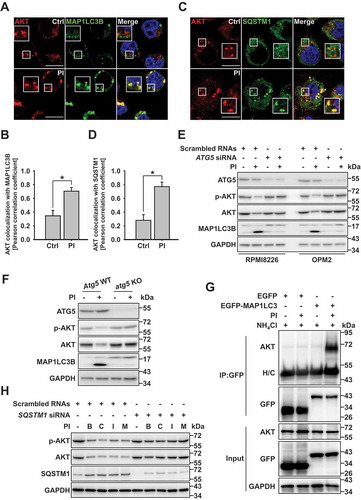
We found that proteasome inhibition increased levels of aggresomal proteins and increased levels of p-AKT and AKT, as well as that of other ubiquitinated proteins in the insoluble cellular fraction of multiple myeloma cells ()). Previously, we also determined that autophagy is the most common cellular mechanism by which cells eliminate aggresomal proteins through lysosomal degradation [Citation35]. Thus, we hypothesized that autophagy flux might contribute significantly to the lysosomal degradation of AKT. Results showed that the level of MAP1 LC3B puncta increased in a PI- and time-dependent manner (Fig. S2A); with both MAP1LC3B puncta and autolysosomes becoming activated under the same experimental conditions (Fig. S2A and S2B). We next compared the localization of AKT with those of autophagy markers and found via immunostaining analysis that a portion of the AKT colocalized with puncta positive for MAP1LC3B () and SQSTM1 ()). Consistent with these results, inhibition of the autophagy signaling pathway led to the failure of AKT degradation in ATG5 knockdown () and S2C) or KO cells () and S2D). To confirm the localization of AKT to the autophagic flux, we assessed the effects of proteasomal inhibition on the binding affinity between AKT and MAP1LC3 with that of lysosome inhibition. To this end, we transfected OPM2 cells with EGFP or EGFP-MAP1LC3 expression plasmids. After 24 h, we pretreated cells with the lysosome inhibitor, NH4 Cl, for 1 h, added bortezomib, and incubated cells for an additional 8 h before assessing the interaction between AKT and MAP1LC3 via immunoprecipitation. We found that pretreating cells with a lysosome inhibitor, prior to incubation with bortezomib, induced the interaction between AKT and MAP1LC3B (). Further, since SQSTM1 plays a key role in autophagosome formation and maturation [Citation36], we next wanted to confirm the involvement of autophagosome-mediated AKT degradation. Accordingly, we transfected OPM2 cells with a scrambled siRNA or with an SQSTM1-specific siRNA. After 24 h, the cells were incubated with 10 nM bortezomib, 10 nM carfilzomib, 40 nM ixazomib, or 10 nM marizomib, first- and second-generation PIs, respectively. We found that PI treatment did not affect the levels of AKT protein in OPM2 SQSTM1 knockdown cells ()), suggesting that autophagy plays a critical role in the lysosomal degradation of AKT.
Figure 2. Autophagy plays a key role in the lysosomal degradation of AKT (a and c) Lysosome inhibition and proteasome inhibition induce the colocalization of AKT with SQSTM1 and with MAP1LC3B. RPMI 8226 cells were pretreated with the lysosome inhibitor NH4Cl (25 mM) for 1 h. The protease inhibitor (PI), bortezomib (10 nM), was then added, and the cells were incubated for an additional 8 h and fixed. They were then labeled with (a) antibodies to AKT (red) or MAP1LC3B (green), and (c) antibodies to AKT (red) or SQSTM1 (green), prior to capturing the images by confocal microscopy. Yellow = merge/colocalization. Larger white boxes in the images are enlargements of the area indicated by the smaller white boxes; scale bars: 10 μm. (b) Quantification of the colocalization of AKT and MAP1LC3B. Merged images from Figure 2(a) were analyzed for AKT:MAP1LC3B colocalization using NIS Elements software and Pearson’s correlation coefficient. Data represent the mean ± SD of 10 randomly selected cells per condition; *P < 0.05. (d) Quantification of the colocalization of AKT and SQSTM1. Merged images from Figure 2(c) were analyzed for AKT:SQSTM1 colocalization using NIS Elements software and Pearson’s correlation coefficient. Data represent the mean ± SD of 10 randomly selected cells per condition; *P < 0.05. (e and f) Autophagy inhibition prevents the effects of PIs on AKT degradation. (e) Representative western blot analysis of RPMI 8226 and OPM2 cells transfected with scrambled RNAs or siRNA specific to ATG5. After 24 h, 10 nM bortezomib was added, and the cells were incubated for an additional 24 h. GAPDH used as the loading control. (f) Representative western blot analysis of wild-type (WT) mouse embryonic fibroblasts (MEFs) and atg5-knockout (KO) MEFs incubated with 40 nM bortezomib for 24 h. (g) AKT interacts with MAP1LC3 when proteasomal and lysosomal degradation is inhibited. Then, 24 h post-transfection with an EGFP plasmid or an EGFP-MAP1LC3 expression plasmid, OPM2 cells were pretreated with 25 mM NH4Cl for 1 h. Bortezomib (10 nM) was then added, and the cells were incubated for an additional 8 h. The interaction between AKT and MAP1LC3 was assessed by immunoprecipitation with an anti-EGFP antibody. (h) OPM2 cells were transfected with a scrambled siRNA or with an SQSTM1-specific siRNA. After 24 h, the cells were incubated with 10 nM bortezomib, 10 nM carfilzomib, 40 nM ixazomib, or 10 nM marizomib
HSPA5 arginylation is necessary for AKT degradation
A recent study suggested that a subpopulation of cytosolic arginylated HSPA5 (R-HSPA5) is significantly involved in autophagy flux through its interaction with SQSTM1 or MAP1LC3B puncta in the cytosol [Citation21]. Based on these results, we assessed the involvement of R-HSPA5 in AKT lysosomal degradation. The arginylated form of HSPA5 increased through 12 h post-PI treatment; however, by 24 h post-treatment R-HSPA5 levels decreased significantly (Fig. S3A). Based on prior studies, we proposed that decreased R-HSPA5 is due to the lysosomal degradation of R-HSPA5 through autophagy flux [Citation21]. Cycloheximide (CHX) degradation assays confirmed that R-HSPA5 and AKT stability decreased in a proteasome inhibitor- and time-dependent manner in the Atg5 wild-type (WT) mouse embryonic fibroblasts (MEFs); however, R-HSPA5 and AKT were metabolically stabilized in atg5 KO MEFs ()). Since R-HSPA5 plays a crucial role in autophagy flux [Citation37] and AKT was also degraded through the autophagy/lysosome pathway (), the protein stability of R-HSPA5 or AKT was prevented in atg5 KO cells. Evidence that R-HSPA5 and AKT are degraded in the lysosome is shown in ). Furthermore, since HSPA5 can undergo proteasomal degradation through K48-linked ubiquitination [Citation17]; HSPA5 accumulated in PI-treated cells. However, HSPA5 proteolysis through lysosomal degradation does not seem possible in these experimental conditions ()). Next, to determine whether R-HSPA5 may be directly associated with AKT lysosomal degradation, we tested the binding affinity of AKT and R-HSPA5. Both exogenous and endogenous AKT were found to bind to R-HSPA5 () and S3B). Also, ATE1 is a key modulator of HSPA5 arginylation [Citation21]. We found that AKT levels did not decrease in ATE1 knockdown cells due to inhibition of HSPA5 arginylation ()). Further, AKT colocalized with R-HSPA5 in ATE1 WT cells following PI treatment, while ATE1 knockdown cells did not significantly affect the colocalization of R-HSPA5 with AKT ()). These data indicate that ATE1 plays a pivotal role in the lysosomal degradation of AKT, which it modulates by regulating the HSPA5 arginylation.
Figure 3. R-HSPA5 functions as a delivery determinant for AKT and SQSTM1 to autophagosomes. (a) Cycloheximide degradation assay of R-HSPA5, p-AKT, and AKT in atg5 KO mouse embryonic fibroblasts (MEFs) in the absence or presence of PI (bortezomib, 10 nM). Cells were treated with 50 μg/ml cycloheximide for different periods of time. Protein expression was assessed by western blot analysis. (b) R-HSPA5 is associated with the lysosomal degradation of AKT. JJN3 cells were treated with PI (bortezomib, 10 nM) for times indicated. Cells were pretreated with chloroquine (50 μM) for 1 h before PI treatment. Protein levels were evaluated by western blot analysis. (c) AKT1 interacts with R-HSPA5. JJN3 cells were transfected with AKT1-MYC-His. After 24 h post-transfection, cells treated with bafilomycin (100 nM) for 1 h and then, PI (bortezomib, 10 nM), and thapsigargin (200 nM) incubation for an additional 12 h. AKT1 and R-HSPA5 binding was evaluated by Ni-NTA His pull-down assay. (d) Scrambled or ATE1-knockdown JJN3 cells were treated with PI (bortezomib, 10 nM), followed by western blot. (e) FaDu cells were transfected with scrambled or ATE1-specific siRNA, followed by treatment for 12 h with PI (bortezomib, 40 nM). Colocalization analysis between R-HSPA5 (green) and AKT (red). Yellow = merge/colocalization. Larger white boxes in the images are enlargements of the area indicated by the smaller white boxes; scale bars: 10 μm. (f) Quantification of the colocalization of AKT and R-HSPA5 puncta. Merged images from Figure 3(e) were analyzed for AKT:R-HSPA5 colocalization using NIS Elements software and Pearson’s correlation coefficient. Data represent the mean ± SD of 10 randomly selected cells per condition; *P < 0.05, n.s. (not significant). (g) JJN3 cells were treated with PI (bortezomib, 10 nM) or co-treated with NAC (10 mM), followed by western blot. (h) Colocalization of cytoplasmic R-HSPA5 puncta with SQSTM1 in PI (bortezomib, 40 nM)-treated FaDu cells. (i) Colocalization of R-HSPA5 puncta with AKT in FaDu cells as determined by immunofluorescence, using anti-HSPA5 (green) and anti-AKT (red) antibodies. Yellow = merge/colocalization. Larger white boxes in the images are enlargements of the area indicated by the smaller white boxes; scale bars: 10 μm
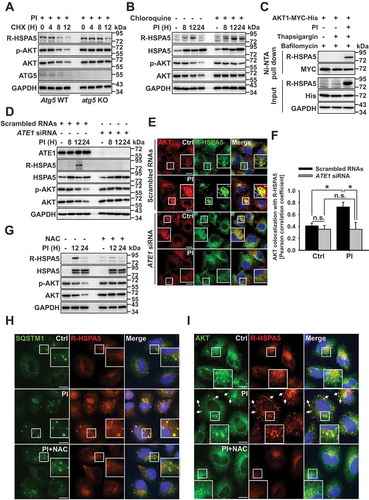
A previous study suggests that ROS may act as a stress regulator for HSPA5 [Citation38]. Cellular stress induced by proteasomal inhibition can increase levels of intracellular ROS [Citation39,Citation40]; therefore, we examined the relationship between PI-induced ROS and R-HSPA5-mediated AKT degradation. Proteasome inhibition increased levels of intracellular ROS, whereas this increase was inhibited in N-acetyl cysteine (NAC)-treated cells (Fig. S3C). ROS induced arginylation of HSPA5 and decreased AKT in a time-dependent manner; however, NAC prevented AKT degradation and HSPA5 arginylation ()). Finally, NAC inhibited both HSPA5 arginylation and the colocalization of R-HSPA5 and SQSTM1 ()). Thus, AKT was unable to undergo lysosomal degradation due to its failure to interact with R-HSPA5 ()). Together, these data indicate that ATE1- or ROS-mediated R-HSPA5 regulation plays a crucial role in the lysosomal degradation of AKT through the interaction of R-HSPA5 and AKT when the proteasomal activity is inhibited.
MUL1 regulates AKT ubiquitination to target for lysosomal degradation
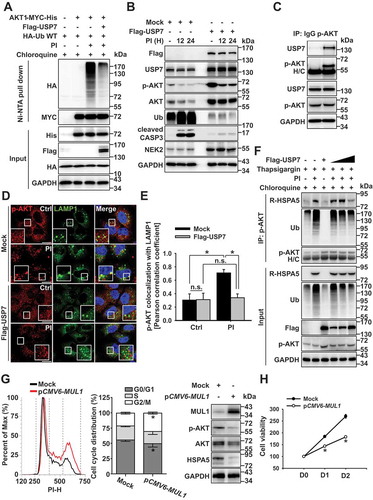
We found that proteasome inhibition induced the accumulation of aggregated proteins such as ubiquitinated proteins ()); thus, we hypothesized that the ubiquitinated form of AKT might be selectively degraded in the lysosome. To test our hypothesis, we examined the relationship between AKT ubiquitination and lysosomal degradation and found that PI induced AKT ubiquitination. This phenomenon was enhanced in the presence of a lysosome inhibitor (Fig. S4A), as AKT was degraded by lysosomes () through autophagy flux (). Specifically, AKT was ubiquitinated through K27-, K29-, or K48-linked ubiquitination (Fig. S4B); however, only K48-linked ubiquitinated AKT localized to the lysosome (Fig. S4C). Alternatively, K48 ubiquitin mutant (K48 R)-overexpressing cells did not significantly affect the localization of ubiquitin to the lysosome (Fig. S4D). Interestingly, the active form of AKT was strongly ubiquitinated compared to the inactive form of AKT (Fig. S4E; Myr [the constitutively active form] vs. DN [the inactive form]). Ubiquitination of p-AKT was also apparent in the patient-derived primary cancer cells ()). Hence, K48-linked ubiquitination of active AKT may be a critical modification for lysosomal degradation (), S4D, and S4E). Moreover, a previous report demonstrated that MUL1 acts as an E3 ligase to activate AKT through K48-linked ubiquitination [Citation15]. Herein, proteasomal inhibition activated AKT within 1 h (Fig. S1G), confirming the involvement of MUL1 in PI-induced AKT ubiquitination and degradation. Further, AKT ubiquitination was regulated in a MUL1-dependent manner under proteasomal inhibition ()). For instance, when MUL1 levels increased, AKT levels decreased under the same experimental conditions (Fig. S4F). Since MUL1 was found to induce both proteasome- and lysosome-mediated degradation of AKT (Fig. S4G), AKT degradation was inhibited in mul1 KO cells generated by the CRISPR/Cas9 system [Citation17] ()) or MUL1-knockdown cells (Fig. S4H) in the same experimental conditions. In particular, R-HSPA5 accumulation was unable to induce AKT degradation in mul1 KO cells ()). Therefore, MUL1-mediated AKT ubiquitination represents another key molecular mechanism mediating the lysosomal degradation of AKT.
Figure 4. MUL1 controls AKT lysosomal degradation. (a) Proteasome inhibitors induce AKT ubiquitination in patient samples. Patient primary MM cells were pretreated with NH4Cl (25 mM) for 1 h, then PI (carfilzomib, 10 nM) for 8 h. Cells lysates were immunoprecipitated with anti-p-AKT, followed by western blot with the indicated antibodies. (b) Proteasome inhibition induces K48-linked ubiquitination of AKT1. JJN3 cells were transfected AKT1-MYC-His together with HA-Ub WT or ubiquitin mutants (HA-Ub K48 or HA-UbK48 R). After 24 h, cells were pretreated with NH4Cl (25 mM) for 1 h, prior to the addition of PI (bortezomib,10 nM) for 8 h. Ubiquitinated AKT1 was identified by Ni-NTA His pull-down ubiquitination assay. (c) MUL1 knockdown inhibits AKT1 ubiquitination under proteasome inhibition. After transfection with scrambled RNAs or MUL1 siRNA, AKT1-MYC-His, or HA-Ub, JJN3 cells were pretreated with NH4Cl (25 mM) for 1 h, prior to addition of PI (bortezomib, 10 nM) for 8 h. Ubiquitinated AKT1 was detected by His pull-down ubiquitination assay. (d) PI-induced AKT reduction is prevented in mul1 KO cells. MUL1 WT or mul1 KO cells [Citation17] were treated with PI (bortezomib, 10 nM) for 24 h. The cells were subjected to western blot. (e) Quantitative analysis of the MUL1 protein level described in Fig. S4I. Data represent the mean ± SD. Asterisks indicate statistically significant differences. (n = 4 independent experiments, *P < 0.05). (f) MUL1 overexpression induces cell growth inhibition. U266 or JJN3 cells were transfected with mock or pCMV6-MUL1. At 48 h after transfection, the cells were harvested for western blot. Cell growth was measured by the MTS assay on each indicated day (D1, 24 h after transfection; D2, 48 h after transfection). Data represent the mean ± SD. Asterisks indicate statistically significant differences (n = 6, *P < 0.05). (g) MUL1 WT or mul1 KO cells were pretreated with bafilomycin (100 nM) for 1 h, prior to the addition of PI (bortezomib, 10 nM) for 8 h and either fixed and labeled with anti-LAMP1 (red) and anti-SQSTM1 (green) antibodies. Yellow = merge/colocalization. Larger white boxes in the images are enlargements of the area indicated by the smaller white boxes; scale bars: 10 μm. (h) Quantification of the colocalization of SQSTM1 and LAMP1. Merged images from Figure 4(g) were analyzed for SQSTM1:LAMP1 colocalization using NIS Elements software and Pearson’s correlation coefficient. Data represent the mean ± SD of 10 randomly selected cells per condition; *P < 0.05, n.s. (not significant). (i) MUL1 WT or mul1 KO cells were treated with PI (bortezomib, 20 or 40 nM) for 24 h. Cells lysates were subjected to western blot with the indicated antibodies
![Figure 4. MUL1 controls AKT lysosomal degradation. (a) Proteasome inhibitors induce AKT ubiquitination in patient samples. Patient primary MM cells were pretreated with NH4Cl (25 mM) for 1 h, then PI (carfilzomib, 10 nM) for 8 h. Cells lysates were immunoprecipitated with anti-p-AKT, followed by western blot with the indicated antibodies. (b) Proteasome inhibition induces K48-linked ubiquitination of AKT1. JJN3 cells were transfected AKT1-MYC-His together with HA-Ub WT or ubiquitin mutants (HA-Ub K48 or HA-UbK48 R). After 24 h, cells were pretreated with NH4Cl (25 mM) for 1 h, prior to the addition of PI (bortezomib,10 nM) for 8 h. Ubiquitinated AKT1 was identified by Ni-NTA His pull-down ubiquitination assay. (c) MUL1 knockdown inhibits AKT1 ubiquitination under proteasome inhibition. After transfection with scrambled RNAs or MUL1 siRNA, AKT1-MYC-His, or HA-Ub, JJN3 cells were pretreated with NH4Cl (25 mM) for 1 h, prior to addition of PI (bortezomib, 10 nM) for 8 h. Ubiquitinated AKT1 was detected by His pull-down ubiquitination assay. (d) PI-induced AKT reduction is prevented in mul1 KO cells. MUL1 WT or mul1 KO cells [Citation17] were treated with PI (bortezomib, 10 nM) for 24 h. The cells were subjected to western blot. (e) Quantitative analysis of the MUL1 protein level described in Fig. S4I. Data represent the mean ± SD. Asterisks indicate statistically significant differences. (n = 4 independent experiments, *P < 0.05). (f) MUL1 overexpression induces cell growth inhibition. U266 or JJN3 cells were transfected with mock or pCMV6-MUL1. At 48 h after transfection, the cells were harvested for western blot. Cell growth was measured by the MTS assay on each indicated day (D1, 24 h after transfection; D2, 48 h after transfection). Data represent the mean ± SD. Asterisks indicate statistically significant differences (n = 6, *P < 0.05). (g) MUL1 WT or mul1 KO cells were pretreated with bafilomycin (100 nM) for 1 h, prior to the addition of PI (bortezomib, 10 nM) for 8 h and either fixed and labeled with anti-LAMP1 (red) and anti-SQSTM1 (green) antibodies. Yellow = merge/colocalization. Larger white boxes in the images are enlargements of the area indicated by the smaller white boxes; scale bars: 10 μm. (h) Quantification of the colocalization of SQSTM1 and LAMP1. Merged images from Figure 4(g) were analyzed for SQSTM1:LAMP1 colocalization using NIS Elements software and Pearson’s correlation coefficient. Data represent the mean ± SD of 10 randomly selected cells per condition; *P < 0.05, n.s. (not significant). (i) MUL1 WT or mul1 KO cells were treated with PI (bortezomib, 20 or 40 nM) for 24 h. Cells lysates were subjected to western blot with the indicated antibodies](/cms/asset/7f11ffde-4349-402d-a4ff-04435563068a/kaup_a_1740529_f0004_c.jpg)
MUL1 expression also increased in the patient-derived primary cancer cells following PI treatment () and S4I). However, the growth of cells was inhibited by MUL1 overexpression through the negative regulation of AKT ( and S4J). MUL1 was not, however, associated with autophagosome biogenesis or fusion with lysosomes when proteasome activity was compromised, as demonstrated by the consistent ratio of autolysosomes and autophagy pathway signaling in mul1 KO cells and WT MUL1 cells ()). Together, these results suggest that cellular stress induced by proteasome inhibition may quickly activate AKT as a protective mechanism. However, p-AKT induces K48-linked ubiquitination by MUL1, and the ubiquitinated form of AKT can become targeted for lysosomal degradation. Thus, arginylation of HSPA5 and MUL1-mediated AKT ubiquitination are both necessary for the lysosomal degradation of AKT.
USP7 inhibits AKT degradation through the deubiquitination of AKT
Arginylation of HSPA5 without ubiquitination was unable to induce the degradation of AKT ()). A recent study has suggested that USP7 (ubiquitin specific peptidase 7) inhibition may serve as a novel therapeutic method to overcome resistance to bortezomib in multiple myeloma by destabilizing NEK2 or inhibiting AKT [Citation41]. Based on this report, we assessed the role of USP7 in PI-induced ubiquitination of AKT, as USP7 may act as a deubiquitinase involved in antitumor activity [Citation42]. To determine the role of USP7 in AKT degradation, we transfected cells with USP7 plasmids and induced proteasomal inhibition. USP7 overexpression inhibited ubiquitination of AKT () and S5A), and both the ubiquitination and the degradation of AKT were inhibited in USP7-overexpressing cells ()). Next, to examine whether USP7 affected PI-induced AKT protein stability by interacting with AKT and deubiquitinating PI-induced AKT ubiquitination, we assessed the binding affinity between USP7 and p-AKT, since PIs preferentially induced the ubiquitination of p-AKT (Fig. S4E). We found that USP7 directly interacted with p-AKT ()), USP7 inhibition enhanced p-AKT ubiquitination (Fig. S5B), the USP7-mediated ubiquitinated form of p-AKT associated with UPS (Fig. S5C), and inhibition of USP7 induced an increase in MAP1LC3-II with a concurrent decrease in SQSTM1 (Fig. S5D). To confirm this result, we analyzed autophagosome formation under USP7 inhibition. USP7 inhibitor treatment resulted in an increase in MAP1LC3 puncta formation (Fig. S5E), suggesting the induction of autophagy. Based on these data, we hypothesized that USP7 inhibition might be associated with autophagic flux regulation. In the mock-transfected cells, p-AKT localized to the lysosomes; however, in the USP7-overexpressing cells, p-AKT localization was diffusely expressed ()). Hence, PI-induced AKT ubiquitination was affected by USP7 (), S5A, and S5B). Therefore, we assessed if USP7 could affect the binding affinity between ubiquitinated AKT and R-HSPA5 since the K48-linked ubiquitinated form of AKT was selectively degraded in lysosomes () and R-HSPA5 was shown to play a crucial role in AKT degradation through its interaction with AKT (). The interaction between R-HSPA5 and p-AKT was affected by USP7 overexpression ()), and USP7 inhibited the ubiquitination of AKT ()). Therefore, R-HSPA5 was unable to bind with AKT, preventing AKT degradation through autophagy flux (). For these reasons, AKT levels did not decrease despite R-HSPA5 accumulation in mul1 KO cells ()). Hence, MUL1 appeared to play a crucial role in AKT degradation through the regulation of K48-linked ubiquitination (). Based on our data, we evaluated whether MUL1 could affect the behavior of cells, although these cells are resistant to proteasome inhibitory stress. To this end, MUL1 plasmids were transfected into the PI-resistant cells, after which cell cycle and cytotoxicity were analyzed. MUL1 overexpression induced cell cycle arrest in PI-resistant cells through AKT or HSPA5 downregulation ()). HSPA5 expression has been observed as a response to PI in the clinic [Citation43,Citation44]. In addition, HSPA5 is a substrate for MUL1 [Citation17]. Our results revealed that MUL1 overexpression could induce cell cycle arrest and growth inhibition in the PI-resistant cells ()). Regulation of MUL1-mediated ubiquitination or USP7-associated deubiquitination of AKT might be closely related to the antitumor effects in PI-resistant cells. Together, our results suggest that regulating USP7 activity or MUL1 expression may prove to be useful therapeutic approaches for developing novel cancer drugs, including those for PI-resistant cancer.
Figure 5. USP7 prevents bortezomib-induced AKT ubiquitination and degradation. (a) OPM2 cells were co-transfected with AKT1-MYC-His, HA-Ub, or Flag-USP7. A pretreatment of chloroquine (50 μM) was given for 1 h before the bortezomib (10 nM) treatment for 12 h. Cells were lysed, and AKT1 protein was immunoprecipitated by His pull-down assay, and ubiquitination levels were analyzed using an anti-HA antibody by western blot. (b) OPM2 cells were transfected with mock or Flag-USP7. Then, 24 h later, cells were treated with bortezomib (10 nM) for 12 h, lysed, and the indicated proteins were determined by western blot. (c) USP7 interacts with p-AKT. OPM2 cells were lysed, and p-AKT was immunoprecipitated using an anti-p-AKT antibody. western blots were probed with anti-p-AKT and USP7 antibodies. (d) USP7 inhibits the colocalization of AKT with LAMP1. RPMI8226 cells were transfected with mock or Flag-USP7. After 24 h, cells were pretreated for 1 h with chloroquine (50 μM), prior to the addition of bortezomib (10 nM) for 8 h. Cells were fixed and labeled with anti-p-AKT and LAMP1 antibodies. Yellow = merge/colocalization. Larger white boxes in the images are enlargements of the area indicated by the smaller white boxes; scale bars: 10 μm. (e) Quantification of the colocalization of p-AKT and LAMP1. Merged images from Figure 5(d) were analyzed for p-AKT:LAMP1 colocalization using NIS Elements software and Pearson’s correlation coefficient. Data represent the mean ± SD of 10 randomly selected cells per condition; *P < 0.05, n.s. (not significant). (f) The autophagic targeting of ubiquitinated AKT and R-HSPA5 is impaired in USP7-overexpressed cells. OPM2 cells were transfected with mock or Flag-USP7 in a dose-dependent manner. After 24 h, cells treated with the presence of chloroquine (50 μM) for 1 h and were additionally treated with bortezomib (10 nM) or thapsigargin (200 nM) for a further 12 h. Proteins were subjected to immunoprecipitation with an anti-p-AKT antibody, followed by western blot with the indicated antibodies. (g) MUL1 overexpression induces G2/M cell cycle arrest in bortezomib-resistance MM cells. RPMI8226/BTZ cells were transfected with mock or pCMV6-MUL1 for 48 h, and cell cycle analysis was processed after 70% ethanol fixation and PI staining. (h) MUL1 overexpression suppresses cell growth in bortezomib-resistance MM cells. RPMI8226/BTZ were transfected with mock or pCMV6-MUL1. At 48 h after transfection, the cells were harvested for western blot. Inhibition of cell growth was measured by the MTS assay on each indicated day (D1, 24 h after transfection; D2, 48 h after transfection). Data represent the mean ± SD. Asterisks indicate statistically significant differences (n = 6, *P < 0.05)
Sequential ubiquitination from K284 to K214 of AKT is necessary for lysosomal degradation through interaction with R-HSPA5
Since R-HSPA5 played a crucial role in the lysosomal degradation of AKT via its interaction with AKT (), MUL1-mediated K48-linked ubiquitination of AKT was selectively degraded in lysosomes (), and putative ubiquitination sites of AKT for MUL1 have been predicted in a previous report [Citation15], we generated lysine mutants of AKT and examined their ubiquitination since AKT ubiquitination or degradation was associated with MUL1 ( and S4). The K284 residue serves as a MUL1 ubiquitination site when cells are exposed to MG132 but not to lysosome inhibitors [Citation15]. The present study showed that MG132 was incapable of inducing AKT downregulation ()). Therefore, the proteasome inhibition-mediated lysosomal degradation of AKT might show different effects depending on the kinds of PIs, including 2nd generation PIs ()). Nevertheless, the K284 R and K214 R AKT mutants inhibited K48-linked ubiquitination (), S6A, and S6B). K48-linked ubiquitination of AKT was shown in K163 R or K170 R mutants used as experimental controls for lysine site mutant generation (Fig. S6B). Although the role of K214 for AKT stability remains unclear, the K214 residue has been shown to contribute significantly to the ubiquitination of AKT under the proteasome inhibitory cellular stress. Based on this evidence, we hypothesized that 2 lysine residues, K284 and K214, play a crucial role in the lysosomal degradation of AKT through the ubiquitination pathway. Both K284 and K214 residues in AKT were well-conserved among distinct species (Fig. S6C). Thus, we generated 3 types of AKT mutants, in which all-lysine residues were replaced with arginine (R) save for one- (K284 or K214) or two- (K284/K214) lysine residues in the kinase domain (Fig. S6D). Although WT AKT levels were reduced, protein stability was sustained in K284 or K214 mutants ()). Very interestingly, two K284/K214 lysine residue mutants rapidly degraded compared with cells with WT lysine, with no change in kinase activity (); WT vs. K284/K214). Since, other AKT lysine residues may contribute to the maintenance of AKT by preventing PTMs, K284/K214 mutant may become more rapidly degraded than WT. The decrease in K284/K214 was associated with lysosome-mediated degradation (Fig. S6E). Further, K214 might become ubiquitinated following the K284-mediated ubiquitination. However, the primary ubiquitination of K284 was essential for K214-mediated ubiquitination since K214 R inhibited the ubiquitination of AKT (, S6A, and S6B). From these results, we hypothesized that the non-canonical ubiquitination of AKT, such as sequential ubiquitination from K284 to K214, could induce the lysosomal degradation of AKT and that these events could be regulated by MUL1. Also, K48-linked ubiquitination was rapidly and strongly induced in K284/K214 mutant compared with the K214 and K284 mutants (Fig. S6F). Interestingly, the K214 mutant was not ubiquitinated under the same experimental conditions. Thus, the K214 residue could not act as the primary ubiquitination site for the lysosomal degradation of AKT. Therefore, the primary ubiquitination of K284 was essential for the K214-mediated ubiquitination as K214 did not induce the ubiquitination of AKT (Fig. S6F). We next determined which lysine residue was associated with MUL1 for lysosomal degradation under proteasome inhibitory stress. MUL1 also failed to ubiquitinate the K214 mutant, although it successfully did so for K284 and K284/K214 mutants. However, ubiquitination of the K284/K214 mutant was significantly higher than that of the K284 mutant within 4 h of proteasome and lysosome inhibition ()). Although these results did not fully support our hypothesis, they suggest that the ubiquitination of K284 should precede that of K214 and that this sequential ubiquitination may be essential for the lysosomal degradation of AKT (), S6E, and S6F).
Figure 6. Sequential ubiquitination of residues K284 to K214 plays a vital role in AKT1 degradation. (a) AKT1 lysine (K) residues, K284 and K214, are putative protease inhibitor ubiquitination sites. Eleven lysine residues in the kinase domain of AKT1 were replaced with alanine (R) and each indicated plasmids were transfected into JJN3 cells. At 24 h after transfection, cells were pretreated with NH4Cl (25 mM) for 1 h, prior to the addition of PI (bortezomib, 10 nM) for 8 h. Ubiquitinated form of AKT1 was performed by Ni-NTA His pull-down ubiquitination assay. (b) RPMI8226 cells were transfected HA-Ub K48 together with AKT1 WT-MYC-His or AKT1 mutants (AKT1K214 R-MYC-His or AKT1K284 R-MYC-His). After 24 h, cells were treated with NH4Cl (25 mM) for 1 h, and then, PI (bortezomib, 10 nM) was treated for an additional 8 h. White box in merge pictures showed the colocalization of K48 ubiquitin-positive inclusions with AKT1 WT-MYC-His (but not AKT1K214 R-MYC-His or AKT1K284 R-MYC-His). Yellow = merge/colocalization. Larger white boxes in the images are enlargements of the area indicated by the smaller white boxes; scale bars: 10 μm. (c) K284/K214 mutant is sensitively degraded compared with AKT1 WT under proteasome inhibition. JJN3 cells were transfected with AKT1 WT-MYC-His, AKT1 K214-MYC-His, AKT1 K284-MYC-His, or AKT1 K284/K214-MYC-His. At 24 h after transfection, cells were treated with PI (bortezomib, 10 nM) for the indicated times, and p-AKT1 (S473), p-AKT1 (T308), p-GSK3B, GSK3B or GAPDH levels were determined by western blot. (* or ** means exo- or endogenous p-AKT1). (d) Under proteasome inhibitory status, MUL1 is finally attachment of K48 ubiquitin linkages to the K214 of AKT1. JJN3 cells were co-transfected with the EGFP-MUL1 together with the AKT1 K214-MYC-His, AKT1 K284-MYC-His or AKT1 K284/K214-MYC-His. After 30 h, cells were treated with chloroquine (50 μM) for 1 h, prior to the addition of PI (bortezomib, 10 nM) for the indicated times. Ubiquitinated AKT1 was identified by Ni-NTA His pull-down ubiquitination assay. (e) Fully ubiquitinated AKT1 (in which both K284 and K214 residues are ubiquitinated) can bind to R-HSPA5. JJN3 cells were transfected with AKT1 K214-MYC-His, AKT1 K284-MYC-His, or AKT1 K284/K214-MYC-His plasmids. Then, 24 h later, cells were pretreated with 25 mM NH4Cl 25 mM for 1 h prior to incubating the cells for 12 h with 200 nM thapsigargin, with or without 10 nM bortezomib (PI). AKT1-R-HSPA5 binding was evaluated by Ni-NTA His pull-down assay. (f) Silencing of MUL1 avoids PI-mediated K284/K214 AKT1 degradation. After transfection with scrambled RNAs or MUL1 siRNA, AKT1 K214-MYC-His, AKT1 K284-MYC-His, or AKT1 K284/K214-MYC-His, JJN3 cells were treated with PI (bortezomib, 10 nM) for 12 h. The indicated protein levels were determined by western blot. (g) MUL1 WT or mul1 KO cells were transfected with AKT1 K214-MYC-His, AKT1 K284-MYC-His, or AKT1 K284/K214-MYC-His. After 24 h, cells were treated with PI (bortezomib, 10 nM) for 24 h. The cells were subjected to western blot. (h) The cell growth of AKT1K284 R,K214 R-expressing cells is less affected by PI. JJN3 cells were transfected with mock, AKT1 WT-MYC-His, or AKT1K284 R,K214 R-MYC-His. At 24 h after transfection, cells were treated with PI (bortezomib, 10 nM) for 24 h. Cell viability was assessed by the MTS assay. Data represent the mean ± SD. Asterisks indicate statistically significant differences (n = 6, P < 0.05)
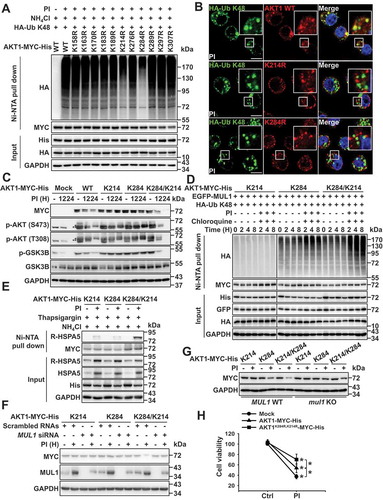
Interestingly, the fully ubiquitinated form of AKT bound to R-HSPA5 ()). Therefore, this form of AKT was selectively degraded through the autophagic/lysosomal pathway (). For these reasons, PI-induced degradation of the K284/K214 was inhibited in knockdown cells or mul1 KO ()). Therefore, MUL1 plays a crucial role in the lysosomal degradation of AKT under proteasomal inhibitory stress ()). Consistent with these findings, cells that overexpressed the K284 R/K214 R double AKT mutant were more resistant to PI-induced stress than cells expressing WT AKT ()). These results suggest that proteasome inhibition can induce lysosomal degradation of AKT through the non-canonical ubiquitination, such as sequential ubiquitination, and that MUL1 is necessary for the lysosomal degradation of AKT. After MUL1-induced ubiquitination of K284 and K214, fully ubiquitinated AKT could bind to R-HSPA5 and undergo lysosomal degradation through autophagy flux ().
Figure 7. Novel proteolysis mechanisms of AKT through crosstalk between R-HSPA5 and a sequentially ubiquitinated form of AKT. Unfolded and/or misfolded proteins are targeted by ubiquitin for degradation by the proteasome or lysosome pathways. The proteasome inhibitor leads to the accumulation of excessive misfolded/ubiquitinated protein aggregates. Proteasome inhibition facilitates the formation of ubiquitinated proteins, induced R-HSPA5 [Citation21] or MUL1 (steps 1 and 2). In various oxidative conditions, MUL1 induces AKT degradation by UPS via K48-linked ubiquitination at K284 residue [Citation15] (step 3). However, AKT could not induce degradation because proteasome is inhibited by PI, therefore, ubiquitinated AKT is able to lysosomal degradation, for ubiquitin chains linked to another lysine (K214) of AKT by MUL1, generating unique coding signatures of the K48 linkages. (step 4). Sequential ubiquitination of AKT from K284 to K214 acts as a substrate-specific mark for lysosomal degradation through autophagosome. The resulting fully ubiquitinated form of AKT at both K284 and K214 could bind with R-HAPS5 (step 5). This enables selective recruitment of cargo along with R-HSPA5, SQSTAM1, and MAP1LC3 on the autophagic membranes [Citation21,Citation37] (step 6). Following vesicle closure, the autophagosome fuses (step 7) with the lysosome whereby the engulfed material is degraded (step 8). In this model, the connection between MUL1-mediated sequential ubiquitination of AKT and arginylation of HSPA5 is essential for the lysosomal degradation of AKT under proteasome inhibitory cellular stress
![Figure 7. Novel proteolysis mechanisms of AKT through crosstalk between R-HSPA5 and a sequentially ubiquitinated form of AKT. Unfolded and/or misfolded proteins are targeted by ubiquitin for degradation by the proteasome or lysosome pathways. The proteasome inhibitor leads to the accumulation of excessive misfolded/ubiquitinated protein aggregates. Proteasome inhibition facilitates the formation of ubiquitinated proteins, induced R-HSPA5 [Citation21] or MUL1 (steps 1 and 2). In various oxidative conditions, MUL1 induces AKT degradation by UPS via K48-linked ubiquitination at K284 residue [Citation15] (step 3). However, AKT could not induce degradation because proteasome is inhibited by PI, therefore, ubiquitinated AKT is able to lysosomal degradation, for ubiquitin chains linked to another lysine (K214) of AKT by MUL1, generating unique coding signatures of the K48 linkages. (step 4). Sequential ubiquitination of AKT from K284 to K214 acts as a substrate-specific mark for lysosomal degradation through autophagosome. The resulting fully ubiquitinated form of AKT at both K284 and K214 could bind with R-HAPS5 (step 5). This enables selective recruitment of cargo along with R-HSPA5, SQSTAM1, and MAP1LC3 on the autophagic membranes [Citation21,Citation37] (step 6). Following vesicle closure, the autophagosome fuses (step 7) with the lysosome whereby the engulfed material is degraded (step 8). In this model, the connection between MUL1-mediated sequential ubiquitination of AKT and arginylation of HSPA5 is essential for the lysosomal degradation of AKT under proteasome inhibitory cellular stress](/cms/asset/8fd97d22-aa4c-47b0-abb0-6f1fdd7ec2ea/kaup_a_1740529_f0007_c.jpg)
Discussion
In this study, we examined whether AKT could induce non-proteasomal proteolysis through autophagy-mediated lysosomal degradation and whether the sequential ubiquitination of K284 to K214 may contribute to AKT degradation when proteasomal activity was impaired. Furthermore, we identified a role for arginylated HSPA5 in the lysosomal degradation of AKT via binding to AKT in its fully ubiquitinated form (at the K284 and K214 residues). Moreover, we found that MUL1 functioned as an E3 ligase for AKT and regulated AKT ubiquitination under proteasome inhibitory conditions, while inducing K48-linked ubiquitination of active AKT, thereby targeting it for lysosomal degradation. Although PIs quickly activated the lysosomes, AKT underwent lysosomal degradation through R-HSPA5-associated autophagic flux. USP7 reversed the PI-induced ubiquitination of AKT, thereby preventing AKT degradation.
Our study revealed several novel findings. First, we demonstrated that inhibiting the proteasome activity could directly induce autophagy-mediated, lysosomal degradation of AKT. Second, we established that R-HSPA5 plays an essential role in the lysosomal degradation of AKT by binding to AKT ubiquitinated at both the K284 and K214 residues, i.e., fully ubiquitinated AKT. Third, MUL1-mediated sequential ubiquitination of AKT residues K284–K214 represents a novel PTM pathway for AKT proteolysis. These cellular processes are necessary for AKT lysosomal degradation when proteasome function is impaired.
The role of the AKT signaling pathway in cancer has been extensively investigated due to its significant role in cell survival and apoptosis inhibition. Studies have demonstrated that the AKT pathway frequently malfunctions in several types of cancer and, in some cases, has associated with tumor aggressiveness. AKT has also been reported as upregulated in many types of human cancer. Therefore, it is a commonly pursued target for anticancer therapy. Multiple drug discovery programs are focused on identifying selective and potent AKT inhibitors such as AZD5363 [Citation45], ipatasertib [Citation46], afuresertib [Citation47]. However, regulation of AKT activity is critical in sustaining cellular functions because if AKT activity becomes compromised, the UPS will become disrupted, and cells will be transformed into abnormal cells. Thus, UPS controls many cellular processes, including protein degradation [Citation48].
Additionally, MUL1 has been implicated as a tumor suppressor protein that can inhibit tumor cell proliferation and migration [Citation15,Citation49]. Therefore, MUL1 is overexpressed in cancer tissues compared with normal tissues [Citation17]. Thus, MUL1 may be associated with cellular signaling pathways that promote tumor progression. Hence, when acting as a tumor suppressor, MUL1 uses AKT as a substrate by ubiquitinating K284 for UPS [Citation15]. In this study, we identified a novel MUL1 function, namely the sequential ubiquitination of AKT for lysosomal degradation (). Further, although AKT became degraded, MUL1 accumulated in proteasome-compromised cells (Fig. S4F) and AKT ubiquitination or degradation did not occur in MUL1 knockdown or KO cells under the same experimental conditions () and S4H). Cell growth was also inhibited by MUL1 overexpression ()). Specifically, this overexpression inhibited cell growth in bortezomib-resistant cells by decreasing both AKT and HSPA5 levels ()). Our previous study has reported that HSPA5 is a substrate for MUL1 [Citation17] and is a central regulator of ER function, with a vital role in protein folding and activation. It has also been described as a promotor of cytoprotective autophagy by maintaining ER structural integrity [Citation18]. In multiple myeloma, HSPA5-mediated autophagy can inhibit the pharmacologic effects of bortezomib. Thus, HSPA5 expression has been observed as a clinical response to bortezomib during multiple myeloma therapy [Citation44]. Hence, if MUL1 overexpression can be clinically regulated, for example, by using gene therapy, it may be used to treat cancer or bortezomib-resistant multiple myeloma by inhibiting AKT or HSPA5.
Additionally, AKT levels decreased through autophagy-mediated lysosomal degradation (). In this study, we demonstrated for the first time that proteasome inhibition could induce the lysosomal degradation of AKT in cell lines and patient-derived primary cancer cells (). Moreover, we showed that these phenomena were associated with non-canonical ubiquitination, such as sequential ubiquitination (). Protein modification mechanisms of lysosomal degradation may be well-regulated in cells through the sequential ubiquitination of AKT. In fact, AKT was ubiquitinated at K284 within 4 h () and S6F); however, K284-mediated ubiquitination of AKT alone was unable to induce lysosomal degradation since K284-ubiquitinated AKT becomes degraded by the proteasome [Citation15]. Furthermore, in this study, we found that R-HSPA5 played an important role in AKT degradation through autophagy flux (); however, K284-ubiquitinated AKT was unable to bind R-HSPA5, and thus, was not degraded. Therefore, further ubiquitination of K214 was induced, and fully ubiquitinated AKT was degraded through autophagy. The autophagy signaling pathway promotes the lysosomal degradation of aggresomal proteins [Citation31]. We found that proteasome inhibition induced AKT localization to autophagosomes through binding with MAP1LC3 ()) or R-HSPA5 ( and S3B). Despite proteasome inhibition-induced cellular stress, AKT was not degraded in autophagy-impaired cells (), S2C, and S2D). Thus, autophagy is clearly required for PI-induced AKT degradation. Furthermore, a previous study suggested that R-HSPA5 plays a critical role in autophagy-mediated lysosomal proteolysis [Citation21]. R-HSPA5 and ubiquitinated proteins also undergo lysosomal degradation through autophagosome formation [Citation21,Citation37] ()); however, R-HSPA5 also functions to protect cells from ER stress-mediated damage [Citation21]. In the present study, we found that proteasome inhibition-mediated intracellular ROS promoted the arginylation of HSPA5 (). Thus, R-HSPA5 accumulation may be induced by proteasome inhibition-mediated ER stress and ROS accumulation. Since ubiquitinated AKT was recognized as a type of aggregated protein ()), R-HSPA5 was observed to bind fully ubiquitinated AKT, leading to lysosomal degradation through autophagosome formation (). However, AKT-overexpressing cells were resistant to proteasome inhibition (Fig. S1J and S1K). Thus, ER stress accumulation could be related to the degradation of AKT (Fig. S7A). Although further investigation is necessary, ER stress activation and ROS may be involved in AKT degradation through the accumulation of R-HSPA5 under proteasomal inhibitory cellular conditions.
Together, to relieve cellular ER stress derived from ubiquitinated AKT accumulation, fully ubiquitinated AKT should be removed considering ubiquitinated AKT may be misidentified as an unfolded protein [Citation50]. AKT might be eliminated together with unfolded proteins in a nonselective manner. However, sequential ubiquitination of AKT is required to switch from promoting to inhibiting the accumulation of AKT (). Its secondary modification was also determined to be selective for AKT lysosomal degradation through R-HSPA5-associated autophagy flux (). Some studies support the possibility of non-canonical AKT ubiquitination. Specifically, sequential poly-ubiquitylation has been shown to expand the versatility of a ubiquitin ligase [Citation51]. More recently, new rules for proteasomal degradation and increases of branched and mixed linkage chains have enabled any non-degradative chain type to become a degradation signal [Citation52]. Specifically, Ufd2 functions as a K48-linked ubiquitin chain branching switch that can transform a K29-linked ubiquitin chain to one that is preferred by the proteasome [Citation53]. Further, K63-mediated ubiquitination plays a critical role in proteasome-mediated substrate degradation by branched ubiquitin chains of K48/K63 [Citation54]. However, the antiviral function of TRIM21 (tripartite motif-containing 21) is required for K63-linked ubiquitin catalyzed by sequential ubiquitination [Citation55]. In proteasome-inhibited cells, sequential ubiquitination of AKT may be induced by two mechanisms: 1) alteration in the binding affinity between E2 enzymes and MUL1 or 2) signal crosstalk between MUL1 and other E3 ligases to modulate the substrate fate from protection/elimination to elimination/protection. PI-resistant cancer cells did not promote AKT degradation (Fig. S7B).
We were unable to ubiquitinate K284 and K214 simultaneously as they required different experimental conditions to induce ubiquitination ()). Therefore, we created a fully ubiquitinated AKT by sequentially ubiquitinating K284, followed by K214. The meaning of “sequential ubiquitination” may be better described as “further ubiquitination” or “additional ubiquitination;” however, these expressions are not found in the literature. Finally, we decided that “sequential ubiquitination” was more appropriate for our study since K214 ubiquitination is sequentially induced after K284 ubiquitination. PI-resistant cancer cells could eliminate AKT through MUL1-mediated sequential ubiquitination of AKT. Although further study is necessary to investigate whether sequential ubiquitination may be a novel AKT degradation mechanism induced by PIs, we used the PIs, bortezomib or carfilzomib, in our study, which is currently used to treat multiple myeloma ()). We also showed that sequential ubiquitination of AKT played a critical role in AKT lysosomal degradation and that R-HSPA5 specifically interacted with fully ubiquitinated AKT to induce autophagy-mediated lysosomal degradation (). These findings may explain the efficacy of PIs used as clinical cancer therapy.
In the current study, we demonstrate that proteasome inhibition promotes a novel proteolysis mechanism through autophagy-mediated lysosomal degradation of AKT. Moreover, for the first time, we demonstrated that R-HSPA5 is necessary for AKT degradation by binding to its fully ubiquitinated form. Finally, we showed that MUL1-mediated sequential ubiquitination of AKT is critical for AKT’s interaction with R-HSPA5, which is essential for autophagic/lysosomal degradation (). Further experiments should be designed to investigate E3 ligase-mediated non-canonical ubiquitination for the lysosomal degradation of oncoproteins such as AKT. This finding could lead to new and effective approaches to treat cancer.
Material and methods
Reagents
Bortezomib (S1013), chloroquine (S4157), bafilomycin A1 (S1413), MG132 (S2619), leupeptin (S7380), carfilzomib (S2853), ixazomib (S2180), oprozomib (S7049), delanzomib (S1157), and P5091 (S7132) were purchased from Selleckchem. Leupeptin (L2884), marizomib (SML1916), N-ethylmaleimide (NEM, E3876), cycloheximide (01810), thapsigargin (T9033), NH4Cl (A9434), and E-64 (E3132) were purchased from Sigma-Aldrich.
Cell lines and patient-derived primary cancer cell isolation
atg5 KO and a corresponding WT MEF cell line were provided by Dr. You-Sun Kim (Ajou University School of Medicine, Suwon, Korea). MEFs were maintained in Dulbecco’s Modified Eagle Medium (GIBCO, 11,965,084) supplemented with 10% fetal bovine serum (FBS; GIBCO, 16,000,044) and 100 U/mL antibiotics (GIBCO, 15,240,062) at 37°C with 5% CO2 under humidified conditions. RPMI8226 cells were obtained from the Korean Cell Line Bank. KMS11 and PI (Bortezomib)-resistant KMS11 cells were purchased from the Japan Cancer Research Resources Bank (Tokyo, Japan). JJN3, U266, and OPM2 cells were a generous gift of Dr. Yoon Ho Ko (The Catholic University of Korea College of Medicine, Korea), and PI-resistant RPMI8226 cells were obtained from Dr. Jacqueline Cloos (VU University Medical Center, The Netherlands). Human thyroid cancer cell lines HTH83 and SW1736 were provided by Dr. Yoon Woo Koh (Yonsei University College of Medicine, Seoul, Korea). All cell lines were cultured in RPM1 1640 medium (GIBCO, 11,875,093) supplemented with 10% fetal bovine serum and 100 U/mL antibiotics at 37°C with 5% CO2 under humidified conditions. mul1 KO cells were used as described in our previous report [Citation17]. MUL1 WT or KO cells were grown in MEM medium (GIBCO, 11,095,080) supplemented with 10% fetal bovine serum and 100 U/mL antibiotics at 37°C with 5% CO2 under humidified conditions. Patient multiple myeloma cells were purified from BM aspirates by negative selection system (RosetteSep Human Multiple Myeloma Cell Enrichment Cocktail; StemCell Technologies, 15,169) according to the manufacturer’s instructions. Patient multiple myeloma cells were cultured in Iscove’s Modified Dulbecco’s Medium (StemCell Technologies, 36,150) with 10% FBS, 2 μM L-glutamine, and 100 U/mL antibiotics. All experiments with patient samples were performed under the auspices of Ajou University Institutional Review Board-approved protocol (AJIRB-BMR-SMP-18-393).
Plasmids
Constitutively active AKT1 (myristoylated AKT1, Myr AKT1-MYC-His), Wild-type AKT1 (WT AKT1-MYC-His), dominant-negative AKT1 (T308A and S473A; DN AKT1-MYC-His), AKT1 lysine mutants (K158 R, K163 R, K170 R, K183 R, K189 R, K214 R, K276 R, K284 R, K289 R, K297 R, and K307 R), EGFP, EGFP-MUL1, pSELECT-GFP-HsMAP1LC3 (psetz-gfplc3), and pRK5-HA-Ubiquitin (WT, KO, K6, K11, K27, K29, K33, K48, K63, and K48 R) were used as described previously [Citation15,Citation17]. pCMV3-Flag-USP7 and pCMV6-MUL1 were purchased from Sino Biological (Beijing, China, HG11681-NF) and OriGene (Rockville, MD, USA, SC321149), respectively. We generated three kinds of all-lysine mutants in kinase domain (KD) of AKT1 except for two lysine residues were remained such as K214 (K158 R, K163 R, K170 R, K183 R, K189 R, K214, K276 R, K284 R, K289 R, K297 R, and K307 R in KD domain), K284 (K158 R, K163 R, K170 R, K183 R, K189 R, K214 R, K276 R, K284, K289 R, K297 R, and K307 R in KD domain) or K284/K214 (K158 R, K163 R, K170 R, K183 R, K189 R, K214, K276 R, K284, K289 R, K297 R, and K307 R in KD domain). All-lysine mutants were codon-optimized for expression in humans, synthesized using a commercial gene synthesis service (BIONICS, Seoul, South Korea), and cloned into the pcDNA3.1-MYC-His plasmid (Invitrogen Carlsbad, CA, USA, V855-20), which results in the pcDNA3.1-AKT1 K214-MYC-His, pcDNA3.1-AKT1 K284 AKT1-MYC-His, and pcDNA3.1-AKT1 K284/K214-MYC-His plasmid. The AKT1 lysine mutant (AKT1K284 R,K214 R-MYC-His) was created using the QuikChange II Site-Directed Mutagenesis Kit (Agilent Technologies, 200,524) according to the manufacturer’s instructions. PCR primer sequences were as follows:
AKT1 K214 R, 5′-GGTCTGGAAAGAGTACCTCAGGGCTGTGAGGAA-3′ and 5′-TTCCTCACAGCCCTGAGGTACTCTTTCCAGACC-3′; AKT1 K284 R, 5′-GTGCCCGTCCCTGTCCAGCATGAGGTTCTC-3′ and 5′-GAGAACCTCATGCTGGACAGGGACGGGCAC-3′.
RNA interference analysis
Cells were transfected with 500 pmols of scrambled RNAs or siRNAs using the Neon Transfection System (Invitrogen, MPK5000 S). Scrambled RNAs were used as negative controls (BIONEER, Daejeon, Korea, SN-1001-CFG). Duplexes of siRNA targeting MUL1, ATG5, or ATE1 were synthesized by BIONEER. The siRNA sequences are as follows: human MUL1, 5′-GUACAACAGCUAAUAGUUU-3′ and 5′-AAACUAUUAGCUGUUGUAC-3′; human ATG5, 5′- CCAUCA AUC GGA AAC UCA U-3′ and 5′-AUGAGUUUCCGAUUGAUGG-3′; human ATE1, 5′- ACCCACCAUCUUUGUUUCCACCAAA-3′ and 5′-UUUGGUGGAAACAAAGAUGGUGGGU-3′; human SQSTM1/p62, 5′- GCAUUGAAGUUGAUAUCGAU-3′ and 5′- AUCGAUAUCAACUUCAAUGC-3′.
Electroporation
DNA or siRNA electroporation was performed with the Neon Transfection System (Invitrogen, MPK5000 S). For the electroporation with the Neon System, cells were pelleted again and resuspended in Resuspension buffer R (Neon 100 μl kit). 1 × 10⁶ cells were transferred to a sterile 1.5 ml microcentrifuge tube, brought to 100 μl final volume of cell suspension with buffer R, and mixed with plasmid DNA or siRNA. Cells were pulsed once with a voltage of 1,600 and a width of 20. After the pulse, cells were quickly transferred into RPMI 1640 medium.
Cell viability
Cells were treated with PI with indicated doses for 24 h. Then, followed by the addition of the Cyto XTM Cell viability assay kit, according to the manufacturer’s instructions (LPS SOLUTION, Daejeon, South Korea, CYT3000). Colorimetric detection of metabolic activity was evaluated by measuring the absorbance at 450 nm, using an Epoch Microplate Spectrophotometer (BioTek Instruments, Winooski, VT, USA). All conditions were tested in six replicates.
Measurement of ROS generation
ROS generation was evaluated using MitoSox Red (Thermo Fisher Scientific, Waltham, MA, M36008), following the manufacturer’s protocol. JJN3 cells were treated with PI (Bortezomib, 10 nM), NAC (10 mM) or in combination for 24 h. Cells were loaded with MitoSox Red at 10 μM for 30 min at 37°C. Fluorescence-stained cells (1 × 10⁴) were determined using a BD FACSAria III cell sorter (BD Biosciences, San Diego, CA, USA).
Lysosomal activity analysis
Lysosomal activity was determined with LysoSensorTMGreen DND-189 (Thermo Fisher Scientific, Waltham, MA, L-7535). Briefly, for LysoSensor assay, cells were transfected with or without AKT1-MYC-His for 24 h, treated with PI (Bortezomib), cultured with 1 μM LysoSensor probe for 15 min, and harvested. Lysosomal activity was detected using a BD FACSAria III cell sorter (BD Biosciences).
Apoptosis assay
Quantitative apoptotic cell death by PI (Bortezomib) was detected using the Annexin V-propidium iodide (PI) apoptosis detection kit I (BD Biosciences) according to the manufacturer’s instructions [Citation56]. Cells were treated with PI for 24 h. The cells were harvested, washed with cold PBS (Thermo Fisher Scientific, 10,010,023), and stained with ANXA5/Annexin V-fluorescein isothiocyanate and PI at room temperature for 15 min in the dark. Apoptosis was detected using a BD FACSAria III cell sorter (BD Biosciences).
Soluble and insoluble fraction
Cells were lysed for 40 min in ice-cold 1% Triton X-100 lysis buffer (50 mM Tris-Cl, pH 7.4, 150 mM NaCl, 1 mM NaF, 1 mM EDTA, 1 mM Na3VO4, 1 mM DTT, 1% Triton X-100) and supplemented with phosphatase and protease inhibitor cocktail (Thermo Fisher Scientific). After centrifugation (10,000 x g for 15 min), except where specified, only the supernatant was used as cleared lysate for western blot. Pellets were solubilized in 2% SDS (in 50 mM Tris-Cl, pH 7.4) and sonicated.
Immunofluorescence
Cells were pretreated with chloroquine (CQ, 50 μM) or NH4Cl (25 mM) for 1 h prior to the addition of PI (bortezomib, 10 nM) for 8 h. Cells were deposited on poly-L-lysine (0.01% v/v)-coated coverslips and allowed to adhere for 30 min. They were fixed in 4% paraformaldehyde in PBS for 15 min. After four washes in PBS, cells were permeabilized with 0.1% Triton X-100 in PBS for 10 min and blocked with 1% BSA in PBS for 1 h. Cells were incubated overnight at 4°C with primary antibodies against p-AKT (Cell signaling Technology, Danvers, MA, USA, 4060), AKT (Cell signaling Technology, 2920), LAMP1 (Cell signaling Technology, 9091 and 15,665), SQSTM1 (Cell signaling Technology, 88,588) MAP1LC3B (Cell signaling Technology, 3868), HA (Cell signaling Technology, 3724 and 2367), His (Cell signaling Technology, 12,698), and R-HSPA5 (AbFrontier, Seoul, South Korea, AR05-PA0001). After washing, the coverslips were labeled with the secondary antibodies goat anti-mouse IgG (H + L) Alexa Flour-488 (Invitrogen, A-11,029), goat anti-rabbit IgG (H + L) Alexa Flour-488 (Invitrogen, A-11,034), goat anti-mouse IgG (H + L) Alexa Flour-546 (Invitrogen, A-11,030), and goat anti-rabbit IgG (H + L) Alexa Flour-546 (Invitrogen, A-11,035) for 2 h at room temperature. The slides were washed and mounted with DAPI (Invitrogen, P36931). Images were obtained using a confocal laser microscope (A1 R HD25 NSIMS, Nikon, Tokyo, Japan) at the three-dimensional immune system imaging core facility of Ajou University. For colocalization analysis, Pearson’s correlation coefficient was determined for each cell using NIS Elements software. An individual cell was manually selected as an ROI using the polygon selection tool to generate each data point. All images shown are of a single confocal Z-slice. For some confocal microscopy figures, the contrast level was increased in a linear manner using the “Levels” tool in Adobe Photoshop to improve clarity.
Cell lysis and immunoprecipitation
For total cell lysis, CHAPS buffer containing 10 mM Tris-HCl pH 7.4, 150 mM NaCl, 1% CHAPS (Sigma-Aldrich, C9426), 1% Triton X-100, 1 mM EGTA (Sigma-Aldrich, 324,626), 1 mM EDTA (Sigma-Aldrich, T9285), and 10% glycerol was used and supplemented with phosphatase and protease inhibitor cocktail (Thermo Fisher Scientific) and DTT. Cell pellets were resuspended in lysis buffer, vigorously for 15 s, and incubated on ice for 30 min, and centrifuged at 14,000 x g for 30 min at 4°C. Lysed cell pellets were discarded, and the supernatant was analyzed by western blot. For immunoprecipitations to probe ubiquitinated proteins, cells were lysed using regular lysis buffer with NEM (10 mM) to prevent deubiquitination. Lysates were collected, and the same amounts of protein were incubated with 50 μl of protein G Agarose beads (Invitrogen, 15,920–010) and 5 μl of p-AKT (Cell signaling Technology, 4060), AKT (Cell signaling Technology, 4685), and GFP (Abcam, ab290) antibody overnight. Samples were washed thrice with lysis buffer and eluted by SDS sample buffer. After boiling the sample, the protein interaction was determined by western blot.
AKT ubiquitination assays
AKT ubiquitination assays were determined by Ni-NTA affinity isolation or in vitro ubiquitination assays. Ni-NTA affinity isolation ubiquitination assay was performed as described previously [Citation15]. Briefly, cells transfected with AKT1-MYC-His, together with each of the indicated plasmids, were washed with PBS, lysed in 200 μl of denaturing lysis buffer (50 mM Tris-HCl, pH 7.4, 0.5% SDS, 70 mM beta-mercaptoethanol, Sigma-Aldrich, M6250) by vortexing, and boiled for 20 min at 95°C. The lysates were diluted with 800 μl buffer A (50 mM NaH2PO4, 300 mM NaCl, 10 mM imidazole, pH 8.0, protease inhibitor cocktail, and 10 μM MG132) and incubated overnight with 50 μl Ni-NTA Agarose Beads (Invitrogen, R901-15) at 4°C. Beads were washed five times with buffer B (50 mM NaH2PO4, 300 mM NaCl, 20 mM imidazole, pH 8.0), and bound proteins were eluted by boiling in a mixture of 5X SDS-PAGE gel loading buffer and buffer C (50 mM NaH2PO4, 300 mM NaCl, 250 mM imidazole, pH 8.0) (1:4). Thereafter, ubiquitinated AKT was identified with anti-Myc (Cell signaling) and anti-HA (Cell signaling) antibodies on a western blot.
Western blot
For total cellular lysates, cells were lysed on ice in RIPA buffer (50 mM Tris-HCl pH 7.4, 150 mM NaCl, 1% SDS, 0.25% Na-deoxycholate, 0.5% NP-40 (Thermo Fisher Scientific, 85,124), 1 mM EGTA, and 1 mM EDTA) containing phosphatase and protease inhibitor cocktail (Thermo Fisher Scientific) for 1 h at 4°C. Total protein levels were quantified using a Pierce BCA Protein Assay Kit (Thermo Fisher Scientific), and the lysates were diluted to approximately equal concentrations before heating in SDS sample buffer (with a final concentration of 50 mM Tris-Cl, pH 6.8, 2% SDS, 10% glycerol, 5% beta-mercaptoethanol, 0.01% bromophenol blue, Sigma-Aldrich, B0126) at 95°C for 10 min. Equal amounts of sample (typically 20 μM total protein per lane) were separated by SDS-PAGE and subsequently transferred to a polyvinylidene difluoride membrane (Thermo Fisher Scientific, 88,518). Each membrane was blocked with 5% skim milk (BD Difco, Franklin Lakes, NJ, USA, 232,100) for 1 h at room temperature and incubated with a primary antibody (1:1,000) at 4°C overnight. The primary antibodies used included those against p-AKT (Cell Signaling Technology, S473, 9271), p-AKT (Cell Signaling Technology, T308, 13,038), AKT (Cell Signaling Technology, 9272), PARP1 (Cell signaling Technology, 9532), cleaved CAPS3 (Cell Signaling Technology, 9664), GAPDH (Cell Signaling Technology, 5174), Myc (Cell Signaling Technology, 2276 and 2272), MAP1LC3A (Cell Signaling Technology, 4599), MAP1LC3B (Cell Signaling Technology, 3868), Ub (Cell Signaling Technology, 3936), HA (Cell Signaling Technology, 3724), His (Cell Signaling Technology, 12,698), HSPA5 (Cell Signaling Technology, 3177), ATG5 (Cell Signaling Technology, 12,994), ATG12 (Cell Signaling Technology, 2010), ATG16L1 (Cell Signaling Technology, 8089), BECN1 (Cell Signaling Technology, 3495), p-GSK3B (Cell Signaling Technology, S9, 9323), GSK3B (Cell Signaling Technology, 12,456), USP7 (Cell Signaling Technology, 4833), BAX (Cell Signaling Technology, 2772), Total-BID (Cell Signaling Technology, 2002), p-MTOR (Cell Signaling Technology, S2448, 5536), MTOR (Cell Signaling Technology, 2983), p-RPS6KB1 (Cell Signaling Technology, T389, 9234), RPS6KB1 (Cell Signaling Technology, 2708), p-RPS6 (Cell Signaling Technology, S240/244, 5364), p-RPS6 (Cell Signaling Technology, S235/236, 4858), LAMP1 (Cell Signaling Technology, 9091), TFEB (Cell Signaling Technology, 37,785), Flag (Sigma-Aldrich, M2, F3165), FK2 (Millipore, Burlington, MA, USA, 04–263), TUBA (Millipore, CP06), MUL1 (abcam, ab209263 and ab84067), CTSL/V/K/H (abcam, ab133641), GFP (Santa Cruz Biotechnology, B-2, sc-9996), NEK2 (Santa Cruz Biotechnology, D-8, sc-55,601), ATE1 (Santa Cruz Biotechnology, E-6, sc-271,220), and R-HSPA5 (Abfrontier, AR05-PA0001). After washing with 0.1% Tween-20 (Sigma-Aldrich, P1379) in Tris-buffered saline (Sigma-Aldrich, T8912), the membranes were incubated with an HRP-conjugated secondary rabbit antibody (Cell Signaling Technology, 7074) and secondary mouse antibody (Cell Signaling Technology, 7076) for 2 h at room temperature. Proteins were visualized using Amersham ECL Select Western Blotting Detection Reagents (GE Healthcare, Chicago, IL, USA, RPN2235) and detected with an ImageQuant™ LAS 4000 chemiluminescent imaging system (GE Healthcare). Densitometric values were determined and quantified on western blots at non-saturating exposures using the ImageJ software (NIH, Bethesda, Maryland, USA, Java 1.8.0_112) [Citation57] and normalized against GAPDH, which acted as internal loading controls. We tested serially diluted protein lysates with an average amount of target and loading control proteins to explore the linearity of densitometry data. To ensure that the samples were in the linear range of detection, we selected GAPDH as the loading control. Using ImageJ, we recorded the target intensity for each lane and plotted the intensity against the protein load. We determined the linear dynamic range under the specific experimental conditions. Using spiked proteins allowed us to control the amount of total protein per lane while only changing the amount of spiked proteins. These procedures were consistently followed across all western blot studies.
RT-PCR
AKT1 and RNA18 S gene expression were estimated using RT-PCR (BIO-RAD, Hercules, CA, USA, T100TM Thermal Cycler). The total RNA in JJN3 and U266 cells were isolated by TRIzol® Reagent (Thermo Fisher scientific, 15,596,018). cDNAs were synthesized with 5 μg of total RNAs and ReverTra Ace® qPCR RT Master Mix (TOYOBO, Osaka, Japan, FSQ-201) according to the manufacturer’s instructions. PCR primer sequences were as follows: human AKT1, 5′- GCC GGT ATC GTG TGG CAG-3′ and 5′-GGC CGT GCC GCT GGC CGA G-3′; human RNA18 S, 5′-CAC GGA CAG GAT TGA CAG AT-3′ and 5′-CGA ATG GGG TTC AAC GGG TT-3′. PCR products were separated by 1% agarose gel, stained with GelRed Nucleic acid gel stain (Biotium, Fremont, CA, USA), and visualized using ImageQuant™ LAS 4000 (FujiFilm, Tokyo, Japan).
Cell cycle analysis
PI-resistant RPMI8226 cells transfected with mock or pCMV6-MUL1 plasmid for 48 h were harvested, washed with PBS, fixed with ice-cold 70% ethanol overnight at −20°C. The cells were stained with FxCycleTM PI/RNase Staining Solution (Thermo Fisher Scientific) for 1 h at room temperature, protected from light, and cell cycle profile was determined by InvitrogenTM AttuneTM NxT Flow Cytometer (Thermo Fisher Scientific).
Statistical analyses
Data are expressed as means ± standard deviations (SD). Data were analysed by ANOVA, followed by the Student t-test and the Tukey–Kramer multiple comparisons method. Values of *P < 0.05 were considered statistically significant. All experiments were repeated at least three times.
Supplemental Material
Download MS Word (56 MB)Disclosure statement
The authors declare that there are no conflicts of interest.
Supplemental material
Supplemental data for this article can be accessed here.
Additional information
Funding
References
- Collins GA, Goldberg AL. The logic of the 26S proteasome. Cell. 2017;169:792–806.
- Buetow L, Huang DT. Structural insights into the catalysis and regulation of E3 ubiquitin ligases. Nat Rev Mol Cell Biol. 2016;17:626–642.
- Lu Y, Lee BH, King RW, et al. Substrate degradation by the proteasome: a single-molecule kinetic analysis. Science. 2015;348:1250834.
- Li J, Qi W, Chen G, et al. Mitochondrial outer-membrane E3 ligase MUL1 ubiquitinates ULK1 and regulates selenite-induced mitophagy. Autophagy. 2015;11:1216–1229.
- Kraft C, Peter M, Hofmann, K. Selective autophagy: ubiquitin-mediated recognition and beyond. Nat Cell Biol. 2010;12:836–841.
- Moreau P, Richardson PG, Cavo M, et al. Proteasome inhibitors in multiple myeloma: 10 years later. Blood. 2012;120:947–959.
- Song M, Bode AM, Dong Z, et al. AKT as a therapeutic target for cancer. Cancer Res. 2019;79:1019–1031.
- Sun M, Wang G, Paciga JE, et al. AKT1/PKBalpha kinase is frequently elevated in human cancers and its constitutive activation is required for oncogenic transformation in NIH3T3 cells. Am J Pathol. 2001;159:431–437.
- Han F, Li CF, Cai Z, et al. The critical role of AMPK in driving Akt activation under stress, tumorigenesis and drug resistance. Nat Commun. 2018;9:4728.
- Manning BD, Toker A. AKT/PKB signaling: navigating the network. Cell. 2017;169:381–405.
- Li R, Wei J, Jiang C, et al. Akt SUMOylation regulates cell proliferation and tumorigenesis. Cancer Res. 2013;73:5742–5753.
- Sundaresan NR, Pillai VB, Wolfgeher D, et al. The deacetylase SIRT1 promotes membrane localization and activation of Akt and PDK1 during tumorigenesis and cardiac hypertrophy. Sci Signal. 2011;4:ra46.
- Yang WL, Wu CY. Regulation of Akt signaling activation by ubiquitination. Cell Cycle. 2010;9:487–497.
- Xiang T, Ohashi A, Huang Y, et al. Negative regulation of AKT activation by BRCA1. Cancer Res. 2008;68:10040–10044.
- Bae S, Kim SY, Jung JH, et al. Akt is negatively regulated by the MULAN E3 ligase. Cell Res. 2012;22:873–885.
- Kim SY, Kim HJ, Kang SU, et al. Non-thermal plasma induces AKT degradation through turn-on the MUL1 E3 ligase in head and neck cancer. Oncotarget. 2015;6:33382–33396.
- Kim SY, Kim HJ, Kim HJ, et al. HSPA5 negatively regulates lysosomal activity through ubiquitination of MUL1 in head and neck cancer. Autophagy. 2018;14:385–403.
- Li J, Ni M, Lee B, et al. The unfolded protein response regulator GRP78/BiP is required for endoplasmic reticulum integrity and stress-induced autophagy in mammalian cells. Cell Death Differ. 2008;15:1460–1471.
- Wang M, Ye R, Barron E, et al. Essential role of the unfolded protein response regulator GRP78/BiP in protection from neuronal apoptosis. Cell Death Differ. 2010;17:488–498.
- Wang J, Pareja KA, Kaiser CA, et al. Redox signaling via the molecular chaperone BiP protects cells against endoplasmic reticulum-derived oxidative stress. Elife. 2014;3:e03496.
- Cha-Molstad H, Sung KS, Hwang J, et al. Amino-terminal arginylation targets endoplasmic reticulum chaperone BiP for autophagy through p62 binding. Nat Cell Biol. 2015;17:917–929.
- Suizu F, Hiramuki Y, Okumura F, et al. The E3 ligase TTC3 facilitates ubiquitination and degradation of phosphorylated Akt. Dev Cell. 2009;17:800–810.
- Manasanch EE, Orlowski RZ. Proteasome inhibitors in cancer therapy. Nat Rev Clin Oncol. 2017;14:417–433.
- Ciechanover A. Proteolysis: from the lysosome to ubiquitin and the proteasome. Nat Rev Mol Cell Biol. 2005;6:79–87.
- Fang J, Rhyasen G, Bolanos L, et al. Cytotoxic effects of bortezomib in myelodysplastic syndrome/acute myeloid leukemia depend on autophagy-mediated lysosomal degradation of TRAF6 and repression of PSMA1. Blood. 2012;120:858–867.
- Larrue C, Saland E, Boutzen H, et al. Proteasome inhibitors induce FLT3-ITD degradation through autophagy in AML cells. Blood. 2016;127:882–892.
- Mimura N, Hideshima T, Shimomura T, et al. Selective and potent Akt inhibition triggers anti-myeloma activities and enhances fatal endoplasmic reticulum stress induced by proteasome inhibition. Cancer Res. 2014;74:4458–4469.
- Wang RC, Wei Y, An Z, et al. Akt-mediated regulation of autophagy and tumorigenesis through Beclin 1 phosphorylation. Science. 2012;338:956–959.
- Matsuda-Lennikov M, Suizu F, Hirata N, et al. Lysosomal interaction of Akt with phafin2: a critical step in the induction of autophagy. PLoS One. 2014;9:e79795.
- Hirata N, Suizu F, Matsuda-Lennikov M, et al. Functional characterization of lysosomal interaction of Akt with VRK2. Oncogene. 2018;37:5367–5386.
- Arias E, Koga H, Diaz A, et al. Lysosomal mTORC2/PHLPP1/Akt regulate chaperone-mediated autophagy. Mol Cell. 2015;59:270–284.
- Dantuma NP, Salomons FA. Ubiquitin versus misfolding: the minimal requirements for inclusion body formation. J Cell Biol. 2016;213:147–149.
- Johnston JA, Ward CL, Kopito RR. Aggresomes: a cellular response to misfolded proteins. J Cell Biol. 1998;143:1883–1898.
- Myeku N, Figueiredo-Pereira ME. Dynamics of the degradation of ubiquitinated proteins by proteasomes and autophagy: association with sequestosome 1/p62. J Biol Chem. 2011;286:22426–22440.
- Kirkin V, McEwan DG, Novak I, et al. A role for ubiquitin in selective autophagy. Mol Cell. 2009;34:259–269.
- Itakura E, Mizushima N. p62 targeting to the autophagosome formation site requires self-oligomerization but not LC3 binding. J Cell Biol. 2011;192:17–27.
- Cha-Molstad H, Yu JE, Lee SH, et al. Modulation of SQSTM1/p62 activity by N-terminal arginylation of the endoplasmic reticulum chaperone HSPA5/GRP78/BiP. Autophagy. 2016;12:426–428.
- Lee DH, Kim D, Kim ST, et al. PARK7 modulates autophagic proteolysis through binding to the N-terminally arginylated form of the molecular chaperone HSPA5. Autophagy. 2018;14:1870–1885.
- Pérez-Galán P, Roué G, Villamor N, et al. The proteasome inhibitor bortezomib induces apoptosis in mantle-cell lymphoma through generation of ROS and noxa activation independent of p53 status. Blood. 2006;107:257–264.
- Miller CP, Ban K, Dujka ME, et al. NPI-0052, a novel proteasome inhibitor, induces caspase-8 and ROS-dependent apoptosis alone and in combination with HDAC inhibitors in leukemia cells. Blood. 2007;110:267–277.
- Franqui-Machin R, Hao M, Bai H, et al. Destabilizing NEK2 overcomes resistance to proteasome inhibition in multiple myeloma. J Clin Invest. 2018;128:2877–2893.
- Chauhan D, Tian Z, Nicholson B, et al. A small molecule inhibitor of ubiquitin-specific protease-7 induces apoptosis in multiple myeloma cells and overcomes bortezomib resistance. Cancer Cell. 2012;22:345–358.
- Kern J, Untergasser G, Zenzmaier C, et al. GRP-78 secreted by tumor cells blocks the antiangiogenic activity of bortezomib. Blood. 2009;114:3960–3967.
- Jagannathan S, Abdel-Malek MA, Malek E, et al. Pharmacologic screens reveal metformin that suppresses GRP78-dependent autophagy to enhance the anti-myeloma effect of bortezomib. Leukemia. 2015;29:2184–2191.
- Banerji U, Dean EJ, Pérez-Fidalgo JA, et al. A phase I open-label study to identify a dosing regimen of the Pan-AKT inhibitor AZD5363 for evaluation in solid tumors and in PIK3CA-mutated breast and gynecologic cancers. Clin Cancer Res. 2018;24:2050–2059.
- Saura C, Roda D, Roselló S, et al. A first-in-human phase I study of the ATP-competitive AKT inhibitor ipatasertib demonstrates robust and safe targeting of AKT in patients with solid tumors. Cancer Discov. 2017;7:102–113.
- Spencer A, Yoon SS, Harrison SJ, et al. The novel AKT inhibitor afuresertib shows favorable safety, pharmacokinetics, and clinical activity in multiple myeloma. Blood. 2014;124:2190–2195.
- Mani A, Gelmann EP. The ubiquitin-proteasome pathway and its role in cancer. J Clin Oncol. 2005;23:4776–4789.
- Zhang B, Huang J, Li HL, et al. GIDE is a mitochondrial E3 ubiquitin ligase that induces apoptosis and slows growth. Cell Res. 2008;18:900–910.
- Liu XD, Ko S, Xu Y, et al. Transient aggregation of ubiquitinated proteins is a cytosolic unfolded protein response to inflammation and endoplasmic reticulum stress. J Biol Chem. 2012;287:19687–19698.
- Weber A, Cohen I, Popp O, et al. Sequential poly-ubiquitylation by specialized conjugating enzymes expands the versatility of a quality control ubiquitin ligase. Mol Cell. 2016;63:827–839.
- Yau RG, Doerner K, Castellanos ER, et al. Assembly and function of heterotypic ubiquitin chains in cell-cycle and protein quality control. Cell. 2017;171:918–933.
- Liu C, Liu W, Ye Y, et al. Ufd2p synthesizes branched ubiquitin chains to promote the degradation of substrates modified with atypical chains. Nat Commun. 2017;8:14274.
- Ohtake F, Tsuchiya H, Saeki Y, et al. K63 ubiquitylation triggers proteasomal degradation by seeding branched ubiquitin chains. Proc Natl Acad Sci USA. 2018;115:E1401–E1408.
- Fletcher AJ, Mallery DL, Watkinson RE, et al. Sequential ubiquitination and deubiquitination enzymes synchronize the dual sensor and effector functions of TRIM21. Proc Natl Acad Sci USA. 2015;112:10014–10019.
- Jo GH, Bögler O, Chwae YJ, et al. Radiation-induced autophagy contributes to cell death and induces apoptosis partly in malignant glioma cells. Cancer Res Treat. 2015;47:221–241.
- Schneider CA, Rasband WS, Eliceiri KW. NIH Image to ImageJ:25 years of image analysis. Nat Methods. 2012;9:671–675.