
 ?Mathematical formulae have been encoded as MathML and are displayed in this HTML version using MathJax in order to improve their display. Uncheck the box to turn MathJax off. This feature requires Javascript. Click on a formula to zoom.
ABSTRACT
Children with ependymoma have high mortality rates because ependymoma is resistant to conventional therapy. Genomic and transcriptomic studies have identified potential targets as significantly altered genes in ependymoma patients. Although several candidate oncogenes in ependymoma were recently reported, the detailed mechanisms for the roles of these candidate oncogenes in ependymoma progression remain unclear. Here, we report an oncogenic role of the nucleoporin TPR (translocated promoter region, nuclear basket protein) in regulating HSF1 (heat shock transcription factor 1) mRNA trafficking, maintaining MTORC1 activity to phosphorylate ULK1, and preventing macroautophagy/autophagy induction in ependymoma. High expression of TPR were associated with increased HSF1 and HSPA/HSP70 expression in ependymoma patients. In an ependymoma mouse xenograft model, MTOR inhibition by rapamycin therapeutically suppressed TPR expression and reduced tumor size in vivo. Together, these results suggest that TPR may act as a biomarker for ependymoma, and pharmacological interventions targeting TPR-HSF1-MTOR may have therapeutic potential for ependymoma treatment.
Abbreviations: ATG: autophagy related; BECN1: beclin 1; BSA: bovine serum albumin; CQ: chloroquine; DMSO: dimethyl sulfoxide; GEO: gene expression omnibus; GFP: green fluorescence protein; HSF1: heat shock transcription factor 1; HSPA/HSP70: heat shock protein family A (Hsp70); LMNB1: lamin B1; MAP1LC3B/LC3B: microtubule-associated protein 1 light chain 3 beta; MAPK: mitogen-activated protein kinase; MAPK8/JNK: mitogen-activated protein kinase 8; MTORC1: mechanistic target of rapamycin kinase complex 1; NPC: nuclear pore complex; NUP: nucleoporin; PBS: phosphate-buffered saline; q-PCR: quantitative real time PCR; SDS: sodium dodecyl sulfate; SQSTM1: sequestosome 1; STED: stimulated emission depletion microscopy; STX17: syntaxin 17; TCGA: the cancer genome atlas; TPR: translocated promoter region, nuclear basket protein; ULK1: unc-51 like autophagy activating kinase 1.
KEYWORDS:
Introduction
Ependymomas are tumors of the brain and spinal cord that comprise approximately 10% of childhood central nervous system neoplasms and about 30% in children aged <3 years [Citation1]. Genomic studies have subdivided supratentorial, posterior fossa, and spinal ependymomas into clinically meaningful and molecularly distinct subgroups [Citation2–4]. Meanwhile, the World Health Organization scores this tumor into three main grades, although the grading into grades II and III remains controversial because of the elusive histological criteria, with no defined cutoff values for mitoses or percentage of tumor depicting increased cellularity [Citation5]. Grading scores are also unreliable for predicting outcomes in several situations. Thus, there is a substantial need to identify solid molecular biomarkers that can better predict clinical outcomes and aid in the design of effective tailored therapy [Citation6]. Owing to its chemoresistant nature, surgery followed by radiation is the most effective treatment option for ependymoma. Unfortunately, despite advances in radiotherapy, cerebral radiation treatment of younger children has associated risks because of the heightened sensitivity of the developing brain. Therefore, better adjuvant treatments are needed, especially for children [Citation7].
Genomic and transcriptomic studies have recently defined distinct molecular subgroups and identified potential targets as significantly altered genes in ependymoma patients [Citation8–10]. The genome of human ependymoma is relatively stable, unlike that of glioblastoma with its multiple sequences and copy number alterations, although the loss of chromosome 22 and gain of 1q remain the most frequent genomic aberrations in ependymoma [Citation11].
TPR is one of the structural components of the nuclear pore complex (NPC) [Citation12–16]. Strikingly, increased relative copy numbers of at least one gene on 1q were detected in 61% of ependymoma cases, with TPR at 1q25 showing relative copy number gains in 38% of cases [Citation8]. These bioinformatics findings provide a potential link between TPR upregulation and ependymoma progression. We hypothesized that TPR might play oncogenic roles in promoting tumorigenesis of ependymoma.
A previous study reported that HSF1 suppresses MAPK8/JNK (mitogen-activated protein kinase 8) to maintain MTORC1 integrity and activity to combat stress and promote cell growth [Citation17,Citation18]. In this report, we show that TPR depletion leads to decreased Hsf1 mRNA export, reduced HSF1 protein levels, and autophagy induction in ependymoma cells. Induction of autophagy with the MTOR inhibitor rapamycin resulted in the reduction of TPR expression in mouse ependymoma cells and xenografted ependymoma mice. Morphologically, TPR depletion induced autophagy marker LC3-II/Atg8–PE nuclear translocation. We also captured TPR, LC3-II, LMNB1 (lamin B1), and chromatin nuclear budding complexes, which induced nucleophagy, in both TPR-depleted or rapamycin-treated ependymoma cells. Our findings suggest that, in response to environmental stress, autophagy degrades nuclear material to drive cellular senescence, as a means to restrain ependymoma tumorigenesis. Indeed, we found that the mRNA levels of autophagy-related proteins were low in ependymomas. Moreover, inhibition of MTOR reduced TPR expression, suppressed tumor growth, and extended the lifespan of xenografted ependymoma mice. Therefore, TPR may act as a biomarker for ependymoma, and pharmacological interventions targeting TPR-HSF1-MTOR may have therapeutic potential for ependymoma treatment.
Results
TPR expression is high in ependymoma patients
To explore the expression profiles of nuclear pore proteins (NUPs) in healthy and ependymoma human tissues, we compared the mRNA expressions of several oncogenic NUPs (NUP214, NUP133, NUP93, RAE1, NUP153, NUP88, NUP98, NUP155, RANBP2/NUP358, NUP62, and TPR) in normal versus tumor tissue samples using RNA sequencing data from The Cancer Genome Atlas (TCGA) and cDNA microarray data from the Gene Expression Omnibus (GEO; series GSE7410). Among the examined NUPs, TPR was the top gene with consistent overexpression in all types of ependymoma tissues (p < 0.05; , and S1A). To examine the protein expression profile of TPR in brain tissues, we performed immunoblotting and immunohistochemistry analyses and compared TPR expression in frozen tissues from ependymoma patients and non-tumor brain tissue (Table S1). We found that TPR, but not NUP153 (another nuclear pore basket protein) or NUP98 (other oncogenic NUP), was highly expressed in patient samples, indicating that TPR was upregulated in ependymoma ( and S1B). These in silico and in vivo findings indicate that TPR has specific high expression in ependymoma vs. normal cells, suggesting a role as a potent oncogene.
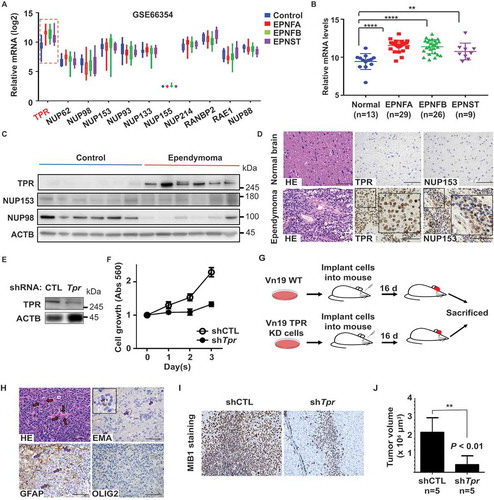
Figure 1. TPR expression is high in ependymoma patients. (A) Identification of TPR as a potent oncogene in ependymoma. A graph representing NUPs transcript levels in normal and ependymoma patients from GEO (GSE66354) reveals that mRNA level of TPR was specifically high in ependymoma patients. (B) The mRNA levels of TPR in non-tumor brain tissue (control) compared to ependymoma patients was significantly lower. P values are based on one-way ANOVA test with **** indicating P < 0.0001. (C) The protein level of TPR, NUP153, and NUP98 in ependymoma patients compared to control. (D) Immunohistochemistry of TPR and NUP153 from ependymoma patients’ tissue (scale bar: 100 μm). (E) Western blot analysis of TPR in Vn19 cells after shRNA-mediated Tpr depletion. (F) TPR depletion reduced proliferation of ependymoma cells (Vn19) in vitro. (G) Schematic illustration for in vivo mice model study to compare the growth of Vn19 WT and Vn19 TPR-depleted cells. (H) HE and IHC staining of several ependymoma markers from mice xenograft model. HE staining demonstrated monomorphic cells proliferation, perivascular pseudorosettes and true ependymal rosettes, which are typical findings of ependymoma. Dot-like cytoplasmic reactivity was identified in microrosettes with EMA staining. Some of these cells are GFAP-positive in the cytoplasm, whereas OLIG2 staining shows negative (scale bar: 100 μm). (I) Depletion of TPR reduced proliferation of cancer cells in mice xenograft model indicated by MIB1 staining as proliferation marker. (J) Mean volume ± SD of the tumors removed from the respective groups of mice. shTpr mouse model showed a remarkable reduction of the tumor volume compared with that in the shCTL group. P values are based on Student’s t-test between two groups with ** indicating P < 0.01
Previous ependymoma studies relied on orthotopic or flank human xenograft models, even though the grafts were extremely difficult to derive and maintain in vivo and in vitro because reliable ependymoma cell lines did not exist [Citation19–21]. To dissect the role of TPR in ependymoma growth, we silenced TPR expression in mouse ependymoma cell line Vn19 [Citation22] (), and determined that TPR was required for proliferation of Vn19 cells ().
We aimed to clarify the potential role of TPR in the invasive behavior of ependymoma and to determine whether TPR could serve as a potential therapeutic target. For this, we used a mouse brain xenograft model [Citation22,Citation23] involving wild-type Vn19 cells and Tpr shRNA-transfected Vn19 cells with specific silencing of endogenous TPR expression. To investigate the in vivo model, mice (n = 5) were transplanted with shCTL or shTpr Vn19 cell xenografts into their brain, respectively (). Depletion of TPR significantly prevented ependymoma growth (). Collectively, these data supported the notion that nucleoporin TPR expression is critical for ependymoma invasion and proliferation and that TPR functions as a potential oncogene.
TPR depletion induces nucleophagy
Previously, we found that TPR depletion induced autophagy in HeLa cells [Citation24]. Therefore, we investigated the potential mechanistic relationship between TPR expression and autophagy induction in ependymoma cells. Considering the important role of the ATG family during autophagy [Citation25,Citation26], we performed a quantitative RT-PCR analysis to measure the mRNA levels of several autophagy-related proteins, including ATG family members and BECN1 (beclin 1). The mRNA levels of ATG3, ATG5, ATG12, and BECN1 were significantly lower in ependymoma patients compared with control subjects ( and Table S1). Moreover, we also performed western blotting analysis for LC3B and SQSTM1/p62 (sequestosome 1) of patient samples, and we found LC3-II protein expression was downregulated in ependymoma patients ( and S1C). Vn19 cells expressed high TPR expression compared to the normal mice brain, and this accompanied by lower expression of Atg3, Atg5, Atg12, and Becn1 mRNA levels () as well as ATG3 and LC3-II protein levels (). Consistently, when TPR was knocked down in Vn19 cells, we observed the upregulation of Atg3, Atg5, Atg12, and Becn1 mRNA levels () and ATG3 and LC3-II protein levels (). Indeed, we previously found that TPR depletion was reported to induce autophagy in HeLa cells [Citation24]. Thus, it is rational to put forward that TPR overexpression may inhibit autophagy induction in ependymoma cells. Therefore, we overexpressed GFP-Tpr in Vn19 cells and treated the cells with bafilomycin A1 (a lysosomal inhibitor agent), and as predicted, we found that LC3B and SQSTM1 protein levels were less in Vn19 overexpressed GFP-Tpr cells compared to Vn19 overexpressed GFP-V cells (). By using bafilomycin A1, we found that knockdown of TPR following by protease or lysosomal inhibitor treatment accumulated LC3-II and SQSTM1 expressions, indicating that TPR depletion is inducing autophagy and not just merely blocking it (). In immunostaining stimulated emission-depleted (STED) nanoscopy analysis, we visualized that knockdown of TPR induced the formation of nuclear membrane blebbing and enhanced the punctate distribution of LC3B (autophagy marker). Remarkably, LC3B showed significant accumulation in the nucleus of TPR-depleted cells compared with control cells (, and S2A–C).
Figure 2. TPR depletion induces nucleophagy in ependymoma cell line. (A) Autophagy markers levels in ependymoma patients’ samples. The levels of mRNA from 8 healthy human samples (control) and 10 from ependymoma patients were retrieved by q-RT PCR analysis. Several autophagy related genes were significantly lower in ependymoma patients compared to normal brain samples. P values are based on Student’s t-test with **** indicating P < 0.0001. (B) The protein level of SQSTM1 and LC3B in ependymoma patients compared to control. (C) The mRNA levels of several autophagy related genes in Vn19 cells compared to normal mice brain. P values are based on Student’s t-test with *** indicating P < 0.001. (D) The protein levels ATG3 and LC3-II were significantly higher in normal mice brain compared to Vn19. (E) The mRNA levels of several autophagy related genes were increased in TPR-depleted Vn19 cells. Data show mean ± SD from two independent experiments (n = 2). P values are based on Student’s t-test with ** indicating P < 0.01. (F) ATG3 and LC3-II protein levels were increased in TPR-depleted Vn19 cells. (G) The protein levels of LC3B and SQSTM1 in Vn19 cells transfected with GFP-V and GFP-Tpr in the absence or presence of bafilomycin A1 treatment. (H) The protein levels of TPR, SQSTM1, and LC3B in TPR knockdown cells in the absence or presence of bafilomycin A1 treatment. (I) Nuclear accumulation of LC3B in TPR-depleted Vn19 cells (scale bar: 2.5 μm). (J) LC3B localization in the nuclear was increased following TPR depletion (scale bar: 10 μm). (K) Live cell imaging analysis of Vn19 GFP-Lc3b cells after transfected with siCTL and siTpr (scale bar: 10 μm)
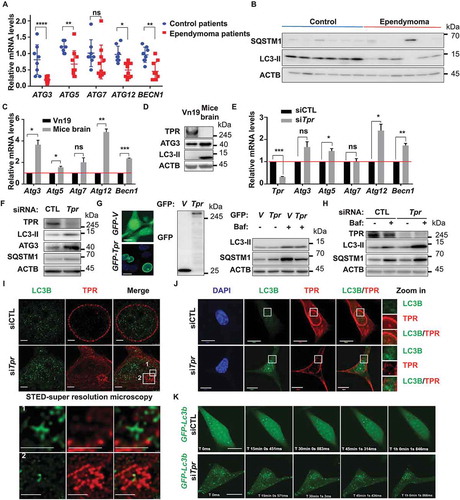
Next, we also performed live-cell imaging of Vn19 cells expressing GFP-Lc3b, and the same cells after transfected with siCTL or siTpr. We observed the same phenotype; wherein siTpr-transfected cells showed LC3B nuclear trafficking after 48 h of treatment, suggesting that TPR depletion may play a role for nucleophagy induction in Vn19 cells ( and Movie S1). Collectively, these results suggest the hypothesis that ependymoma cells can prevent the autophagy process to maintain their survival.
TPR depletion induces abnormality in the nuclear export of Hsf1 mRNA
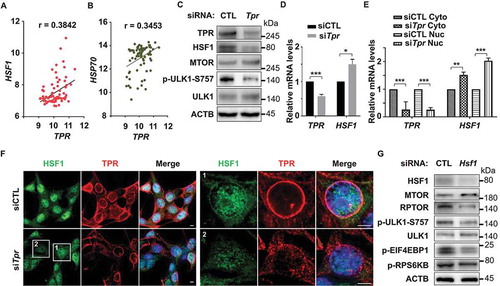
The above findings prompted us to investigate the possible mechanism underlying the process for autophagy induction after TPR depletion in ependymoma cells. A recent study indicated that HSF1 critically attunes proteotoxic-stress sensing by MTORC1 to combat stress and promote growth [Citation17]. Recently, we and others showed that TPR might act as a nuclear gatekeeper and regulator for HSF1 mRNA export [Citation24,Citation26–28]. To elucidate whether a similar mechanism is present in ependymoma or not, we first analyzed the correlation between HSF1 and TPR in ependymoma patients and found that TPR and HSF1, as well as TPR and HSP70, has a positive correlation (). Next, we depleted TPR expression in Vn19 cells and observed the protein levels of HSF1. We found that HSF1 protein levels were reduced, accompanied by the upregulation of SQSTM1 and reduction of ULK1 phosphorylation on S757 residue, which is the target residue for MTORC1 phosphorylation to prevent autophagy induction ( and ). Interestingly, we found that the mRNA levels of Hsf1 following TPR depletion was significantly higher compared to control (). Next, we performed fractionation assay and found that the mRNA levels of Hsf1, but not the ATG family, in the nucleus fraction was significantly higher in TPR-depleted cells compared to the control (), suggesting the Hsf1 mRNA export failure following TPR depletion. To further investigate the localization of HSF1, we employed immunostaining analysis and found that HSF1 protein levels were reduced both in the cytoplasmic and nuclear fraction after TPR depletion (). In support of this notion, we performed HSF1 knockdown assay and observed the reduction of p-ULK1-S757, p-RPS6BK1/p70S6K (ribosomal protein S6 kinase B1), p-EIF4EBP1 (eukaryotic translation initiation factor 4E binding protein 1) and RPTOR protein levels, suggesting the inhibition of MTORC1 activity ().
Figure 3. TPR depletion induces abnormality in the nuclear export of Hsf1 mRNA. (A) Correlation analysis between TPR and HSF1 in ependymoma patients (GSE66354). Pearson r value is based on correlation analysis with P value (two tailed) = 0.0006. (B) Correlation analysis between TPR and HSP70 in ependymoma patients (GSE66354). Pearson r value is based on correlation analysis with P value (two tailed) = 0.0021. (C) HSF1 and p-ULK1-S757 protein levels were decreased following TPR depletion. (D) The mRNA levels of Hsf1 following TPR depletion. P values are based on Student’s t-test with *** indicating P < 0.001. (E) The Hsf1 mRNA in cytoplasmic and nuclear fraction following TPR depletion. P values are based on one-way ANOVA with *** indicating P < 0.001. (F) Immunostaining analysis of HSF1 following TPR depletion. (G) Western blotting analysis of several autophagy related proteins in Vn19 cells following HSF1 depletion
Inhibition of MTOR activity by rapamycin depleted TPR expression and induced nucleophagy
Upon activation, MTOR is phosphorylated on several residues, including T2446, S2448, and S2481. MTORC1 contains MTOR phosphorylation predominantly on S2448, whereas MTORC2 contains MTOR phosphorylation predominantly on S2481. The proposed AKT phosphorylation site (Ser-2448) in MTOR lies within a C-terminal regulatory region, which, when deleted, results in elevated MTOR activity in vitro. MTOR phosphorylation at Ser-2448 is blocked by rapamycin, and this effect is independent of the AKT activation status, which suggests that Ser-2448 phosphorylation is catalyzed by a protein kinase other than AKT [Citation29]. A previous study reported that MTOR is essential for the HSF1 activation, and the selective TORC1 inhibitor rapamycin could block this activation [Citation30]. To further investigate the effect of MTOR inhibition on TPR and HSF1 activity, we performed immunoblotting of Vn19 cells treated with DMSO or 10 nM rapamycin. TPR and HSF1 were significantly reduced following MTOR inhibition for 24 and 48 h. Moreover, depletion of TPR expression was accompanied by the induction of autophagy. The protein levels of autophagy-related proteins LC3-II and ATG3 were significantly increased after 24 h of rapamycin treatment (). Meanwhile, the protein levels of SQSTM1 were significantly reduced. In addition, the mRNA levels of other autophagy-related proteins, including Atg5, Atg12, and Becn1, were increased after 24 h of treatment with 10 nM rapamycin and that of Atg7 was significantly increased after 48 h ().
Figure 4. MTOR inhibition depleted TPR expression in vitro and induced nucleophagy. (A) Western blotting analysis of Vn19 cells treated with DMSO or rapamycin for 24 or 48 h. (B) Q-RT PCR analysis of autophagy related genes in Vn19 cells treated with DMSO or 10 nM rapamycin. Data show mean ± SD from three independent experiments (n = 3). P values are based on Student’s t-test with (***) indicating P < 0.001. (C) STED – immunostaining analysis of LC3B and TPR in Vn19 cells treated with DMSO or 10 nM rapamycin. Cell membrane blebbing were highlighted in the square (scale bar: 2.5 μm). (D) TEM analysis of Vn19 cells treated with either DMSO or 10 nM rapamycin. Autophagic vacuoles are indicated by arrows and highlighted on the right. (E) Vn19 cells treated with rapamycin or rapamycin + chloroquine (CQ) and stained with nuclear envelope protein LMNB1 and TPR. Treatment with CQ could recover TPR expression (scale bar: 5 μm). (F) Western blotting analysis of TPR, SQSTM1, and LC3B protein expression in Vn19 cells treated with CQ or siStx17 in the absence and presence of rapamycin treatment
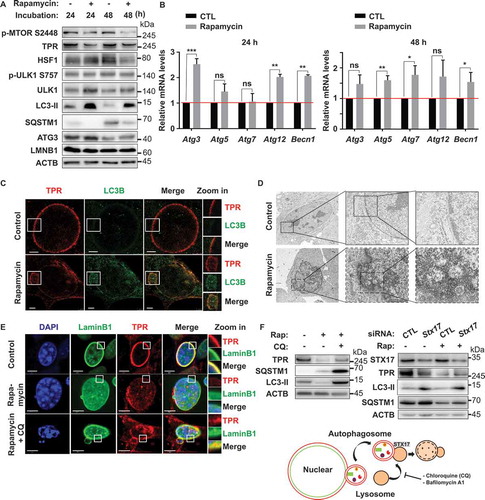
Nucleophagy is the selective removal of nuclear material from a cell by autophagy [Citation31]. Formation of nuclear membrane blebs or perinuclear autophagosomes is a characteristic of this process. In nucleophagy, autophagosomes sequester nucleus-derived cargos and subsequently fuse with lysosomes, resulting in the degradation of their contents [Citation32]. Based on the observed increase in LC3-II nuclear fluorescence staining, we further investigated the effect of TPR-MTOR inhibition on nucleophagy by STED nanoscopy and electron microscopy of Vn19 cells after MTOR inhibitor treatment. A significant number of Vn19 cells underwent nucleophagy, indicated by upregulation of LC3B expression and formation of nuclear membrane blebbing after treatment with 10 nM rapamycin for 48 h (). Consistent with this finding, we also performed live-cell imaging of Vn19 cells expressing GFP-Tpr and the same cells after treatment with DMSO or rapamycin. We observed the same phenotype, wherein, rapamycin-treated cells showed nuclear membrane blebbing (Figure S3 and Movie S2). One possible mechanism underlying this process after MTOR inhibition is the nuclear accumulation of LC3B [Citation33]. To test this hypothesis, we performed live-cell imaging of Vn19 cells expressing GFP-Lc3b. Vn19 cells were transfected with a plasmid expressing GFP-Lc3b and then treated with DMSO or 10 nM rapamycin for 24 or 48 h. We found that more LC3B was localized in the nucleus of rapamycin-treated Vn19 cells compared with DMSO-treated control cells. Remarkably, the movement of tiny vesicle-like structures was observed to start from the middle of the nucleus and gradually progress to the cellular periphery (Figure S4 and Movie S3). To further support this notion, we also performed fractionation of Vn19 cells treated with DMSO or 10 nM of rapamycin for 48 h. We found that the protein level of LC3-II was increased in both the cytoplasmic and nuclear fractions of Vn19 cells treated with 10 nM rapamycin (Figures S5A and S5B), suggesting the nucleophagy induction by rapamycin treatment. To investigate the mechanism underlying TPR protein degradation after rapamycin treatment, we treated Vn19 cells with rapamycin in the presence or absence of chloroquine (CQ; lysosome inhibitor). Strikingly, CQ treatment was able to recover TPR protein expression (, and S5C), suggesting that TPR degradation occurred by nucleophagy. In addition, to confirm this effect is autophagy-specific, we further performed STX17 (syntaxin 17) depletion in Vn19 cells in combination with rapamycin treatment. STX17 is a protein that contributes to the autophagy pathway at several stages, including the autolysosome formation stage, through its binding to the autophagosome membrane [Citation34]. Consistently, we found that depleting STX17 blocked autophagic flux accompanied by partially recovered TPR protein expression and accumulation of LC3-II and SQSTM1 protein levels ().
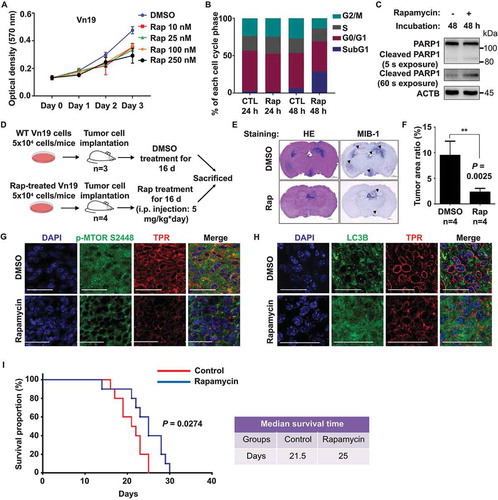
To examine whether rapamycin can regulate ependymoma Vn19 cell proliferation, we performed MTT assays and flow cytometry analyses. We found that rapamycin treatment inhibited Vn19 cell growth and induced apoptotic cell death (), suggesting that rapamycin-mediated suppression of TPR expression led to inhibition of Vn19 cell growth. To determine the physiological significance of the TPR-MTOR interaction for ependymoma therapeutic strategies, we conducted in vivo tumor-formation assays. We transplanted Vn19 cells and confirmed that the tumor histology in our animal model had the typical characteristic features of ependymoma, before treating the mice with DMSO or rapamycin for 2 weeks (). We calculated and compared the ratios of tumor area to whole-brain section area in DMSO-treated control mice and rapamycin-treated mice. The rapamycin-treated mice showed a remarkable reduction in their tumor area compared with the control mice (). More importantly, rapamycin treatment repressed MTOR-HSF1 activity and induced significant nucleophagy. We further dissected the mouse brains and measured the TPR and MTOR expression. Consistently, we found reductions in TPR expression and MTOR phosphorylation and upregulation of LC3-II (, and S5D). In addition, Kaplan-Meier survival analysis indicated that rapamycin significantly prolonged the survival of the mouse model comparing to the control group, with median survival 25 d for rapamycin and 21.5 d for control (P = 0.0274) (). Previously, we showed that TPR interacts with AURKA (aurora kinase A) during mitosis [Citation35]. Thus, we examined the effect of MLN8237, an AURKA inhibitor that also reduces TPR expression. However, we did not observe ependymoma growth inhibition after MLN8237 treatment in mouse xenograft experiments (Figure S6). Collectively, these data indicated that the TPR role in preventing autophagy is critical for ependymoma cell survival (Figure S7).
Figure 5. Inhibition of MTOR by rapamycin induced autophagy and reduced tumor size in vivo. (A) Cell proliferation assay of Vn19 cells after treatment with rapamycin. Data show mean ± SD from three independent experiments (n = 3). (B) Cell cycle profile analysis of Vn19 cells treated with DMSO or 10 nM rapamycin for 24 or 48 h. SubG1 fraction was significantly higher after treatment with rapamycin for 48 h. (C) Western blotting analysis of cleaved PARP1 in Vn19 cells after treatment with 10 nM of rapamycin for 48 h. (D) Schematic illustration for mice model study to examine the effect of rapamycin treatment on tumor cell proliferation in vivo. (E) Representative histologic and immunohistochemical sections of untreated and rapamycin-treated brain tumors. Tumor cells were detected by H&E and staining for MIB1. Mice treated with rapamycin showed a shrunken tumor mass limited in third ventricle; control group showed expanding grown tumor both lateral and third ventricles (scale bar: 1000 μm). (F) Mice treated with rapamycin showed a remarkable reduction of the size of tumor area compared with that in the control group. P values are based on Student’s t-test between two groups with ** indicating P < 0.01. (G) Immunostaining of mice brain with anti-TPR and anti-p-MTOR S2448 antibody. Inhibition of MTOR by rapamycin significantly reduced p-MTOR S2448 protein level (scale bar: 30 μm). (H) Immunostaining of mice brain with anti-TPR and anti LC3B antibody. Inhibition of MTOR by rapamycin induced autophagy and significantly increased the protein level expression of LC3B (scale bar: 30 μm). (I) Survival of mice treated with rapamycin (n = 10) and DMSO (control) (n = 10). Rapamycin treatment significantly prolonged survival of the ependymoma Vn19 mouse model. Log-rank test, P = 0.0274
Discussion
Ependymoma is the third most common pediatric brain tumor [Citation36]. Ependymoma heterogeneity, which manifests as variations in tumor location, patient age, histological grade, and clinical behavior, together with the observation of a balanced genomic profile in up to 50% of cases, presents additional challenges in understanding the development and progression of this disease [Citation37]. The ability to examine functional biological questions in ependymomas has been hampered ependymoma studies were hindered by the small number of tumors available for research and lack of cell lines and animal models [Citation19–21,Citation36,Citation37]. To address these difficulties, in this study, we integrated a mouse ependymoma cell line, xenograft mouse models, available omics data in public databases, together with our ependymoma patient’s samples, providing the first evidence for a critical role of autophagy/nucleophagy in the protective effect of ependymoma carcinogenesis via a nuclear pore protein TPR.
Autophagy is an adaptive response activated upon stress to keep cellular energy homeostasis and to remove protein aggregates and damaged organelles via the autolysosomal degradation pathway. It is a lysosome-dependent recycling mechanism that leads to the sequestration of intracellular components into autophagosomes and lysosomal degradation by autophagosome-lysosome fusion [Citation38,Citation39]. Autophagy initiation begins with the activation of ULK1 and AMBRA1 complexes following AMPK activation and MTOR inhibition [Citation40,Citation41]. SQSTM1/p62 (sequestosome 1) is a ubiquitin-and LC3-binding protein. The analysis of SQSTM1 protein levels, along with LC3-II, can provide insight into autophagic flux in a tissue-dependent manner. The protein levels of SQSTM1 inversely correlate with autophagic activity in most conditions, because SQSTM1 directly binds to LC3B and gets selectively incorporated into autophagosomes and degraded by autophagy [Citation42]. However, the expression level of SQSTM1 can also be changed independently of autophagy. Therefore, the presentation of only SQSTM1 data may not be sufficient to estimate the autophagic flux, and combination with other methods will be preferred [Citation43]. In this study, we found that knockdown of TPR itself increased SQSTM1 protein levels; however, knockdown of TPR in combination with lysosomal inhibitor treatment could accumulate more SQSTM1 and LC3-II protein levels compared to the cells treated with scrambled siRNA, indicating that knockdown of TPR induces autophagy ().
TPR proteins usually localize to the nuclear pore basket, are prospective proto-oncogenic NUPs (a protein that forms the nuclear pore; often in the context of oncogenic fusions with other proteins and abnormally expressed in various cancers). We reported that TPR plays a critical role in mitosis by translocating to the spindle apparatus and centrosomes, whereby it binds and interacts with the MAD1L1-MAD2L1 cell cycle checkpoint protein complex, AURKA (aurora kinase A) and dynein/dynactin molecular motor complex [Citation35,Citation44]. Clinically, we showed that TPR expression was increased in colorectal cancer (CRC) databases and primary tumors of CRC patients. Furthermore, TPR expression in SW480 cells xenografted into mice was reduced following treatment with GSK3B (glycogen synthase kinase 3 beta) inhibitors [Citation13]. We also revealed that TPR depletion induced autophagy in HeLa cells [Citation24]. However, the current findings of TPR regulation in ependymoma are physiologically more relevant than the previous in vitro studies.
The present findings clearly demonstrate that nucleoporin TPR, a biomarker candidate oncogene in ependymoma, works together with HSF1-MTOR trail to prevent autophagy induction in ependymoma (Figure S7). Using gene expression profiling, TPR was confirmed to be highly overexpressed in human ependymoma tumors, providing support for the role of TPR in tumorigenesis. Using xenograft model mice, the downmodulation of TPR significantly prevented ependymoma growth. Interestingly, our findings strongly suggest that pharmacological inhibition of MTOR activity in ependymoma cells by rapamycin leads to the induction of autophagy and nucleophagy, accompanied by suppression of TPR expression. Mechanistically, our findings indicate that TPR depletion drives translocation of cytoplasmic LC3B (autophagy marker) and other proteins into the nucleus, thereby facilitating interactions between nuclear components and nucleoporins that lead to nuclear membrane blebbing, exocytosis, and deformation (Figure S7). We believe that autophagy plays an important role in ependymoma tumorigenesis. To conclude, we have revealed an important role of nucleoporin TPR for ependymoma cell survival, and autophagy as a key regulator of TPR levels. Thus, TPR can serve as a potential biomarker, and MTOR inhibition could be an effective therapeutic approach for ependymoma patients.
Materials and Methods
Antibodies
Anti-TPR (Santa Cruz Biotechnology, sc-101294), anti-MTOR (Cell Signaling Technology, 2983), anti-LC3B (Cell Signaling Technology, 3868), anti-GFP (Wako, 012-20461), anti-PARP1 (Santa Cruz Biotechnology, sc-7150), anti-ACTB (Santa Cruz Biotechnology, sc-47778), anti-p-MTOR (S2448; Santa Cruz Biotechnology, sc-101738), anti-ATG3 (Cell Signaling Technology, 3415), anti-LMNB1/laminB1 (MBL, PM064), anti-ULK1 (Cell Signaling Technology, 8054), anti-p-ULK1 (Ser757; Cell Signaling Technology, 6888), anti-HSF1 (Cell Signaling Technology, 4356), anti-RPTOR (Cell Signaling Technology, 2289) anti-SQSTM1/p62 (Cell Signaling Technology, 39749), anti-p-RPS6KB1 (Thr389; Cell Signaling Technology, 97596), anti-p-EIF4EBP1 (Thr37/46; Cell Signaling Technology, 2855), anti-STX17 (Abcam, ab229646), anti-NUP107 (BioLegend, 902902), Alexa Fluor 488 goat anti-mouse (Invitrogen, A11029), Alexa Fluor 488 goat anti-rabbit (Invitrogen, A11034), rhodamine red goat anti-mouse (Invitrogen, R6393) and rhodamine red goat anti-rabbit (Invitrogen, R6394) were used.
Cell lines and cell culture
Mouse ependymoma cell line (Vn19) (JCRB Cell Bank, JCRB-1361) were propagated in Dulbecco’s Modified Eagle’s Medium (DMEM) (Wako, 043-30085) supplemented with 10% (v:v) fetal bovine serum (Life Technologies, 10082147) and 50 U/mL penicillin-streptomycin (Nacalai Tesque, 26253-84). Cells were cultured in a humidified incubator at 37°C with 5% CO2 [Citation35].
For drug treatments, rapamycin (LC Laboratories, R-5000), bafilomycin A1 (BioViotica, BVT-0252-C100), and chloroquine diphosphate (CQ; TCI, 2301) were dissolved in dimethyl sulfoxide (DMSO; Wako, 043-29355). The drugs added into the culturing medium at a final concentration of 10 nM, 100 nM, and 25 μM, respectively.
Cell proliferation assay
Cells were seeded into a 96-well plate at 3,000 cells/well and cultured for the indicated time courses. Cell viability was assessed using the 3-(4, 5-dimethylthiazol-2-yl)-2, 5-diphenyltetrazo-lium bromide (MTT; Tokyo Chemical Industry, D0801) method. In brief, 10 μl of 12 mM MTT solution was added into each well followed by 3 h incubation and stopped by adding 100 μl of STOP solution (2% acetic acid, 16% sodium dodecyl sulfate (SDS; Wako, 194-13985), 42% N, N-dimethyl formamide (DMF; Nakalai Tesque, 13016-65)). Samples were mixed thoroughly and measured at 570 nm for absorbance.
Transfections, viral particle production, and infection
DNA and siRNA transfections were performed using Lipofectamine 2000 (Invitrogen, 11668019). Lentiviral particles were produced with the MISSION Lentiviral Packaging System (Sigma-Aldrich, SHP001). Vn19 cells were transduced with the lentiviral particles in the presence of 8 μg/ml polybrene (Sigma-Aldrich, 28728-55-4) for 48 h.
Plasmid and RNA interference
Expression plasmid containing GFP-Lc3b was generated by inserting 378 bp of the Lc3b gene into the pEGFP-C1 vector (Clontech, 6084–1). siRNA duplexes targeting mouse Tpr-specific siRNA (Santa Cruz Biotechnology, sc-45344) and control siRNA (Santa Cruz Biotechnology, sc-37007) were purchased from Santa Cruz Biotechnology. Plasmid and siRNA were transfected using Lipofectamine 2000 according to the manufacturer’s protocol. Vn19 cells were plated onto 12- or 6-well tissue culture plates at a density of 1 × 10⁵ cells per well. Cells were transfected with siRNA and observed 72 h after transfection.
Immunostaining and super-resolution imaging
Vn19 cells were cultured on polylysine-coated glass coverslips in 6-well plates. After rapamycin treatment, cells on coverslips were washed in phosphate-buffered saline (137 mM NaCl (Nacalai Tesque, 31320-34), 2.7 mM KCl (Sigma, P9541), 10 mM Na2HPO4 (Wako, 198-05955F), 1.8 mM KH2PO4 (Nacalai Tesque, 28736-75)) and fixed for 10 min in ice-cold methanol absolute, washed again with PBS, and permeabilized with 0.3% Triton X-100 (Nacalai Tesque, 35501-15) in PBS for 10 min. Cells were then washed and blocked in PBS containing 4% bovine serum albumin (BSA; Wako, 015-23295) for 30 min at room temperature. The coverslips were then incubated in 4% BSA/PBS containing primary antibodies (1:100 dilutions) at 4°C overnight. Cells were then rinsed and incubated with secondary antibodies in 4% BSA/PBS (1:100 dilution) for 2 h at room temperature. After washing with PBS, coverslips were mounted on the slide using ProLong Gold Antifade reagent with 4ʹ,6-diamidino-2-phenylindole (DAPI; Invitrogen, P36941) and observed on STED nanoscopy (Leica, TCS SP8 STED) or confocal laser-scanning microscope with a 60X PlanApo/1.45NA DIC objective (Olympus, FV10i-LIV).
Immunohistochemistry
Four-micrometer thick paraffin-embedded tissue blocks were sectioned onto slides and deparaffinized. The sections were autoclaved (120°C) for 10 min in Target Retrieval Solution pH 6.0 (DAKO), quenched with 3% hydrogen peroxide (Sigma Aldrich, H1009) in methanol for 20 min and blocked for 30 min with 5% skim milk (Nacalai Tesque, 31149-75) in TBST. The slides were incubated with each primary antibody for TPR, NUP153, MKI67 (Clone MIB1), GFAP, ETFA/EMA, OLIG2 or with nonimmune mouse or rabbit IgG as a negative control overnight at 4°C, then washed, and using Envision+ kit (Dako, K1390) for secondary antibody 45 min at room temperature. The color was developed using 3,3′- diaminobenzidine tetrahydrochloride (Sigma Aldrich, D5637) for 2 to 5 min, and the sections were then counterstained with hematoxylin (Sigma Aldrich, MHS16) [Citation36]. Images were acquired using a BZ-X700 microscope (Keyence, Osaka, Japan) and digitally processed with the Keyence analysis software (Keyence).
Live cell imaging
Vn19 seeded into glass-bottom dish and transfected with GFP-Lc3b or GFP-Tpr. Images were acquired 24 and 48 h following drug treatment using an Olympus FV10i-LIV laser-scanning confocal microscope with a 60X PlanApo/1.45NA DIC objective.
Nuclear/cytoplasmic fractionation
This analysis was performed by using nuclear and cytoplasmic extraction reagents according to the manufacturing protocol (Thermo Scientific, 78840). Briefly, Vn19 cells treated with DMSO or 10 nM rapamycin for 48 h were harvested with trypsin-EDTA (Nacalai Tesque, 32777-15), and around 2 × 10⁶ cells were used in this study. Cell pellets were added with 200 μl of ice-cold CER I and vortexed on the highest setting for 15 s and incubated on ice for 10 min. After that, 11 μl of ice-cold CER-II was added and vortexed for 5 s, and incubated on ice for 1 min. The tubes were then vortexed again for another 5 s and centrifuged at 16.000 g for 5 min. The supernatants were then immediately transferred to a clean pre-chilled tube as the cytoplasmic extract. Insoluble (pellet) fractions were then suspended with 100 μl of ice-cold NER, vortexed for 15 s, and incubated on ice for 40 min with vortexed in every 10 min. The tubes were then centrifuged at 16.000 g for 10 min, and supernatant (nuclear extract) fractions were transferred immediately to a clean pre-chilled tube. The cytoplasmic and nuclear extracts were then subjected to immunoblotting analysis.
Protein extraction and western blotting
For protein extraction, 6 × 10⁵ were solubilized in 100 µl of lysed buffer (20 mM HEPES (Sigma, H3375-250G) [pH 7.4], 350 mM sodium chloride, 1.5 mM magnesium chloride, 1 mM ethylene glycol-bis (β-aminoethyl ether)-N,N,N′,N′-tetraacetic acid (EGTA; Nacalai Tesque, 15214-92), 10% [v/v] glycerol, 1% Triton X-100, 0.2 mM sodium orthovanadate (Sigma-Aldrich, S6508), and 1 mM phenylmethylsulfonyl fluoride (PMSF; Fluka, 78830)), supplemented with proteases and phosphatases inhibitors mixtures (Roche, 11697498001), and kept on ice for 20 min. Insolubilized material was spun down at 10,000 g for 15 min at 4°C, and proteins were quantified using the Quick Start Bradford 1x Dye Reagent assay kit (Bio-Rad) following manufacturer’s instructions. Proteins (~50 µg) were separated by SDS-PAGE, transferred onto nitrocellulose membranes (GE Healthcare). Samples were subjected to SDS-PAGE followed by conventional wet transfer (Bio-Rad). Membranes were incubated with primary antibodies and exposed to secondary horseradish peroxidase-conjugated antibodies (Millipore, 12–348, and 12–349). Proteins were visualized by the chemiluminescence reagent ECL, Immobilon Western Chemilum HRP Substrate (Millipore, WBKLS0500). Images were detected by using a LAS-4000 image analyzer (Fujifilm).
Immunoprecipitation
Cells were lysed on ice for 10 min using RIPA buffer (50 mM Tris-HCl, 150 mM NaCl, 1% Triton X-100, and 0.1% sodium dodecyl sulfate) supplemented with EDTA-free protease inhibitor cocktail (Nacalai tesque, 04080). Cell lysates were then sonicated for 2 × 15 s, and centrifuged at 16.000 g for 10 min at 4°C. The supernatants of cell lysates were mixed with 5 µg of various antibodies; TPR, GFP, LMNB1, and rotated at 4°C overnight. To pull down the protein of interest, 50 µL of protein A/G beads slurry were then added and rotated at 4°C for 2 h. Beads were then washed five times with RIPA lysis buffer. Whole-cell lysates and immunoprecipitates were analyzed by immunoblotting.
Bafilomycin clamp assay
Cells were treated with Tpr siRNA (150 μM) for 24 h. Four hours prior to the collection, bafilomycin A1 treatment was performed at a final concentration of 100 nmol/L for 4 h.
Electron microscopy
Transmission electron microscopy of Vn19 cells (with or without rapamycin treatments) was done as described previously, and micrographs were recorded with a JEOL JEM-1200EX at 70 – 100 kV [Citation24].
Cell cycle profile analysis
Vn19 cells were trypsinized, washed twice with PBS, and fixed in ice-cold 70% ethanol at – 20°C overnight. Fixed cells were permeabilized with 0.3% triton X-100 for 10 min and then resuspended in PBS containing 50 µg/mL RNase A (Nacalai Tesque, 30100-31) and 50 µg/mL propidium iodide (PI; Sigma-Aldrich, P4864). Cellular DNA content was analyzed using a FACS Canto II with FACS Diva software (BD Bioscience).
RNA fractionation and isolation
Vn19 cells were transfected with either siCTL or siTpr, and then cytoplasmic and nuclear fractions were prepared using hypotonic lysis, as previously described [Citation27]. Briefly, cells were swollen in 5 packed volumes of buffer A (10 mM HEPES pH 7.9; 1.5 mM MgCl2; 10 mM KCl; 1 mM DTT; 1 mM PMSF) for 10 min on ice. Cells were then centrifuged at 500 g for 10 min and then resuspended in 2 packed volumes of buffer A and lysed by 20 strokes of a Dounce homogenizer. Nuclei and cytoplasm were separated by 500 g centrifugation for 10 min. mRNA was extracted from each fraction using ISOGEN reagent following the manufacturer’s instruction (ISOGEN, 311-02501).
cDNA preparation and quantitative RT-PCR assay
Total RNA was isolated using a NucleoSpin RNA isolation kit (Macherey–Nagel). Total RNA (500 ng) was used for reverse transcription using a cDNA synthesis kit (Takara, RR055B). Quantitative real-time PCR (qPCR) was performed using a Thermal Cycler Dice Real-Time System (Takara, TP-900) with SYBR Premix Ex Taq II (Takara, RR82LR). Relative mRNA expression levels of target genes were calculated using Gapdh (glyceraldehyde-3-phosphate dehydrogenase) as an internal control. Primers are listed in Table S2.
Clinical samples
Brain tissue samples were obtained from patients (Extended Data Table 1). Noncancerous brain tissues were used for control. This study was approved by the Kanazawa University Medical Ethics Committee (No. 396). Fresh tumor tissues were obtained by surgery and the remaining tissue samples were stored at −80°C for further use and also were fixed in 4% paraformaldehyde, embedded in paraffin for routine histopathological examination and immunohistochemistry. The histological diagnosis was determined according to the revised World Health Organization criteria [Citation5].
Mouse model of ependymoma and treatment
Following an institutional review board-approved protocol, we generated a mouse brain tumor model by transplantation of Vn19 cells into the brain of nude mice (BALB/cSlc-nu/nu, Charles River Laboratories, Osaka, Japan) according to our previous study [Citation21,Citation22,Citation45]. Briefly, a burr hole was made in the skull 3 mm lateral to the bregma using a drill, and 5 × 10⁴ Vn19 cells were stereotactically injected at a depth of 3 mm below the dura mater. The mice were randomly assigned to 2 groups and treated with either rapamycin (n = 4) or with DMSO as a control group (n = 4). All mice were given intraperitoneal injections of 100 µL of DMSO or rapamycin dissolved in DMSO at 5 mg/kg body weight every day. The dose of rapamycin is determined according to a previous study [Citation46]. In order to examine the effect of TPR on tumor growth in vitro, 10 mice were randomly assigned to 2 groups, and transplanted with 5 × 10⁴ shCTL Vn19 cells as a control group (n = 5) and 5 × 10⁴ shTpr Vn19 cells as Tpr-silenced group (n = 5). After 2 weeks of treatment, all mice were euthanized. All animal experiments followed the Guidelines for the Care and Use of Laboratory Animals at Kanazawa University that covers the national guideline. The brain tissues were dissected, embedded in paraffin, and then cut into 4 µm serial coronal sections. The tissue sections were stained using a standard hematoxylin and eosin staining technique. We calculated the surface included by the tumor contour of the region of interest in the coronal section showing the maximal area of each tumor.
In order to examine the effect of rapamycin on overall survival time, 20 mice were randomly assigned to 2 groups for treatment with rapamycin (n = 10) and with DMSO as a control group (n = 10). All animal experiments followed the Guidelines for the Care and Use of Laboratory Animals at Kanazawa University that covers the national guideline.
Tumor volume measurement
All the ependymoma nude mice were sacrificed and the brains were fixed with 4% paraformaldehyde. Then, the tissues were embedded in paraffin. Transverse-cut tissue sections were prepared. Glass-mounted 4 μm-thick tissues were prepared using a microtome. First, when we cut to the top of the tissue, we measured the area of the tumor, recorded as Smin, and the thickness of the block recorded as h1. Continue to cut down and cut to the largest area of the tumor. The area of the tumor at this time was measured again, as Smax, the thickness of the paraffin block, recorded as h2. We also randomly selected several sections between the largest area and the smallest area and measured the tumor areas, which were recorded as S1, S2, S3, … Sn. Then, we calculated the mean of the largest area, the smallest area and the areas between the largest and smallest area as the average area of the tumor sections, and the calculation formula is as follows:
We calculated the thickness (height) between the smallest surface and the largest area, and the calculation is as follows:
The average area is then multiplied by the tumor thickness (height) and the result is taken as the approximate volume of the tumor, calculated as follows:
Bioinformatics analysis
The mRNA expression of Tpr and several other nucleoporins across normal tissue, ependymoma, and other brain tumors were examined from GEO (Accession No. GSE50161). Heat map was generated by using Cluster 3.0 and Java Treeview software (http://jtreeview.sourceforge.net).
Statistical analysis
Statistical analysis was performed using GraphPad PRISM 7 software. Data are presented as mean ± standard deviation (SD). Statistically significant differences in the mean or median values between respective groups were tested by Student’s t-test or one-way ANOVA analysis. P values < 0.05 were considered to indicate a statistically significant difference.
Supplemental Material
Download Zip (131.6 MB)Acknowledgments
We are grateful for the support provided by Günter Blobel, who inspired the TPR work presented here. This work was supported by a MEXT/JSPS KAKENHI Grant Number B-26293322 (to N.M.); 17H05874, 17K08655 (to R.W.) from MEXT Japan, and by grants from the Kobayashi International Scholarship Foundation (to N.M. and R.W), and the Shimadzu Science Foundation (to R. W.).
Disclosure statement
No potential conflict of interest was reported by the authors.
Supplementary material
Supplemental data for this article can be accessed here.
References
- Merchant TE. Current clinical challenges in childhood ependymoma: a focused review. J Clin Oncol. 2017;35(21):2364–2369.
- Archer TC, Pomeroy SL. Defining the molecular landscape of ependymomas. Cancer Cell. 2015;27(5):613–615.
- Witt H, Mack SC, Ryzhova M, et al. Delineation of two clinically and molecularly distinct subgroups of posterior fossa ependymoma. Cancer Cell. 2011;20(2):143–157.
- Parker M, Mohankumar KM, Punchihewa C, et al. C11orf95-RELA fusions drive oncogenic NF-κB signaling in ependymoma. Nature. 2014;506(7489):451–455.
- Louis DN, Perry A, Reifenberger G, et al. The 2016 World Health Organization classification of tumors of the central nervous system: a summary. Acta Neuropathol. 2016;131(6):803–820.
- Archer TC, Pomeroy SL. Posterior fossa ependymomas: a tale of two subtypes. Cancer Cell. 2011;20(2):133–134.
- Wu J, Armstrong TS, Gilbert MR. Biology and management of ependymomas. Neuro Oncol. 2016;18(7):902–913.
- Karakoula K, Suarez-Merino B, Ward S, et al. Real-time quantitative PCR analysis of pediatric ependymomas identifies novel candidate genes including TPR at 1q25 and CHIBBY at 22q12-q13. Genes Chromosomes Cancer. 2008;47(11):1005–1022.
- Mack SC, Pajtler KW, Chavez L, et al. Therapeutic targeting of ependymoma as informed by oncogenic enhancer profiling. Nature. 2018;553(7686):101–105.
- Mohankumar KM, Currle DS, White E, et al. An in vivo screen identifies ependymoma oncogenes and tumor-suppressor genes. Nat Genet. 2015;47(8):878–887.
- Modena P, Lualdi E, Facchinetti F, et al. Identification of tumour-specific molecular signatures in intracranial ependymomas and association with clinical characteristics. J Clin Oncol. 2006;24(33):5223–5233.
- Phyllis F, Tinglu G, Cecilia S, et al. Tpr is localized within the nuclear basket of the pore complex and has a role in nuclear protein export. J Cell Biol. 2002;156(4):617–630.
- Dewi FRP, Domoto T, Hazawa M, et al. Colorectal cancer cells require glycogen synthase kinase-3β for sustaining mitosis via translocated promoter region (TPR)-dynein interaction. Oncotarget. 2018;9(17):13337–13352.
- Hoelz A, Glavy JS, Beck M, et al. Toward the atomic structure of the nuclear pore complex: when top down meets bottom up. Nat Struct Mol Biol. 2016;23(7):624–630.
- Raices M, D’Angelo MA. Nuclear pore complex composition: a new regulator of tissue-specific and developmental functions. Nat Rev Mol Cell Biol. 2012;13(11):687–699.
- Wong RW. Nuclear pore complex: from structural view to chemical tools. Chem Biol. 2015;22(10):1285–1287.
- Kilday JP. Pediatric ependymoma: biological perspectives. Mol Cancer Res. 2009;7(6):765–786.
- Su KH, Cao J, Tang Z, et al. HSF1 critically attunes proteotoxic-stress sensing by MTORC1 to combat stress and promote growth. Nat Cell Biol. 2016;18(5):527–539.
- Guan S, Shen R, Lafortune T, et al. Establishment and characterization of clinically relevant models of ependymoma: a true challenge for targeted therapy. Neuro Oncol. 2011;13(7):748–758.
- Milde T, Kleber S, Korshunov A, et al. A novel human high-risk ependymoma stem cell model reveals the differentiation-inducing potential of the histone deacetylase inhibitor Vorinostat. Acta Neuropathol. 2011;122(5):637–650.
- Yu L, Baxter PA, Voicu H, et al. A clinically relevant orthotopic xenograft model of ependymoma that maintains the genomic signature of the primary tumor and preserves cancer stem cells in vivo. Neuro Oncol. 2010;12(6):580–594.
- Aizawa T, Hasegawa K, Ohkumo T, et al. Neural stem cell‐like gene expression in a mouse ependymoma cell line transformed by human BK polyomavirus. Cancer Sci. 2010;102(1):122–129.
- Dong Y, Furuta T, Sabit H, et al. Identification of antipsychotic drug fluspirilene as a potential anti-glioma stem cell drug. Oncotarget. 2017;8(67):111728–111741.
- Funasaka T, Tsuka E, Wong RW. Regulation of autophagy by nucleoporin TPR. Sci Rep. 2012;8(1):878.
- Füllgrabe J, Klionsky DJ, Joseph B. The return of the nucleus: transcriptional and epigenetic control of autophagy. Nat Rev Mol Cell Biol. 2014;15(1):65–74.
- Levy JMM, Towers CG, Thorburn A. Targeting autophagy in cancer. Nat Rev Cancer. 2017;17(9):528–542.
- Skaggs HS, Xing H, Wilkerson DC, et al. HSF1-TPR interaction facilitates export of stress-induced HSP70 mRNA. J Bio Chem. 2007;282(47):33902–33907.
- Dokladny K, Myers OB, Moseley PL. Heat shock response and autophagy - cooperation and control. Autophagy. 2015;11(2):200–213.
- Chiang GG, Abraham RT. Phosphorylation of mammalian target of rapamycin (MTOR) at Ser-2448 is mediated by p70S6 kinase. J Biol Chem. 2005;280(27):25485–25490.
- Chou SD, Prince T, Gong J, et al. MTOR is essential for the proteotoxic stress response, HSF1 activation and heat shock protein synthesis. PLoS One. 2012;7(6):e39679.
- Gatica D, Lahiri V, Klionsky DJ. Cargo recognition and degradation by selective autophagy. Nat Cell Biol. 2018;20(3):233–242.
- Park YE, Hayashi YK, Bonne G, et al. Autophagic degradation of nuclear components in mammalian cells. Autophagy. 2009;5(6):795–804.
- Huang R, Xu Y, Wan W, et al. Deacetylation of nuclear LC3 drives autophagy initiation under starvation. Mol Cell. 2015;57(3):456–466.
- Diao J, Liu R, Rong Y, et al. ATG14 promotes membrane tethering and fusion of autophagosomes to endolysosomes. Nature. 2015;520(7548):563–566.
- Kobayashi A, Hashizume C, Dowaki T, et al. Therapeutic potential of mitotic interaction between the nucleoporin TPR and aurora kinase A. Cell Cycle. 2015;14(9):1447–1458.
- Tabori U, Wong V, Ma J, et al. Telomere maintenance and dysfunction predict recurrence in paediatric ependymoma. Br J Cancer. 2008;99(7):1129–1135.
- Yuan Y. Molecular genetics of ependymoma. Chin J Cancer. 2011;30(10):669–681.
- Yorimitsu T, Klionsky DJ. Autophagy: molecular machinery for self-eating. Cell Death Differ. 2005;12(S2):1542–1552.
- Klionsky D, Abdelmohsen K, Abe A, et al. Guidelines for the use and interpretation of assays for monitoring autophagy (3rd edition). Autophagy. 2016;12:1–222.
- Han SH, Korm S, Han YG, et al. GCA links TRAF6-ULK1-dependent autophagy activation in resistant chronic myeloid leukemia. Autophagy. 2019;15(12):2076–2090.
- Nazio F, Strappazzon F, Antonioli M, et al. MTOR inhibits autophagy by controlling ULK1 ubiquitylation, self-association and function through AMBRA1 and TRAF6. Nat Cell Biol. 2013;15(4):406–416.
- Pankiv S, Clausen TH, Lamark T, et al. p62/SQSTM1 binds directly to Atg8/LC3 to facilitate degradation of ubiquitinated protein aggregates by autophagy. J Biol Chem. 2007;282(33):24131–24145.
- Mizushima N, Yoshimori T. How to interpret LC3 immunoblotting. Autophagy. 2007;3(6):542–545.
- Nakano H, Funasaka T, Hashizume C, et al. Nucleoporin translocated promoter region (Tpr) associates with dynein complex, preventing chromosome lagging formation during mitosis. J Biol Chem. 2010;285(14):10841–10849.
- Furuta T, Sabit H, Dong Y, et al. Biological basis and clinical study of glycogen synthase kinase- 3β-targeted therapy by drug repositioning for glioblastoma. Oncotarget. 2017;8(14):22811–22824.
- Arcella A, Biagioni F, Antonietta Oliva M, et al. Rapamycin inhibits the growth of glioblastoma. Brain Res. 2013;14958:37–51.