
ABSTRACT
NRBF2, a regulatory subunit of the ATG14-BECN1/Beclin 1-PIK3C3/VPS34 complex, positively regulates macroautophagy/autophagy. In this study, we report that NRBF2 is required for the clearance of apoptotic cells and alleviation of inflammation during colitis in mice. NRBF2-deficient mice displayed much more severe colitis symptoms after the administration of ulcerative colitis inducer, dextran sulfate sodium salt (DSS), accompanied by prominent intestinal inflammation and apoptotic cell accumulation. Interestingly, we found that nrbf2−/- mice and macrophages displayed impaired apoptotic cell clearance capability, while adoptive transfer of nrbf2+/+ macrophages to nrbf2−/- mice alleviated DSS-induced colitis lesions. Mechanistically, NRBF2 is required for the generation of the active form of RAB7 to promote the fusion between phagosomes containing engulfed apoptotic cells and lysosomes via interacting with the MON1-CCZ1 complex and regulating the guanine nucleotide exchange factor (GEF) activity of the complex. Evidence from clinical samples further reveals the physiological role of NRBF2 in maintaining intestinal homeostasis. In biopsies of UC patient colon, we observed upregulated NRBF2 in the colon macrophages and the engulfment of apoptotic cells by NRBF2-positive cells, suggesting a potential protective role for NRBF2 in UC. To confirm the relationship between apoptotic cell clearance and IBD development, we compared TUNEL-stained cell counts in the UC with UC severity (Mayo Score) and observed a strong correlation between the two indexes, indicating that apoptotic cell population in colon tissue correlates with UC severity. The findings of our study reveal a novel role for NRBF2 in regulating apoptotic cell clearance to restrict intestinal inflammation.
Abbreviation: ANOVA: analysis of variance; ATG14: autophagy related 14; ATG16L1: autophagy related 16-like 1 (S. cerevisiae); BMDM: bone marrow-derived macrophage; BSA: bovine serum albumin; CD: Crohn disease; CD68: CD68 molecule; CFP: cyan fluorescent protein; CMFDA: 5-chloromethylfluorescein diacetate; Co-IP, co-immunoprecipitation; CPR: C-reactive protein; Cy7: cyanine 7 maleimide; DAB: diaminobezidine 3; DAI: disease activity indexes; DAPI: 4ʹ6-diamidino-2-phenylindole; DMEM: dulbecco’s modified eagle’s medium; DMSO: dimethyl sulfoxide; DOC: sodium deoxycholate; DSS: dextran sulfate sodium; EDTA: ethylenediaminetetraacetic acid; EGTA: ethylenebis (oxyethylenenitrilo) tetraacetic acid; FBS: fetal bovine serum; FITC: fluorescein isothiocyanate; FRET: Förster resonance energy transfer; GDP: guanine dinucleotide phosphate; GEF: guanine nucleotide exchange factor; GFP: green fluorescent protein; GTP: guanine trinucleotide phosphate; GWAS: genome-wide association studies; HEK293: human embryonic kidney 293 cells; HRP: horseradish peroxidase; IBD: inflammatory bowel disease; IgG: immunoglobin G; IL1B/IL-1β: interleukin 1 beta; IL6: interleukin 6; IRGM: immunity related GTPase M; ITGAM/CD11b: integrin subunit alpha M; KO: knockout; LRRK2: leucine rich repeat kinase 2; MAP1LC3/LC3: microtubule associated protein 1 light chain 3; MOI: multiplicity of infection; MPO: myeloperoxidase; NaCl: sodium chloride; NEU: neutrophil; NOD2: nucleotide binding oligomerization domain containing 2; NP40: nonidet-P40; NRBF2: nuclear receptor binding factor 2; PBS: phosphate buffer saline; PCR: polymerase chain reaction; PE: P-phycoerythrin; PIK3C3/VPS34: phosphatidylinositol 3-kinase catalytic subunit type 3; PtdIns3P: phosphatidylinositol-3-phosphate; PTPRC/CD45: protein tyrosine phosphatase receptor type C; SDS-PAGE: sodium dodecylsulphate-polyacrylamide gel electrophoresis; TBST: tris-buffered saline Tween-20; Tris-HCl: trihydroxymethyl aminomethane hydrochloride; TUNEL: TdT-mediated dUTP nick-end labeling; UC: ulcerative colitis; ULK1: unc-51 like autophagy activating kinase 1; WB: western blotting; WT: wild type; YFP: yellow fluorescent protein.
Introduction
Inflammatory bowel disease (IBD), comprised of Crohn disease (CD) and ulcerative colitis (UC), is characterized pathologically by intestinal inflammation and epithelial injury [Citation1]. Genome-wide association studies (GWAS) have revealed connections between autophagy-related genes and IBD. Polymorphisms in autophagy-related genes, ATG16L1 [Citation2], NOD2 [Citation3], LRRK2 [Citation4], IRGM [Citation5], and ULK1 [Citation6], have been linked to CD. Moreover, atg4b-null mice exhibited increased susceptibility to dextran sodium sulfate (DSS)-induced colon colitis [Citation7]. More recently, a study reported that deficiency of Pik3c3, the class III phosphatidylinositol 3-kinase involved in vesicle trafficking, in zebrafish caused IBD-like injuries by disrupting cell-junction protein distribution [Citation8], revealing the potential involvement of the PIK3C3/VPS34 complex in IBD pathogenesis. NRBF2 (nuclear receptor binding factor 2), as a component of ATG14-BECN1/Beclin 1-PIK3C3 complex, modulates autophagy via regulating ATG14-linked PIK3C3 activity [Citation9]. Our and other’s studies revealed that NRBF2, as a regulatory subunit of the ATG14-BECN1-PIK3C3 complex, is involved in multiple diseases and stress conditions [Citation9,Citation10]. However, the specific role of NRBF2 in the development of IBD has not been explored.
Apoptotic cells are constantly generated in the body and rapidly removed by professional and nonprofessional phagocytes for the maintenance of tissue homeostasis [Citation11,Citation12]. Under inflammatory conditions, excessive numbers of apoptotic cells exacerbate the inflammatory response by becoming secondarily necrotic and causing a predisposition to autoimmunity [Citation13,Citation14]. When the intestine is inflamed, a dramatic number of apoptotic cells are generated, leading to a huge burden on phagocytes to clear these cells. Defects in apoptotic cell clearance exaggerate the inflammatory response and suspend tissue restoration in dextran sulfate sodium (DSS)-induced colitis models [Citation15]. Conversely, boosting apoptotic cell clearance has been shown to attenuate DSS-induced colitis in the mouse model [Citation16]. Several genes involved in apoptotic cell clearance have been associated with IBD [Citation17], indicating potential links between apoptotic cell clearance and IBD. Interestingly, several autophagy genes, including PIK3C3, have been reported to regulate apoptotic cell clearance [Citation18–20]; however, the detailed biochemical mechanism is still unclear.
In this study, we first show that NRBF2-deficient mice are highly sensitive to DSS-induced colitis damage, with the dramatic accumulation of apoptotic cells in the colon tissue. Then we reveal a novel role for NRBF2 in regulating apoptotic cell clearance by modulating MON1-CCZ1 guanine nucleotide exchange factor (GEF) activity. We further show that the adoptive transfer of WT macrophages into NRBF2-deficient mice obviously attenuates their DSS-induced colitis. Finally, we observed that the NRBF2 expression level is upregulated in UC patients’ colon samples, especially in the macrophages. Together, the evidence of our study reveals a critical role for NRBF2 in regulating apoptotic cell clearance to eliminate intestinal inflammation during UC damage.
Results
Loss of NRBF2 sensitizes mice to experimental UC lesions with prominent inflammatory responses and apoptotic cell accumulation
To explore the role of NRBF2, a regulatory subunit of ATG14-BECN1-PIK3C3 complex, in maintaining intestinal homeostasis, we established experimental colitis lesions in WT and nrbf2−/- mice by feeding them with 2% DSS (). Compared to the WT mice, the nrbf2−/- mice exhibited significantly higher sensitivity to DSS exposure, with faster weight loss (), higher disease activity indexes (DAIs) () and shorter colon lengths (). Additionally, the histopathological alterations in the nrbf2−/- mice after DSS treatment were more prominent than those in the WT mice (more epithelial cell loss and inflammatory cell infiltration) (). Inflammation is the pathological feature of IBD, and we assessed the inflammatory responses in the WT and nrbf2−/- mice with UC. Interestingly, the nrbf2−/- mice displayed an overall increased inflammatory response including spleen enlargement (), increased myeloperoxidase (MPO) activity (), and elevated pro-inflammatory cytokine (IL1B/IL-1β and IL6) concentration in the colon tissue lysates (). Moreover, we also observed a dramatic accumulation of apoptotic cells in the nrbf2−/- mice after DSS administration (). These data indicate that the nrbf2−/- mice were more vulnerable to DSS-induced colitis damage and exhibited an obviously higher inflammatory response than the WT mice.
Figure 1. Nrbf2 knockout mice are susceptible to dextran sulfate sodium (DSS)-induced ulcerative colitis. (A) Western blotting of NRBF2 expression in the colon tissue from wild-type (WT) and nrbf2 knockout (KO) mice. (B) Body weights recorded daily in different groups (n = 9–11). 2% DSS in drinking water was administrated to DSS treatment groups in the first 9 d, following 2 d of normal drinking water. (C) Daily disease activity indexes (DAIs) of WT and nrbf2−/- mice after DSS treatment (n = 9–11). Mean ± S.E.M. (D) Length of colons from the different groups (left), and the representative images (right) (n = 9–11). (E) Representative HE staining images of the colon in each group. Scale bar: 200 µm. (F) Histological scoring according to the HE staining result (epithelium scoring, infiltration scoring, and total scoring) (n = 6–7). (G) Spleen weight indexes of the different groups (spleen weight/body weight [n = 9–11]). Mean ± S.D. (H) Determination of MPO (myeloperoxidase) activity in the colon lysates from the different groups (n = 7–8). Mean ±S.E.M. (I and J) Determination of IL6 and IL1B concentrations in colon lysates (n = 7–8). Mean ± S.E.M. (K) Representative images of TUNEL staining in the colon of mice from different groups. (red: TUNEL-positive, blue: DAPI). Scale bar: 100 µm. Right: Quantification of the TUNEL-positive cells in the colon tissue samples from the different groups (n = 8–11 samples). Mean ± S.E.M. In B and C, data were analyzed via two-way ANOVA. In D, E and H-K, data were analyzed via one-way ANOVA with the Tukey test. In G, data were analyzed via an unpaired Student’s t-test. *P < 0.05, **P < 0.01, ***P < 0.001
![Figure 1. Nrbf2 knockout mice are susceptible to dextran sulfate sodium (DSS)-induced ulcerative colitis. (A) Western blotting of NRBF2 expression in the colon tissue from wild-type (WT) and nrbf2 knockout (KO) mice. (B) Body weights recorded daily in different groups (n = 9–11). 2% DSS in drinking water was administrated to DSS treatment groups in the first 9 d, following 2 d of normal drinking water. (C) Daily disease activity indexes (DAIs) of WT and nrbf2−/- mice after DSS treatment (n = 9–11). Mean ± S.E.M. (D) Length of colons from the different groups (left), and the representative images (right) (n = 9–11). (E) Representative HE staining images of the colon in each group. Scale bar: 200 µm. (F) Histological scoring according to the HE staining result (epithelium scoring, infiltration scoring, and total scoring) (n = 6–7). (G) Spleen weight indexes of the different groups (spleen weight/body weight [n = 9–11]). Mean ± S.D. (H) Determination of MPO (myeloperoxidase) activity in the colon lysates from the different groups (n = 7–8). Mean ±S.E.M. (I and J) Determination of IL6 and IL1B concentrations in colon lysates (n = 7–8). Mean ± S.E.M. (K) Representative images of TUNEL staining in the colon of mice from different groups. (red: TUNEL-positive, blue: DAPI). Scale bar: 100 µm. Right: Quantification of the TUNEL-positive cells in the colon tissue samples from the different groups (n = 8–11 samples). Mean ± S.E.M. In B and C, data were analyzed via two-way ANOVA. In D, E and H-K, data were analyzed via one-way ANOVA with the Tukey test. In G, data were analyzed via an unpaired Student’s t-test. *P < 0.05, **P < 0.01, ***P < 0.001](/cms/asset/ce2ebb4b-9411-4b54-98c2-1aff8ecba276/kaup_a_1741332_f0001_oc.jpg)
NRBF2 is required for apoptotic cell clearance and facilitates the maturation of phagosomes containing apoptotic cells
Impairment in apoptotic cell clearance has been associated with inflammation. The observation that apoptotic cells accumulate dramatically in nrbf2−/- mice colon tissue drives us to question whether apoptotic cell clearance is impaired in nrbf2−/- mice and contributes to the inflammation. To determine the role of NRBF2 in the regulation of apoptotic cell clearance, we intravenously injected PKH26-stained apoptotic thymocytes into WT and nrbf2−/- mice. As expected, the nrbf2−/- mice exhibited notably delayed clearance of the PKH26-positive cells in the liver and spleen (cells in circulation are mostly cleared by macrophages in these two organs [Citation21]) cell suspensions (–D). Moreover, we purified bone marrow-derived macrophages (BMDMs) from wild-type (WT) and nrbf2−/- mice (Fig. S1A) and incubated the BMDMs with fluorescently labeled (CMFDA) apoptotic thymocytes (Fig. S1B) for 48 h. The data showed that the culture medium of the NRBF2-deficient BMDMs exhibited a higher residual fluorescence value than that of the WT BMDMs, which indicated that the apoptotic cell clearance ability of the nrbf2−/- BMDMs was significantly impaired (). Overall, NRBF2 deficiency reduced the efficiency of apoptotic cell clearance both in vitro and in vivo.
Figure 2. Nrbf2 knockout inhibits apoptotic cell clearance via impairing the phagocytic maturation. (A) and (C) PKH26-labeled events in isolated hepatocytes and splenocytes from WT and nrbf2−/- mice at the indicated times after the I. V. injection of PKH26-labeled apoptotic thymocytes (n = 3–5). Mean ± S.E.M. (B) and (D) Representative immunofluorescence images of frozen sections from WT and nrbf2−/- mouse liver and spleen at 24 h after the I. V. injection of apoptotic cells. Scale bar: 50 μm. (Red, PKH26-positive events; Blue, DAPI). (E) Residual fluorescence value after co-culturing BMDMs from WT and nrbf2−/- with CMFDA-stained apoptotic thymocytes for 48 h (n = 3). Mean ± S.D. (F) Flow cytometry analysis of WT and nrbf2−/- BMDMs at different times after co-culturing with CMFDA-labeled apoptotic cells for 30 min. (G) Representative time-lapse images after adding CMFDA-labeled apoptotic thymocytes to WT and nrbf2−/- BMDMs. (red: LysoTracker; green: CMFDA-stained apoptotic thymocytes). (H) The distribution analysis of engulfed-apoptotic thymocytes by recording the time required for lysosome-phagosome fusion in WT and nrbf2−/- BMDMs (Start point, green-colored apoptotic thymocytes being engulfed by BMDM; End point, green apoptotic thymocytes become yellow)
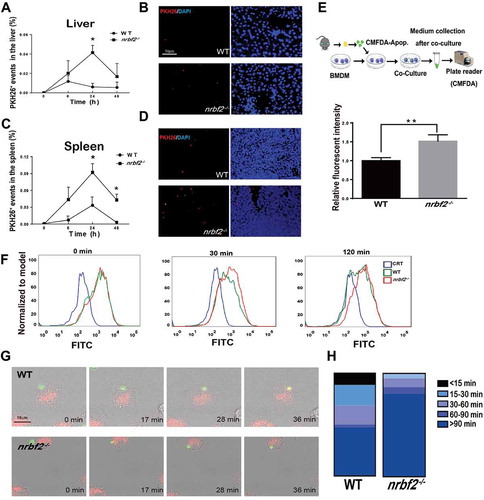
Apoptotic cell clearance includes the steps of recognition, engulfment and phagosome maturation [Citation22]. To determine the specific mechanism by which NRBF2 affects the apoptotic cell clearance, we first determined the macrophage engulfment abilities by co-culturing CMFDA-labeled apoptotic thymocytes with BMDMs for 30 min. The results showed no differences in the engulfment abilities of the nrbf2−/- and WT BMDMs (Fig. S1D). We further examined the phagosome maturation process by allowing the BMDMs to engulf fluorescent apoptotic thymocytes for 30 min and then tracking the clearance of the apoptotic thymocytes in the BMDMs via flow cytometry. We noticed that the fluorescent intensity of WT BMDMs gradually reduced within 2 h, while the nrbf2−/- BMDMs displayed delayed fluorescent signal elimination (). The results implied that NRBF2 regulated phagosome maturation but not the apoptotic cell engulfment. Then, we directly tracked the phagocytosis process by utilizing time-lapse imaging. We first stained BMDMs with LysoTracker and tracked the fusion of CMFDA-labeled apoptotic thymocytes with lysosomes in the BMDMs by time-lapse live-cell imaging. The result showed an obviously impaired fusion between engulfed apoptotic cells and lysosomes in the nrbf2−/- BMDMs (Movie S1, S2, ). Together, these results indicated that the loss of NRBF2 impaired apoptotic cell clearance by interrupting the phagosome maturation process.
NRBF2 regulates RAB7 activity during phagosome maturation
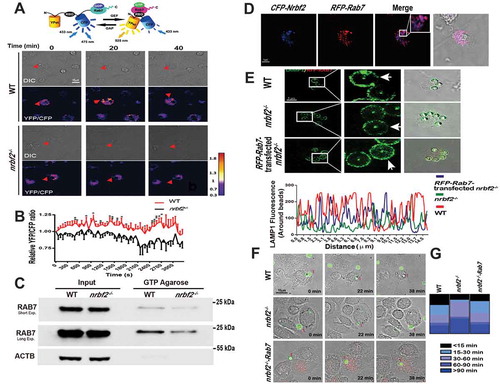
Phagosome maturation is a highly regulated process involving a series of proteins. In particular, RAB5A and RAB7 are responsible for the regulation of the early and late stages of phagocytosis and mutually facilitate phagosome maturation [Citation23–25]. To elucidate the specific mechanism by which NRBF2 regulates phagosome maturation, we allowed the BMDMs from both WT and nrbf2−/- mice to engulf fluorescent polystyrene beads and then stained markers of early phagosomes (RAB5), late phagosomes (RAB7) and lysosomes (LAMP1). Interestingly, we observed increased RAB5A and delayed RAB7 or LAMP1 fluorescence intensity surrounding the beads in the nrbf2−/- BMDMs (), indicating impaired maturation from the early endosome to the late endosome/lysosome in the nrbf2−/- BMDMs. LC3-associated phagocytosis has been revealed to be an important form of phagocytosis in macrophages for the clearance of extracellular particles including apoptotic cells. To figure out whether NRBF2 is involved in the phagosome maturation of LC3-associated phagocytosis, we tracked LC3 expression by staining BMDMs (WT and nrbf2−/-) with LC3 antibody. We observed that more LC3 is recruited surrounding beads in nrbf2−/- macrophages than WT after 2 h (). The data further proved that phagosome maturation, but not the phagocytic cargo recognition and engulfment, was impaired in nrbf2−/- macrophages. As RAB7 is a GTPase that replaces RAB5A and activates phagosome-lysosome fusion, we hypothesized that NRBF2 deficiency impaired RAB7 function during phagosome maturation. To test our suspicion, we measured the level of GTP-bound RAB7 on phagosomes using a fluorescence resonance energy transfer (FRET)-based Raichu-RAB7 probe, which was designed for the real-time detection of GTP-RAB7 in live cells [Citation26]. We monitored the FRET/CFP ratio around the engulfed apoptotic cells in the BMDMs and found that there was less GTP-bound RAB7 (active form) recruitment in the nrbf2−/- BMDMs (, Movie S3, and S4). We also utilized a GTP-binding agarose for pulling down GTP-bound RAB7 from macrophages, and we found much less GTP-bound RAB7 was pulled down in NRBF2-deficient macrophages (). Overexpression of RAB7 and NRBF2 exhibited a partial colocalization distribution (). To fully confirm that the impairment of the RAB7 function is responsible for the impaired phagosome maturation in NRBF2-deficient macrophages, we overexpressed the constitutively active form of RAB7 (RAB7Q67 L) in the nrbf2−/- BMDMs. The results showed that the amount of LAMP1 surrounding the beads was back to normal in nrbf2−/- BMDMs transfected with RAB7Q67 L (). Moreover, time-lapse imaging showed a well-rescued phagocytosis process (apoptotic cells were engulfed and transported from outward-extended pseudopods to the central cell body) in the RAB7Q67 L-transfected nrbf2−/- BMDMs ( and Movie S5-7). Collectively, these data indicate that the NRBF2 deficiency decreased RAB7 activity to inhibit phagosome maturation.
Figure 3. NRBF2 deficiency inhibits phagocytic maturation by prohibiting RAB7 recruitment. (A–C) Representative immunofluorescence images of RAB5A, RAB7, and LAMP1 expression around beads in WT and nrbf2−/- BMDMs after treatment with the latex beads for the indicated times. Scale bar: 5 μm. (D) Mean fluorescence density of RAB5A, RAB7, and LAMP1 around beads after treating BMDMs with the latex beads for 2 h (n = 40–45). Mean ± S.D. (E) Representative immunofluorescence images of LC3 expression around beads in WT and nrbf2−/- BMDMs after treatment with the latex beads for the indicated times. Scale bar: 5 μm. (F) Mean fluorescence density of LC3 around beads after treating BMDMs with the latex beads for the indicated times. In D and F data were analyzed via an unpaired Student’s t-test. *P < 0.05, **P < 0.01, ***P < 0.001
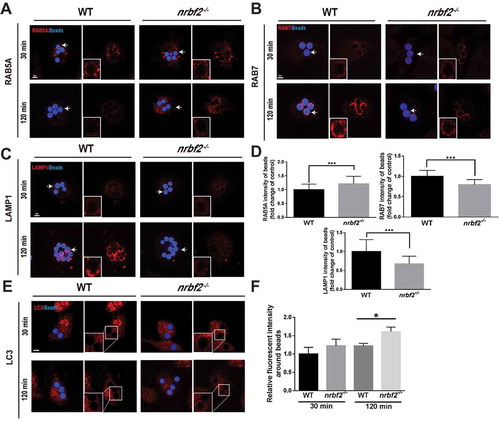
Figure 4. NRBF2 facilitates phagocytic maturation by enhancing RAB7 activity. (A) Representative time-lapse images of pRaichu-Rab7-transfected WT and nrbf2−/- BMDMs after adding apoptotic thymocytes. The cells are shown as color-coded FRET ratio (YFP/CFP) distributions (see color bar on the right). Scale bar: 10 μm. (B) Quantitative analysis of the relative FRET signal around the apoptotic cells at the indicated times (n = 5–9). Mean ± S.E.M. (C) The GTP-bound RAB7 protein levels in WT and nrbf2−/- BMDMs. Incubate GTP-agarose beads with protein lysates from WT, and nrbf2−/- BMDMs and GTP-bound RAB7 were detected by western blot (RAB7 antibody). (D) Confocal images of BMDM after transfection with CFP-Nrbf2 and RFP-Rab7. Scale bar: 5 μm. (E) Immunofluorescent staining images of LAMP1 after bead treatment for 2 h in WT, nrbf2−/-, and RFP-Rab7-transfected nrbf2−/- BMDMs. Scale bar: 5 μm. Right: Fluorescence intensity of LAMP1 around the phagosome (indicated by arrow). (F) Representative time-lapse images of CMFDA-stained apoptotic cells in WT, nrbf2−/-, and RFP-Rab7-transfected nrbf2−/- BMDMs after they were treated with the CMFDA-stained apoptotic cells. (G) Classification of apoptotic cells according to the time required for phagosomes moving into the swelling cell body. In B, data were analyzed via an unpaired Student’s t-test. *P < 0.05, **P < 0.01, ***P < 0.001
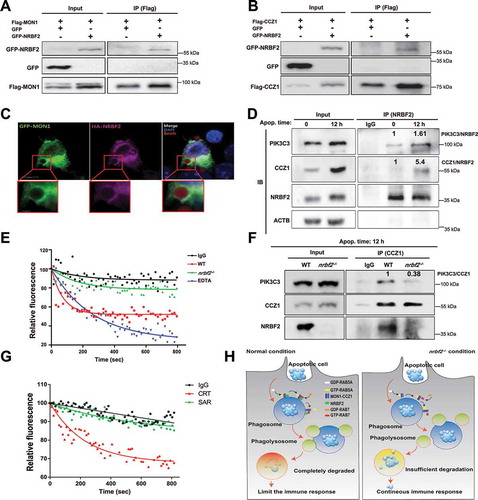
NRBF2 interacts with the MON1-CCZ1 complex and regulates its activation during phagosome maturation
A critical regulator for the transition from the RAB5A-positive early phagosome to the RAB7-positive late phagosome is the MON1-CCZ1 complex [Citation24,Citation25]. This complex is the guanine nucleotide exchange factor (GEF) that allows RAB7 to transition from the GDP-bound form to the GTP-bound form. The MON1-CCZ1 complex has been identified as a conserved complex for phagosome maturation during the apoptotic cell engulfment [Citation20]. To investigate whether NRBF2 regulates the MON1-CCZ1 complex during phagocytosis, we applied co-immunoprecipitation (Co-IP) to assess the interaction between NRBF2 and MON1 or CCZ1. We found that NRBF2 interacts with both MON1 and CCZ1 (). Moreover, we treated Raw264.7 cells with carboxylate-modified microspheres after transfecting cells with GFP-Mon1 and HA-Nrbf2 plasmids. We found that GFP-MON1 and HA-NRBF2 colocalized around the microspheres (). More interestingly, the interactions between NRBF2 and CCZ1 or PIK3C3 were dramatically increased after treating the BMDMs with apoptotic cells for 12 h (). Therefore, NRBF2 can interact with the MON1-CCZ1 complex, and this interaction is increased during the apoptotic cell clearance. To confirm whether the GEF activity of the MON1-CCZ1 complex is inhibited without NRBF2, we established an in vitro GEF activity assay with immuno-purified MON1-CCZ1 complex using an anti-CCZ1 antibody. Interestingly, we found that the GEF activity of the MON1-CCZ1 complex isolated from the nrbf2−/- BMDMs was obviously decreased compared with that from the WT BMDMs (). The MON1-CCZ1 complex has been reported to be recruited to PI3P-containing vesicles for activation in yeast [Citation27]. We hence speculated that the interaction between MON1-CCZ1 and PIK3C3 might be interrupted in nrbf2−/- cells. Indeed, the co-IP experiment revealed that the interaction of CCZ1 and PIK3C3 in NRBF2-deficient BMDMs is much weaker than that in WT BMDMs after stimulation with apoptotic cells for 12 h (). In support of this notion, SAR405 (Specific PIK3C3 inhibitor) was added when performing the in vitro GEF activity assay with the CCZ1 antibody-IPed product, and the inhibition of GEF activity was observed (). Together, these results indicate that NRBF2 interacts with the MON1-CCZ1 complex and is required for its GEF activity to promote the activation of RAB7 for phagosome maturation ().
Figure 5. NRBF2 is involved in the GEF function regulation via binding to the MON1-CCZ1 complex. (A) Co-immunoprecipitation of GFP or GFP-NRBF2 with Flag-MON1 after co-transfection into HEK293 cells. Cells were co-transfected with Flag-Mon1 and GFP or Flag-Mon1 and GFP-Nrbf2. Using the GFP antibody to detect the GFP-NRBF2 expression in Flag-MON1 enriched-proteins. (B) Co-immunoprecipitation of GFP or GFP-NRBF2 with Flag-CCZ1 after co-transfection into HEK293 cells. Cells were co-transfected with Flag-Ccz1 and GFP or Flag-Ccz1 and GFP-Nrbf2. Using the GFP antibody to detect the GFP-NRBF2 expression in Flag-CCZ1 enriched-proteins. (C) Representative images after adding carboxylate-modified microspheres (2 μm) into Raw 264.7 cells that were transfected with GFP-Mon1 and HA-Nrbf2 for 2 h. Scale bar: 5 μm or 1 μm. (D) Co-immunoprecipitation of PIK3C3 or CCZ1 with NRBF2 endogenously after treating BMDMs with apoptotic cells at different time points. (E) In vitro measurement of the CCZ1 antibody-immunoprecipitated GEF activity in WT and nrbf2−/- BMDMs. Using the CCZ1 antibody to pull down proteins in WT and nrbf2−/- BMDMs. Then detect the GEF activity of these proteins. (F) Co-immunoprecipitation of PIK3C3 or NRBF2 with CCZ1 endogenously after treating WT or nrbf2−/- BMDMs with apoptotic cells after 12 h. (G) In vitro measurement of CCZ1 antibody IPed GEF activity in the presence or absence of SAR405 (PIK3C3 inhibitor) for 12 h. Treat BMDMs with DMSO or 1 μm SAR405 for 12 h, then use CCZ1 to pull down proteins for GEF activity determination. (H) A summary diagram shows the role of NRBF2 in regulating RAB7 GEF activity and apoptotic cell clearance during colitis pathogenesis
Adoptive transfer of WT macrophages into nrbf2−/- mice attenuates DSS-induced colitis
In order to confirm the relationship between macrophage function and IBD in nrbf2−/- mice, we transferred WT or nrbf2−/- BMDMs into nrbf2−/-mice 1 d prior to DSS treatment following the protocol reported previously [Citation28]. The results showed that WT BMDMs transfer dramatically rescued the DSS-induced bodyweight drop, DAI increase, colon shortening, MPO elevation, and spleen enlargement in nrbf2−/- mice, compared with nrbf2−/- BMDMs transfer (). Moreover, the accumulation of apoptotic cells in nrbf2−/- mice receiving DSS treatment was also alleviated by transfer of WT BMDMs, compared with nrbf2−/- BMDMs transfer (). In addition, to evaluate the effects of nrbf2−/- BMDMs in WT mice during DSS-induced UC development, we have transferred nrbf2−/- or WT BMDMs to WT mice 1 day prior. We found that nrbf2−/- BMDMs aggravate the DSS-induced UC development (Fig. S5A-E). We conclude that macrophagic NRBF2 played a protective role in DSS-induced colitis.
Figure 6. Adoptive transfer of macrophage from WT mice ameliorates DSS-induced-colitis in nrbf2−/- mice compared to the transfer of nrbf2−/- macrophage. WT or nrbf2−/- mice were injected WT or nrbf2−/- macrophages (1 x 10⁶ cells) via I. V. injection before the 1st day for DSS treatment. (A) Body weights recorded daily in different groups (n = 6–8). 2% DSS in drinking water was administrated to DSS treatment groups in the first 5 d, following 2 d of normal drinking water. Mean ± S.E.M. (B) Daily disease activity indexes (DAIs) of WT and nrbf2−/- mice after DSS treatment (n = 6–8). (C and D) Length of colons from the different groups (left), and the representative images in D (n = 6–8). (E) Determination of MPO (myeloperoxidase) activity in the colon lysates from the different groups (n = 6–8). Mean ±S.E.M. (F) Spleen weight indexes of the different groups (spleen weight/body weight [n = 6–8]. Mean ± S.D. (G) Representative images of TUNEL staining in the colon of mice from different groups. (green, TUNEL positive, blue, DAPI). Scale bar: 100 μm. (H) Quantification of the TUNEL-positive cells in the colon tissue samples from the different groups (n = 6–8 samples). Mean ± S.E.M. In A-C, E, F, and H, data were analyzed via one-way ANOVA with the Tukey test
![Figure 6. Adoptive transfer of macrophage from WT mice ameliorates DSS-induced-colitis in nrbf2−/- mice compared to the transfer of nrbf2−/- macrophage. WT or nrbf2−/- mice were injected WT or nrbf2−/- macrophages (1 x 10⁶ cells) via I. V. injection before the 1st day for DSS treatment. (A) Body weights recorded daily in different groups (n = 6–8). 2% DSS in drinking water was administrated to DSS treatment groups in the first 5 d, following 2 d of normal drinking water. Mean ± S.E.M. (B) Daily disease activity indexes (DAIs) of WT and nrbf2−/- mice after DSS treatment (n = 6–8). (C and D) Length of colons from the different groups (left), and the representative images in D (n = 6–8). (E) Determination of MPO (myeloperoxidase) activity in the colon lysates from the different groups (n = 6–8). Mean ±S.E.M. (F) Spleen weight indexes of the different groups (spleen weight/body weight [n = 6–8]. Mean ± S.D. (G) Representative images of TUNEL staining in the colon of mice from different groups. (green, TUNEL positive, blue, DAPI). Scale bar: 100 μm. (H) Quantification of the TUNEL-positive cells in the colon tissue samples from the different groups (n = 6–8 samples). Mean ± S.E.M. In A-C, E, F, and H, data were analyzed via one-way ANOVA with the Tukey test](/cms/asset/a3636f3b-839d-4cc4-b212-0cbff67b302c/kaup_a_1741332_f0006_oc.jpg)
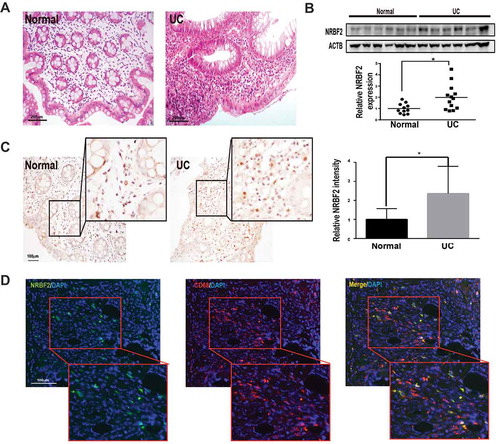
NRBF2 expression is upregulated in the colon tissue of UC patients
To further explore the physiological relevance between NRBF2 and UC, we measured NRBF2 expression levels in colon tissue from UC patients and healthy controls. We confirmed the pathological characteristics of UC by HE staining (). Colon tissues from UC patients displayed more TUNEL-positive cells and more ITGAM-positive macrophage staining (Fig. S2A-D). Western blotting (WB) analysis showed higher NRBF2 expression in the colon tissue from the UC patients than in the healthy controls (). Immunohistochemistry staining revealed that NRBF2-positive cells were mainly distributed in the lamina propria, and the morphology of the NRBF2-positive cells resembled that of infiltrated inflammatory cells rather than the resident colonic cells ( and S1 C). We further performed double staining with the macrophage-specific marker CD68 and NRBF2 antibody and observed that almost all NRBF2-highly expressed cells were positive for CD68 staining (), indicating that NRBF2 expression is highly upregulated in macrophages in the UC colon tissue.
Figure 7. NRBF2 expression is upregulated in the colon of UC patients. (A) Representative images of the HE staining of clinically normal and active UC human colon biopsies (n = 3). Scale bar: 200 μm. (B) Western blotting results in the NRBF2 expression in normal and active human UC human colon tissue. Below, Quantification of the western blotting results for relative NRBF2 expression that normalized with ACTB in normal and active UC human colon tissue (n = 11–13). Mean ± S.D. (C) Immunohistochemistry images of the NRBF2 staining of normal and active UC human colon samples (violets, nuclei; brown, NRBF2; n = 3 samples). Right, Quantification of IHC staining results of NRBF2 in normal and active UC human colon. Scale bar: 100 μm. (D) Colocalization of NRBF2 and CD68 in active human UC colon samples (n = 3 samples; red, CD68; green, NRBF2). Scale bar: 100 μm. Mean ± S.D. Data in B and C. were analyzed via an unpaired Student’s t-test. *P < 0.05
Apoptotic cell accumulation in colon biopsies of active UC patients correlates with disease severity
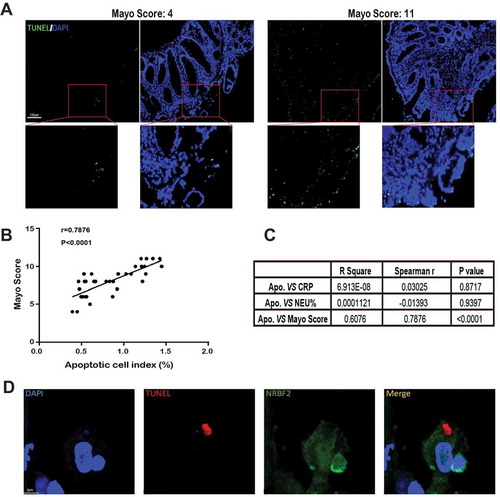
Increased apoptotic cell number has been observed in UC patient colon tissue. To provide a more quantitative analysis of the relationship between apoptotic cell accumulation and disease severity, we analyzed the apoptotic cell index in colon tissue sections from UC patients (Table S1) by TUNEL staining and by determining the UC Mayo score (–C), the most commonly used disease severity index for UC in clinical trials [Citation29]. All patients were initially diagnosed without any previous medication. The results showed that the apoptotic cell index in the colon is positively correlated with the disease severity of UC. Importantly, we stained the NRBF2 protein on the colon tissue slide after TUNEL staining and observed some apoptotic cell debris (TUNEL-positive part) were being engulfed by the NRBF2-positive cells (). The result provides direct evidence that NRBF2 is associated with apoptotic cell clearance in UC patient colon tissue.
Figure 8. Apoptotic cell accumulation correlates with the Mayo score of ulcerative colitis (UC). (A) Representative images of TUNEL staining of UC patients’ colon biopsies in low and high Mayo Score. (Green: TUNEL staining, blue: DAPI). Scale bar: 100 μm. (B) A scatterplot with a regression line, illustrating the correlation between the apoptotic cell index of the colon and the relevant Mayo Score (33 patients). r, Spearman rank correlation coefficients. (C) Analyzing correlation indexes between apoptotic cell index and inflammatory markers in the peripheric blood system (CPR, C-reactive protein, NEU%, neutrophil %). (D) Representative images of TUNEL-positive debris in NRBF2-positive cells on human UC colon tissue (n = 2 samples). Scale bar: 4 μm. (green, NRBF2, red, TUNEL-positive nuclei)
Discussion
Genetic evidence has revealed the link between autophagy dysfunction and the development of IBD. However, the mechanistic connection between autophagy and IBD has not been well characterized, though multiple pathological mechanisms have been proposed. In this study, we report that Nrbf2, an autophagy-related gene, plays a protective role in alleviating IBD injuries. NRBF2 regulates autophagy as a regulatory subunit of ATG14 L-BECN1-PIK3C3 complex [Citation9,Citation30]. Pik3c3 deficiency has been reported to cause IBD-like injures in zebrafish [Citation8], and our study provides the first evidence in mammals of a relationship between the NRBF2/PIK3C3 complex and IBD. Interestingly, different from the Pik3c3-deficient zebrafish, which are postnatal lethal and autonomously develop severe intestinal injuries [Citation8], nrbf2−/- mice survive and, in large, behave normally. Our previous study revealed that nrbf2−/- mice developed mild liver injuries by the age of 10 months [Citation9]. We also observed enlargement of the spleen in the nrbf2−/- mice. However, the mice do not display obvious colitis symptoms under normal conditions. Hence, nrbf2−/- mice can be a good model to study the role of autophagy-PIK3C3 impairment in the development of IBD, as well as for the evaluation of therapeutics against intestinal inflammation associated with autophagy deficiency.
Apoptotic cells emerge daily, which is thought to account for the necessity of efficient turnover for the maintenance of homeostasis [Citation31]. During inflammation, there is a dramatic increase in the number of apoptotic cells in affected tissues, and this increase recruits residential phagocytes or circulating immune cells, such as neutrophils and macrophages, thus enhancing apoptotic cell clearance to avoid the tissue becoming secondarily necrotic, which would cause aggravated inflammation and a predisposition to autoimmunity [Citation31]. The genetic regulation of apoptotic cell clearance affects tissue inflammation in the DSS-induced UC mouse model [Citation32], indicating that efficient apoptotic cell clearance is critical for preventing colitis injury. The data provided in this study revealed a novel role for NRBF2 in facilitating apoptotic cell clearance and alleviating intestinal inflammation during IBD. Interestingly, we found that nrbf2−/- mice showed increased spleen weight compared to WT mice in normal conditions. As a previous study revealed, the spleen, among all the lymphoid organs, is particularly responsible for the clearance of blood-borne pathogens and apoptotic cells [Citation33]. We speculate that the enlarged spleen in nrbf2−/- mice may be a compensatory response to delayed apoptotic cell clearance. In addition, a slight increase of TUNEL-positive cells is observed in the colons of nrbf2−/- mice without DSS administration, which suggests that NRBF2 is involved in apoptotic cell clearance in the colon tissue under normal physiological condition. We also found that most of the apoptotic cells in the submucosa layer in the DSS-induced nrbf2−/- mice colon can be colocalized with PTPRC/CD45 (Fig. S4A), indicating lots of apoptotic leukocytes accumulation. Besides, after determining the sensitivity of WT and nrbf2−/- macrophages toward several cell death triggers, we found that macrophage lacking NRBF2 displayed slightly decreased cell viability, while no obvious increased cytotoxicity when compared to WT (Fig. S4B-E). Moreover, evidence from clinical samples showed that apoptotic cell accumulation is strongly correlated with UC disease severity. Together, the data presented in this study, as well as those published elsewhere, highlight the role of efficient apoptotic cell clearance in inflammation resolution and tissue recovery during IBD.
The previously unknown role of NRBF2 in regulating phagosome maturation for apoptotic cell clearance was fully explored in this study. Three steps are involved in apoptotic cell clearance: the sensing and recognition of apoptotic cells by phagocytes, the engulfment of apoptotic cells, and the degradation of phagosomes [Citation34]. In this study, by tracing the fusion between engulfed apoptotic cells and lysosomes, we showed that NRBF2 is specifically required for phagosome maturation. We further confirmed that the loss of NRBF2 expression interrupts the transition of RAB5A-positive early phagosomes into RAB7-positive late phagosomes. When examining the biochemical mechanism, we observed a dramatic reduction in the level of GTP-bound RAB7 surrounding the engulfed apoptotic cells in nrbf2−/- macrophages. Overexpressing RAB7 rescued impaired phagosome maturation, indicating that the reduced level of GTP-bound RAB7 was responsible for the phagosome maturation impairment in nrbf2−/- macrophages. MON1-CCZ1 is the GEF that transforms RAB7 from the GDP-bound form to the GTP-bound form and has been identified as the conserved regulator of engulfed apoptotic cell clearance [Citation24]. Interestingly, we found that NRBF2 expression was increased in BMDM after treating with apoptotic cells for 12 h (Fig. S4 F and S4 G).
Furthermore, NRBF2 interacts with CCZ1 and MON1, and the interaction is enhanced after treating the BMDMs with apoptotic cells. This observation indicates a potentially important role for NRBF2 in the regulation of MON1-CCZ1 complex function during apoptotic cell clearance. The subsequent results show that the MON1-CCZ1 GEF activity was dramatically impaired in nrbf2−/- macrophages, indicating that NRBF2 is required for the maintenance of GEF activity to facilitate phagosome maturation. NRBF2 is a binding partner of PIK3C3, which is responsible for the generation of phosphatidylinositol-3-phosphate (PI3P). PIK3C3 is an essential factor for the early sorting and delivery of proteins to the vacuole during phagocytosis [Citation35]. Recent studies have revealed that PIK3C3 is also involved in the phagosome maturation [Citation36–38]. Interestingly, PI3P has been reported to recruit the MON1-CCZ1 complex and activate its GEF activity. Our data shows that NRBF2 is required for the interaction between the MON1-CCZ1 complex and PIK3C3, while PIK3C3-specific inhibitor SAR405 inhibited GEF activity in macrophages. The data reveals a critical role for NRBF2 in regulating the association of PIK3C3 and MON1-CCZ1 to activate GEF activity. Furthermore, the transcriptome analysis of WT and nrbf2−/- BMDMs provide more evidence for the role of NRBF2 in regulating phagocytosis and inflammation (Fig. S3). Several genes involved in response to stimulus and phagosome processes were identified through GO annotations analysis or KEGG enrichment analysis (Fig. S3).
This study highlights the potential roles for NRBF2 in macrophage function and UC development. We found that NRBF2 expression was upregulated in macrophages in UC patient colon tissue, suggesting the involvement of NRBF2 in macrophage function and UC development. As a part of the innate immune system, macrophages govern gut homeostasis by protecting intestinal tissue from foreign invaders [Citation39]. The continuous activation of intestinal immune responses by uncleared invaders is an important event in the triggering of UC. The fact that UC is characterized by enhanced recruitment and retention of macrophages [Citation40] implies that macrophages have a critical role during UC development. To support this hypothesis, a previous study showed that mice with ATG16L1-deficient macrophages were more vulnerable to DSS-induced colitis than wild-type mice [Citation41]. Macrophages have two major functions as innate immune cells: the regulation of inflammation by releasing cytokines, and the elimination of invading pathogens and apoptotic cells by efficient phagocytosis. Most of the studies on the role of macrophages in UC pathogenesis have focused on the regulation of inflammation function of macrophages [Citation42–44]. However, resident macrophages are limited to the classic proinflammatory response [Citation45], and they contribute important functions in intestinal homeostasis by efficiently engulfing invading bacteria and apoptotic cells during UC [Citation46]. Interestingly, we observed a dramatic accumulation of apoptotic cells in the colon tissue of nrbf2−/- mice, and these mice displayed delayed apoptotic cell clearance. Studies with purified BMDMs further confirmed that the apoptotic cell clearance capability of the nrbf2−/- BMDMs is dramatically impaired. Hence, it is reasonable for us to speculate that the impaired apoptotic cell clearance ability of macrophages at least partially contributes to the enhanced IBD injury in nrbf2−/- mice. The data from the clinical samples reveal that NRBF2-positive macrophages are dramatically increased in the UC patients’ colon, further supporting a role for NRBF2 in regulating macrophage function in IBD.
Materials and Methods
Reagents, plasmids, and antibodies
DSS was obtained from MP Biomedicals (160,110). Hexadecyltrimethyl ammonium bromide, o-dianisidine dihydrochloride, the PKH26 red fluorescent cell linker for general cell membrane labeling (MINI26), and sodium pentobarbital (P3761) were purchased from Sigma-Aldrich. DAB (SK-4100) was obtained from Vector Laboratories. An in situ cell death detection kit was purchased from Roche (12156792910 and 11684795910). CellTrackerTM Green CMFDA (C2925), pHrodo Red (P36600), Dynabeads Protein G (10007D), LysoTracker Red DND-99 (L-7528), mant-GDP (M12414), GTP protein (18332015), and the Clean-Blot IP Detection Kit (21232) were purchased from Invitrogen. An ANXA5/annexin V and PI staining kit was purchased from the Miltenyi Biotec (130092052). Fluoresbrite BB carboxylate latex beads were purchased from PolyScience (18340–5). Protein A/G Plus-agarose was obtained from Santa Cruz Biotechnology (sc2003). RAB7 protein was purchased from Abcam (ab103507). A prepared desalting column (86849), Hoechst 33342 (H1339) were obtained from ThermoFisher Scientific. pRaichu-RAB7/A441 was a generous gift from Takeshi Nakamura (Tokyo University of Science, Japan), and RFP-RAB7 was purchased from Addgene (14436, deposited by Ari Helenius) [Citation47]. NRBF2 was subcloned into pcDNA3-CFP (13030, deposited by Doug Golenbock) [Citation9]. GFP-CCZ1 and GFP-MON1 were provided as a gift by Mistunori Fukuda (Tohoku University, Japan). Flag-MON1 and Flag-CCZ1 were subcloned into p3xFLAG-CMVTM −7.1 (Sigma, E7533). HA-NRBF2 was provided as a gift by Qiong Zhong (University of Texas Southwestern Medical Center, Dallas, TX, USA).
An anti-RAB7 antibody (9367), anti-RAB5A antibody (3547), anti-LAMP1 antibody (9091), anti-ACTB/β-actin antibody (4970), anti-rabbit HRP antibody (7074), anti-mouse HRP antibody (7076) and anti-NRBF2 antibody for WB (8633) were purchased from Cell Signaling Technology. The anti-NRBF2 antibody for immunofluorescence (IF) and immunohistochemistry (IHC) (HPA021670) was obtained from Sigma-Aldrich. The anti-NRBF2 antibody used for the Co-IP studies (A301-851) was purchased from Bethyl Laboratories. An anti-PIK3C3/VPS34 antibody (38–2100) was obtained from Echelon Biosciences. An anti-MON1 antibody (ab103919) and anti-SQSTM1/p62 antibody (ab109012) were purchased from Abcam (Cambridge, MA, USA). An anti-CCZ1 antibody (sc-514290) and anti-CD68 antibody (sc-20060) were obtained from Santa Cruz Biotechnology (Santa Cruz, CA, USA). The anti-ITGAM/CD11b antibody (NB110-89474) for IF was obtained from Novus Biologicals. The FITC-conjugated anti-ITGAM/CD11b antibody for flow cytometry (553310) was obtained from BD Biosciences. The PE/Cy7-conjugated anti-ADGRE1/F4/80 antibody for flow cytometry (123114) was obtained from Biolegend. Alexa Fluor 488- or 555-conjugated goat anti-rabbit and goat anti-mouse antibodies were purchased from Invitrogen (A-11034 and A-21422).
Animal and human tissue specimens
The generation of nrbf2−/- mice has been previously described [Citation9]. In all experiments, the nrbf2−/- mice and their WT littermate control wild-types (WT) derived from interbreeding of heterozygous C57BL/6 mice were genotyped by PCR with a forward primer (primer F: 5ʹ-GACAGCTATATCAGGGTCCTG-3ʹ) and reverse primers (primer R1 for genomic Nrbf2; 5ʹ-GATCAAGCAGTACCTCCAAAC-3ʹ; primer R2 for pU-21 W; 5ʹ-CCGGCTAAAACTTGAGACCTTC-3ʹ). The WT band was 339 bp in size, and the mutant band was 488 bp. All mice were maintained at the University of Macau animal facility according to the guidelines of the administrative panel. All the experimental procedures were approved by the University of Macau animal research ethics committees.
Human tissues were obtained as formalin-fixed, paraffin-embedded tissue sections or frozen blocks from the Department of Gastroenterology, Nanfang Hospital, Southern Medical University, Guangzhou, China. The sources of the tissues remained anonymous according to the guidelines approved by the Hospital’s Research Ethics Board.
DSS-induced mouse colitis model
Mice (littermates, 10–12 weeks old) were given drinking water containing 2% DSS for 8 d, followed by normal water for 3 d. Changes in body weight were measured daily. DAI score was also evaluated daily. Scores were defined as follows: weight loss: 0 (no loss), 1 (1–5%), 2 (5%–10%), 3 (10%–20%), and 4 (>20%); bleeding: 0 (no blood), 1 (hemoccult-positive), 2 (hemoccult-positive and visual pellet bleeding), and 4 (gross bleeding); stool consistency: 0 (normal), 2 (loose stool), and 4 (diarrhea). After the experiment, the mice were anesthetized with an I.P. injection of sodium pentobarbital. The colon and spleen were removed and the length and weight, respectively, were recorded. Each colon was divided into four parts. 0.5 cm of the distal colon was placed into 4% paraformaldehyde; the remaining colon was divided into three parts of equal length from the distal end for MPO analysis, immunoblotting, and cytokine analysis.
Histology and immunohistochemistry
Colon tissue was fixed overnight in 4% paraformaldehyde, embedded in paraffin, and then sectioned into 4 μm slices. Slides were stained separately with HE. The histological score represents the sum of the epithelial damage and inflammatory cell infiltration scores, and these scores were evaluated as described previously [Citation48]. For epithelial damage, the scores were calculated as: 0, normal morphology; 1, loss of goblet cells; 2, loss of crypts; and 4, large areas with crypt loss. For inflammatory cell infiltration, the scoring was as follows: 0, no infiltration; 1, infiltration around crypt bases; 2, infiltration reaching the lamina muscularis mucosae; 3, extensive infiltration reaching the lamina muscularis mucosae and thickening of the mucosa with abundant edema; and 4, infiltration of the lamina submucosa. For immunohistochemistry studies, the slides were deparaffinized and rehydrated. Antigen retrieval was performed by using 0.05 M citrate buffer (pH 6.0) (Beyotime, P0083) at 100°C for 15 min. After the slides were blocked with 3% H2O2 (Aladdin, H112517), the sections were incubated with an anti-NRBF2 antibody overnight at 4°C, followed by incubation with an HRP-conjugated anti-rabbit IgG, and reacted with a peroxidase substrate kit for DAB (Vector, SK-4100).
Colonic myeloperoxidase (MPO) assay
Tissue samples were thoroughly washed and homogenized in 0.5% hexadecyltrimethyl ammonium bromide in 50 mM potassium phosphate buffer (50 mM K2HPO4, 50 mM KH2PO4, pH 6.0) and centrifuged. MPO was detected in the supernatant by adding 1 mg/mL of o-dianisidine dihydrochloride and 5 x 10⁻⁴% H2O2; the change in optical density at 450 nm was recorded. One unit of MPO activity was defined as the amount that degraded 1.0 mol of peroxide/min at 25°C.
Cytokine analysis
The levels of cytokines (IL6, IL1B) in the colon tissue lysate were determined by using Bio-plex 23 cytokine mouse array with a Bio-plex system (Bio-Rad Laboratories, Hercules, CA, USA) according to the instructions provided by the manufacturer.
TUNEL staining
The paraffin-embedded distal colon region was cut by a microtome at 4 μm. After de-waxing, the sections were immersed in 0.1 M citrate buffer (pH 6.0), microwaved at 350 W for 5 min and then incubated with TUNEL reaction mixture (Roche, 12156792870 or 11684795910) for 1 h at 37°C using an in situ cell death detection kit according to the manufacturer’s instructions. The nuclei were counterstained with Hoechst 33342. Stained images were captured under an IX73 inverted microscope (Olympus, Tokyo, Japan). For each mouse, 3 to 5 random fields of the colon were captured per section. TUNEL-positive signals were quantitatively analyzed by ImageJ software (NIH). The apoptotic index was determined by calculating the TUNEL-positive area normalized to the total nuclear area for each field.
Immunoblotting and co-immunoprecipitation
Tissue or cells were lysed with RIPA buffer (50 mM Tris-HCl, pH 7.4, 1% NP40 [Sigma, 1175499001], 0.35% DOC [Sigma, D6750], 150 mM NaCl, 1 mM EDTA, 1 mM EGTA, supplemented with protease and phosphatase inhibitor cocktails [ThermoFisher, A32961]). The lysates were denatured in 1 X sample loading buffer and resolved by SDS-PAGE, and then the proteins were transferred to a polyvinylidene difluoride membrane (Bio-Rad, 1620177). After blocking with 5% nonfat milk (Bio-Rad, 1706404) in Tris-buffered saline (Tris 20 mM, NaCl 137 mM, pH 7.6) containing 0.1% Tween-20 (Sigma, P2287) (TBST), the membranes were incubated with different primary antibodies overnight at 4°C. The proteins were detected by chemiluminescence using an HRP substrate (GE Healthcare, RPN2232) after incubating the membrane with an HRP-conjugated secondary antibody and washing with TBST. Western blotting images were quantified using Imaging LabTM software (Bio-Rad).
For Co-IP, cells were homogenized in IP lysis buffer (10 mM Tris-HCl, pH 7.5, 2 mM EDTA, 1% NP40, 150 mM NaCl supplemented with protease and phosphates inhibitors). The lysates were incubated with specific antibodies overnight, followed by incubation with Dynabeads protein G for 4 h. The beads were washed 3–5 times with IP lysis buffer and denatured in 1 X sample loading buffer before the immunoprecipitated proteins were resolved by SDS-PAGE. For the detection of NRBF2 and CCZ1, the Clean-Blot IP Detection Kit was used to exclude the interference of the IgG bands during the immunoblotting steps.
BMDMs
Cells were obtained by flushing the femur and tibia from WT or nrbf2−/- C57BL/6 mice at similar ages (6–8 weeks), and the isolated cells were cultured in culture medium (Dulbecco’s modified Eagle’s medium [DMEM] (Gibco, 21063–029) supplemented with 10% fetal bovine serum (FBS) (Gibco, 26140–079), 10% L929 conditioned medium (prepared according to the method from Hosoe et al. [Citation49]), and 1% penicillin and streptomycin (Gibco, 15140122)). The culture medium was changed every 2 or 3 d. On day 7, the cells were stained with PE/Cy7-conjugated anti-ADGRE1/F4/80 and FITC-conjugated anti-ITGAM/CD11b antibodies and analyzed by flow cytometry with a FACS Canto flow cytometer (BD Biosciences, San Diego, CA, USA).
Transfection
BMDMs were transiently transfected with 5 μg of RFP-Rab7 or CFP-Nrbf2 plasmids by using the Amaxa 4D-Nucleofector X Unit under the pre-tested program. After 24 h of post-transfection, the cells were prepared for time-lapse imaging or fixation for confocal imaging.
For the Co-IP of lysates from HEK293 cells (ATCC, CRL-1573), we transfected the HEK293 cells with plasmids using Lipofectamine 3000 (Invitrogen, L3000-008) according to the manufacturer’s manual. The cells were harvested 24 hours after transfection.
Flow cytometry in vitro engulfment assay
We plated BMDMs (3 x 10⁵ cells) in 24-well plates and incubated with 3 × 10⁶ CellTrackerTM Green CMFDA-labeled apoptotic thymocytes for 15 or 30 min. We induced apoptosis in the thymocytes by keeping them in 1% PBS at 4°C for 48 h (at which, > 70% of the cells were apoptotic in preliminary ANXA5 and PI experiments). We analyzed the detached cells by flow cytometry (FACSCanto, BD Biosciences).
Determination of the maturation process of phagosomes containing apoptotic cells
The CMFDA labeled-apoptotic thymocytes were resuspended in DMEM medium and incubated at a multiplicity of infection (MOI) of 8 with BMDMs for 30 min. Then, the cells were washed 3 times with PBS, resuspended in complete medium, and incubated at 37°C with 5% CO2 for the indicated chase times. We washed the cells with PBS, quenched the surface green fluorescence signal with trypan blue, and we analyzed the intracellular fluorescence using flow cytometry (FACSCanto, BD Biosciences).
Immunofluorescence staining and analysis
To track phagocytosis in WT and nrbf2−/- BMDMs, we used FBS-coated 4.5 μm Fluoresbrite BB Carboxylate latex beads for BMDM cells engulfment. After 3 × 10⁵ WT cells or nrbf2−/- BMDM cells were seeded per well into 24-well plates with glass coverslips, 3 × 10⁶ FBS-coated beads resuspended in DMEM were added to each well and left for the indicated time points. All cells were fixed in 4% paraformaldehyde for 10 min at room temperature and permeabilized in 0.2% Triton X-100 in PBS for 15 min. After blocking with 5% BSA in PBS for 1 h at room temperature, the cells were stained with a primary antibody (anti-RAB5A, anti-RAB7, or anti-LAMP1) and left at 4°C overnight. The cells were washed with PBS 3 times and stained with a secondary antibody (Alexa Fluor 488 or 555 conjugated) for 1 h. The cells were mounted with 50% glycerol in PBS after washing 3 times. Fluorescence images were examined under a confocal imaging microscope (Leica TCS SP8; Leica Microsystems, Bensheim, Germany). The fluorescence value around the phagocytosed beads was measured using Leica Application Suite X (LAS X) software (Leica Microsystems, Bensheim, Germany). Immunofluorescence staining of UC patient colon biopsies was performed by firstly de-paraffinizing the samples and then re-hydrating them in xylene and an alcohol gradient. Antigen retrieval was performed by using 0.05 M citrate buffer (pH 6.0) at 100°C for 15 min, and then the sections were blocked and incubated with the appropriate antibody.
Time-lapse microscopy and analysis
Live imaging was performed using a confocal imaging microscope with LAS X software and an environmental chamber that maintained the temperature at 37°C and provided a humidified stream of 5% CO2 air. For the live fusion images of LysoTracker-stained lysosomes and apoptotic thymocytes, BMDMs were pre-stained with LysoTracker red DND-99, and LysoTracker was in the solution used during the image capture. CMFDA-labeled apoptotic thymocytes were added to the BMDMs, and images were taken every 30 s for 2–3 h. To quantify the engulfed apoptotic cells, we measured the distribution of the time required to form the late phagosome (fusion with Lysotracker) over 2 h. For RFP-RAB7 transfection, we measured the time required for the apoptotic cells to move to the central cell body [Citation50]. For time-lapse FRET imaging, pRaichu-Rab7/A441 was first transfected into WT and nrbf2−/- BMDMs via electroporation. FRET-sensitized emission (FRET-SE) analysis was performed using a Leica TCS SP8 tandem scanning confocal microscope and LAS X software. The FRET efficiency was calculated according to method 3 in the software (EA[i] = B/A, where EA is the FRET efficiency, and A and B correspond to the intensities of the donor and FRET signals, respectively).
GEF assay
Protein A/G Plus-agarose was used to pull down CCZ1-bound proteins in WT and nrbf2−/- BMDMs lysates. RAB7 (50 nM) was loaded with the fluorescent GDP analogue mant-GDP (1.5 μM) [Citation51] and incubated in a loading buffer (20 mM HEPES [pH 7.5], 150 mM NaCl, and 5 mM EDTA) for 2 h at room temperature. The reaction was terminated by the addition of 10 mM MgCl2. Free mant-GDP was removed by gel filtration, and the buffer was changed to an exchanging buffer (20 mM HEPES [pH 7.5], 150 mM NaCl, and 0.5 mM MgCl2) by using a prepacked desalting column. The dissociation of mant-GDP from WT and nrbf2−/- BMDMs in the presence of CCZ1 and CCZ1-binding proteins were assessed by measuring the decrease in fluorescence when an excess of GTP (0.5 mM) was added. Samples were excited at 360 nm, and the emission was monitored at 440 nm using a plate reader (FlexStation 3 Multi-Mode Microplate Reader, Molecular Devices, UK).
GDP-agarose binding assay
GTP-binding assays were performed as described [Citation52], with slight modification. WT and nrbf2−/- BMDMs were collected and lysed in the lysate buffer (50 mM Tris-HCl (pH 7.5, 250 mM NaCl, 5 mM Mg acetate, 0.5% Triton X-100, and protease inhibitors). After centrifugation, the lysates were incubated with GTP-agarose beads at 4°C overnight. The GTP-agarose beads were washed and boiled in SDS-loading buffer before SDS-PAGE. The GTP-binding RAB7 was detected by incubation with RAB7 antibody.
Apoptotic cell clearance
In vitro, both WT and nrbf2−/- BMDMs were co-cultured with CMFDA-labeled apoptotic thymocytes at a ratio of 1:5 (BMDMs: thymocytes) for 48 h. The medium was collected, the cells were washed with PBS for three times, and the washed PBS was collected. The medium and PBS containing the apoptotic thymocytes were centrifuged at 300 g for 10 min to separate the digested debris. The pellets were resuspended in PBS. Eventually, the fluorescence value was detected with a plate reader (Excitation: 492 nm, emission: 517 nm).
In vivo, thymocytes were initially labeled with PKH26, and these labeled apoptotic thymocytes were injected intravenously into both WT and nrbf2−/- mice. The number of PKH26 events in the spleen, and liver were measured by flow cytometry at the indicated time.
Adoptive transfer of BMDMs
Bone marrow cells from WT and nrbf2−/- mice were cultured in the presence of a 10% L929 conditional medium. Adherent macrophages were harvest after 7 d. 1 × 10⁶ cells (WT or nrbf2−/-) were adoptively transferred via intravenous tail injection into WT or nrbf2−/- mice 1 d prior to 2% DSS treatment. 2% DSS was treated in the first 5 d and followed by 2 d of normal drinking water. Colitis was assessed as described before.
Statistical analysis
The significance of differences between the two groups was determined by Student’s t test, and the differences between multiple groups were determined by ANOVA with Turkey as posthoc tests. Calculations were performed with Prism software. Statistical significance was taken at p < 0.05.
Supplemental Material
Download Zip (87.6 MB)Acknowledgments
We thank Dr. Takeshi Nakamura of Tokyo University of Science, Japan, for the pRaichu-RAB7 probe. We thank Dr. Mistunori Fukuda of Tohoku University, Japan, for the GFP-CCZ1 and GFP-MON1 plasmids.
Disclosure Statement
The authors declare that no conflict of interest exists.
Supplementary material
Supplemental data for this article can be accessed here.
Additional information
Funding
References
- Baumgart DC, Sandborn WJ. Crohn’s disease. Lancet. 2012;380:1590–1605.
- Hampe J, Franke A, Rosenstiel P, et al. A genome-wide association scan of nonsynonymous SNPs identifies a susceptibility variant for Crohn disease in ATG16L1. Nat Genet. 2007;39:207.
- Hugot J-P, Chamaillard M, Zouali H, et al. Association of NOD2 leucine-rich repeat variants with susceptibility to Crohn’s disease. Nature. 2001;411:599.
- Barrett JC, Hansoul S, Nicolae DL, et al. Genome-wide association defines more than 30 distinct susceptibility loci for Crohn’s disease. Nat Genet. 2008;40:955.
- Parkes M, Barrett JC, Prescott NJ, et al. Sequence variants in the autophagy gene IRGM and multiple other replicating loci contribute to Crohn’s disease susceptibility. Nat Genet. 2007;39:830.
- Henckaerts L, Cleynen I, Brinar M, et al. Genetic variation in the autophagy gene ULK1 and risk of Crohn’s disease. Inflamm Bowel Dis. 2011;17:1392–1397.
- Cabrera S, Fernández ÁF, Mariño G, et al. ATG4B/autophagin-1 regulates intestinal homeostasis and protects mice from experimental colitis. Autophagy. 2013;9:1188–1200.
- Zhao S, Xia J, Wu X, et al. Deficiency in class III PI3-kinase confers postnatal lethality with IBD-like features in zebrafish. Nat Commun. 2018;9:2639.
- Lu J, He L, Behrends C, et al. NRBF2 regulates autophagy and prevents liver injury by modulating Atg14L-linked phosphatidylinositol-3 kinase III activity. Nat Commun. 2014;5:3920.
- Yang C, Cai CZ, Song JX, et al. NRBF2 is involved in the autophagic degradation process of APP-CTFs in Alzheimer disease models. Autophagy. 2017;13:2028–2040.
- Poon IK, Lucas CD, Rossi AG, et al. Apoptotic cell clearance: basic biology and therapeutic potential. Nat Rev Immunol. 2014;14:166.
- Han CZ, Juncadella IJ, Kinchen JM, et al. Macrophages redirect phagocytosis by non-professional phagocytes and influence inflammation. Nature. 2016;539:570.
- Hanayama R, Tanaka M, Miyasaka K, et al. Autoimmune disease and impaired uptake of apoptotic cells in MFG-E8-deficient mice. Science. 2004;304:1147–1150.
- Scott RS, McMahon EJ, Pop SM, et al. Phagocytosis and clearance of apoptotic cells is mediated by MER. Nature. 2001;411:207.
- Bosurgi L, Cao YG, Cabeza-Cabrerizo M, et al. Macrophage function in tissue repair and remodeling requires IL-4 or IL-13 with apoptotic cells. Science. 2017;356:1072–1076.
- Lee CS, Penberthy KK, Wheeler KM, et al. Boosting apoptotic cell clearance by colonic epithelial cells attenuates inflammation in vivo. Immunity. 2016;44:807–820.
- Cummings RJ, Barbet G, Bongers G, et al. Different tissue phagocytes sample apoptotic cells to direct distinct homeostasis programs. Nature. 2016;539:565.
- Qu X, Zou Z, Sun Q, et al. Autophagy gene-dependent clearance of apoptotic cells during embryonic development. Cell. 2007;128:931–946.
- Zou W, Wang X, Vale R, et al. Autophagy genes promote apoptotic cell corpse clearance. Autophagy. 2012;8:1267–1268.
- Kinchen JM, Doukoumetzidis K, Almendinger J, et al. A pathway for phagosome maturation during engulfment of apoptotic cells. Nat Cell Biol. 2008;10:556.
- Youssef L, Rebbaa A, Pampou S, et al. Transfusion of storage-damaged red blood cells induces ferroptosis in splenic macrophages. Blood. 2017;130(supplement 1):3567.
- Aderem A, Underhill DM. Mechanisms of phagocytosis in macrophages. Annu Rev Immunol. 1999;17:593–623.
- Kinchen JM, Ravichandran KS. Phagosome maturation: going through the acid test. Nat Rev Mol Cell Biol. 2008;9:781.
- Kinchen JM, Ravichandran KS. Identification of two evolutionarily conserved genes regulating processing of engulfed apoptotic cells. Nature. 2010;464:778.
- Nordmann M, Cabrera M, Perz A, et al. The Mon1-Ccz1 complex is the GEF of the late endosomal Rab7 homolog Ypt7. Curr Biol. 2010;20:1654–1659.
- Yasuda S, Morishita S, Fujita A, et al. Mon1–Ccz1 activates Rab7 only on late endosomes and dissociates from the lysosome in mammalian cells. J Cell Sci. 2016;129:329–340.
- Lawrence G, Brown CC, Flood BA, et al. Dynamic association of the PI3P-interacting Mon1-Ccz1 GEF with vacuoles is controlled through its phosphorylation by the type 1 casein kinase Yck3. Mol Biol Cell. 2014;25:1608–1619.
- Oscar MC, Duke G, Oskar L, et al. CX3CR1 regulates intestinal macrophage homeostasis, bacterial translocation, and colitogenic Th17 responses in mice. J Clin Investig. 2011;121:4787–4795.
- Su C, Lewis JD, Goldberg B, et al. A meta-analysis of the placebo rates of remission and response in clinical trials of active ulcerative colitis. Gastroenterology. 2007;132:516–526.
- Young LN, Cho K, Lawrence R, et al. Dynamics and architecture of the NRBF2-containing phosphatidylinositol 3-kinase complex I of autophagy. Proc Natl Acad Sci U S A. 2016;113:8224–8229.
- Arandjelovic S, Ravichandran KS. Phagocytosis of apoptotic cells in homeostasis. Nat Immunol. 2015;16:907.
- Russell RC, Tian Y, Yuan H, et al. ULK1 induces autophagy by phosphorylating Beclin-1 and activating VPS34 lipid kinase. Nat Cell Biol. 2013;15:741.
- Henrique BDS, Raíssa F, Rosana Moreira P, et al. Splenic macrophage subsets and their function during blood-borne infections. Front Immunol. 2015;6:480.
- Hochreiter-Hufford A, Ravichandran KS. Clearing the dead: apoptotic cell sensing, recognition, engulfment, and digestion. Cold Spring Harb Perspect Biol. 2013;5:a008748.
- Wurmser AE, Gary JD, Emr SD. Phosphoinositide 3-kinases and their FYVE domain-containing effectors as regulators of vacuolar/lysosomal membrane trafficking pathways. J Biol Chem. 1999;274:9129–9132.
- Naufer A, Hipolito VE, Ganesan S, et al. pH of endophagosomes controls association of their membranes with Vps34 and PtdIns (3) P levels. J Cell Biol. 2018;217(1):329–346.
- Gillooly DJ, Simonsen A, Stenmark H. Phosphoinositides and phagocytosis. J Cell Biol. 2001;155:15–18.
- Vieira OV, Botelho RJ, Rameh L, et al. Distinct roles of class I and class III phosphatidylinositol 3-kinases in phagosome formation and maturation. J Cell Biol. 2001;155:19–26.
- Kühl AA, Erben U, Kredel LI, et al. Diversity of intestinal macrophages in inflammatory bowel diseases. Front Immunol. 2015;6:613.
- Heinsbroek SE, Gordon S. The role of macrophages in inflammatory bowel diseases. Expert Rev Mol Med. 2009;11:E14.
- Saitoh T, Fujita N, Jang MH, et al. Loss of the autophagy protein Atg16L1 enhances endotoxin-induced IL-1β production. Nature. 2008;456:264.
- Bauer C, Duewell P, Mayer C, et al. Colitis induced in mice with dextran sulfate sodium (DSS) is mediated by the NLRP3 inflammasome. Gut. 2010;59:1192–1199.
- Li B, Alli R, Vogel P, et al. IL-10 modulates DSS-induced colitis through a macrophage–ROS–NO axis. Mucosal Immunol. 2014;7:869.
- Lin Y, Yang X, Yue W, et al. Chemerin aggravates DSS-induced colitis by suppressing M2 macrophage polarization. Cell Mol Immunol. 2014;11:355.
- Smythies LE, Sellers M, Clements RH, et al. Human intestinal macrophages display profound inflammatory anergy despite avid phagocytic and bacteriocidal activity. J Clin Invest. 2005;115:66–75.
- Grainger JR, Konkel JE, Zangerle-Murray T, et al. Macrophages in gastrointestinal homeostasis and inflammation. Pflügers Arch-Eur J Physiol. 2017;469:527–539. .
- Vonderheit A, Helenius A. Rab7 associates with early endosomes to mediate sorting and transport of Semliki forest virus to late endosomes. PLoS Biol. 2005;3:e233.
- Cooper HS, Murthy S, Shah R, et al. Clinicopathologic study of dextran sulfate sodium experimental murine colitis. Lab Invest. 1993;69:238–249.
- Hosoe S, Ogura T, Hayashi S, et al. Induction of tumoricidal macrophages from bone marrow cells of normal mice or mice bearing a colony-stimulating-factor-producing tumor. Cancer Immunol Immunother. 1989;28:116–122.
- Weavers H, Evans IR, Martin P, et al. Corpse engulfment generates a molecular memory that primes the macrophage inflammatory response. Cell. 2016;165:1658–1671.
- Zhu Z, Dumas JJ, Lietzke SE, et al. A helical turn motif in Mss4 is a critical determinant of Rab binding and nucleotide release. Biochemistry. 2001;40:3027–3036.
- Baloh RH, Schmidt RE, Pestronk A, et al. Altered axonal mitochondrial transport in the pathogenesis of Charcot-Marie-Tooth disease from mitofusin 2 mutations. J Neurosci. 2007;27:422–430.