
ABSTRACT
The PIK3C3/VPS34 subunit of the class III phosphatidylinositol 3-kinase (PtdIns3K) complex is a key early player in macroautophagy/autophagy. In this study, we assessed the contribution of PIK3C3 to T cell metabolism and function. We found that Pik3c3-deficient T cells exhibited impaired cellular metabolism, and Pik3c3-deficient CD4+ T cells failed to differentiate into T helper 1 cells. These alterations were associated with reduced levels of active mitochondria upon T cell activation. In addition, conditional Pik3c3-deficient animals failed to mount autoreactive T cell responses and were resistant to experimental autoimmune encephalomyelitis (EAE). Interestingly, the deletion of Pik3c3 had little effect on the capacity of animals to clear tumor metastases. Collectively, our studies have revealed a critical role of PIK3C3 in T cell metabolism and the pathogenicity of these cells during EAE. Our findings also have important implications for the development of immunotherapies to treat multiple sclerosis and other inflammatory diseases by targeting PIK3C3.
Abbreviations: CNS: central nervous system; DC: dendritic cell; DEG: differentially expressed gene; EAE: experimental autoimmune encephalomyelitis; ECAR: extracellular acidification rate; iNKT: invariant natural killer T; LAP: LC3-associated phagocytosis; LLC: Lewis lung carcinoma; MAP1LC3/LC3: microtubule-associated protein 1 light chain 3; MDSC: myeloid-derived suppressor cell; MOG: myelin oligodendrocyte glycoprotein; NK: natural killer; OCR: oxygen consumption rate; PI: propidium iodide; PIK3C3/VPS34: phosphatidylinositol 3-kinase catalytic subunit type 3; RNA-seq: RNA-sequencing; TCR: T cell receptor; TMRE: tetramethylrhodamine ethyl ester perchlorate
Introduction
Macroautophagy (called autophagy hereafter) is an evolutionarily conserved cellular catabolic process that involves the degradation and recycling of cytoplasmic proteins and damaged organelles in the lysosomes [Citation1,Citation2]. The morphological hallmark of autophagy is the formation of a double-membrane-bound autophagosome, which involves multiple steps [Citation3]. Over 30 autophagy-related gene products that were initially identified in yeast, but are largely conserved in higher eukaryotes, orchestrate this degradative process.
Autophagy has emerged as a key player in T cell metabolism [Citation4]. T cell activation markedly increases autophagy levels, as indicated by enhanced MAP1LC3/LC3 (microtubule-associated protein 1 light chain 3) processing, increased numbers of LC3-containing vesicles, and increased LC3 flux [Citation5–7]. Depletion of autophagy genes, either by transferring autophagy-deficient fetal hematopoietic progenitor cells into lethally irradiated wild-type congenic hosts or by conditional knockout of autophagy genes in T cells, severely impacts T cell proliferation and survival [Citation8–13]. Autophagy is also involved in preventing inappropriate T cell responses by modulating BCL10, which is critical for T cell receptor (TCR)-mediated activation of NFKB/NF-κB [Citation14], as well as in controlling memory CD8A/CD8+ T cell generation [Citation15,Citation16].
PIK3C3/VPS34 forms a complex with BECN1/Beclin 1 and is critical for the initiation of autophagy [Citation17]. In addition to participating in autophagosome formation during autophagy, PIK3C3 has also been implicated in other cellular processes, including endocytosis, intracellular vesicular trafficking [Citation18], and LC3-associated phagocytosis (LAP) [Citation19]. We have previously demonstrated that T cell-specific deletion of Pik3c3 causes a profound loss of peripheral T cells, which correlated with enhanced apoptosis and accumulated cellular organelles [Citation12]. pik3c3f/f;Cd4-Cre mice also exhibited a reciprocal increase in the overall percentages of natural killer (NK) cells, γδ T cells, dendritic cells (DCs), and B cells in spleen, liver, and lymph nodes [Citation12]. In the present study, we show that Pik3c3-deficient T cells, which lack autophagy, were in a significant quiescent state, with inhibited oxidative respiration and reduced glycolysis. Pik3c3-deficient CD4+ T cells failed to differentiate into T helper (Th) 1 cells. Furthermore, we found that mice with T cell-specific Pik3c3-deficiency were resistant to experimental autoimmune encephalomyelitis (EAE) but had normal susceptibility to tumor metastasis. Our findings have revealed a critical role for PIK3C3 in T cell metabolism and CD4+ T cell-mediated autoimmune disease.
Results
Deletion of Pik3c3 in T cells reprograms gene expression
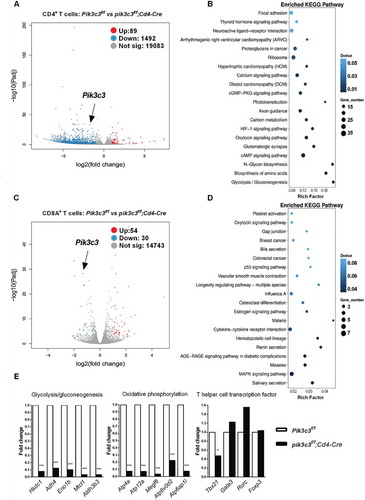
To obtain a better understanding of potential effects of Pik3c3 deletion on T cell function, we generated pik3c3f/f;Cd4-Cre mice, which exhibit a selective Pik3c3 ablation in T cells [Citation12]. Although developing normally, these animals demonstrated severe ongoing inflammation, with elevated serum TNF, IFNG/IFN-γ, CCL2/MCP-1, and IL6 cytokine levels but undetectable IL12 p70 and IL10 levels (Figure S1A). Our previous study has shown that these mice exhibit a partial loss of T cells and a reciprocal increase in the overall percentages of NK cells, γδ T cells, DCs, and B cells in the spleen, liver, and lymph nodes [Citation12]; however, we found no difference in the frequency of myeloid-derived suppressor cells (MDSC) in the spleen (Figure S1B). Next, we investigated the global transcriptomic profiles of FACS-enriched CD4+ and CD8A+ T cells from both Pik3c3f/f and pik3c3f/f;Cd4-Cre mice. RNA sequencing (RNA-seq) analysis revealed significant genome-wide changes in the transcript levels. Pik3c3 deficiency in CD4+ T cells significantly induced (n = 89) or reduced (n = 1492) gene expression, including Pik3c3 (2.73-fold reduction, P = 6.51E-28) (). Subsequent pathway enrichment analysis identified impacted glycolysis/gluconeogenesis, biosynthesis of amino acids, N-glycan biosynthesis, and cAMP signaling pathways in Pik3c3-deficient CD4+ T cells (), indicating altered T cell metabolism in Pik3c3-deficient CD4+ T cells. Pik3c3 deficiency in CD8A+ T cells also induced (n = 54) or reduced (n = 30) gene expression, including Pik3c3 (2.46-fold reduction, P = 5.78E-29) (). However, pathway enrichment analysis did not reveal any evidence of altered cellular metabolism (). Instead, the most significantly impacted pathways were related to salivary secretion, MAPK signaling pathway, and measles, with low rich factor (). Many cellular metabolism-related genes were regulated over 10-fold in CD4+ T (). We also observed decreased expression of the Th1 cell-specific transcription factor, Tbx21, in Pik3c3-deficient CD4+ T cells (). In contrast, no significant differences were observed for the expression of other Th cell transcription factors, such as Gata3, Rorc, and Foxp3 ().
Figure 1. Deletion of Pik3c3 reprograms CD4+ T cell gene expression. (A and C) Volcano plot of RNA-seq gene counts in CD4+ T cells (A) and CD8A+ T cells (C) from Pik3c3f/f and pik3c3f/f;Cd4-Cre mice (n = 2 mice per group). (B and D) Gene set enrichment analysis showing changed pathways in Pik3c3-deficient CD4+ T cells (B) and Pik3c3-deficient CD8A+ T cells (D) derived from hallmark gene sets. (E) Fold-change of RNA-seq gene counts in Pik3c3-deficient compared with Pik3c3-sufficient CD4+ T cells (set as 1) for the induced genes involved in glycolysis/gluconeogenesis, oxidative phosphorylation, and T helper cell differentiation (n = 2 per genotype). *p < 0.05, ***p < 0.001
Deletion of Pik3c3 causes alterations in mitochondrial function and metabolism in activated T cells
We have previously shown that the peripheral T cell loss in pik3c3f/f;Cd4-Cre mice is due to the accumulation of cellular organelles and increased cellular apoptosis at steady-state [Citation12]. Thus, we further examined the role of PIK3C3 in T cell survival during T cell clonal expansion. We stimulated splenocytes from both Pik3c3f/f and pik3c3f/f;Cd4-Cre mice with anti-CD3E and anti-CD28 antibodies, and quantified the percentage of live cells after stimulation using flow cytometry. The percentage of Pik3c3-deficient T cells decreased significantly as compared with Pik3c3-sufficient T cells, which proliferated modestly (). This result suggested that the activation of Pik3c3-deficient T cells through the TCR, in combination with co-stimulation, resulted in massive cell death. As autophagy is necessary to sustain ATP production following activation, we next assessed the consequences of failure to induce autophagy for T cell metabolism. We analyzed mitochondrial respiration and aerobic glycolysis in activated T cells by measuring the changes in oxygen consumption rate (OCR) and extracellular acidification rate (ECAR) using an Extracellular Flux Analyzer. Pik3c3 deficiency dramatically reduced OCR and ECAR in activated CD4+ and CD8A+ T cells (, and S2). This result confirmed the RNA-seq data that genes related to glycolysis and oxidative phosphorylation were downregulated (). Interestingly, the reduction of OCR and ECAR was more dramatic in CD4+ T cells, as compared with CD8A+ T cells.
Figure 2. Altered metabolism in Pik3c3-deficient T cells. (A and B) Flow cytometry analysis of CD3E+ T cells was performed after the splenocytes were stimulated for 72 h with anti-CD3E and anti-CD28 mAbs. A summary of two independent experiments (5–7 mice per group) is shown. (C and D) CD4+ and CD8A+ T cells were purified from spleens of Pik3c3f/f and pik3c3f/f;Cd4-Cre mice and stimulated for 72 h with anti-CD3E and anti-CD28 mAbs. Cells were washed and OCR and ECAR at basal level were determined in response to glucose and different inhibitors, as described in the Materials and Methods section. (C) CD4+ T cell OCR and ECAR. (D) CD8A+ T cell OCR and ECAR. A representative plot of 7 biological replicates in each group from 2 independent experiments is shown. (E and F) Splenocytes were prepared and stained with MitoView Green (100 nM) or TMRE (200 nM) with anti-CD3E, anti-CD4, and anti-CD8A mAbs according to the manufacturer’s protocols after 72 h stimulation with anti-CD3E and anti-CD28 mAbs. Summary of Mitoview and TMRE MFI fold change after anti-CD3E and anti-CD28 mAbs stimulation in CD4+ T cells (E) and CD8A+ T cells (F). Results are from 5–7 mice per group and 2 independent experiments. The data shown are the average ± SEM. *p < 0.05, **p < 0.01, ***p < 0.001
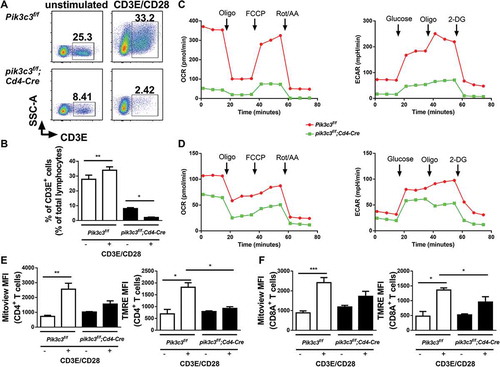
To examine the mechanism of distinct T cell metabolism between Pik3c3f/f and pik3c3f/f;Cd4-Cre mice, we assessed the mitochondrial mass and function in each T cell lineage. Pik3c3-deficient CD4+ and CD8A+ T cells exhibited increased basal Mitoview (mitochondrial membrane dye) staining in comparison to control T cells, indicating the accumulation of mitochondria in the absence of PIK3C3 (). Activation of either CD4+ or CD8A+ T cells resulted in a dramatic increase in Mitoview staining in both Pik3c3f/f and pik3c3f/f;Cd4-Cre mice (). However, Mitoview staining increment in Pik3c3-sufficient CD4+ T cells was more significant, as compared with Pik3c3-deficient CD4+ T cells (Mitoview MFI change: 3.49-fold vs. 1.52-fold). T cell activation resulted in less profound differences in Mitoview staining between Pik3c3-sufficient and -deficient CD8A+ T cells (2.74-fold vs. 1.44-fold). Similar results were found when splenocytes were stimulated with PMA plus ionomycin (Figure S3). We hypothesized that the decrease in metabolism in Pik3c3-deficient T cells could be due to changes in mitochondrial status alongside the mitochondrial load. To test this, we stained cells with tetramethylrhodamine ethyl ester perchlorate (TMRE) and found that stimulation resulted in greater mitochondrial membrane potential in both CD4+ and CD8A+ T cells derived from Pik3c3f/f mice, as compared with pik3c3f/f;Cd4-Cre mice (). Again, the activation-induced increment of TMRE in CD4+ T cells was higher than that in CD8A+ T cells. Collectively, these results indicated that PIK3C3 is required to sustain healthy mitochondrial load increase during T cell activation, particularly in CD4+ T cells.
Deletion of Pik3c3 in T cells inhibits Th1 cell differentiation
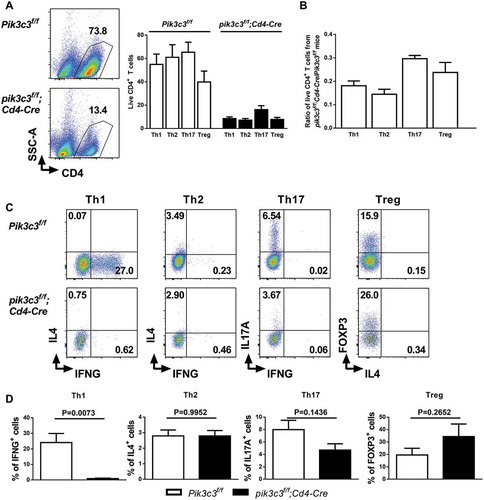
Previous studies have shown that autophagy is differentially regulated in different T helper subsets [Citation9]. Thus, we next evaluated whether Pik3c3-deficiency regulates T helper cell differentiation. We cultured MACS-sorted Pik3c3-sufficient and -deficient CD4+SELL/CD62L+ T cells under Th1, Th2, Th17, and Treg skewing conditions for 96 h and subsequently reactivated the cells with anti-CD3E antibody to evaluate the expression of signature cytokines or transcription factors for each subset. We found that naïve CD4+ T cells cultured under these distinct polarizing conditions were differentially susceptible to cell death upon Pik3c3 deletion. The Pik3c3-deficient T cells cultured under Th1 (about 16% of control levels), Th2 (about 12% of control levels), and Treg (about 21% of control levels) conditions were much more susceptible, whereas cells cultured under Th17 (about 25% of control levels) conditions were relatively less susceptible to cell death than Pik3c3-sufficient CD4+ T cells (). Under Th1 cell conditions, the proportion of IFNG-producing cells remarkably decreased (24.10% vs. 0.92%) in the absence of Pik3c3 (). However, there was no difference in IL4 expression for cells cultured under Th2 conditions, IL17A/IL17 for cells cultured under Th17 conditions, and FOXP3 for cells cultured under Treg conditions (). These data confirmed the unbiased measurements of the transcriptional changes of our RNA-seq studies, indicating decreased Tbx21 expression but no difference in the expression of Gata3, Rorc, and Foxp3 in Pik3c3-deficient CD4+ T cells ().
Figure 3. Deletion of Pik3c3 in T cells inhibits Th1 cell differentiation. (A) Naïve CD4+SELL+ T cells were isolated from the spleens of Pik3c3f/f and pik3c3f/f;Cd4-Cre mice and cultured under Th1, Th2, Th17, or Treg differentiation conditions for 96 h. Cell death was assessed by flow cytometry using forward, and side scatter gating of blasted lymphocytes. (B) The ratio of surviving Pik3c3-deficient CD4+ T cells versus Pik3c3-sufficient CD4+ T cells cultured under different polarizing conditions was calculated and plotted. (C) Intracellular cytokine staining performed to analyze lineage-specific cytokine expression, and representative flow plots are shown. (D) Quantification of cytokine-producing CD4+ T cells. Student’s t-test was performed to compare Pik3c3-sufficient and –deficient T cells cultured in the same conditions. Results are from 4 mice per group and 2 independent experiments. The data shown are the average ± SEM
Pik3c3-deficiency in T cells causes resistance to EAE induction
As Pik3c3-deficient CD4+ T cells undergo drastic apoptosis and exhibit a significant quiescent phenotype upon activation, as well as failure to differentiate into Th1 cells, we postulated that Pik3c3 deletion inhibits the development of autoimmune responses. We employed the EAE model of multiple sclerosis to test whether Pik3c3 deletion in T cells leads to resistance of EAE induction. Results showed that pik3c3f/f;Cd4-Cre mice were completely resistant to EAE, whereas, in the same experiment, all Pik3c3f/f littermates developed signs of EAE (). We considered the possibility that the increased resistance to EAE induction in pik3c3f/f;Cd4-Cre mice may be related to reduced T cell priming. We thus evaluated antigen-specific T cell responses and found that MOG (myelin oligodendrocyte glycoprotein)-specific IFNG+CD4+ T cells were greatly reduced in pik3c3f/f;Cd4-Cre mice (). IL17A+CD4+ T cells were also modestly reduced, although not statistically different (). These data are consistent with our previous data that pik3c3f/f;Cd4-Cre mice display a profound defect in generating ovalbumin-specific IFNG and IL17A responses [Citation12], suggesting defective antigen-specific immune responses in vivo.
Figure 4. Pik3c3-deficiency in T cells causes resistance to EAE induction. (A) Active EAE was induced in the Pik3c3f/f and pik3c3f/f;Cd4-Cre mice. Clinical disease was monitored for 21 d, as described in the Materials and Methods. Representative result of four independent experiments. (B) Splenocytes from Pik3c3f/f and pik3c3f/f;Cd4-Cre mice induced for EAE (day 11) were cultured with MOG peptide (20 µg/ml). After 18 h of culture, the cells were harvested and intracellular staining was performed (IL17A and IFNG), and cytokine-producing CD4+ T cells were analyzed by flow cytometry. Results from three independent experiments were pooled and plotted as the average ± SEM. (C) EAE in rubcn-/- mice. (D) Sub-lethally irradiated mice received 200 nM 4-OH tamoxifen- (closed squares) or vehicle-treated (open circles) cells derived from MOG35-55-immunized pik3c3f/f;Rosa26-CreERT2 mice. Clinical signs were examined daily. (E) Representative brain FACS plots of donor PTPRCb+ cells, CD4+ T cells, and CD8A+ T cells. (F) Total number of donor PTPRCb+ cells, CD4+ T cells, and CD8A+ T cells were enumerated in the brains of recipient animals at 14 d after adoptive transfer of 4-OH tamoxifen- (closed squares) or vehicle-treated (closed circles) cells. A representative experiment of 3 independent experiments is shown. The data shown are the average ± SEM. *p < 0.05, **p < 0.01, ***p < 0.001
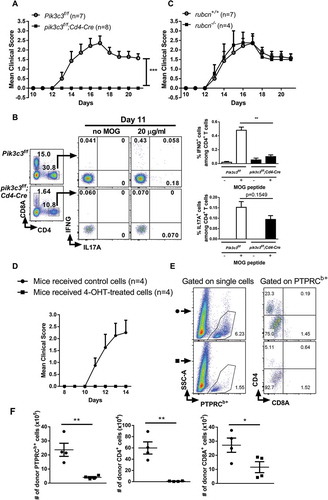
The BECN1-PIK3C3 complex is shared between the canonical autophagy pathway and LAP [Citation19]. The protein RUBCN/RUBICON is critically required for LAP and LC3-associated endocytosis [Citation20] but not canonical autophagy [Citation20,Citation21]. Therefore, to exclude the possibility that Pik3c3 deletion-mediated EAE resistance involves LAP, we examined the ability of rubcn-/- mice to develop EAE. We found that all rubcn-/- mice developed signs of EAE, similar to WT control mice (). These results indicated that the protection against EAE induction in pik3c3f/f;Cd4-Cre mice was most likely not caused by the defective non-canonical autophagy.
To better attribute EAE resistance to Pik3c3-deficiency in T cells, we bred Pik3c3f/f mice with Rosa26-CreERT2 mice to generate pik3c3f/f;Rosa26-CreERT2 mice, in which Pik3c3 can be inducibly deleted. Adoptive transfer of 4-OH tamoxifen-treated ER-Cre+ cells derived from MOG35-55-immunized animals to congenic WT (PTPRCa/CD45.1) animals resulted in the protection from EAE development, whereas in the same experiment, animals receiving vehicle-treated ER-Cre+ cells developed signs of EAE (). We next determined frequencies of the central nervous system (CNS)-infiltrating leukocytes in mice adoptively transferred with 4-OH tamoxifen/vehicle-treated ER-Cre+ cells. Mice that received 4-OH tamoxifen-treated ER-Cre+ cells showed substantially lower proportions of CNS-infiltrating PTPRCb/CD45.2+ cells and CD4+ T cells than mice that received vehicle-treated ER-Cre+ cells (). Together, these data suggested that PIK3C3 has a critical role in both the induction and effector phases of autoimmune responses.
Unaltered susceptibility to tumor metastases
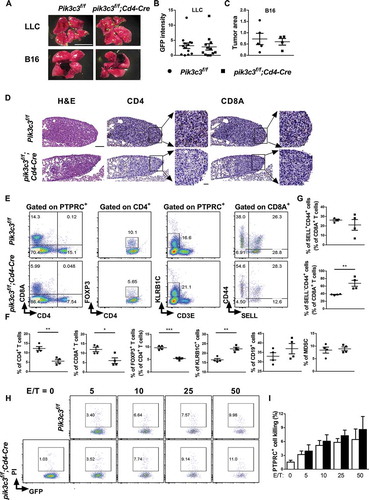
It has been well-documented that autophagy is critically involved in tumor progression [Citation22,Citation23]. To determine the importance of Pik3c3 in tumor metastases, we challenged Pik3c3f/f and pik3c3f/f;Cd4-Cre littermates with i.v. injection of Lewis lung carcinoma (LLC) cells or B16 melanoma cells and monitored the animals for tumor colonization of the lung. Interestingly, Pik3c3f/f mice possessed similar LLC and B16 melanoma tumor burdens compared with pik3c3f/f;Cd4-Cre mice (). To obtain a better understanding of the underlying mechanisms, we analyzed the immune cell populations in tumor colonized lungs. We found a similar total number of cells in the tumor-colonized lungs between Pik3c3f/f and pik3c3f/f;Cd4-Cre mice. Immunohistological analysis of tumors confirmed the reduced frequencies of CD4+ T cells and CD8A+ T cells in pik3c3f/f;Cd4-Cre mice (). Flow cytometric analysis demonstrated the significantly lower frequency of CD4+ T cells, CD8A+ T cells, and Tregs, and unaltered B cells and MDSCs, whereas KLRB1C/NK1.1+ cells were increased in pik3c3f/f;Cd4-Cre mice (). Phenotyping of CD8A+ T cells showed that pik3c3f/f;Cd4-Cre mice had an increased frequency of effector CD44+SELL− T cells (). However, Pik3c3 deficiency did not alter the antitumor cytolytic functions of total PTPRC/CD45+ cells (i.e., hematopoietic cells) against LLC tumor cells (). Overall, these results suggested that the deletion of Pik3c3 in T cells has limited effects on the function of effector cells in clearing tumor metastases.
Figure 5. Unaltered melanoma metastases in mice with a T cell-specific Pik3c3 deletion. Mice were challenged with 2 × 10⁶ luciferase-GFP-expressing Lewis lung carcinoma (LLC) cells or 5 × 10⁵ B16 melanoma cells by tail-vein injection. Tumor-challenged mice (LLC, 2 weeks post-challenge; B16, 4 weeks post-challenge) were sacrificed to quantify the tumor signal intensity or measure the tumor area. (A) Representative images. Scale bar: 10 mm. (B) Tumor (relative) GFP intensity of LLC-challenged mice from three independent experiments were pooled and plotted. (C) Tumor (relative) area of B16-challenged mice. (D-G) Mice challenged with 2 × 10⁶ luciferase-GFP-expressing LLC cells were sacrificed at week 2, and their tumors were collected for histology and immune cell phenotyping. (D) Representative H&E and IHC images of different tumor sites from the same mouse are shown. Scale bar: 100 μm (large panels), 20 μm (magnified panels). (E) Gating strategy and frequencies of CD4+ T cells, CD8A+ T cells, CD4+FOXP3+ Tregs, CD3E− KLRB1C+ NK cells, and CD44 and SELL expression on CD8A+ T cells. (F and G) Summary of the frequency of immune cells, as shown in (E). (H and I) GFP-expressing LLC cells were cocultured with PTPRC+ cells isolated from LLC-challenged Pik3c3f/f and pik3c3f/f;Cd4-Cre mice at an effector-to-target ratio (E/T) of 0:1, 5:1, 10:1, 25:1, and 50:1 for 4 h. The data shown are the average ± SEM. *p < 0.05, **p < 0.01, ***p < 0.001
Discussion
Upon antigenic stimulation, antigen-specific T cells undergo rapid expansion and produce effector proteins, such as cytokines. Quiescent T cells require few nutrients and predominantly employ oxidative phosphorylation for their energy supply, whereas activated T cells consume copious amounts of glucose, amino acids, and fatty acids to construct the molecular building blocks for cellular biosynthesis [Citation24–26]. In support of this, activated T cells show increased glycolytic activity and oxidative phosphorylation to fulfill the increased metabolic needs [Citation27–29]. Interestingly, activated CD4+ T cells are more oxidative and have greater maximal respiratory capacity than activated CD8A+ T cells [Citation30], indicating differential cellular metabolism between activated CD4+ and CD8A+ T cells.
Autophagy has been implicated in regulating T cell activation and differentiation [Citation3,Citation31]. A major role of autophagy in the context of T cell activation and differentiation is to capture first and then degrade cytoplasmic components before feeding them into the cellular metabolic pathways, thus linking autophagy with metabolism. The PtdIns3K PIK3C3 plays a role in endocytosis, intracellular vesicular trafficking, and autophagy – key processes that control T cell function. Here, we analyzed T cell metabolism and differentiation in mice with a T cell-specific Pik3c3 gene ablation. We found that activated T cells from Pik3c3-deficient animals exhibited a decrease in mitochondrial respiration and aerobic glycolysis. This decreased cellular metabolism was associated with lower mitochondrial content and mitochondrial membrane potential when activated through TCR ligation and co-stimulation. Naïve Pik3c3-deficient CD4+ T cells also failed to differentiate into Th1 cells in vitro. It has been previously reported that glycolysis is required for T cell effector functions in the spinal cord of mice with EAE [Citation32]. In concordance with this, our data further suggest that T cells require functional autophagy to accommodate the energetic requirements of activation. Because an autoimmune response to myelin antigens induces EAE, we also assessed antigen-specific T cell priming and found a profound defect in the generation of myelin-specific immune responses in pik3c3f/f;Cd4-Cre mice in vivo. This result is in concordance with our previous study showing that these animals exhibited defective generation of ovalbumin-specific CD4+ T cell-mediated IFNG and IL17A responses [Citation12]. pik3c3 ff;Cd4-Cre mice develop systemic inflammation during the steady-state, which is characterized by pro-inflammatory cytokine production in the serum (Figure S1A) and the development of a wasting syndrome as they age [Citation12]. In the face of this pro-inflammatory phenotype, these animals were resistant to EAE. This apparent discrepancy can be explained by the profound defect of these animals in the generation of antigen-specific CD4+ T cell responses, such as those that are required to induce EAE.
The BECN1-PIK3C3 complex and the subsequent machinery involving ATG5, ATG12, and ATG16L1, are utilized by both canonical and noncanonical autophagy [Citation33]. In our previous study, we demonstrated that the deletion of Pik3c3 in DCs caused profound defects in normal cellular functions in a canonical autophagy-dependent pathway [Citation34]. It is, therefore, reasonable to speculate that the phenotype of Pik3c3-deficient T cells is similarly dependent on the canonical autophagy pathway. To exclude the possibility that the effects of Pik3c3 deletion on EAE involves LAP, we also induced EAE in mice lacking RUBCN, which is critically required for LAP but not for canonical autophagy [Citation21]. rubcn-/- mice expressed normal levels of B cells, T cells, and NK cells in the spleens and the lymph nodes and T cell subsets in the thymus [Citation21]. Our results with rubcn-/- mice suggest that the effects of Pik3c3 depletion on EAE are not caused by defective LAP. Although these results suggest that defective canonical autophagy is the main cause of the observed EAE resistance of Pik3c3-deficient mice, defects in additional cellular processes that involve PIK3C3 may contribute as well.
Immune cell autophagy has been shown to play an important role in EAE induction. Deletion of Becn1 [Citation9] or Atg7 [Citation35] in T cells failed to mount cell-mediated autoimmune responses and to protect mice from MOG-induced EAE. Together with the findings reported here, these data suggest that functional autophagy is critical for proper T cell function during EAE induction. The notion that autophagy is required for EAE development is further supported by other reports that autophagy deficiency in DCs leads to reduced onset and severity of MOG-induced EAE [Citation36] or complete protection from EAE development upon adoptive transfer of primed, encephalitogenic CD4+ T cells [Citation37]. DCs with specific deletion of Atg16l1 were less efficient in priming autoreactive T cells and, as a result, failed to induce autoimmune responses in an adoptive transfer EAE model [Citation38]. Similarly, autophagy-deficiency in myeloid cells resulted in delayed onset [Citation39] or reduced severity [Citation40] of MOG-induced EAE. Among these studies, dramatically reduced OCR and ECAR in activated Atg7-deficient T cells were documented [Citation35]; however, the link between autophagy and DC/myeloid cell metabolism was not addressed in these studies. Treatment with chloroquine, which is an autophagy inhibitor that prevents later stages of lysosomal degradation, markedly reduced EAE symptoms, thus further supporting the notion that autophagy inhibition might be a promising therapeutic approach for the treatment of autoimmune diseases, such as multiple sclerosis.
Our finding that Pik3c3f/f mice possessed similar melanoma tumor burdens compared with pik3c3f/f;Cd4-Cre mice was not unexpected, but the underlying mechanisms remain unclear. Our previous study has shown that although pik3c3f/f;Cd4-Cre mice have reduced peripheral CD8A+ T cells, they also exhibit increased NK cells and reduced Tregs and invariant natural killer T (iNKT) cells [Citation12]. These diverse immune cells communicate with each other to control and shape tumor growth [Citation41]. Therefore, it is likely that Pik3c3 deletion induced dynamic alterations in CD8A+ effector T cells, NK cells, B cells, iNKT cells, and Tregs [Citation12], which, in concert, contributed to the unaltered susceptibility to tumor metastases. This possibility is supported by our findings showing that tumor-infiltrating CD8A+ T cells exhibited higher levels of CD44 expression () despite their reduced frequencies, and tumor-infiltrating lymphocytes were enriched in cells expressing the surface marker KLRB1C (), which is expressed by NK and iNKT cells. Interestingly, a recent study showed that a general loss of autophagy in all tissues shifted the T cells to an effector memory phenotype with enhanced glucose metabolism and resulted in tumor rejection [Citation42]. Discrepancies between their findings and ours might be explained by the different levels of autophagy factor deletion, as autophagy is distinctly required to maintain the proper function of different immune cell types. Published studies have also shown that autophagy is diminished in proliferating CD8A+ effector T cells, and Atg5 or Atg7 deletion in activated T cells had no effect on the proliferation and function of CD8A+ effector T cells. However, some metabolic pathways involved in mitochondrial fatty acid oxidation and oxidative phosphorylation were dysregulated in the absence of Atg7 [Citation16].
In conclusion, our data have revealed a critical role of PIK3C3 in T cell metabolism and function. PIK3C3 in T cells also seems to have a role in the pathogenicity of these cells during EAE in a canonical autophagy-dependent pathway. Our studies, therefore, have implications for the development of effective immunotherapies to treat multiple sclerosis and other autoimmune diseases through targeting PIK3C3.
Materials and methods
Mice
Pik3c3f/f [Citation12,Citation43] and rubcn-/- [Citation21] mice have been described. Cd4-Cre, Rosa26-CreERT2, and PTPRCa+C57BL/6 mice were obtained from The Jackson Laboratory. T cell-specific deletion of Pik3c3 was achieved by crossing the Pik3c3f/f mice with Cd4-Cre transgenic mice. Similarly, pik3c3f/f;Rosa26-CreERT2 were generated by breeding Pik3c3f/f mice with Rosa26-CreERT2 transgenic mice. Six- to 8-week-old animals of both sexes were used in this study. All breeder and experimental mice were housed under specific pathogen-free conditions and all experiments were performed in compliance with guidelines from the Institutional Animal Care and Use Committee at Vanderbilt University.
Preparation of spleen cells
Cells from the spleens were obtained by mashing the organ through a 70-µm cell strainer (Fisher Scientific International, Inc, 22-363-548) into RPMI 1640 medium (Fisher Scientific International, Inc, MT10040CM) supplemented with 5% fetal bovine serum (Sigma-Aldrich Corporation, F2442) followed by erythrocyte lysis with ACK lysing buffer (Lonza bioscience, 10-548E).
T cell activation
Fresh CD4+ and CD8A+ T cells were purified from Pik3c3f/f or pik3c3f/f;Cd4-Cre splenocytes by negative selection using isolation kits as described by the manufacturer (Miltenyi Biotec, 130-104-454 and 130-104-075). Purity of individual populations was typically >96%, as determined by flow cytometry. T cells were activated with plate-bound anti-CD3E (BD Biosciences, 145–2C11) and anti-CD28 (BD Biosciences, 37.51) antibodies in complete RPMI 1640 medium for 3 d and were utilized for metabolic analysis after activation.
Cytokine analysis
Serum levels of IL6, IL10, CCL2/MCP-1, IFNG/IFN-γ, TNF, and IL12 p70 were measured with the Cytometric Bead Array Mouse Inflammation Kit (BD Biosciences, 552364) according to the manufacturer’s instructions. Samples were acquired on a Canto II flow cytometer. Data were analyzed using FACP array version 3.0 (BD Biosciences) software.
Seahorse assay
Experiments were performed in the Vanderbilt High-throughput Screening Core Facility. Metabolic analysis was carried out using an Extracellular Flux Analyzer XFe96 (Seahorse Bioscience). Spleen CD4+ and CD8A+ T cells were isolated using CD4+ and CD8A+ T cell isolation kits (purity >95%) according to the manufacturer’s protocols. Briefly, 5 × 10⁵ activated CD4+ and CD8A+ T cells/well were transferred to a CellTak (Corning)-coated analysis plate (Seahorse Bioscience, 101085–004) and the plate was centrifuged at 400 g, 5 mins to accumulate cells at the bottom. The plate was incubated in a CO2-free incubator at 37°C for 1 h and later transferred to the Seahorse machine for metabolic analysis. Glycolysis and mitochondrial stress were measured via ECAR (mpH/min) and OCR (pmoles/min), respectively, with the use of real-time injections. For glycolysis, cells were resuspended in XF assay medium supplemented with 1 mM glutamine (pH = 7.4; Sigma-Aldrich Corporation, G7513-100 ML) with use of injections of glucose (10 mM; Fisher Scientific International, Inc, D16-500), oligomycin (1 µM; Sigma-Aldrich Corporation, 75351–5MG) and 2-deoxy-D-glucose (2-DG,100 mM; Sigma-Aldrich Corporation, D8375-5G). For mitochondrial stress, cells were resuspended in XF assay medium supplemented with 10 mM glucose, 1 mM sodium pyruvate (Fisher Scientific International, Inc, 11360070), and 1 mM glutamine (pH 7.4). During OCR analysis, cells were treated with oligomycin (1 µM), carbonyl cyanide-4-(trifluoromethoxy) phenylhydrazone (FCCP; 10 µM; Sigma-Aldrich Corporation, C2920-10 MG) and rotenone and antimycin (both 5 µM; Sigma-Aldrich Corporation, R8875 and A8674). OCR and ECAR values were calculated using the program provided by the manufacturer and the data file was exported as a GraphPad Prism file.
Gene expression profiling
Fresh CD4+ and CD8A+ T cells were sorted from the spleen samples using a BD FACSAria III cell sorter at Vanderbilt Technologies for Advanced Genomics. Sorted cells were pelleted and lysed with RNA lysis buffer from Quick-RNATM MiniPrep (ZYMO Research, Irvine, CA) to extract RNA. RNA quantity and purity were measured with an Agilent 2100 bioanalyzer (Agilent Technologies, Palo Alto, CA). Total RNA was isolated from biological replicates and provided to the Beijing Genomics Institute for library construction and sequencing following standard protocols. The library products were sequenced using a BGISEQ-500. Briefly, poly-A tailed RNA was purified using paramagnetic oligo-dT beads from 1 µg of total RNA. The purified mRNA was chemically fragmented and reverse transcribed to double-strand cDNA using random primers. The adapter-ligated DNA library was amplified and sequenced. Standard bioinformatic analysis was performed by the Beijing Genomics Institute. Briefly, gene expression levels were quantified using RSEM after reads cleaning and genome mapping. Differentially expressed genes (DEGs) were detected with DEseq2, which is based on the negative binomial distribution. DEGs were classified according to official classification with the KEGG annotation result. Pathway enrichment analysis was performed using phyper, a function of R. The raw sequence data have been submitted to the Sequence Read Archive under SRA accession: PRJNA552991.
T cell differentiation
Naive CD4+ T cells were isolated from mouse splenocytes using a CD4+SELL+ T cell isolation kit (Miltenyi Biotec, 130-104-453, purity >95%) according to the manufacturer’s protocols. Purified naïve CD4 T cells were activated by plate-bound anti-CD3E (BD Biosciences, 145-2C11; 1 µg/mL for Th1, Th2, and Treg conditions; 2 µg/mL for Th17 conditions) and anti-CD28 (BD Biosciences, 37.51; 1 µg/mL for all conditions) antibodies and differentiated by exposure to the following cytokines or antibodies for 4-5 d: IL12B (15 ng/mL; Peprotech, 210-12), IL2 (30 U/mL; Peprotech, 200-02), and anti-IL4 antibody (5 µg/mL; BD Biosciences, 11B11) for Th1 conditions; IL4 (10 ng/mL; Peprotech, 214-14), IL2 (30 U/mL), anti-CD3E (2 µg/mL) and anti-IFNG antibody (5 µg/mL; BD Biosciences, XMG1.2) for Th2 conditions; TGFB (15 ng/mL; Peprotech, 100-21 C), IL2 (30 U/mL), anti-IL4 antibody (5 µg/mL) and anti-IFNG antibody (5 µg/mL) for Treg conditions; and IL6 (20 ng/mL; Peprotech, 216-16), TGFB (3 ng/mL), anti-IL4 antibody (5 µg/mL) and anti-IFNG antibody (5 µg/mL) for Th17 conditions.
Induction and evaluation of active EAE
Six- to eight-week-old mice were used for EAE induction by s.c. injection of 200 µl of 1 mg/ml MOG35-55 (MEVGWYRSPFSRVVHLYRNGK) peptide (Biomatik) emulsified in Freund’s complete adjuvant (2 mg/ml Mycobacterium tuberculosis extract H37Ra in incomplete Freund’s adjuvant [BD bioscience, 263910]). At immunization and 48 h later, all mice received 400 ng of pertussis toxin (Calbiochem, 516560) by i.p. injection. Mice were monitored for clinical signs of EAE, scored as follows: 0, no clinical signs; 0.5, partially limp tail; 1, paralyzed tail; 1.5, paralyzed tail and hind leg inhibition; 2, loss in coordinated movement, hind limb paresis; 2.5, one hind limb paralyzed; 3; both hind limbs paralyzed; 3.5, hind limbs paralyzed, weakness in forelimbs; 4, forelimbs paralyzed; 5, moribund.
Induction of adoptive transfer EAE
For the induction of adoptively transferred EAE, Pik3c3f/f mice were bred with Rosa26-Cre-ERT2 mice to generate pik3c3f/f;Rosa26-CreERT2 mice, in which Pik3c3 can be inducibly deleted. pik3c3f/f;Rosa26-CreERT2 mice were used as donor mice. Active EAE was induced in pik3c3f/f;Rosa26-CreERT2 mice, as described above. On day 10, the spleens were harvested, and single-cell suspensions were prepared. The cells were stimulated with 50 µg/ml MOG35-55 and treated with 200 nM 4-OH tamoxifen (Sigma-Aldrich Corporation, SML1666-1 ML) or its vehicle at 1 × 10⁷ cells/ml in 10 ml RPMI 1640 complete medium in a 25 cm2 flask. After 72 h, cells were harvested and resuspended in PBS (Corning Cellgro, 21-031-CV) (1 x10⁸ cells/ml) for adoptive transfer. We used PTPRCa+ mice as recipients. Recipient mice (8–10 weeks of age) were irradiated sublethally at 400 rads to generate a lymphopenic environment 6 h prior to injection of MOG35-55-specific T cells. Cells were injected i.p. (300 µl/mouse). The clinical scores were graded similarly to active EAE.
Tail vein-lung metastasis tumor models
Mice were challenged with 2 × 10⁶ luciferase-GFP-expressing LLC cells or 5 × 10⁵ B16 melanoma cells by tail-vein injection, to induce experimental lung metastasis. The tumors were monitored by luciferase (Sigma-Aldrich Corporation, L9420-1 MG)-based noninvasive bioluminescence imaging (Caliper Life Sciences). Two or 4 weeks after challenge, LLC- or B16-challenged mice were sacrificed, lungs were removed, and fluorescence imaging was carried out using fluorescence microscopy. GFP fluorescence intensities in lung tissues were analyzed using ImageJ/FIJI software (https://imagej.net/Fiji).
Histology and immunohistochemistry
Lung tissues from LLC-challenged mice were fixed in 10% formalin overnight at 4°C. Fixed tissues were flattened, dehydrated, and embedded. Serial sections of 5 µm thickness were used for H&E staining and immunostaining. For the latter, we followed a protocol of immunohistochemistry as described using the Vectastain ABC Kit (Vector Laboratories, PK-7200) [Citation44]. Tissues were stained with anti-CD4 and anti-CD8A antibodies. Stained tissues were cover-slipped and scanned using a Leica SCN400 Slide Scanner.
Tumor cell killing assay
PTPRC+ cells from the lung were isolated from LLC-challenged Pik3c3f/f or pik3c3f/f;Cd4-Cre mice. GFP-expressing LLC cells were cocultured with lung PTPRC+ cells at an effector-to-target ratio (E/T) of 0:1, 5:1, 10:1, 25:1, and 50:1 for 4 h. Then, 0.1 µg of propidium iodide (PI, Sigma-Aldrich Corporation, P4170-1G) was added to each sample, and the samples were immediately analyzed by flow cytometry. Tumor cell killing was calculated as (%): GFP+PI+ cells/total GFP+ cells x 100%.
Flow cytometry
In all experiments, dead cells were excluded from the analysis by electronic gating. Fluorescently labeled mAbs against mouse CD3E, CD4, CD8A, ITGAM/CD11b, CD19, CD44, PTPRC, PTPRCa, PTPRCb, SELL, GSR/Gr-1, KLRB1C, IL4, IFNG, IL17A, FOXP3, and appropriate isotype controls were obtained from BD Biosciences. FOXP3 staining sets were obtained from eBioscience (00-5521-00). For measuring IL4, IFNG, IL17A, and FOXP3 expression in the Th cell subsets, cells were harvested at day 4 and further reactivated with 1 µg/mL anti-CD3E antibody for 5 h in the presence of GolgiStop (BD Biosciences, 554724). For measuring MOG-specific IFNG and IL17A production during EAE, splenocytes from Pik3c3f/f and pik3c3f/f;Cd4-Cre mice induced for EAE (day 11) were cultured with MOG peptide (20 µg/ml) for 18 h in the presence of GolgiStop. For measurement of the mitochondrial content or mitochondrial membrane potential in T cells by flow cytometry, splenocytes were prepared and stained with MitoView Green (100 nM, Biotium, 70054-T) or TMRE (200 nM, Biotium, 115532-52-0) with anti-CD3E, anti-CD4, and anti-CD8A mAbs according to the manufacturer’s protocols. For flow cytometric analysis of tumors and brains, left lung lobes and whole brains were excised and incubated for 1 h at 37°C in RPMI medium containing 0.1 mg/ml DNase I (Sigma-Aldrich Corporation, 453682001) and 0.2 mg/ml Collagenase type I (Worthington Biochemical Corporation, LS004196). After incubation, tissues were mechanically disrupted, and cells were passed through a 70 µM strainer, followed by lysis of red blood cells and staining with fluorescently labeled mAbs. Flow cytometric analyses were performed using a Canto II flow cytometer (BD Biosciences). The acquired data were analyzed using FlowJo software (Version 10.0.7, Treestar, Palo Alto, CA).
Statistical analysis
Statistical analysis was performed with GraphPad Prism 6.0 (GraphPad Software). Throughout the manuscript, the distribution of data points is expressed as average ± SEM. Normally distributed data were analyzed by Student’s t-test, and non-parametric comparisons were performed by the Mann-Whitney U test. A paired t-test was used for comparison between matched pairs (Mitoview and TMRE MFI, before and after CD3E/CD28 stimulation). For EAE data, clinical scores were compared by ANOVA. p < 0.05 was considered significant.
Supplemental Material
Download MS Word (464.1 KB)Disclosure statement
The authors declare that the research was conducted in the absence of any commercial or financial relationship that could be construed as a potential conflict of interest.
Supplemental material
Supplemental data for this article can be accessed here.
Additional information
Funding
References
- Mizushima N, Yoshimori T, Ohsumi Y. The role of Atg proteins in autophagosome formation. Annu Rev Cell Dev Biol. 2011;27:107–132.
- Ktistakis NT, Tooze SA. Digesting the expanding mechanisms of autophagy. Trends Cell Biol. 2016;26(8):624–635.
- Yang G, Driver JP, Van Kaer L. The role of autophagy in iNKT cell development. Front Immunol. 2018;9:2653.
- Dowling SD, Macian F. Autophagy and T cell metabolism. Cancer Lett. 2018;419:20–26.
- Botbol Y, Patel B, Macian F. Common gamma-chain cytokine signaling is required for macroautophagy induction during CD4+ T-cell activation. Autophagy. 2015;11(10):1864–1877.
- Li C, Capan E, Zhao Y, et al. Autophagy is induced in CD4+ T cells and important for the growth factor-withdrawal cell death. J Immunol. 2006;177(8):5163–5168.
- Hubbard VM, Valdor R, Patel B, et al. Macroautophagy regulates energy metabolism during effector T cell activation. J Immunol. 2010;185(12):7349–7357.
- Pua HH, Dzhagalov I, Chuck M, et al. A critical role for the autophagy gene Atg5 in T cell survival and proliferation. J Exp Med. 2007;204(1):25–31.
- Kovacs JR, Li C, Yang Q, et al. Autophagy promotes T-cell survival through degradation of proteins of the cell death machinery. Cell Death Differ. 2012;19(1):144–152.
- Pua HH, Guo J, Komatsu M, et al. Autophagy is essential for mitochondrial clearance in mature T lymphocytes. J Immunol. 2009;182(7):4046–4055.
- Willinger T, Flavell RA. Canonical autophagy dependent on the class III phosphoinositide-3 kinase Vps34 is required for naive T-cell homeostasis. Proc Natl Acad Sci U S A. 2012;109(22):8670–8675.
- Parekh VV, Wu L, Boyd KL, et al. Impaired autophagy, defective T cell homeostasis, and a wasting syndrome in mice with a T cell-specific deletion of Vps34. J Immunol. 2013;190(10):5086–5101.
- McLeod IX, Zhou X, Li Q-J, et al. The class III kinase Vps34 promotes T lymphocyte survival through regulating IL-7Ralpha surface expression. J Immunol. 2011;187(10):5051–5061.
- Paul S, Kashyap A, Jia W, et al. Selective autophagy of the adaptor protein Bcl10 modulates T cell receptor activation of NF-kappaB. Immunity. 2012;36(6):947–958.
- Puleston DJ, Zhang H, Powell TJ, et al. Autophagy is a critical regulator of memory CD8+ T cell formation. Elife. 2014;3. DOI:10.7554/eLife.03706.
- Xu X, Araki K, Li S, et al. Autophagy is essential for effector CD8+ T cell survival and memory formation. Nat Immunol. 2014;15(12):1152–1161.
- Axe EL, Walker SA, Manifava M, et al. Autophagosome formation from membrane compartments enriched in phosphatidylinositol 3-phosphate and dynamically connected to the endoplasmic reticulum. J Cell Biol. 2008;182(4):685–701.
- Backer JM. The regulation and function of Class III PI3Ks: novel roles for Vps34. Biochem J. 2008;410(1):1–17.
- Boyle KB, Randow F. Rubicon swaps autophagy for LAP. Nat Cell Biol. 2015;17(7):843–845.
- Heckmann BL, Teubner BJW, Tummers B, et al. LC3-associated endocytosis facilitates beta-amyloid clearance and mitigates neurodegeneration in murine Alzheimer’s disease. Cell. 2019;178(3):536–551.e14.
- Martinez J, Malireddi RKS, Lu Q, et al. Molecular characterization of LC3-associated phagocytosis reveals distinct roles for Rubicon, NOX2 and autophagy proteins. Nat Cell Biol. 2015;17(7):893–906.
- White E. The role for autophagy in cancer. J Clin Invest. 2015;125(1):42–46.
- Levy JMM, Towers CG, Thorburn A. Targeting autophagy in cancer. Nat Rev Cancer. 2017;17(9):528–542.
- Waickman AT, Powell JD. mTOR, metabolism, and the regulation of T-cell differentiation and function. Immunol Rev. 2012;249(1):43–58.
- van der Windt GJ, Pearce EL. Metabolic switching and fuel choice during T-cell differentiation and memory development. Immunol Rev. 2012;249(1):27–42.
- Buck MD, O’Sullivan D, Pearce EL. T cell metabolism drives immunity. J Exp Med. 2015;212(9):1345–1360.
- Chang C-H, Curtis J, Maggi L, et al. Posttranscriptional control of T cell effector function by aerobic glycolysis. Cell. 2013;153(6):1239–1251.
- Kolev M, Dimeloe S, Le Friec G, et al. Complement regulates nutrient influx and metabolic reprogramming during Th1 cell responses. Immunity. 2015;42(6):1033–1047.
- Sena LA, Li S, Jairaman A, et al. Mitochondria are required for antigen-specific T cell activation through reactive oxygen species signaling. Immunity. 2013;38(2):225–236.
- Cao Y, Rathmell JC, Macintyre AN. Metabolic reprogramming towards aerobic glycolysis correlates with greater proliferative ability and resistance to metabolic inhibition in CD8 versus CD4 T cells. PLoS One. 2014;9(8):e104104.
- Riffelmacher T, Richter FC, Simon AK. Autophagy dictates metabolism and differentiation of inflammatory immune cells. Autophagy. 2018;14(2):199–206.
- Seki SM, Stevenson M, Rosen AM, et al. Lineage-specific metabolic properties and vulnerabilities of T cells in the demyelinating central nervous system. J Immunol. 2017;198(12):4607–4617.
- Mehta P, Henault J, Kolbeck R, et al. Noncanonical autophagy: one small step for LC3, one giant leap for immunity. Curr Opin Immunol. 2014;26:69–75.
- Parekh VV, Pabbisetty SK, Wu L, et al. Autophagy-related protein Vps34 controls the homeostasis and function of antigen cross-presenting CD8α + dendritic cells. Proc Natl Acad Sci U S A. 2017;114(31):E6371–E6380. E6371-E6380. .
- Mocholi E, Dowling SD, Botbol Y, et al. Autophagy is a tolerance-avoidance mechanism that modulates TCR-mediated signaling and cell metabolism to prevent induction of T cell anergy. Cell Rep. 2018;24(5):1136–1150.
- Bhattacharya A, Parillon X, Zeng S, et al. Deficiency of autophagy in dendritic cells protects against experimental autoimmune encephalomyelitis. J Biol Chem. 2014;289(38):26525–26532.
- Keller CW, Sina C, Kotur MB, et al. ATG-dependent phagocytosis in dendritic cells drives myelin-specific CD4+ T cell pathogenicity during CNS inflammation. Proc Natl Acad Sci U S A. 2017;114(52):E11228–E11237.
- Alissafi T, Banos A, Boon L, et al. Tregs restrain dendritic cell autophagy to ameliorate autoimmunity. J Clin Invest. 2017;127(7):2789–2804.
- Kanayama M, Danzaki K, He Y-W, et al. Lung inflammation stalls Th17-cell Th17-cell migration en route to the central nervous system during the development of experimental autoimmune encephalomyelitis. Int Immunol. 2016;28(9):463–469.
- Bhattacharya A, Wei Q, Shin J, et al. Autophagy is required for neutrophil-mediated inflammation. Cell Rep. 2015;12(11):1731–1739.
- Grivennikov SI, Greten FR, Karin M. Immunity, inflammation, and cancer. Cell. 2010;140(6):883–899.
- DeVorkin L, Pavey N, Carleton G, et al. Autophagy regulation of metabolism is required for CD8+ T cell anti-tumor immunity. Cell Rep. 2019;27(2):502–513. e5.
- Jaber N, Dou Z, Chen J-S, et al. Class III PI3K Vps34 plays an essential role in autophagy and in heart and liver function. Proc Natl Acad Sci U S A. 2012;109(6):2003–2008.
- Yang G, Wang H, Kang Y, et al. Grape seed extract improves epithelial structure and suppresses inflammation in ileum of IL-10-deficient mice. Food Funct. 2014;5(10):2558–2563.