
ABSTRACT
1-phenyl 2-thiourea (PTU) is a Tyr (tyrosinase) inhibitor that is extensively used to block pigmentation and improve optical transparency in zebrafish (Danio rerio) embryo. Here, we reported a previously undescribed effect of PTU on macroautophagy/autophagy in zebrafish embryos. Upon 0.003% PTU treatment, aberrant autophagosome and autolysosome formation, accumulation of lysosomes, and elevated autophagic flux were observed in various tissues and organs of zebrafish embryos, such as skin, brain, and muscle. Similar to PTU treatment, autophagic activation and lysosomal accumulation were also observed in the somatic tyr mutant zebrafish embryos, which suggest that Tyr inhibition may contribute to PTU-induced autophagic activation. Furthermore, we demonstrated that autophagy contributes to pigmentation inhibition, but is not essential to the PTU-induced pigmentation inhibition. With the involvement of autophagy in a wide range of physiological and pathological processes and the routine use of PTU in zebrafish research of autophagy-related processes, these observations raise a novel concern in autophagy-related studies using PTU-treated zebrafish embryos.
Abbreviations: 3-MA: 3-methyladenine; Atg: autophagy-related; BSA: bovine serum albumin; CHT: caudal hematopoietic tissue; CQ: chloroquine; GFP: green fluorescent protein; hpf: hour-post-fertilization; Map1lc3/Lc3: microtubule-associated protein 1 light chain 3; NGS: normal goat serum; PtdIns3K: class III phosphatidylinositol 3-kinase; PTU: 1-phenyl 2-thiourea; RFP: red fluorescent protein; Sqstm1: sequestosome 1; tyr: tyrosinase.
Introduction
1-phenyl 2-thiourea (PTU) is an inhibitor of Tyr (tyrosinase), a vital rate-limiting enzyme for melanogenesis, routinely used for the inhibition of pigmentation in zebrafish (Danio rerio), in which zebrafish embryos are treated with 0.003% (w:v) (200 μM) PTU before 24 hour-post-fertilization (hpf) to increase their optical transparency for microscopic imaging [Citation1]. Several molecular and physiological side effects of PTU, including altered hatching and survival rate, thyroid function, neural crest development, eye size, and visual behaviors, were reported over the past decade [Citation2–6]. Most studies still utilize 200 μM PTU to inhibit pigmentation in zebrafish embryos because these side effects are relatively minimal and only affect limited research fields. Nevertheless, the physiological effects of PTU on zebrafish embryo, which potentially interferes with studies using the zebrafish model, warrants further investigations.
Macroautophagy/autophagy refers to “self-eating,” and it is an essential cellular reaction to various physiological and pathological conditions regulating important processes, including intracellular material turnover, cell death, proliferation, development, aging, and tumorigenesis [Citation7]. The loss of vital autophagy-associated genes, such as Atg5 (autophagy related 5), Atg7, and Becn1 (beclin 1, autophagy related), result in tumorigenesis, whereas overexpression of Atg5 extends the lifespan of rodents [Citation8]. Zebrafish models of autophagy, including GFP-Lc3 (microtubule-associated protein 1 light chain 3) and GFP-Gabarap (GABA[A] receptor-associated protein) transgenic zebrafish, as well as autophagy-related gene knockdown or knockout models, were gradually established in the past decade [Citation9,Citation10] for a broad range of physiological and pathological studies, including organogenesis, regeneration, and infection [Citation11–13]. Taking advantage of the optical transparency, live imaging with PTU treatment to suppress pigmentation is conventionally applied to study auto-phagy in vivo with transgenic zebrafish embryos, which cannot be conducted in rodent models.
Previous studies demonstrated that autophagy modulates both melanogenesis and melanosome destruction, particularly in melanocytes [Citation14,Citation15]. The knockdown of LC3, one of the key autophagic proteins, inhibits melanogenesis in melanocytes [Citation16]. Moreover, several melanogenic inhibitors, such as ARP101, resveratrol, and Hinokitiol, block pigmentation via autophagy-dependent pathways in melanocytes [Citation17–19]. While these previous studies mainly focused on how melanogenesis is regulated through autophagy using in vitro melanocyte models, the effects of melanogenic modulators on autophagy remain unclear, particularly at the whole-organism level. Here, we report a previously undescribed induction effect of PTU treatment on autophagy in zebrafish embryos, which should be taken into consideration when applying PTU-treated zebrafish embryos in autophagy-related studies.
Results
1-phenyl 2-thiourea (PUT) induces autophagy in zebrafish embryos
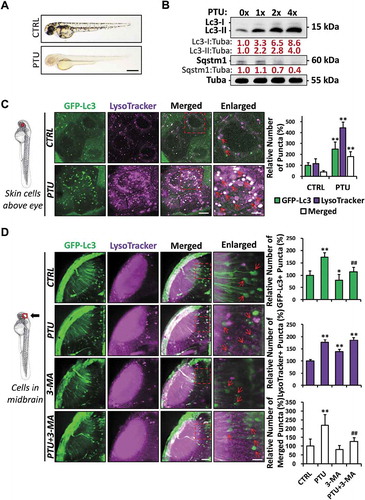
Upon treatment with 0.003% PTU shortly before 24 hpf, optically clear zebrafish embryos were obtained (). To study the autophagic activity in PTU-treated zebrafish embryos, zebrafish embryos were treated with a gradient concentration of PTU from 1X (0.003%), 2X (0.006%), up to 4X (0.012%). Western blot results showed that both Lc3-I and Lc3-II increased significantly under PTU treatments compared to the control in a dose-dependent manner. Sqstm1 (sequestosome 1), as a conventional autophagy marker, also decreased significantly after the 2X and 4X treatment compared to the control (), which indicated the increased Lc3 protein expression, autophagosome, and/or autolysosome formation [Citation20]. We further investigated autophagosome and/or autolysosome formation using Tg(GFP-Lc3) zebrafish embryos stained with LysoTracker Red, a fluorescent probe labeling lysosome and autolysosome after autophagosome-lysosome fusion. Consistent with western blot results, GFP-Lc3+ (autophagosome and/or autolysosome), LysoTracker+ (lysosome), and GFP-Lc3+ and LysoTracker+ (merged, autolysosome) puncta increased in PTU-treated neurons in a dose-dependent manner (Fig. S1A). Moreover, GFP-Lc3+, LysoTracker+, and GFP-Lc3+ and LysoTracker+ puncta also increased significantly in skin cells, muscle cells, and cells in the caudal hematopoietic tissue (CHT) of the PTU-treated embryos compared with the control ( and S1B). The increased GFP-Lc3+ puncta and GFP-Lc3+ and LysoTracker+ puncta under PTU treatment could be alleviated by 3-methyladenine (3-MA) treatment (), an inhibitor of autophagosome formation via the blockage of the class III phosphatidylinositol 3-kinase (PtdIns3K), suggested that PTU activated autophagy by targeting upstream of the PtdIns3K. Collectively, 0.003% PTU treatment, shortly before 24 hpf, induced autophagic activation characterized by the increase in autophagosome, lysosome, and autolysosome in various tissues of the zebrafish embryos. Similar autophagic activation was also observed in zebrafish embryos treated with 0.003% PTU at 48 hpf after pigment formation (data not shown).
Figure 1. 1-phenyl-2-thiourea (PTU) induces aberrant autophagosome and autolysosome formation in zebrafish embryos. (A) Representative bright-field images showing the pigmentation of 2 days-post-fertilization (dpf) zebrafish embryo treated with E3 (Control, CTRL) and 0.003% (200 μM or 1X) PTU in E3 from around 1 dpf. Scale bar: 0.5 mm; (B) Western blot results showing the dose-dependent accumulation of Lc3-I, Lc3-II, and the degradation of Sqstm1/p62 proteins in various doses of PTU-treated zebrafish embryos compared with CTRL. Mean relative ratio of Lc3-I:Tuba (tubulin, alpha), Lc3-II:Tuba, and Sqstm1:Tuba were presented under the bands. 50 embryos were collected per group for three independent experiments. One-way ANOVA was applied and significant increase (p < 0.05) in Lc3-I:Tuba and Lc3-II: Tuba was detected under PTU treatments compared with control in a dose-dependent manner, while significant decrease (p < 0.05) was found in Sqstm1:Tuba in 2X and 4X-treatment compared with CTRL. (C) Schematic diagram showing the position (periderm or basal epidermal cells above the eye) of imaging. Representative images from nine Tg(GFP-Lc3) zebrafish embryos treated with PTU and stained with LysoTracker from three independent experiments were shown. Three independent areas were selected from individual animals, and the relative number of GFP-Lc3+, LysoTracker+, and Merged (GFP-Lc3+ and LysoTracker+) puncta per cell was quantified. Red arrowhead, GFP-Lc3+ and LysoTracker+ puncta. **, p < 0.01 compared with CTRL. Scale bar: 10 μm (Merged), 5 μm (Enlarged). (D) Schematic diagram showing the position (cells in the midbrain) of imaging. The relative number of GFP-Lc3+, LysoTracker+, and Merged (GFP-Lc3+ and LysoTracker+) puncta per cell in neurons of midbrain was counted based on Z-Stack (10 layers out of 100 layers) image. Representative images of nine Tg(GFP-Lc3) zebrafish embryos treated with PTU and/or 3-MA and stained with LysoTracker from three independent experiments were shown. Red arrowhead, GFP-Lc3+ and/or LysoTracker+ puncta. *, p < 0.05, **, p < 0.01 compared with CTRL; ##, p < 0.01 compared with PTU. Scale bar: 40 μm (Merged), 6 μm (Enlarged)
1-phenyl 2-thiourea (PTU) increases autophagic flux in zebrafish embryos
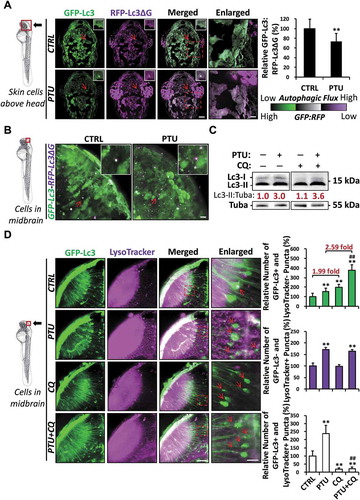
We next investigated if PTU treatment accelerates autophagic flux using the GFP-Lc3-red fluorescent protein (RFP)-Lc3ΔG probe. GFP-Lc3 in the probe will be degraded by autophagy, while RFP-Lc3ΔG remained as internal control, and therefore, GFP to RFP fluorescent signal ratio will represent the rate of autophagic flux [Citation21]. In PTU-treated embryos, GFP to RFP signal ratio decreased significantly in the skin (). At higher magnification, an increased number of GFP-Lc3− and RFP-Lc3ΔG+, and GFP-Lc3+ and RFP-Lc3ΔG+ puncta were observed in midbrain cells ( and S1C), indicating the increase of autophagic flux after PTU treatment. Chloroquine (CQ) was also applied to block the fusion of the autophagosome with the lysosome and subsequent degradation. While CQ treatment alone did not alter Lc3-II:Tuba ratio compared with control as shown by western blot, PTU and CQ co-treatment significantly increased the ratio compared with PTU treatment alone (). The relative number of GFP-Lc3+ and LysoTracker− puncta (autophagosome) also increased significantly in neurons in the midbrain of Tg(GFP-Lc3) zebrafish embryos in CQ+PTU co-treatment (379%) and CQ treatment alone (199%) compared with PTU (153%) and control (100%), respectively (). The significantly higher fold-increase in autophagosome after CQ co-treatment in PTU-treated embryos (2.59-fold) compared with control (1.99-fold) further demonstrated that PTU treatment elevated autophagic flux. As expected, the number of GFP-Lc3+ and LysoTracker+ puncta (autolysosome) declined significantly, and the number of GFP-Lc3− and LysoTracker+ puncta (lysosome) remained unchanged in both control and PTU-treated embryos after CQ treatment ().
Figure 2. PTU elevates autophagic flux in zebrafish embryos. (A) Schematic diagram showing the position (dorsal view of skin on the head) of imaging. Autophagic flux was detected by using GFP-Lc3-RFP-Lc3ΔG probe. The ratio of GFP-Lc3:RFP-Lc3ΔG was calculated based on the mean fluorescent intensity in the selected area. Representative images of nine zebrafish embryos from three independent experiments were shown. Red arrowhead, GFP-Lc3+ and RFP-Lc3ΔG+ puncta. **, p < 0.01 compared with control (CTRL). Scale bar: 100 μm. (B) Schematic diagram showing the position (midbrain) of imaging. GFP-Lc3 and RFP-Lc3ΔG co-localized puncta were detected in the midbrain of 24 hpf embryo treated with PTU from 6 hpf. Red arrowhead, GFP-Lc3+ and/or RFP-Lc3ΔG+ puncta. Scale bar: 100 μm. Representative images of nine zebrafish embryos from three independent experiments were shown. (C) Western blot results showing the level of Lc3-I and Lc3-II proteins in CTRL and PTU groups treated with chloroquine (CQ). Mean relative ratio of Lc3-II:Tuba was presented under the bands. 50 embryos were collected per group for three independent experiments. Two-way ANOVA with Tukey post hoc was applied and significant increase (p < 0.05) in Lc3-II:Tuba was detected between PTU and PTU+CQ but not CTRL and CTRL+CQ. (D) Schematic diagram showing the position (cells in the midbrain) of imaging. The relative number of GFP-Lc3+ and LysoTracker−, GFP-Lc3− and LysoTracker+, and GFP-Lc3+ and LysoTracker+ puncta per cell in neurons of midbrain was counted based on Z-Stack (10 layers out of 100 layers) images. Representative images of nine Tg(GFP-Lc3) zebrafish embryos stained with LysoTracker treated with PTU and/or CQ from three independent experiments were shown. Red arrowhead, GFP-Lc3+ and/or LysoTracker+ puncta. **, p < 0.01 compared with CTRL; ##, p < 0.01 compared with PTU. Scale bar: 40 μm and 3 μm (Enlarged)
Genetic targeting of Tyr also induces autophagy in zebrafish embryos
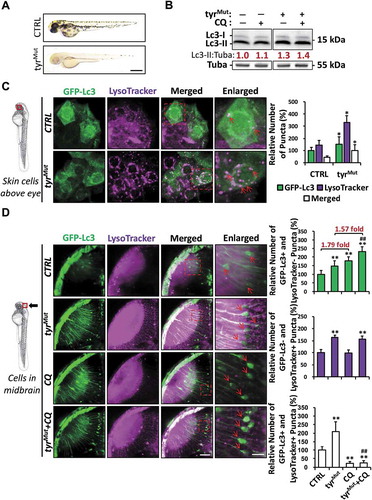
Tyr, the vital regulatory enzyme underlying PTU-induced anti-melanogenesis, was expressed not only in melanocytes but also in various organs and tissues of zebrafish embryos, such as the skin, the eye, the brain, the muscle, and the CHT; however, the expression levels declined after PTU treatment (Fig. S2A and B). To determine whether Tyr inhibition is the mechanism underlying PTU-induced autophagy, we targeted tyr (tyrosinase) in zebrafish embryos using clustered regularly interspaced short palindromic repeats (CRISPR)-Cas9, as described previously [Citation22]. Optically clear tyr gRNA-injected (F0) zebrafish embryos (referred herein as tyrMut) were generated by injecting tyr gRNA together with Cas9 protein (). Western blot result showed that the Lc3-II:Tuba ratio increased significantly in tyrMut compared with the control (). A similar elevated expression of Lc3 protein was also observed in the commonly used transparent mutant lines, Casper (mpv17/roya9; mitfaw2) and Absolute (ednrbab140; mitfab692) zebrafish embryos (Fig. S2C and D). The number of GFP-Lc3+, LysoTracker+, and GFP-Lc3+ and LysoTracker+ puncta in the skin cells and neurons of Tg(GFP-Lc3) embryo co-stained with LysoTracker increased significantly in the tyrMut compared with the control, which suggested that tyr mutation elicited the formation of autophagosomes, lysosomes, and autolysosomes ( and D)). We further examined the autophagy activities in the tyrMut with autophagy inhibitors. 3-MA treatment significantly decreased the number of GFP-Lc3+ puncta in the tyrMut neurons (Fig. S3), which demonstrated that tyr mutation also activates autophagy upstream of PtdIns3K, similar to PTU treatment. In addition, CQ co-treatment also significantly increased the number of GFP-Lc3+ and LysoTracker− puncta, while the co-treatment decreased the number of GFP-Lc3+ and LysoTracker+ puncta (). However, no significant change was observed in the fold-increase of GFP-Lc3+ and LysoTracker− puncta after CQ co-treatment in the tyrMut (1.57-fold) compared with the control (1.79-fold). These results indicated that autophagy flux was not elevated in the tyrMut, which was also supported by the western blot results showing that the CQ treatment-induced increase in Lc3-II:Tuba ratio was similar in the tyrMut compared with the control (). While the discrepancies observed between PTU-treated embryos and the tyrMut might be due to the incomplete and mosaic tyr targeting in the somatic tyrMut, genetic inhibition of tyr did recapitulate the PTU-induced increase in autophagosome and autolysosome formation in zebrafish embryos. Also, PTU co-treatment failed to elicit a higher level of autophagy activation in the tyrMut (Fig. S3), suggesting that PTU-induced autophagy activity was likely specific to Tyr-inhibition.
Figure 3. Aberrant autophagosome and autolysosome formation in tyrMut zebrafish embryos. (A) Representative bright-field images showing the pigmentation of 2 dpf zebrafish embryo injected with tyr gRNA+Cas9 protein (tyrMut) and their sibling control (CTRL). Scale bar: 0.5 mm. (B) Western blot results showing the level of Lc3-I and Lc3-II proteins in CTRL and tyrMut groups treated with chloroquine (CQ). Mean relative ratio of Lc3-II:Tuba was presented under the bands. 50 embryos were collected per group for three independent experiments. Two-way ANOVA with Tukey post hoc was applied, and a significant increase (p < 0.05) of Lc3-I and Lc3-II were detected in tyrMut compared with CTRL while no significant differences (p > 0.05) in Lc3-II:Tuba were detected between tyrMut treated with CQ and tyrMut. (C) Schematic diagram showing the position (periderm or basal epidermal cells above the eye) of imaging. Representative images of nine tyrMut Tg(GFP-Lc3) zebrafish embryos stained with LysoTracker from three independent experiments were shown. Three independent areas were selected from individual animals, and the relative number of GFP-Lc3+, LysoTracker+ and Merged (GFP-Lc3+ and LysoTracker+) puncta per cell were quantified. Red arrowhead, GFP-Lc3+ and LysoTracker+ puncta. *, p < 0.05 compared with CTRL. Scale bar: 10 μm (Merged), 5 μm (Enlarged). (D) Schematic diagram showing the position (cells in the midbrain) of imaging. The relative number of GFP-Lc3+ and LysoTracker−, GFP-Lc3− and LysoTracker+, and GFP-Lc3+ and LysoTracker+ puncta per cell in neurons of midbrain were counted based on Z-Stack (10 layers out of 100 layers) images. Representative images of nine tyrMut Tg(GFP-Lc3) zebrafish embryos treated CQ and stained with LysoTracker from three independent experiments were shown. Red arrowhead, GFP-Lc3+ and/or LysoTracker+ puncta. **, p < 0.01 compared with CTRL; ##, p < 0.01 compared with tyrMut. Scale bar: 40 μm (Merged), 3 μm (Enlarged)
Autophagy is not essential to the 1-phenyl 2-thiourea (PTU)-induced anti-melanogenesis
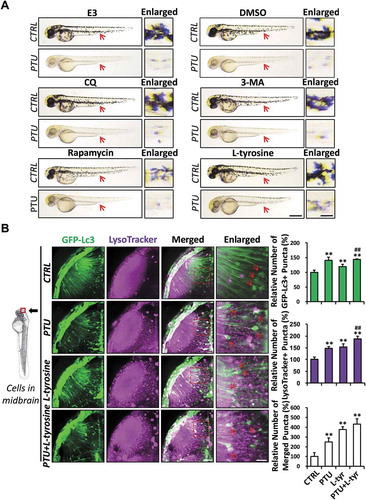
Since PTU is a robust Tyr inhibitor routinely used to block the production of melanin in zebrafish embryos, we subsequently investigated whether inhibition effects of PTU on pigmentation is autophagy-dependent. Whereas autophagy inhibitors (CQ and 3-MA) had no observable effect on pigmentation, rapamycin, a conventional autophagic activator targeting Mtor (mechanistic target of rapamycin kinase), reduced pigmentation in zebrafish embryos with significantly enhanced autophagic activities ( and S3). Furthermore, the blockage of PTU-induced autophagic activity by CQ and 3-MA failed to rescue the pigmentation in zebrafish embryos (, , and ). These results suggested that whereas rapamycin-induced autophagy contributes to pigmentation inhibition, autophagy is not essential to the PTU-induced anti-melanogenesis in zebrafish embryos. Interestingly, L-tyrosine, a key substrate of the melanogenic pathway, could partially restore pigmentation in the PTU-treated zebrafish embryos (). In addition, L-tyrosine treatment did not ameliorate PTU-induced autophagic activity but induced autophagic activity in both control and PTU-treated embryos (). This result suggests that L-tyrosine may participate in PTU-induced autophagy and anti-melanogenesis.
Figure 4. L-tyrosine, but not autophagic modulators, restores melanogenesis in PTU-treated zebrafish embryos. (A) Representative bright-field images showing the pigmentation of 2 dpf zebrafish embryo treated with autophagic modulators, including E3, dimethyl sulfoxide (DMSO), chloroquine (CQ), 3-methyladenine (3-MA), rapamycin and L-tyrosine with or without PTU. Red arrowhead, melanin shown in Enlarged. Scale bar: 0.5 mm. (B) Schematic diagram showing the position (cells in the midbrain) of imaging. The relative number of GFP-Lc3+, LysoTracker+, and Merged (GFP-Lc3+ and LysoTracker+) puncta per cell were counted based on Z-Stack (10 layers out of 100 layers) images. Representative images of nine Tg(GFP-Lc3) zebrafish treated with PTU, L-tyrosine, or PTU+L-tyrosine and stained with LysoTracker prior to imaging from three independent experiments were shown. Red arrowhead, GFP-Lc3+ and/or LysoTracker+ puncta. **, p < 0.01 compared with CTRL; ##, p < 0.01 compared with L-tyrosine. Scale bar: 40 μm (Merged), 6 μm (Enlarged)
Discussion
Zebrafish has emerged rapidly as an in vivo model for multiple physiological and pathological processes, including autophagy and its relevant pathways [Citation23]. An optically clear body during embryonic stages facilitates the visualization of transgenic zebrafish lines labeled with fluorescent proteins under the microscope [Citation10]. To maintain the transparency of zebrafish during embryogenesis, 0.003% PTU treatment has been widely used as a standard strategy of inhibiting pigmentation. Although several side effects of PTU treatment on zebrafish embryos have been shown, these side effects are not sufficient to cease the use of PTU in zebrafish research [Citation2–6].
Here, we first reported that PTU treatment induces dose-dependent aberrant autophagosome, lysosomes, and autolysosomes formation, as well as an elevated autophagic flux in various tissues and organs of zebrafish embryos, indicating that PTU-induced autophagy is not specific to melanocytes or surrounding skin cells. In PTU-treated embryos, both Lc3-I and Lc3-II increased significantly, indicating the concomitant increase in Lc3 expression and conversion of Lc3-I to Lc3-II, which is consistent with previously reported autophagy induction in rapamycin-treated zebrafish embryos [Citation9,Citation24]. We further demonstrated that inhibition of Tyr via genetic manipulation also induces aberrant autophagosomes, lysosomes, and autolysosomes formation. At the same time, PTU co-treatment failed to elicit a higher level of autophagic activation in tyr mutant embryos. Although autophagy flux was not elevated in the tyrMut, which might be due to the incomplete and mosaic targeting of tyr in the somatic tyrMut, PTU-induced autophagy, and the accumulation of lysosomes are likely specific to Tyr inhibition.
TYR, as one of the key enzymes in melanogenesis, has been described to express predominantly in melanocytes, although it is also detected in various tissues and organs of humans and mice [Citation25,Citation26]. In the zebrafish embryo, we showed that Tyr is also expressed in the skin, the brain, as well as the muscle cells, and PTU treatment suppressed Tyr at the protein level. While the function of TYR outside melanocytes remains unknown, these results provide an explanation for the PTU-induced autophagy and lysosome accumulation observed in tissues other than melanocytes and skin. Our findings also demonstrated that autophagy is not essential to PTU-induced anti-melanogenesis effects, though rapamycin-induced autophagy contributes to pigmentation inhibition.
A previous study has reported that PTU treatment inhibits TYR activity and degrades the TYR protein following Golgi maturation in melanocytes [Citation27]. It is possible that autophagy participates in the degradation of nonfunctional TYR but not in the inhibition of TYR. Thus, autophagic inhibitors cannot restore TYR activity and melanogenesis in PTU-treated zebrafish embryos. A recent study revealed that knockdown of LC3 and rapamycin treatment declined and enhanced TYR activity, respectively, demonstrating that autophagy might be essential for the maintenance of the TYR level during melanogenesis [Citation16].
Besides the increased number of autophagosomes and autolysosomes, PTU treatment also pronouncedly increased the number of lysosomes. Because TYR can be mistargeted to the lysosome for degradation [Citation28], extra lysosomal formation might be induced for the non-autophagic removal of TYR under PTU treatment. In addition, TYR catalyzes the oxidation of tyrosine mainly in the lysosomes (or pre-melanosomes) during melanogenesis [Citation29], it is possible that a feedback mechanism also contributes to the accumulation of lysosomes.
In our study, we also found that L-tyrosine treatment partially restored the pigmentation in PTU-treated embryos without ameliorating PTU-induced autophagic activity, and L-tyrosine treatment alone also induced autophagic activity. While L-tyrosine can directly enhance TYR activity [Citation30], which might contribute to the rescue of pigmentation, the corresponding sub-cellular mechanism underlying L-tyrosine-induced autophagy requires further investigation. Autophagy may contribute to the pigmentation through the turnover of TYR substrates (L-tyrosine), or the excess nutrient condition (excess L-tyrosine) induces autophagy through reactive oxygen species (ROS)-mediated endoplasmic reticulum (ER) stress signaling independent of the Mtor pathway [Citation31,Citation32]. While a previous study revealed that autophagy plays an opposite role in melanogenesis in melanocytes and keratinocytes [Citation33], the precise role of autophagy in melanin synthesis and deconstruction, particularly melanosome degradation in non-melanocyte cells, warrants further investigation.
Since autophagy is implicated in a wide range of physiological and pathological processes, including cancer, our observations raise a novel concern in autophagy-related studies using PTU-treated zebrafish embryos. Although previous zebrafish studies mostly compared the control and treated zebrafish embryos undergoing the same PTU treatment, the synergistic or masking effects between PTU and other experimental treatments might still affect the interpretation of autophagy and autophagy-related phenotypes. As one of the most evolutionarily conserved pathways, anti-melanogenesis induced by PTU treatment and genetic modification in melanogenesis-related genes have also been used in other animal models, including rodents and Xenopus [Citation34–36]. Therefore, further research on the potential anti-melanogenesis-induced autophagy in other animal models is also needed.
Various transparent transgenic zebrafish lines, including Casper (mpv17/roya9; mitfaw2) and Absolute (ednrbab140; mitfab692), were reported in recent years to be a substitute for PTU treatment [Citation37]. However, our results demonstrated that genetic targeting of tyr also resulted in the aberrant formation of the autophagosome, lysosome, and autolysosome. Our observation that the Lc3 protein level increased in the homozygous Casper and Absolute mutant embryos suggests that these transparent lines might not represent a better alternative to PTU-treatment. Instead, using a better microscopic system, for example, the Lightsheet Microscope used in this study, in vivo fluorescent imaging on autophagy signal could be performed, and image quality is only minimally affected by pigments using live zebrafish embryos. Nevertheless, these limitations should not obscure the unique advantages of the zebrafish model in autophagy-related research.
Materials and methods
Zebrafish strains and maintenance
Wild-type and transgenic zebrafish strains were maintained under standard conditions (14:10 h light:dark cycle and fed living brine shrimp twice a day). Casper (mpv17/roya9; mitfaw2) and Tg(GFP-Lc3) zebrafish were a generous gift from Dr. S.H. Cheng, City University of Hong Kong, HK and Dr. X. Xu, Mayo Clinic, US, respectively. Absolute (ednrbab140; mitfab692) zebrafish were purchased from the Zebrafish International Resource Center (ZIRC). Zebrafish embryos were collected from natural spawning and raised at 28.5°C. Embryo and larvae were staged by hours post-fertilization (hpf) and morphological criteria previously described [Citation38]. All animal experiments were conducted in accordance with protocols approved by the Committee of the Use of Laboratory and Research Animals (CULATR) of the University of Hong Kong and Animal Subjects Ethics Sub-Committee (ASESC) of The Hong Kong Polytechnic University.
Generation of tyrosinase mutant (tyrMut) fish by CRISPR-Cas9
Tyrosinase (tyr) single guide RNA (sgRNA) was synthesized by cloning a 20-base pair (bp) coding sequence 5ʹ-GGGCCGCAGTATCCTCACTC-3ʹ into the pT7-gRNA vector (Addgene, 46759; Wenbiao Chen Lab), which was subsequently linearized with BamH1-HF (New England Biolabs, R3136) and in vitro transcribed using HiScribe 376 T7 Quick High Yield RNA synthesis kit (New England Biolabs, E2050S) as previously described [Citation22]. Alt-R S.p. Cas9 Nuclease 3NLS (Integrated DNA Technologies, 1074181) diluted in Cas9 working buffer (20 mM HEPES, 150 mM KCl, pH 7.5) was applied in this study. For microinjection, equal volumes of folded tyr sgRNA (100 ng/μL) and Cas9 Nuclease (500 ng/μL) were assembled by incubating at 37°C for 10 min and co-injected into one-cell-stage zebrafish embryos.
Synthesis of the GFP-Lc3-RFP-Lc3ΔG florescent probe
pMRX-IP-GFP-Lc3-RFP-Lc3ΔG (Addgene, 84572; Noboru Mizushima Lab) [Citation21] was digested by BglII (New England Biolabs, R0144) and NotI (New England Biolabs, R3189), GFP-Lc3-RFP-Lc3ΔG then was sub-cloned into BglII and EcoRv (New England Biolabs, R0195) pre-digested pT3TS vector (Addgene, 31830; Stephen Ekker Lab) through Gibson Assembly using ClonExpress Ultra One Step Cloning Kit (Vazyme Biotech, C115) in accordance to the manufacturer’s instructions. GFP-Lc3-RFP-Lc3ΔG mRNA was generated by in vitro transcribed using mMESSAGE mMACHINE™ T3 Transcription Kit (Invitrogen; AM1348) and then polyadenylated with the Poly(A) Tailing Kit (Invitrogen; AM1350). After purification, 500 pg GFP-Lc3-RFP-Lc3ΔG mRNA was injected into the yolk of one-cell-stage zebrafish embryos.
1-phenyl 2-thiourea treatment
Zebrafish embryos were transferred into Petri dishes with 0.003% PTU (Sigma-Aldrich, P7629) in E3 medium (5 mM NaCl, 0.17 mM KCL, 0.33 mM CaCl, and 0.33 mM MgSO4, pH 7.4) shortly before 24 hpf to inhibit pigmentation. For dose-dependent trial, a gradient concentration of PTU was applied, including 0.00% PTU (0X), 0.003% PTU (1X), 0.006% PTU (2X), and 0.012% PTU (4X). In addition, for imaging 24 hpf zebrafish embryo, embryos were transferred into Petri dishes with 0.003% PTU in E3 medium at around 6 hpf.
Autophagic modulators and L-tyrosine treatment
Zebrafish embryos were incubated with 20 μM rapamycin (Selleckchem, S1039), 5 mM 3-methyladenine (Selleckchem, S2767) and 50 μM chloroquine (Selleckchem, S4157) [Citation10], and 5 mM L-tyrosine disodium salt hydrate (Sangon Biotech, A606792) diluted in E3 medium with or without 0.003% PTU from 48 hpf to 96 hpf with solutions refreshed daily.
Western blotting
Dechorionated and deyolked embryos were homogenized in cell lysis buffer (Sigma-Aldrich, C3228). Embryo lysates mixed with 5X sodium dodecyl sulfate (SDS) loading buffer (250 mM Tris-HCl, pH 6.8, 10% sodium dodecyl sulfate [Bio-Rad Laboratories, 1610418], 30% glycerol, 0.02% bromophenol blue [Bio-Rad Laboratories, 1610404], 5% beta-mercaptoethanol [Bio-Rad Laboratories, 1610710]) were boiled at 95°C for 5 min and then resolved on 12% gels (Bio-Rad Laboratories, 1610175) and transferred to the membrane (Merck Millipore, IPVH00010). After blocking with 5% nonfat dried milk (Bio-Rad Laboratories, 1706404) for 2 h at room temperature, membranes were probed with anti-Lc3b (Abcam, ab48394), anti-Sqstm1/p62 (Cell Signaling Technology, 5114) and anti-Tuba (tubulin, alpha; Abcam, ab15246) primary antibodies at 4°C overnight. Afterward, the membrane was washed with Tris-buffered saline (50 mM Tris base, 150 mM NaCl, pH 7.5) plus Tween-20 (Bio-Rad Laboratories, 1610781) (TBST) and incubated with goat anti-rabbit IgG secondary antibody (Invitrogen, 32460) for 2 h at room temperature. Membrane was then washed with TBST and visualized using SuperSignal™ West Femto Maximum Sensitivity Substrate (Thermo Fisher, 34095) following the manufacturer’s instructions.
LysoTracker Red staining
LysoTracker Red DND-99 (Invitrogen, L7528) was diluted in E3 medium to a final concentration at 10 μM. 96 hpf embryos were then transferred into the prewarmed diluted dye and incubated at 28.5°C in the dark for 45 min in accordance with the protocol previously described [Citation39,Citation40]. Subsequently, embryos were rinsed 4 times with 1 ml fresh E3 medium before imaging.
Confocal microscope and lightsheet microscope imaging
Zebrafish embryos were anesthetized using 0.16 mg/ml tricaine (Sigma-Aldrich, A5040), and then mounted in 1.5% low-melting agarose (Sigma-Aldrich, A9045) into 35 mm glass-bottom confocal dish and glass capillary for confocal and lightsheet imaging, respectively. Leica TCS SPE Confocal Microscope was applied to take images with the 10x and 40x objective lenses. Zeiss Lightsheet Z.1 Selective Plane Illumination Microscope (LSFM) was used to image with a 20X objective lens. In addition, morphology and pigmentation of zebrafish embryos were imaged by using the Nikon Stereomicroscope with a Nikon DS-Fi2 Camera.
Quantitative analysis and statistics
Mean fluorescent intensity of specific fluorescence channel imaged using Lightsheet Microscope was measured in the same area of skin above the head by using Zeiss ZEN software to quantify the ratio of GFP-Lc3 to RFP-Lc3ΔG for autophagic flux. The relative number of GFP-Lc3+ (autophagosome and/or autolysosome), GFP-Lc3+ and LysoTracker− (autophagosome), LysoTracker+ puncta (lysosome), and GFP-Lc3+ and LysoTracker+ (Merged, autolysosome) puncta per cell were counted in maximally projected Z-Stack (10 layers out of 100 layers) images of neurons in the midbrain, muscle cells in the trunk, maximally projected Z-Stack (100 layers) of cells in CHT. Puncta were defined by fluorescence signals that occupy more than one pixel that was distinguished from the background signal, as previously described [Citation41]. The total number of puncta in at least ten independent cells were counted for each sample, and the number of puncta per cell was calculated using the total number of puncta divided by the number of cells. ImageJ (NIH) was applied for the quantitation of western blot results. Data are presented as mean ± standard deviation (S.D.). Statistical analyzes were performed where appropriate using Statistical Package for the Social Sciences (SPSS) Version 14.0 and a p-value less than 0.05 was considered statistically significant.
Supplemental Material
Download MS Word (1.8 MB)Acknowledgments
The zebrafish maintenance was supported by Fish Model Translational Research Laboratory (HTI, PolyU) and Faculty Core Facility (LKS Faculty of Medicine, HKU). Imaging was taken in University Research Facility in Life Sciences (ULS, PolyU) with the help from Dr. Michael YF Yuen and Dr. Clara HL Hung.
Disclosure statement
No potential conflicts of interest were disclosed.
Supplementary material
Supplemental data for this article can be accessed here.
Additional information
Funding
References
- Westerfield M. The zebrafish book: a guide for the laboratory use of zebrafish (Danio rerio). Eugene: University of Oregon Press; 2007.
- Karlsson J, von Hofsten J, Olsson PE. Generating transparent zebrafish: a refined method to improve detection of gene expression during embryonic development. Mar Biotechnol (NY). 2001;3(6):522–527. .
- Elsalini OA, Rohr KB. Phenylthiourea disrupts thyroid function in developing zebrafish. Dev Genes Evol. 2003;212(12):593–598.
- Bohnsack BL, Gallina D, Kahana A. Phenothiourea sensitizes zebrafish cranial neural crest and extraocular muscle development to changes in retinoic acid and IGF signaling. PLoS One. 2011;6(8):e22991.
- Li Z, Ptak D, Zhang L, et al. Phenylthiourea specifically reduces zebrafish eye size. PLoS One. 2012;7(6):e40132. .
- Antinucci P, Hindges R. A crystal-clear zebrafish for in vivo imaging. Sci Rep. 2016;6(1):29490.
- Levine B, Kroemer G. Autophagy in the pathogenesis of disease. Cell. 2008;132(1):27–42.
- Choi AM, Ryter SW, Levine B. Autophagy in human health and disease. N Engl J Med. 2013;368(7):651–662.
- He C, Bartholomew CR, Zhou W, et al. Assaying autophagic activity in transgenic GFP-Lc3 and GFP-Gabarap zebrafish embryos. Autophagy. 2009;5(4):520–526. .
- Varga M, Fodor E, Vellai T. Autophagy in zebrafish. Methods. 2015;75:172–180.
- Hu Z, Zhang J, Zhang Q. Expression pattern and functions of autophagy-related gene atg5 in zebrafish organogenesis. Autophagy. 2011;7(12):1514–1527.
- Varga M, Sass M, Papp D, et al. Autophagy is required for zebrafish caudal fin regeneration. Cell Death Differ. 2014;21(4):547–556. .
- Mostowy S, Boucontet L, Mazon Moya MJ, et al. The zebrafish as a new model for the in vivo study of Shigella flexneri interaction with phagocytes and bacterial autophagy. PLoS Pathog. 2013;9(9):e1003588. .
- Ganesan AK, Ho H, Bodemann B, et al. Genome-wide siRNA-based functional genomics of pigmentation identifies novel genes and pathways that impact melanogenesis in human cells. PLoS Genet. 2008;4(12):e1000298. .
- Ho H, Ganesan AK. The pleiotropic roles of autophagy regulators in melanogenesis. Pigment Cell Melanoma Res. 2011;24(4):595–604.
- Yun WJ, Kim EY, Park JE, et al. Microtubule-associated protein light chain 3 is involved in melanogenesis via regulation of MITF expression in melanocytes. Sci Rep. 2016;6(1):19914. .
- Kim ES, Chang H, Choi H, et al. Autophagy induced by resveratrol suppresses α‐MSH‐induced melanogenesis. Exp Dermatol. 2014;23(3):204–206. .
- Kim ES, Jo YK, Park SJ, et al. ARP101 inhibits α‐MSH‐stimulated melanogenesis by regulation of autophagy in melanocytes. FEBS Lett. 2013;587(24):3955–3960. .
- Tsao YT, Huang YF, Kuo CY, et al. Hinokitiol inhibits melanogenesis via AKT/mTOR signaling in B16F10 mouse melanoma cells. Int J Mol Sci. 2016;17(2):248. .
- Klionsky DJ, Abdelmohsen K, Abe A, et al. Guidelines for the use and interpretation of assays for monitoring autophagy. Autophagy. 2016;12(1):1–222.
- Kaizuka T, Morishita H, Hama Y, et al. An autophagic flux probe that releases an internal control. Mol Cell. 2016;64(4):835–849. .
- Ata H, Ekstrom TL, Martínez-Gálvez G, et al. Robust activation of microhomology-mediated end joining for precision gene editing applications. PLoS Genet. 2018;14(9):e1007652. .
- Lieschke GJ, Currie PD. Animal models of human disease: zebrafish swim into view. Nat Rev Genet. 2007;8(5):353–367.
- Espín-Palazón R, Martínez-López A, Roca FJ, et al. TNFα impairs rhabdoviral clearance by inhibiting the host autophagic antiviral response. PLoS Pathog. 2016;12(6):e1005699.
- Abattyani Z, Xerri L, Hassoun J, et al. Tyrosinase gene expression in human tissues. Pigment Cell Res. 1993;6(6):400–405.
- Tief K, Schmidt A, Beermann F. New evidence for presence of tyrosinase in substantia nigra, forebrain and midbrain. Mol Brain Res. 1998;53(1–2):307–310.
- Hall AM, Orlow SJ. Degradation of tyrosinase induced by phenylthiourea occurs following Golgi maturation. Pigment Cell Res. 2005;18(2):122–129.
- Fujita H, Motokawa T, Katagiri T, et al. Inulavosin, a melanogenesis inhibitor, leads to mistargeting of tyrosinase to lysosomes and accelerates its degradation. J Invest Dermatol. 2009;129(6):1489–1499.
- Á S-F, Rodríguez-López JN, García-Cánovas F, et al. Tyrosinase: a comprehensive review of its mechanism. Biochim Biophys Acta (BBA)-Protein Struct Mol Enzymol. 1995;1247(1):1–11.
- Slominski A, Zmijewski MA, Pawelek JL. ‐tyrosine and L‐dihydroxyphenylalanine as hormone‐like regulators of melanocyte functions. Pigment Cell Melanoma Res. 2012;25(1):14–27.
- Ma T, Zhu J, Chen X, et al. High glucose induces autophagy in podocytes. Exp Cell Res. 2013;319(6):779–789.
- Yao J, Tao ZF, Li CP, et al. Regulation of autophagy by high glucose in human retinal pigment epithelium. Cell Physiol Biochem. 2014;33(1):107–116.
- Murase D, Hachiya A, Takano K, et al. Autophagy has a significant role in determining skin color by regulating melanosome degradation in keratinocytes. J Invest Dermatol. 2013;133(10):2416–2424.
- Dieke SH. Pigmentation and hair growth in black rats, as modified by the chronic administration of thiourea, phenyl thiourea and alpha-naphthyl thiourea. Endocrinology. 1947;40(3):123–136.
- Millott N, Lynn WG. Ubiquity of melanin and the effect of phenylthiourea. Nature. 1966;209(5018):99–101.
- Steingrímsson E, Copeland NG, Jenkins NA. Melanocyte stem cell maintenance and hair graying. Cell. 2005;121(1):9–12.
- White RM, Sessa A, Burke C, et al. Transparent adult zebrafish as a tool for in vivo transplantation analysis. Cell Stem Cell. 2008;2(2):183–189. .
- Kimmel CB, Ballard WW, Kimmel SR, et al. Stages of embryonic development of the zebrafish. Dev Dyn. 1995;203(3):253–310. .
- He C, Klionsky DJ. Analyzing autophagy in zebrafish. Autophagy. 2010;6(5):642–644.
- Sasaki T, Lian S, Qi J, et al. Aberrant autolysosomal regulation is linked to the induction of embryonic senescence: differential roles of Beclin 1 and p53 in vertebrate Spns1 deficiency. PLoS Genet. 2014;10(6):e1004409.
- Khuansuwan S, Barnhill LM, Cheng S, et al. A novel transgenic zebrafish line allows for in vivo quantification of autophagic activity in neurons. Autophagy. 2019;15(8):1322–1332.