
ABSTRACT
Whereas central nervous system (CNS) homeostasis is highly dependent on tissue surveillance by immune cells, dysregulated entry of leukocytes during autoimmune neuroinflammation causes severe immunopathology and neurological deficits. To invade the CNS parenchyma, encephalitogenic T helper (TH) cells must encounter their cognate antigen(s) presented by local major histocompatibility complex (MHC) class II-expressing antigen-presenting cells (APCs). The precise mechanisms by which CNS-associated APCs facilitate autoimmune T cell reactivation remain largely unknown. We previously showed that mice with conditional deletion of the gene encoding the essential autophagy protein ATG5 in dendritic cells (DCs) are resistant to EAE development. Here, we report that the nicotinamide adenine dinucleotide phosphate (NADPH) oxidase 2, also known as CYBB/NOX2, in conventional DCs (cDCs) regulates endocytosed MOG (myelin oligodendrocyte protein) antigen processing and supports MOG-antigen presentation to CD4+ T cells through LC3-associated phagocytosis (LAP). Genetic ablation of Cybb in cDCs is sufficient to restrain encephalitogenic TH cell recruitment into the CNS and to ameliorate clinical disease development upon the adoptive transfer of MOG-specific CD4+ T cells. These data indicate that CYBB-regulated MOG-antigen processing and LAP in cDCs licenses encephalitogenic TH cells to initiate and sustain autoimmune neuroinflammation.
Abbreviations: Ag: antigen; APC: antigen-presenting cell; AT: adoptive transfer; ATG/Atg: autophagy-related; BAMs: border-associated macrophages; BMDC: bone marrow-derived DC; CD: cluster of differentiation; CNS: central nervous system; CSF2/GM-CSF: colony stimulating factor 2 (granulocyte-macrophage); CYBB/NOX2/gp91phox: cytochrome b-245, beta polypeptide; DC: dendritic cell; EAE: experimental autoimmune encephalomyelitis; fl: floxed; FOXP3: forkhead box P3; GFP: green fluorescent protein; H2-Ab: histocompatibility 2, class II antigen A, beta 1; IFN: interferon; IL: interleukin; ITGAX/CD11c: integrin subunit alpha X; LAP: LC3-associated phagocytosis; MAP1LC3/LC3: microtubule associated protein 1 light chain 3; MFI: median fluorescence intensity; MG: microglia; MHCII: major histocompatibility complex class II; MOG: myelin oligodendrocyte glycoprotein; MS: multiple sclerosis; NADPH: nicotinamide adenine dinucleotide phosphate; ODC: oligodendroglial cell; OVA: ovalbumin; pDC: plasmacytoid DC; Ptd-L-Ser: phosphatidylserine; PTPRC: protein tyrosine phosphatase, receptor type, C; ROS: reactive oxygen species; SLE: systemic lupus erythematosus; TH cells: T helper cells; TLR: toll-like receptor; ZBTB46: zinc finger and BTB domain containing 46
Introduction
Surveillance of the central nervous system (CNS) by immune cells maintains tissue homeostasis and facilitates the elimination of infectious pathogens. During immune-mediated demyelinating conditions, such as multiple sclerosis (MS) and experimental autoimmune encephalomyelitis (EAE), however, auto-aggressive T helper (TH) cells gain access to the CNS parenchyma, where they induce an inflammatory cascade, leading to demyelination, axonal loss, and brain atrophy [Citation1]. Before they can breach the glia limitans and infiltrate the parenchyma, myelin-specific TH cells require reactivation by CNS-associated major histocompatibility complex (MHC) class II (MHCII)-expressing antigen-presenting cells (APCs), which have sampled myelin protein from oligodendrocytes [Citation2–5]. Recent studies employing conditional deletion of MHCII molecules in CNS-associated APC subsets indicated that conventional DCs (cDCs), in contrast to microglial cells and macrophages positioned at CNS interfaces, are essential for reactivating encephalitogenic TH cells and disease development [Citation4–6]. The mechanisms by which APCs license T cells to initiate neuroinflammation are, however, poorly understood.
The phagocyte NADPH oxidases belong to the NOX family of reactive oxygen species (ROS)-generating multiprotein complexes, known for their bactericidal activity within neutrophils and macrophages in a process termed respiratory burst. Central components of the NADPH oxidase multiprotein complex are the X-chromosomal-encoded CYBB/NOX2 and CYBA/p22phox, which form a stable, but inactive, membrane-bound heterodimer during steady-state. Upon activation, the heterodimer and the cytosolic regulatory subunits of the NADPH oxidase complex (NCF4/p40phox, NCF1/p47phox, NCF2/p67phox) translocate to the forming phagosome at the plasma membrane and aid in the complex assembly with the small GTPase RAC1, which is required to fully trigger the ROS-generating activity of the complex [Citation7]. In MS lesions, components of the NADPH oxidase complex (CYBB/NOX2, CYBA/p22phox, NCF1/p47phox) are upregulated and coexpressed in CNS resident and infiltrating myeloid cells, predominantly localized in areas of initial tissue damage and at perivascular sites in proximity to T cells [Citation8]. While excessive extracellular ROS provision has been linked with inflammation-induced tissue injury and neurodegeneration [Citation9–11], recent studies indicated that intracellular generation of ROS by the NADPH oxidase complex restrains the inflammatory propensity of myeloid cells through LC3-associated phagocytosis (LAP), triggered by receptor-mediated uptake of extracellular particles [Citation12–14ssss]. Mice that lack LAP components, such as CYBB/NOX2, in their macrophages spontaneously develop a proinflammatory systemic lupus erythematosus (SLE)-like phenotype [Citation13]. In contrast, in vitro studies reported that LAP in myeloid cells can support CD4+ T cell responses by promoting sustained MHCII antigen presentation [Citation15,Citation16] and we recently demonstrated that DC-specific deletion of Atg5 (autophagy-related 5), essential for both canonical autophagy and LAP, confers resistance to EAE development induced by MOG-specific T cells [Citation6]. Here, we sought to determine the role of DC-intrinsic CYBB/NOX2 as an essential LAP component for encephalitogenic T cell reactivation and CNS tissue injury during EAE.
Results
Deleting Cybb in cDCs confers protection to adoptive transfer EAE
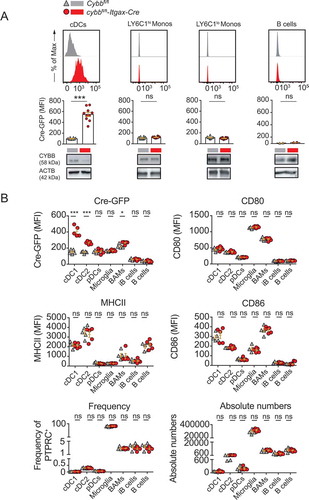
To investigate the impact of CYBB/NOX2 in DCs during EAE development, we generated ITGAX/CD11c-specific conditional knockout mice for Cybb (Cybbflox/flox × Itgax-Cre-GFP, designated cybbfl/fl-Itgax-Cre). Assessing the targeting specificity of this strain revealed a complete reduction of CYBB in conventional DCs (cDCs), whereas LY6C1hi, LY6C1lo monocytes, and B cells continued to express CYBB ( and S1A). Steady-state frequencies of splenic DC subsets remained unchanged in cybbfl/fl-Itgax-Cre mice as compared to littermates (Cybbfl/fl) (Fig. S1B). Cybb-deficient cDCs did not differ from their Cybb-competent counterparts in surface expression levels of MHCII and costimulatory molecules (Fig. S1 C-E) and produced similar levels of IL12B/IL12 p40 upon CD40 ligation (Fig. S2A). Within isolated MHCII-expressing CNS-associated leukocytes, Cre-GFP was strongly expressed in both cDC1 and cDC2 subsets but only to a minor extent in border-associated macrophages (BAMs). Plasmacytoid DCs (pDCs), immature and mature B cells, as well as microglia, were GFP-negative and did not, therefore, express Cre recombinase (). Frequencies and absolute numbers of CNS-associated APCs and expression levels of MHCII, as well as costimulatory molecules, were similar in cybbfl/fl-Itgax-Cre mice as compared to Cre– littermates ().
Figure 1. Cre recombinase efficiently targets conventional DCs in cybbfl/fl-Itgax-Cre animals. (A) Representative histograms depicting Cre-GFP expression of either ITGAXhi MHCIIhi splenic DCs (cDCs), LY6C1hi ITGAM+ monocytes (LY6C1hi Monos), LY6C1lo ITGAM+ monocytes (LY6C1lo Monos) or CD19+ MHCII+ B cells in Cybbfl/fl (gray) or cybbfl/fl-Itgax-Cre (red) mice in steady-state (upper panel). Quantification of Cre-GFP median fluorescence intensity (MFI) in splenic leukocyte subsets. Each data point represents one individual animal (middle panel). Western blot analysis for protein expression of CYBB in the respective cellular compartments is shown. ACTB served as a loading control (lower panel). Statistical analysis: Unpaired two-tailed Student t-test was applied. Mean ± SEM is depicted. ns, not significant: P > 0.05; ***P < 0.001. (B) Quantification of MFI for Cre-GFP, MHCII, CD80, and CD86 in CNS-resident immune cell subsets. Each data point represents one individual animal. One representative out of 3 experiments is shown. Statistical analysis: Unpaired two-tailed Student t-test was applied. Mean ± SEM is depicted. ns, not significant: P > 0.05; *P < 0.05; ***P < 0.001. cDC, conventional dendritic cells; BAMS, border-associated macrophages; iB cells, immature B cells
Adoptive transfer of T cell receptor-transgenic MOG35-55-specific CD4+ T cells resulted in a strongly reduced disease severity and incidence of EAE in cybbfl/fl-Itgax-Cre mice as compared to Cybbfl/fl control littermates (). Like in the steady-state, CYBB expression was efficiently targeted in cybbfl/fl-Itgax-Cre mice during the disease state as quantified in CNS-derived ITGAXhi MHCIIhi myeloid cells at day 20 post-transfer (p.t.) of myelin-specific T cells (). Similar to our findings in atg5fl/fl-Itgax-Cre mice [Citation6], cybbfl/fl-Itgax-Cre mice did not significantly differ from their Cybbfl/fl counterparts in incidence rates and clinical severity grades upon active EAE induction with an emulsion of MOG35-55 peptide in complete Freund´s adjuvant (CFA, s.c.) together with intraperitoneal (i.p.) injections of pertussis toxin ().
Figure 2. CYBB in cDCs controls CNS immune invasion of primed myelin-specific CD4+ T cells. (A) EAE was induced via adoptively transferring 2D2/TCRMOG-derived encephalitogenic CD4+ T cells into Cybbfl/fl (gray triangles) or cybbfl/fl-Itgax-Cre (red circles). Each data point represents the mean of 6 (Cybbfl/fl) and 6 (cybbfl/fl-Itgax-Cre) animals respectively (left). Change of body weight (middle) and quantification of disease incidence is depicted (right). One representative out of 3 experiments is shown. (B) EAE was induced via adoptively transferring 2D2/TCRMOG-derived encephalitogenic CD4+ T cells into Cybbfl/fl (gray triangles) or cybbfl/fl-Itgax-Cre (red circles). On day 20 after the transfer, animals were sacrificed and CNS was analyzed via flow cytometry for CYBB expression in myeloid cells. Statistical analysis: Mean ± SEM is depicted. Two-way ANOVA (left). Gating strategy for flow cytometry analysis in the CNS of Cybbfl/fl or cybbfl/fl-Itgax-Cre animals. Representative density plots are depicted (middle). Quantified median fluorescence intensity (MFI) of intracellular CYBB protein expression in ITGAXhi MHCIIhi CNS cells on day 20 post-transfer (Right). Statistical analysis: Mean ± SEM is depicted. Unpaired two-tailed Student t-test was applied. ns, not significant: P > 0.05; *P < 0.05; ***P < 0.001. (C) EAE was induced via active immunization with MOG35–55 peptide in Cybbfl/fl (gray triangles) cybbfl/fl-Itgax-Cre (red circles) mice. Each data point represents the mean of 9 (Cybbfl/fl) and 10 (cybbfl/fl-Itgax-Cre) animals, respectively (left). Change of body weight (middle) and quantification of disease incidence is depicted (right). Pooled data of 2 independent experiments are shown. (D) EAE was induced via adoptively transferring 2D2/TCRMOG-derived encephalitogenic CD4+ T cells into Cybbfl/fl (gray triangles) or cybbfl/fl-Zbtb46-Cre (purple circles). Each data point represents the mean of 8 (Cybbfl/fl) and 7 (cybbfl/fl-Zbtb46-Cre) animals respectively (left). Change of body weight (middle) and quantification of disease incidence is depicted (right). Pooled data of 2 independent experiments are shown. Statistical analysis: Mean ± SEM is depicted. Two-way ANOVA was applied
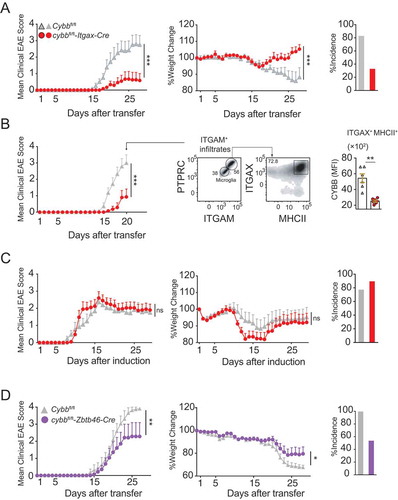
Although cDCs are the only ITGAX-expressing MHCII+ APCs in the steady-state brain [Citation5], other cells, including monocytes, microglia, and BAMs can upregulate ITGAX upon activation [Citation17]. To determine whether the protective effect of Cybb ablation following adoptive transfer of myelin-specific T cells is specifically mediated by cDCs, we next crossed the Cybbfl/fl strain to Zbtb46-Cre (also known as zDC-Cre) mice wherein Cre expression and Cybb deletion is directed by the promoter of the transcription factor Zbtb46 (zinc finger and BTB domain containing 46). Zbtb46 is expressed in pre-DCs and their progeny, but not in monocytes, macrophages, and other myeloid cells, and, therefore, allows for delineating ITGAX+ lineages [Citation18–20]. Similar to cybbfl/fl-Itgax-Cre mice, the adoptive transfer of myelin-specific T cells resulted in reduced disease severities and incidence of EAE in Cybbfl/fl-Zbtb46-Cre mice as compared to Cybbfl/fl control littermates ( and S2B). Thus, the genetic ablation of Cybb in cDCs confers protection to EAE development induced by primed, myelin-specific TH cells.
Cybb expression in DCs regulates myelin-specific CD4+ T cell invasion of the CNS parenchyma
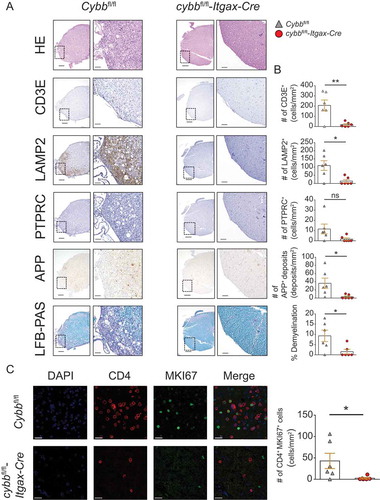
Histological analysis of the lumbar spinal cord sections derived from cybbfl/fl-Itgax-Cre mice, examined at day 28 after T cell transfer, showed substantially reduced immune invasion of the CNS with significantly lower numbers of T cells and LAMP2+ myeloid cells (). Furthermore, CNS tissue injury as reflected by demyelination and axonal damage was greatly reduced in these mice (). Immunofluorescence microscopy analysis revealed increased numbers of CD4+ MKI67+ T cells in the tissue from Cybbfl/fl mice indicating in vivo proliferation of encephalitogenic TH cells. In contrast, CD4+ MKI67+ T cells were rarely detectable in cybbfl/fl-Itgax-Cre mice ().
Figure 3. Reduced immune cell infiltration, demyelination, and axonal damage in the CNS of cybbfl/fl-Itgax-Cre animals upon adoptive transfer EAE. (A) Histology of lumbar spinal cord sections from Cybbfl/fl and cybbfl/fl-Itgax-Cre animals on day 28 upon adoptive transfer of encephalitogenic CD4+ T cells using hematoxylin and eosin staining (HE), staining with antibodies against CD3E for T lymphocytes, against LAMP2 for myeloid cells, against PTPRC for B cells, against amyloid precursor protein for APP deposits and luxol fast blue (LFB-PAS) for demyelination. Scale bars: 200 µm (insert 50 µm) (left). (B) Quantification of cells or deposits per mm2 and fraction of demyelination is depicted (right). (C) Immunofluorescence microscopy analysis of CD4+ MKI67+ cells. Scale bars: 20 µm. Each data point represents one individual animal (Cybbfl/fl: gray triangles; cybbfl/fl-Itgax-Cre: red circles). Statistical analysis: Unpaired two-tailed Student t test was applied. Mean ± SEM is depicted. ns, not significant: P > 0.05; *P < 0.05; **P < 0.005
During steady-state, we did not detect any differences in frequencies of splenic CD4+ T cells, CD8A+ T cells, CD4+ FOXP3+ regulatory T cells, and B cells in cybbfl/fl-Itgax-Cre mice as compared to littermates ( and S3). Furthermore, the production of inflammatory cytokines (IFNG, CSF2/GM-CSF, and IL17A) upon activation was unchanged in cybbfl/fl-Itgax-Cre-derived CD4+ and CD8A+ T cells ().
Figure 4. CYBB deficiency in ITGAX+ cDCs limits the accumulation of myelin-reactive CD4+ T cells within the CNS. (A) Representative density plots depicting splenic CD8A+ and CD4+ T cell subsets in Cybbfl/fl and cybbfl/fl-Itgax-Cre animals at steady-state (upper panels). Frequencies of splenic T cells (CD3+ of PTPRC+) and T cell subsets (CD8A+, CD4+ of CD3E+ and FOXP3+ IL2RA+ TREGs of CD4+ CD3E+) in Cybbfl/fl (gray triangles) cybbfl/fl-Itgax-Cre (red circles) mice at steady-state (lower panels). Each data point represents one individual animal. Pooled data of 2 independent experiments is shown. Statistical analysis: Unpaired two-tailed Student t-test was applied. Mean ± SEM is depicted. ns, not significant: P > 0.05. (B) Frequencies of Cybbfl/fl- (gray triangles) and cybbfl/fl-Itgax-Cre-derived (red circles) proinflammatory cytokine (IFNG [left], CSF2/GM-CSF [middle], and IL17A [right]) producing splenic CD4+ (upper) and CD8A+ (lower) T cells were analyzed via intracellular cytokine staining upon stimulation with PMA/ionomycin (PMA/Iono). Each dot represents an individual animal. Pooled data of 2 independent experiments is shown. med; medium control. (C) PTPRCa congenic 2D2/TCRMOG mice were adoptively transferred into either PTPRCb congenic Cybbfl/fl (gray) or PTPRCb congenic cybbfl/fl-Itgax-Cre (red) mice to induce passive EAE. (D) Representative contour plots depicting relative fractions of PTPRCa+ and PTPRCb+ cells in the CNS (upper) and relative fractions of CD4+ and CD8A+ cells among PTPRCa+ cells (lower). (E) Quantified CNS frequencies of CD4+ PTPRCa+ and CD8A+ PTPRCa+ cells among live single cells in Cybbfl/fl (gray triangles) and cybbfl/fl-Itgax-Cre (red circles) mice upon adoptive transfer EAE. Each data point represents an individual animal. Experiment was terminated after the first animal reached day 3 post-onset. Statistical analysis: Unpaired two-tailed Student t-test was applied. Mean ± SEM is depicted. ns, not significant: P > 0.05; **P < 0.005. Quantified CNS frequencies of proinflammatory cytokine-producing PTPRCa+ CD4+ T cells among live single cells (F) upon ex vivo antigen challenge. Quantified CNS (G, H) and spleen (I) frequencies of cytokine-producing cells among CD4+ T cells upon ex vivo antigen challenge. Each data point represents an individual animal. Statistical analysis: Unpaired two-tailed Student t-test was applied. Mean ± SEM is depicted. ns, not significant: P > 0.05; *P < 0.05; **P < 0.005. O, OVA323–339 peptide; M, MOG35–55 peptide
![Figure 4. CYBB deficiency in ITGAX+ cDCs limits the accumulation of myelin-reactive CD4+ T cells within the CNS. (A) Representative density plots depicting splenic CD8A+ and CD4+ T cell subsets in Cybbfl/fl and cybbfl/fl-Itgax-Cre animals at steady-state (upper panels). Frequencies of splenic T cells (CD3+ of PTPRC+) and T cell subsets (CD8A+, CD4+ of CD3E+ and FOXP3+ IL2RA+ TREGs of CD4+ CD3E+) in Cybbfl/fl (gray triangles) cybbfl/fl-Itgax-Cre (red circles) mice at steady-state (lower panels). Each data point represents one individual animal. Pooled data of 2 independent experiments is shown. Statistical analysis: Unpaired two-tailed Student t-test was applied. Mean ± SEM is depicted. ns, not significant: P > 0.05. (B) Frequencies of Cybbfl/fl- (gray triangles) and cybbfl/fl-Itgax-Cre-derived (red circles) proinflammatory cytokine (IFNG [left], CSF2/GM-CSF [middle], and IL17A [right]) producing splenic CD4+ (upper) and CD8A+ (lower) T cells were analyzed via intracellular cytokine staining upon stimulation with PMA/ionomycin (PMA/Iono). Each dot represents an individual animal. Pooled data of 2 independent experiments is shown. med; medium control. (C) PTPRCa congenic 2D2/TCRMOG mice were adoptively transferred into either PTPRCb congenic Cybbfl/fl (gray) or PTPRCb congenic cybbfl/fl-Itgax-Cre (red) mice to induce passive EAE. (D) Representative contour plots depicting relative fractions of PTPRCa+ and PTPRCb+ cells in the CNS (upper) and relative fractions of CD4+ and CD8A+ cells among PTPRCa+ cells (lower). (E) Quantified CNS frequencies of CD4+ PTPRCa+ and CD8A+ PTPRCa+ cells among live single cells in Cybbfl/fl (gray triangles) and cybbfl/fl-Itgax-Cre (red circles) mice upon adoptive transfer EAE. Each data point represents an individual animal. Experiment was terminated after the first animal reached day 3 post-onset. Statistical analysis: Unpaired two-tailed Student t-test was applied. Mean ± SEM is depicted. ns, not significant: P > 0.05; **P < 0.005. Quantified CNS frequencies of proinflammatory cytokine-producing PTPRCa+ CD4+ T cells among live single cells (F) upon ex vivo antigen challenge. Quantified CNS (G, H) and spleen (I) frequencies of cytokine-producing cells among CD4+ T cells upon ex vivo antigen challenge. Each data point represents an individual animal. Statistical analysis: Unpaired two-tailed Student t-test was applied. Mean ± SEM is depicted. ns, not significant: P > 0.05; *P < 0.05; **P < 0.005. O, OVA323–339 peptide; M, MOG35–55 peptide](/cms/asset/2f9b9496-ca2d-4fe1-bd26-92a6149e27c2/kaup_a_1756678_f0004_c.jpg)
To further study frequencies and effector functions of CNS-infiltrating T cells during EAE, mice were sacrificed on day 18 post-transfer (p.t.) of PTPRCa/CD45.1+ myelin-specific CD4+ T cells into PTPRCb/CD45.2+ recipients, i.e., day 3 after disease onset in control littermates (). In line with the histological data, cybbfl/fl-Itgax-Cre mice showed substantially reduced accumulation of adoptively transferred PTPRCa+ encephalitogenic TH cells within the CNS (). Although the overall frequency of cytokine-expressing cells was reduced (), the ability of CNS-invading PTPRCa+ TH cells to produce proinflammatory cytokines (IFNG, CSF2, and IL17A) upon ex vivo restimulation with their nominal antigen was preserved in cybbfl/fl-Itgax-Cre recipients indicated by the unchanged frequency of cytokine-expressing cells within the PTPRCa+ CD4+ compartment (). Not adoptively transferred PTPRCb+ T cells derived from the CNS of recipient mice () and splenic CD4+ T cells () did not show any cytokine expression upon ex vivo restimulation with MOG35-55 peptide. These data indicate that lack of CYBB function in DCs does not impair effector functions of primed, CNS-infiltrating TH cells, but restrains their in situ reactivation and accumulation.
Absence of Cybb in cDCs abrogates LC3-associated phagocytosis and myelin antigen presentation to CD4+ T cells
The finding that Cybb expression in cDCs limits autoimmune CD4+ T cell accumulation within the CNS during EAE suggested a role of CYBB in antigen processing and presentation. In macrophages, CYBB recruitment to early phagosomes is essential for LAP, which requires some, but not all, components of the autophagy machinery to conjugate the autophagy protein LC3 directly to phagosomal membranes upon phagocytosis [Citation12]. In contrast to canonical autophagy, LAP degrades extracellular material that engages receptor signaling after apoptotic cell recognition through phosphatidylserine (Ptd-L-Ser)-recognizing receptors or engaged by particles containing pathogen-associated molecular patterns [Citation12].
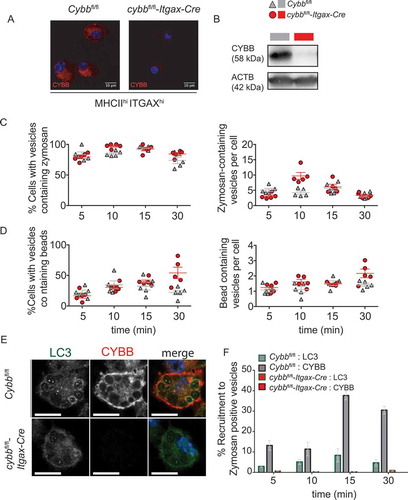
To determine whether Cybb-deficiency impairs phagocytosis, execution of LAP, and myelin antigen presentation in cDCs, we first assessed the phagocytic capacity and LC3-conjugation to phagosomes in ITGAX+ bone marrow-derived DCs (BMDCs) upon loading with polystyrene beads or LAP-triggering TLR2-CLEC7A-agonistic zymosan particles. The expression of CYBB was efficiently ablated in cybbfl/fl-Itgax-Cre-derived BMDCs (). Both, cybbfl/fl-Itgax-Cre- and Cybbfl/fl-derived BMDCs phagocytosed similar numbers of either naked polystyrene beads or zymosan particles, as quantified by laser scanning confocal microscopy (). Conjugation of LC3 to lipids in the phagosomal membrane, however, was absent in cybb KO BMDCs (), indicating that Cybb-deficient DCs, similar to macrophages [Citation12], are unable to execute LAP.
Figure 5. Absence of CYBB in cDCs abrogates LC3-associated phagocytosis. (A) Immunofluorescence confocal laser scanning microscopy of BMDCs (FACS-purified for ITGAX+ MHCII+) either derived from Cybbfl/fl or cybbfl/fl-Itgax-Cre animals and stained for CYBB. Scale bar 10 µm. (B) Western blot analysis for protein expression of CYBB in Cybbfl/fl- and cybbfl/fl-Itgax-Cre-derived BMDCs (FACS-purified for ITGAX+ MHCII+) is shown. ACTB served as a loading control. (C, D) Quantification of BMDC fraction that phagocytosed zymosan particles or inert beads (left) and the number of zymosan- or inert bead-containing vesicles per BMDC over time (right). (E) Immunofluorescence confocal laser scanning microscopy of BMDCs that had phagocytosed zymosan particles visualizing CYBB (red), LC3 (green) and DAPI (blue). Representative pictures are depicted. Original magnification with 63×, 1.4 N.A. oil immersion lens. (F) Quantification of recruitment of CYBB and LC3 to zymosan-containing vesicles over time. Mean ± SEM is depicted
We next analyzed whether the absence of CYBB in cDCs impairs their T cell stimulatory capacity. To this end, purified DC-Cybb–/– or DC-Cybb+/+ primary splenic DCs were first loaded with MOG35-55 peptide or MOG1-125 protein and cocultured with MOG35–55–specific CD4+ T cells. Lack of Cybb in cDCs did not affect activation of 2D2 cells, as measured by the production of IFNG and IL17A or proliferation of MOG-specific T cells (-C). Since LAP requires triggering through receptor-mediated antigen uptake, such as Ptd-L-Ser-recognizing receptors, we next investigated whether uptake of damaged Ptd-L-Ser-exposing oligodendroglial cells (ODCs) by cDCs triggers MOG-specific T cell activation in a CYBB-dependent manner ( and S4). Irradiated Ptd-L-Serhi compared with non-irradiated Ptd-L-Serlo MOG-expressing ODCs were loaded onto DC-Cybb–/–- or DC-Cybb+/+-derived primary splenic DCs.
Figure 6. CYBB-deficiency in cDCs limits endogenous myelin peptide presentation following phagocytosis of injured oligodendroglial cells. (A) Representative histograms depicting proliferation of 2D2/TCRMOG-derived myelin-specific CD4+ T cells upon coculture with MOG35-55-pulsed FACS-purified ITGAXhi MHCIIhi splenic DCs (Cybbfl/fl: gray; cybbfl/fl-Itgax-Cre: red). 2D2/TCRMOG-derived CD4+ T cells alone served as a control (light gray). Quantification of 2D2/TCRMOG-derived CD4+ T cell proliferation (CellTrace Violetdim) (B) or IFNG and IL17 secretion (C) upon coculture with either MOG35-55- (M35-55) or MOG1-125 (M1-125)-pulsed FACS-purified ITGAXhi MHCIIhi splenic DCs. One representative of 2 independent experiments is shown. Statistical analysis: Mean ± SEM is depicted. Unpaired two-tailed Student t-test was applied. ns, not significant: P > 0.05. (D) Set-up for sequential coculture assay using damaged (UV-irradiated) or untreated MOG-expressing oligodendroglial cell line MO3.13 (MOG+ ODCs). (E) Surface expression levels of CD80, CD86, CD40 and MHCII on ITGAXhi MHCIIhi are similar upon coculture with iODCs when comparing Cybbfl/fl and cybbfl/fl-Itgax-Cre genotypes. Quantification of IFNG and IL17 secretion (F) or 2D2/TCRMOG-derived CD4+ T cell proliferation (CellTrace Violetdim) (G, left panel) upon coculture with FACS-purified ITGAXhi MHCIIhi splenic DCs previously pulsed with either UV-irradiated (iODC) or untreated (ODC) MOG-expressing oligodendroglial cells. One representative of 2 independent experiments is shown. Statistical analysis: Mean ± SEM is depicted. Unpaired two-tailed Student t-test was applied. *P < 0.05; **P < 0.005. (G, right panel) Representative histograms depicting proliferation of 2D2/TCRMOG-derived myelin-specific CD4+ T cells upon sequential coculture with ODC-pulsed FACS-purified ITGAXhi MHCIIhi splenic DCs (Cybbfl/fl: gray; cybbfl/fl-Itgax-Cre: red). 2D2/TCRMOG-derived CD4+ T cells alone served as a control (light gray)
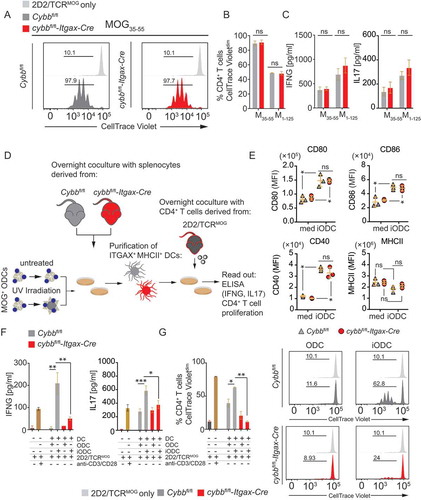
The surface expression of CD80, CD86, CD40, and MHCII on ITGAXhi MHCIIhi DCs was similar upon coculture with Ptd-L-Serhi ODCs (). Endogenous myelin-derived peptide presentation was assessed by IFNG and IL17A production and proliferation of cocultured MOG35–55–specific CD4+ T cells. Both cytokine production and proliferation were significantly enhanced in CD4+ T cells cocultured with Ptd-L-Serhi ODC-loaded cDCs, as compared to those loaded with Ptd-L-Serlo ODCs (, and S4). Increased CD4+ T cell activation upon the presentation of endogenous myelin antigen derived from Ptd-L-Serhi ODCs was, however, abrogated in Cybb-deficient cDCs (). These data indicate that CYBB is required for LAP and MHCII antigen presentation in cDCs upon receptor-mediated phagocytosis.
Discussion
Encephalitogenic TH cells require the re-encounter of their cognate antigen presented by CNS-associated APCs to initiate autoimmune tissue damage. Although the EAE model has been successfully used for decades to study T cell-mediated CNS autoimmunity, the origin and nature of APCs, which reactivate pathogenic T cells, have been heavily disputed and the mechanisms by which they permit T cell invasion and CNS injury are largely unknown. Our study demonstrates that CYBB in cDCs enhances myelin-specific CD4+ T cell activation through antigen presentation and permits CNS immune invasion and facilitates TH-cell mediated tissue damage during AT-EAE.
The CNS parenchyma and interfaces host heterogeneous populations of constitutively and optionally MHCII-expressing myeloid and lymphoid cells, including subsets of microglial cells, border-associated macrophages, monocyte-derived cells, conventional DCs (cDCs), plasmacytoid DCs, and B cells [Citation21]. Recent studies employing conditional deletion of MHCII molecules in CNS-associated APC subsets [Citation5] and with lineage-specific depletion of APCs [Citation22], identified cDCs among ITGAX+ cells as the main facilitators of early T cell entry into the CNS during adoptive transfer EAE (AT-EAE), the prototypical tool to study T cell–APC interactions during neuroinflammation in vivo. EAE can also be induced by s.c. immunization with myelin antigen and CFA, i.e., active EAE, which requires ITGAXneg LY6C1hi CCR2 (C-C chemokine receptor type 2)+ monocytes, precursors of CNS-invading monocyte-derived DCs, but not ITGAX+ cDCs for clinical disease development [Citation3,Citation23–26]. We did not observe significant differences in incidence rates and clinical severity grades in cybbfl/fl-Itgax-Cre mice or atg5fl/fl-Itgax-Cre mice [Citation6] following active EAE induction. Lack of Cre-mediated recombination in ITGAXneg LY6C1+ monocytes, and a delayed targeting of Cybb or Atg5 in CNS-invading monocyte-derived DCs in cybbfl/fl-Itgax-Cre and atg5fl/fl-Itgax-Cre mice [Citation6] might have contributed to this effect.
CYBB-mediated ROS production can be detected in many hematopoietic and non-hematopoietic cell lineages, such as fibroblasts, endothelial cells, and cardiomyocytes [Citation27], and mice globally deficient in CYBB-expression are reported to be partially protected from EAE development after active immunization [Citation28]. Here, we specifically determined CYBB function in DCs. The protective effect of CYBB deficiency was stronger in cybbfl/fl-Itgax-Cre mice as compared to Cybbfl/fl-Zbtb46-Cre mice. Although cDCs isolated from the unperturbed brain are superior to other potential APCs in their ability to present myelin antigen from the steady-state CNS and inducing proliferation of myelin-specific CD4+ T cells [Citation5,Citation22], ablation of ITGAX+ cells in ITGAXDTR mice confers resistance to AT-EAE, while lack of cDCs in ZBTB46DTR (also known as zDCDTR) mice reduced the susceptibility to AT-EAE only by half [Citation22]. These data, along with our observations, indicate that ITGAX+ APCs, other than cDCs, might additionally contribute to EAE development and progression.
The reduced proliferative capacity and accumulation of adoptively transferred encephalitogenic T cells in cybbfl/fl-Itgax-Cre mice prompted us to investigate the function of CYBB in antigen presentation. In contrast to neutrophils and macrophages, phagocytosis and phagosomal ROS production by DCs serve other purposes than the mere clearance of microbes or cell debris. Their phagosomes contain extracellular antigenic material ready to be processed and presented to T cells. Efficient and prolonged presentation of peptide antigens in DCs is supported by limiting endophagocytic proteolysis through low expression levels and low recruitment of proteolytic enzymes to phagosomes [Citation29,Citation30], limited acidification by the V-ATPase [Citation31], and active alkalinization of the endosomal and phagosomal lumen by NADPH oxidase complex-generated superoxide, which consumes protons produced by the V-ATPase proteases and was shown to support cross-presentation by CD8A+ DCs [Citation32,Citation33]. The low amount of proteolysis observed in APCs expressing high amounts of MHCII, such as cDCs, as opposed to macrophages, is thought to render these cells particularly susceptible to pH modulation and very efficient in recovering immunogenic peptides and assembling peptide-MHCII complexes [Citation29]. Prolonged conservation of antigenic peptides in APCs has previously been attributed to LC3+ phagosomes whose formation requires NADPH oxidase complex-generated ROS during the non-canonical autophagy pathway termed LC3-associated phagocytosis (LAP) [Citation12,Citation13,Citation15,Citation34]. LC3 lipidation to single-membrane compartments in the endo-lysosomal system following endocytic engulfment events also occurs during micropinocytosis [Citation35,Citation36], entosis [Citation35,Citation37], and LC3-associated endocytosis (LANDO) [Citation38]. LANDO in microglia has recently been shown to facilitate beta-amyloid clearance in murine models of Alzheimer disease and mice lacking LANDO but not canonical autophagy in microglia have a robust increase in proinflammatory cytokine production associated with accelerated neurodegeneration [Citation38]. While LANDO requires the expression of ATG5 and RUBCN, it remains to be clarified whether the generation of ROS by the NADPH oxidase complex is as essential for LANDO as it is for LAP. Within the myeloid cell compartment, LAP has primarily been studied in macrophages. We observed that LAP, as defined by LC3 conjugation to TLR-engaged phagosomes, is also abrogated in CYBB-deficient DCs. Functional consequences of LAP deficiency in macrophages and DCs in vivo, however, appear to be fundamentally different.
Mice that lack LAP components such as Atg5, Atg7, BECN1/Beclin1 in their macrophages, as conditionally ablated using lysozyme M (LysM)-Cre-lox recombination or globally deficient in CYBB function, develop an auto-inflammatory phenotype with aging, that can be accelerated by chronic exposure to apoptotic cells [Citation13]. These mice depict impaired clearance of dying cells, resulting in a systemic proinflammatory syndrome with elevated serum inflammatory cytokines, generation of autoantibodies, glomerular immune complex deposition, and evidence of kidney damage, commonly associated with SLE [Citation13]. Using a similar approach with LysM-Cre-mediated ablation of gene products essential for LAP but not canonical autophagy, Cunha et al. recently demonstrated that disruption of LAP but not canonical autophagy limits tumor growth by tumor-associated macrophages upon phagocytosis of dying tumor cells associated with enhanced proinflammatory gene expression and type I interferon responses [Citation14]. These studies suggest that LAP executed by macrophages is a mediator of immunosuppression and facilitates immune-silent clearance of dying cells. We [Citation6] and others [Citation39] previously demonstrated that DC-specific deletion of Atg5 or Atg7, required for both LAP and canonical autophagy, results in the resistance to or amelioration of EAE development induced by myelin-specific CD4+ T cells through limiting antigen presentation. Canonical autophagy delivers intracellular antigens for MHCII presentation, while EAE development is driven by an antigen not intrinsically expressed by professional APCs and, therefore, requires endocytosis, followed by myelin antigen processing and presentation. The finding that DC-specific deletion of CYBB and ATG5 function inhibits LC3 recruitment to phagosomes, antigen presentation to encephalitogenic CD4+ T cells, CNS immune invasion, and clinical disease development, indicates that LAP rather than canonical autophagy in DCs augments T cell immunopathology in EAE. In line with our findings, in vitro studies demonstrate that LAP in myeloid cells can support CD4+ T cell responses by promoting sustained MHCII antigen presentation [Citation15,Citation16]. Thus, while inefficient clearance of dying cells through LAP in macrophages results in exacerbated autoinflammation, impairment of LAP in DCs dampens CD4+ T cell-mediated autoimmunity by limiting sustained antigen presentation.
Autopsy brains from patients with MS exhibit upregulation and coexpression of NADPH oxidase complex components such as CYBB, CYBA, and NCF1 in CNS resident and infiltrating myeloid cells predominantly localized in areas of initial tissue damage and at perivascular sites in proximity to T cells [Citation8]. While ROS production by activated microglia and macrophages contribute to neuronal injury during CNS inflammation [Citation8,Citation9,Citation40–42], conditional gene targeting approaches consistently demonstrated that MHCII expression in microglia is dispensable for EAE development [Citation4,Citation5,Citation43]. Our study indicates that ROS production by cDCs augments T cell-mediated tissue injury through antigen presentation and supports the concept that pharmacological modulation of endogenous redox regulation by CYBB and restraining LAP-mediated antigen presentation should be explored for its potential therapeutic merit in MS.
Materials and methods
Mice
Wild type C57BL/6 mice were purchased from Janvier Labs. Congenic C57BL/6- PTPRCa/CD45.1 mice were purchased from Charles River Laboratories. The generation and characterization of Cybbflox/flox mice were reported previously [Citation44]. Tg(Itgax-cre,-EGFP)4097Ach mice (designated Itgax-Cre), B6.Cg-Zbtb46tm3.1(cre)Mnz/J mice (designated Zbtb46-Cre, also known as zDC-Cre) and MOG-specific TCR transgenic mice C57BL/6-Tg(Tcra2D2, Tcrb2D2)1Kuch/J (designated 2D2/TCRMOG) were purchased from the Jackson Laboratory. 2D2/TCRMOG mice were backcrossed to PTPRCa/CD45.1 congenic C57BL/6 mice in our facility. All animals were bred and housed in the University of Zurich and University of Münster animal facilities in individually ventilated cages on a 12 h light/dark cycle with food and water available ad libitum according to institutional guidelines, as well as Swiss and German animal laws. Itgax-Cre and Zbtb46-Cre mice were crossed with Cybbflox/flox mice in order to obtain Cybbflox/flox × Itgax-Cre and Cybbflox/flox × Zbtb46-Cre mice respectively (designated cybbfl/fl-Itgax-Cre and cybbfl/fl-Zbtb46-Cre) on a C57BL/6 background. Cybbflox/flox mice (designated Cybbfl/fl) were used as littermate controls. All animal protocols were approved by and conducted in accordance with the cantonal veterinary office of the canton of Zurich, Switzerland (ZH192/17) and the State Agency for Nature, Environment and Consumer Protection North Rhine-Westphalia, Germany (81–02.04.2018.A383).
Genotyping
Itgax-Cre, Zbtb46-Cre, and Cybbflox/flox mouse genotypes were determined via PCR analysis on DNA from tail or ear biopsies by the use of the following primer pairs (5ʹ-3ʹ): Itgax-Cre: GCG GTC TGG CAG TAA AAA CTA TC (transgene forward), GTG AAA CAG CAT TGC TGT CAC TT (transgene reverse), CTA GGC CAC AGA ATT GAA AGA TCT (internal positive control forward), GTA GGT GGA AAT TCT AGC ATC ATC C (internal positive control reverse); Zbtb46-Cre: GCG CTG GAG TTT CAA TAC C (mutant reverse), GTA AGC ATA GCC CTG CTC CT (common), CTG GTT GAG GAT GAG GAT GA (wild type forward); Cybbflox/flox: GTA AAT TCA CTG TTC TGG GTC (forward), ACA TGT TCT TCT CAC AGG CTC (reverse).
2D2/TCRMOG transgenic mice were genotyped via flow cytometry, as previously described [Citation6].
Induction of EAE
AT-EAE was induced as previously described [Citation6]. In brief, 2D2/TCRMOG mice were immunized with 200 μg of MOG35–55 (MEVGWYRSPFSRVVHLYRNGK; Genscript, RP10245) emulsified in CFA (BD Difco, 263810) and treated with 200 ng of pertussis toxin (List Biological Laboratories, 179B) i.p. on the day of immunization. After 7 d, splenocytes and lymph node cells were cultured in complete RPMI (10% heat-inactivated FCS, 1% penicillin-streptomycin [P-S], and 50 µM beta-mercaptoethanol) containing MOG35–55 (10 μg/ml) and recombinant IL23A (10 ng/ml; eBioscience, 14-8231-63) for 48 h. To induce EAE, we (i.p.) injected 10 × 106 cells into recipient mice, which had been sublethally irradiated with 550 rad (Rad Source Technologies, Type RS 2000) 1 d prior to cell transfer. Active EAE was induced, as described above, but included a second treatment with 200 ng of pertussis toxin on day 2. Clinical manifestations of EAE and weight loss were monitored and documented daily. Mice were scored as follows: 0 = no detectable signs of EAE, 0.5 = distal limp tail, 1 = complete limp tail, 1.5 = limp tail and hindlimb weakness, 2 = unilateral partial hindlimb paralysis, 2.5 = bilateral partial hindlimb paralysis, 3 = complete bilateral hindlimb paralysis, 3.5 = complete bilateral hindlimb paralysis and partial forelimb paralysis, 4 = moribund (animal unable to move due to tetraparalysis), 5 = animal found dead. The last documented score of euthanized or dead animals was carried forward for statistical analysis.
Generation of BMDCs
Bone marrow-derived DCs (BMDCs) were generated, as previously described [Citation6]. Briefly, bone marrow cells were cultured with BMDC culture medium (10% inactivated FCS [Sigma, F2442-6X500 ML], 1% P-S [Life Technologies, 15070–063], 50 μM beta-mercaptoethanol [Thermo Fisher Scientific, 21985023], and 2.5 ng/ml recombinant mouse CSF2/GM-CSF [Biolegend, 576306] in RPMI-1640 [Life Technologies, 7001612]). A complete medium change was performed every 2nd day.
ODC phagocytosis and coculture assay
Coculture assays were carried out, as previously described [Citation6]. ODCMOG+ were either UVB irradiated (870 mJ/cm2) or left untreated. cybbfl/fl-Itgax-Cre and Cybbfl/fl-derived splenocytes were isolated, and the frequency of ITGAX+ MHCII+ DCs was determined via FACS using a small aliquot of the splenocyte suspension. Bulk splenocytes from cybbfl/fl-Itgax-Cre and Cybbfl/fl mice were cocultured (10:1 ratio of ODCMOG+ to ITGAX+ MHCII+ DCs) overnight (37°C, 5% CO2) in cell culture dishes with either Ptd-L-Serhi or Ptd-L-Serlo ODCMOG+ in R10 medium supplemented with 1% P-S. The next day, ITGAX+ MHCII+ DCs were FACS-purified (BD FACSAria III 5 L) from all conditions (cybbfl/fl-Itgax-Cre + Ptd-L-Serlo ODCMOG+; cybbfl/fl-Itgax-Cre + Ptd-L-Serhi ODCMOG+; Cybbfl/fl + Ptd-L-Serlo ODCMOG+; Cybbfl/fl + Ptd-L-Serhi ODCMOG+). ITGAX+ MHCII+ DC fractions were further cocultured at 1:5 ratio (DC:T cell) in a 96-well U bottom plate (Sigma, CLS3360) overnight (37°C, 5% CO2) with 2D2/TCRMOG-derived MACS-purified CD4+ T cells (pre-stained with 5 µM CellTraceTM Violet proliferation dye according to the manufacturer’s recommendation, [Thermo Fisher Scientific, C34557]) in a total volume of 200 µl of R10 supplemented with 1% P-S and IL2 (10 ng/ml; R&D Systems, 402-ML-100). Wells containing 2D2/TCRMOG CD4+ T cells only or anti-CD3 and anti-CD28 antibodies (5 µg/ml each) were included. After 24 h of incubation, half of the cell culture supernatants were collected for analysis of IFNG concentrations by ELISA (eBioscience, 88-7314-76). Wells were replenished with additional medium, and on day 5, cells were collected and stained with a viability dye, fluorescently labeled anti-CD3, and anti-CD4 antibodies and analyzed for T cell proliferation.
Leukocyte isolation from the spleen
Tissue was dissected into small pieces and digested for 30 min at 37°C and 5% CO2 with collagenase D (0.4 mg/ml; Sigma, 11088866001) and DNase (20 μg/ml; Qiagen, 79254) in PBS (Thermo Fisher Scientific, 10010023). The digested tissue was passed through a 70-μm cell strainer to obtain single-cell suspensions. Red blood cell lysis (2 min, RT) was performed using ACK lysis buffer (Thermo Fisher Scientific, A1049201). Cell concentration was determined, and samples were kept on ice until further processing.
Leukocyte isolation from CNS
CNS tissue was dissected into small pieces, suspended in digest buffer (collagenase D [0.2 mg/ml; Sigma, 11088866001] and DNase [20 μg/ml; Qiagen, 79254]), and incubated for 40 min at 37°C and 5% CO2. The digested tissue was passed through a 70-μm nylon mesh. Pelleted cells were suspended in 30% Percoll (GE Healthcare, 17-0891-01) in PBS and ultracentrifuged (Sorvall RC6 Plus Superspeed Centrifuge; Thermo Fisher Scientific) for 30 min at 1590 × g at 4°C. Cell concentration was determined, and samples were kept on ice until further processing.
Confocal microscopy
In order to stain for LC3 and CYBB, BMDCs were FACS-purified sorting for ITGAXhi MHCIIhi cells (BD FACSAria III 5 L) and plated in 8-well glass chamber slides (pre-coated with 1× poly-L-lysine [Sigma, P4832] in ddH2O) at a density of 1–2 × 10⁵. Cells were plated 1 d prior to phagocytosis of zymosan particles (Invivogen, TLRL-ZYN) or 2 μm latex beads (Sigma, L0280-1 ML) allowing cells to attach. Cells were incubated with either zymosan or 2 μm latex beads (Ratio 20 zymosan particles: 1 cell) for the indicated time points. Following the phagocytosis assay, cells were washed with PBS and fixed with 4% PFA (Sigma, 1004968350) for 15 min at RT in the dark. After fixation, cells were washed twice with PBS and transferred into a blocking solution (PBS, 1% FCS) for 1 h. After blocking, staining with primary antibodies was performed (LC3: 1:200; MBL International, PM036 and CYBB: 1:100; Santa Cruz Biotechnology, sc-130543) for 1 h at RT. Staining was followed by 2 washes with PBS and incubation with secondary antibodies (Alexa Fluor 488 or Alexa Fluor 555 anti-rabbit or anti-mouse: 1:500; Invitrogen, A11070, A11001) for 45 min at RT. After secondary staining, cells were washed in PBS twice for at least 5 min and counterstained with DAPI (1:5000; Thermo Fisher Scientific, D1306) for 5 min at RT. Three washing steps were performed with PBS for at least 10 min. Slides were mounted with mounting medium (DAKO, S302380-2), kept overnight at RT in the dark and were then transferred to 4°C for long-term storage. Pictures were acquired using a 63×, 1.4 N.A. oil immersion lens with an upright confocal laser scanning microscope (SP8-UV; Leica Microsystems). The acquisition of the data was performed using the LAS Leica Application Imaging software. Analysis of the picture was performed with the Fiji package on ImageJ Software (v1.50i; NIH).
Flow cytometry
Single-cell suspensions were pre-incubated with Fc receptor block (20 min, 4°C, 22.4 μg/ml; clone: 2.4 G2; Bio X Cell, CUS-HB-197) followed by staining with the LIVE/DEAD Fixable Aqua Dead Stain Kit (Thermo Fisher Scientific, L34957) in PBS at 4°C in the dark. Cells were stained with fluorochrome-labeled antibodies in FACS buffer (0.5% BSA [Sigma, 05470] and 0.01% NaN3 [Sigma, S8032-25 G] in PBS) for 30 min at 4°C in the dark. Intracellular cytokines were determined upon ex vivo restimulation with either OVA323–339 peptide (ISQAVHAAHAEINEAGR; InvivoGen, vac-isq), MOG35–55 peptide (both 20 µg/ml), or phorbol 12-myristate 13-acetate (PMA)/ionomycin (PMA: 1:50000, Sigma, P1585; ionomycin: 1:747, Sigma, I3909) in R10 (10% FCS in RPMI-1640) supplemented with 1% P-S. Brefeldin A (10 μg/ml; Sigma, B5936-200UL) was added to block cytokine secretion. Samples were incubated in the restimulation medium at 37°C and 5% CO2 for 4 h, and then washed twice in cold PBS followed by centrifugation at 400 × g and 4°C for 5 min. After surface staining, cells were resuspended in 200 μl of Cytofix/Cytoperm buffer (BD Biosciences, 554714) and incubated for 30 min at 4°C in the dark. Afterward, cells were stained with fluorochrome-labeled antibodies against the proinflammatory cytokines of interest. Samples were immediately recorded with the BD LSRFortessa using FACSDiva software v6.1.3 (BD Biosciences). Analysis was performed using the FlowJo software v9.3.1 (Tree Star).
Determination of cytokine concentration
IL12B, IFNG, and IL17A concentrations in cell culture supernatants were measured using the Mabtech mouse IL12B ELISA development kit (Mabtech, 3451–1 H-6), the mouse IFNG Uncoated ELISA kit (Thermo Fisher Scientific, 88–7314), and the mouse IL17A ELISA Kit (Thermo Fisher Scientific, BMS6001), respectively. All measurements were performed according to the respective manufacturer’s recommendation.
Magnetic activated cell sorting
All magnetic activated cell sorting (MACS) procedures were carried out using magnetic MicroBeads from Miltenyi (anti-ITGAX/CD11c, 130-097-059; anti-CD4, 130-049-201; anti-biotin, 120-000-900) and the autoMACS Pro Separator (Miltenyi, 130-092-545) and in accordance with the provider’s protocol recommendations.
Cell culture
Cells were treated in sterile biological safety hoods and cultured in incubators at 37°C, 5% CO2 with the specific medium containing the appropriate nutritional and survival factors. MOG-overexpressing MO3.13 cells (oligodendroglial cells; ODCMOG+) were cultured in DMEM (Thermo Fisher Scientific, 41965062) supplemented with 1% P-S and 10% FCS.
Histology
For the histological analysis, the spinal cord was dissected and fixed overnight in 4% PFA. The tissues were embedded in paraffin, and sequential sections were processed. The samples were stained with hematoxylin and eosin (HE; Abcam, ab245880), luxol fast blue (LFB-PAS; Sigma, L0294-500 ML) to determine the degree of demyelination, mouse anti-mouse APP (3 µg/ml; clone: 22 C11; Millipore, MAB348) for assessment of axonal damage, rat anti-mouse LAMP2 (2.5 µg/ml; clone: M3/84; BD Pharmigen, 550292) for macrophages/microglia, rat anti-mouse PTPRC/CD45 R/B220 (2.5 µg/ml; clone: RA3-6B2; BD Pharmigen, 561878;) for B cells, rat anti-human CD3E (3.5 µg/ml; mouse cross-reactivity; clone: CD3-12; Bio-Rad, MCA1477 T) for T cells. For APP, LAMP2, PTPRC, and CD3E immunohistochemical analysis, the primary antibodies were incubated overnight (4°C). Biotin-labeled secondary antibodies (2.5 µg/ml, Southern Biotech, 3050–08; 1031–08) were added for 45 min at RT, followed by incubation with streptavidin (Southern Biotech, 7100–05) for 45 min at RT. 3ʹ-diaminobenzidine (DAB) brown chromogen (Dako, K8000) was used for the resolution of the aforementioned antibodies.
For the analysis of T cell proliferation via MKI67, the tissues were stained with rabbit anti-mouse CD4 (1.4 µg/ml; clone: EPR19514; Abcam, ab183685) and rat anti-mouse MKI67 (5 µg/ml; clone: SolA15; eBioscience, 14-5698-82;) for 24 h at 4°C. The secondary antibodies donkey anti-rabbit Alexa Fluor 647 (4 µg/ml, Invitrogen, A31573) and donkey anti-rat Alexa Fluor 488 (4 µg/ml, Invitrogen, A21208) were incubated for 2 h at RT. Nuclei were counterstained with DAPI (Carl Roth, 6335.2).
SDS-PAGE and western blot
Protein quantification was performed, as previously described [Citation6]. Protein samples were diluted with 4× Laemmli buffer (Bio-Rad, 11697498001) and boiled for 5 min at 95°C. 0.75-mm gels were run at 70 V and proteins were transferred onto a pre-activated polyvinylidenefluoride (PVDF) membrane (GE Healthcare, RPN303 F) via a semidry transfer system (Bio-Rad, 170–3940) at 10 V for 1 h. The membrane was blocked for 1 h at RT in blocking solution (4% skimmed milk [Sigma, 70166–500 G] and 0.1% Tween 20 [Sigma, 9005-64-5] in PBS) followed by incubation with primary antibody (anti-CYBB, 1:2000; BD, 611415; HRP-labeled anti-ACTB, 1:50000; Sigma, A3854) diluted in blocking solution overnight at 4°C on a shaker. After washing for at least 5 min with PBS-T (0.1% Tween 20 in PBS), the membrane was incubated for 1 h at RT with secondary antibody (HRP-labeled anti-mouse, 1:50000; Invitrogen, A10668) diluted in blocking solution on a shaker. Pierce ECL Western Blotting Substrate (Thermo Fisher Scientific, 32106) was used to develop the membrane. Protein bands were visualized with a Vilber Fusion FX detector. Application of the automated saturation option in the Fusion software (v17.1) allowed for the selection of unsaturated pictures.
Antibodies
BioLegend
Pacific Blue–conjugated anti-PTPRCb/CD45.2 (clone: 104; 1:400; 109820), APC–conjugated anti-mouse H2-Ab1 (clone: M5/114.15.2; 1:800; 107614), Brilliant Violet 650–conjugated anti-CD86 (clone: GL-1; 1:200; 105035), PE-Cy7–conjugated anti-ITGAX/CD11c (clone: N418; 1:400; 117318), PE–conjugated anti-PTPRCa/CD45.1 (clone: A.20; 1:200; 110707), PerCP-Cy5.5 – and biotin–conjugated anti-LY6C1 (clone: HK1.4; 1:200; 128012 and 128004), APC-Cy7–conjugated anti-ITGAM/CD11b (clone: M1/70; 1:200; 101226), Pacific Blue–conjugated anti-CD19 (clone: 6D5; 1:400; 115523), Brilliant Violet 785–conjugated anti-CD8A (clone: 53–6.7; 1:100; 100750), Alexa Fluor 700–conjugated anti-LY6G (clone: 1A8; 1:200; 127622), APC–conjugated anti-CD4 (clone: GK1.5; 1:200; 100412), Brilliant Violet 605–conjugated anti-IL2RA/CD25 (clone: PC61; 1:200; 102036), FITC–conjugated anti-IFNG (clone: XMG1.2; 1:400, 505806), PE-Cy7–conjugated anti-IL17A (clone: TC11/18H10; 1:200, 506922), PE-Cy–conjugated anti-CD40 (clone: 3/23; 1:50; 124622), unconjugated IgG2a, kappa isotype control antibody (clone: MOPC-173; 15 µg/ml, 400202).
eBioscience
Alexa Fluor 700–conjugated anti-CD19 (clone: eBio1D3; 1:200;56-0193-82), Alexa Fluor 700–conjugated anti-CD4 (clone: GK1.5; 1:200; 56-0041-82), PE–conjugated anti-SIGLECH (clone: eBio440 c; 1:800; 12-0333-82), PerCP-Cy5.5–conjugated anti-FOXP3 (clone: FJK-16 s; 1:100; 45-5773-82).
BD Biosciences
APC-Cy7–conjugated anti-PTPRC/CD45 (clone: 30-F11; 1:400; 557659), PE-CF594–conjugated anti-CD8A (clone: 53–6.7; 1:400; 562283), PE–conjugated anti-CSF2/GM-CSF, (clone: MP1-22E9; 1:250, 55440), Unconjugated anti-CD3E (clone: 145-2C11; 5 μg/ml; 553058), unconjugated anti-CD28 (clone: 37.51; 5 μg/ml; 553295).
Others
anti-CYBB (1:2000; clone: 53; BD, 611415 and 1:100; clone: 54.1; Santa Cruz, sc-130543 PE), HRP-labeled anti-ACTB (1:50000; Sigma, A3854) unconjugated anti-LC3 (1:200; MBL, PM036), HRP–conjugated goat anti-mouse IgG (1:10000; Bio-Rad, 172-1011-MSDS), HRP–conjugated ACTB (1:50000; clone: 13G11; Biomol, 137402.100), unconjugated anti-CD40 (15 µg/ml; clone: FGK4.5/FGK45; Bio X Cell, BE0016 – 2), unconjugated anti-FCGR3/CD16 and FCGR2B/CD32 (22.4 μg/ml; clone: 2.4G2; Bio X Cell, CUS-HB-197), anti-MOG (clone: 8-18C5 [Citation6],).
Statistical analysis
Statistical tests applied are indicated in the respective figure legends. Unpaired, two-tailed student t-test and two-way ANOVA were performed. A P-value < 0.05 was considered statistically significant. The asterisks depicted in the figures translate into the following grouping: *P < 0.05, **P < 0.01, ***P < 0.001. All quantitative analyses were performed with GraphPad Prism v5.0a for Mac OSX (GraphPad Software, Inc).
Supplemental Material
Download MS Word (3.9 MB)Acknowledgments
We thank Dr. Fabienne Brilot (University of Sydney, Australia) for providing the MOG-overexpressing MO3.13 oligodendroglial cell lines, Anne Müller (University of Zurich, Switzerland), Kerstin Stein and Keertana Srimat Kandadai (University of Münster) for excellent technical assistance, Dr. Melanie Greter (University of Zurich, Switzerland) for valuable discussions and the Flow cytometry facility of the University of Zurich for cell sorting support. A.M.S. is supported by the British Heart Foundation. J.D.L. was supported by the Swiss National Foundation (31003A-169664), the Novartis Foundation for medical-biological research, the Sassella Foundation, the Hartmann Müller Foundation, and the Swiss Multiple Sclerosis Society.
Disclosure statement
The authors have declared that no conflict of interest exists.
Supplementary material
Supplemental data for this article can be accessed here.
Additional information
Funding
References
- Steinman L. No quiet surrender: molecular guardians in multiple sclerosis brain. J Clin Invest. 2015;125:1371–1378.
- Bartholomäus I, Kawakami N, Odoardi F, et al. Effector T cell interactions with meningeal vascular structures in nascent autoimmune CNS lesions. Nature. 2009;462:94–98.
- Croxford AL, Lanzinger M, Hartmann FJ, et al. The cytokine GM-CSF drives the inflammatory signature of CCR2+ monocytes and licenses autoimmunity. Immunity. 2015;43:502–514.
- Jordão MJC, Sankowski R, Brendecke SM, et al. Single-cell profiling identifies myeloid cell subsets with distinct fates during neuroinflammation. Science. 2019;363:eaat7554.
- Mundt S, Mrdjen D, Utz SG, et al. Conventional DCs sample and present myelin antigens in the healthy CNS and allow parenchymal T cell entry to initiate neuroinflammation. Sci Immunol. 2019;4:eaau8380.
- Keller CW, Sina C, Kotur MB, et al. ATG-dependent phagocytosis in dendritic cells drives myelin-specific CD4+ T cell pathogenicity during CNS inflammation. Proc Natl Acad Sci USA. 2017;114:E11228–E11237.
- Rastogi R, Geng X, Li F, et al. NOX activation by subunit interaction and underlying mechanisms in disease. Front Cell Neurosci. 2016;10:301.
- Fischer MT, Sharma R, Lim JL, et al. NADPH oxidase expression in active multiple sclerosis lesions in relation to oxidative tissue damage and mitochondrial injury. Brain. 2012;135:886–899.
- Nikić I, Merkler D, Sorbara C, et al. A reversible form of axon damage in experimental autoimmune encephalomyelitis and multiple sclerosis. Nat Med. 2011;17:495–499.
- Wu D-C, Teismann P, Tieu K, et al. NADPH oxidase mediates oxidative stress in the 1-methyl-4-phenyl-1,2,3,6-tetrahydropyridine model of Parkinson’s disease. Proc Natl Acad Sci USA. 2003;100:6145–6150.
- Dohi K, Ohtaki H, Nakamachi T, et al. Gp91phox (NOX2) in classically activated microglia exacerbates traumatic brain injury. J Neuroinflammation. 2010;7:41.
- Martinez J, Malireddi RKS, Lu Q, et al. Molecular characterization of LC3-associated phagocytosis reveals distinct roles for Rubicon, NOX2 and autophagy proteins. Nat Cell Biol. 2015;17:893–906.
- Martinez J, Cunha LD, Park S, et al. Noncanonical autophagy inhibits the autoinflammatory, lupus-like response to dying cells. Nature. 2016;533:115–119.
- Cunha LD, Yang M, Carter R, et al. LC3-associated phagocytosis in myeloid cells promotes tumor immune tolerance. Cell. 2018;175:429–441.e16.
- Romao S, Gasser N, Becker AC, et al. Autophagy proteins stabilize pathogen-containing phagosomes for prolonged MHC II antigen processing. J Cell Biol. 2013;203:757–766.
- Ma J, Becker C, Lowell CA, et al. Dectin-1-triggered recruitment of light chain 3 protein to phagosomes facilitates major histocompatibility complex class II presentation of fungal-derived antigens. J Biol Chem. 2012;287:34149–34156.
- Mrdjen D, Pavlovic A, Hartmann FJ, et al. High-dimensional single-cell mapping of central nervous system immune cells reveals distinct myeloid subsets in health, aging, and disease. Immunity. 2018;48:380–395.e6.
- Meredith MM, Liu K, Darrasse-Jeze G, et al. Expression of the zinc finger transcription factor zDC (Zbtb46, Btbd4) defines the classical dendritic cell lineage. J Exp Med. 2012;209:1153–1165.
- Satpathy AT, KC W, Albring JC, et al. Zbtb46 expression distinguishes classical dendritic cells and their committed progenitors from other immune lineages. J Exp Med. 2012;209:1135–1152.
- Loschko J, Schreiber HA, Rieke GJ, et al. Absence of MHC class II on cDCs results in microbial-dependent intestinal inflammation. J Exp Med. 2016;213:517–534.
- Prinz M, Erny D, Hagemeyer N. Ontogeny and homeostasis of CNS myeloid cells. Nat Immunol. 2017;18:385–392.
- Giles DA, Duncker PC, Wilkinson NM, et al. CNS-resident classical DCs play a critical role in CNS autoimmune disease. J Clin Invest. 2018;128:5322–5334.
- Mildner A, Mack M, Schmidt H, et al. CCR2+Ly-6Chi monocytes are crucial for the effector phase of autoimmunity in the central nervous system. Brain. 2009;132:2487–2500.
- Yamasaki R, Lu H, Butovsky O, et al. Differential roles of microglia and monocytes in the inflamed central nervous system. J Exp Med. 2014;211:1533–1549.
- Isaksson M, Lundgren BA, Ahlgren KM, et al. Conditional DC depletion does not affect priming of encephalitogenic Th cells in EAE. Eur J Immunol. 2012;42:2555–2563.
- Yogev N, Frommer F, Lukas D, et al. Dendritic cells ameliorate autoimmunity in the CNS by controlling the homeostasis of PD-1 receptor(+) regulatory T cells. Immunity. 2012;37:264–275.
- Lam GY, Huang J, Brumell JH. The many roles of NOX2 NADPH oxidase-derived ROS in immunity. Semin Immunopathol. 2010;32:415–430.
- Allan ERO, Tailor P, Balce DR, et al. NADPH oxidase modifies patterns of MHC class II-restricted epitopic repertoires through redox control of antigen processing. J Immunol. 2014;192:4989–5001.
- Delamarre L, Pack M, Chang H, et al. Differential lysosomal proteolysis in antigen-presenting cells determines antigen fate. Science. 2005;307:1630–1634.
- Lennon-Duménil A-M, Bakker AH, Maehr R, et al. Analysis of protease activity in live antigen-presenting cells shows regulation of the phagosomal proteolytic contents during dendritic cell activation. J Exp. Med. 2002;196:529–540.
- Trombetta ES, Ebersold M, Garrett W, et al. Activation of lysosomal function during dendritic cell maturation. Science. 2003;299:1400–1403.
- Savina A, Jancic C, Hugues S, et al. NOX2 controls phagosomal pH to regulate antigen processing during crosspresentation by dendritic cells. Cell. 2006;126:205–218.
- Savina A, Peres A, Cebrian I, et al. The small GTPase Rac2 controls phagosomal alkalinization and antigen crosspresentation selectively in CD8(+) dendritic cells. Immunity. 2009;30:544–555.
- Huang J, Canadien V, Lam GY, et al. Activation of antibacterial autophagy by NADPH oxidases. Proc Natl Acad Sci U.S.A. 2009;106:6226–6231.
- Florey O, Kim SE, Sandoval CP, et al. Autophagy machinery mediates macroendocytic processing and entotic cell death by targeting single membranes. Nat Cell Biol. 2011;13:1335–1343.
- Fletcher K, Ulferts R, Jacquin E, et al. The WD40 domain of ATG16L1 is required for its non-canonical role in lipidation of LC3 at single membranes. Embo J. 2018;37:24.
- Hamann JC, Surcel A, Chen R, et al. Entosis is induced by glucose starvation. Cell Rep. 2017;20:201–210.
- Heckmann BL, Teubner BJW, Tummers B, et al. LC3-associated endocytosis facilitates β-amyloid clearance and mitigates neurodegeneration in Murine Alzheimer’s disease. Cell. 2019;178:536–551.e14.
- Bhattacharya A, Parillon X, Zeng S, et al. Deficiency of autophagy in dendritic cells protects against experimental autoimmune encephalomyelitis. J Biol Chem. 2014;289:26525–26532.
- Higgins GC, Beart PM, Shin YS, et al. Oxidative stress: emerging mitochondrial and cellular themes and variations in neuronal injury. J Alzheimers Dis. 2010;20:S453–73.
- Witte ME, Geurts JJG, de Vries HE, et al. Mitochondrial dysfunction: a potential link between neuroinflammation and neurodegeneration? Mitochondrion. 2010;10:411–418.
- Dong Y, Yong VW. When encephalitogenic T cells collaborate with microglia in multiple sclerosis. Nat Rev Neurol. 2019;15:704–717.
- Wolf Y, Shemer A, Levy-Efrati L, et al. Microglial MHC class II is dispensable for experimental autoimmune encephalomyelitis and cuprizone-induced demyelination. Eur J Immunol. 2018;48:1308–1318.
- Sag CM, Schnelle M, Zhang J, et al. Distinct regulatory effects of myeloid cell and endothelial cell NAPDH oxidase 2 on blood pressure. Circulation. 2017;135:2163–2177.