
ABSTRACT
SCAP (SREBF chaperone) regulates SREBFs (sterol regulatory element binding transcription factors) processing and stability, and, thus, becomes an emerging drug target to treat dyslipidemia and fatty liver disease. However, the current known SCAP inhibitors, such as oxysterols, induce endoplasmic reticulum (ER) stress and NR1H3/LXRα (nuclear receptor subfamily 1 group H member 3)-SREBF1/SREBP-1 c-mediated hepatic steatosis, which severely limited the clinical application of this inhibitor. In this study, we identified a small molecule, lycorine, which binds to SCAP, which suppressed the SREBF pathway without inducing ER stress or activating NR1H3. Mechanistically, lycorine promotes SCAP lysosomal degradation in a macroautophagy/autophagy-independent pathway, a mechanism completely distinct from current SCAP inhibitors. Furthermore, we determined that SQSTM1 captured SCAP after its exit from the ER. The interaction of SCAP and SQSTM1 requires the WD40 domain of SCAP and the TB domain of SQSTM1. Interestingly, lycorine triggers the lysosome translocation of SCAP independent of autophagy. We termed this novel protein degradation pathway as the SQSTM1-mediated autophagy-independent lysosomal degradation (SMAILD) pathway. In vivo, lycorine ameliorates high-fat diet-induced hyperlipidemia, hepatic steatosis, and insulin resistance in mice. Our study demonstrated that the inhibition of SCAP through the SMAILD pathway could be employed as a useful therapeutic strategy for treating metabolic diseases.
Abbreviation: 25-OHD: 25-hydroxyvitamin D; 3-MA: 3-methyladenine; ABCG5: ATP binding cassette subfamily G member 5; ABCG8: ATP binding cassette subfamily G member 8; ACACA: acetyl-CoA carboxylase alpha; AEBSF: 4-(2-aminoethyl) benzenesulfonyl fluoride hydrochloride; AHI: anhydroicaritin; AKT/protein kinase B: AKT serine/threonine kinase; APOE: apolipoprotein E; ATF6: activating transcription factor 6; ATG: autophagy-related; BAT: brown adipose tissue; CD274/PD-L1: CD274 molecule; CETSA: cellular thermal shift assay; CMA: chaperone-mediated autophagy; COPII: cytoplasmic coat protein complex-II; CQ: chloroquine; DDIT3/CHOP: DNA damage inducible transcript 3; DNL: de novo lipogenesis; EE: energy expenditure; EGFR: epithelial growth factor receptor; eMI: endosomal microautophagy; ERN1/IRE1α: endoplasmic reticulum to nucleus signaling 1; FADS2: fatty acid desaturase 2; FASN: fatty acid synthase; GOT1/AST: glutamic-oxaloacetic transaminase 1; GPT/ALT: glutamic-pyruvate transaminase; HMGCR: 3-hydroxy-3-methylglutaryl-CoA reductase; HMGCS1: 3-hydroxy-3-methylglutaryl-CoA synthase 1; HSP90B1/GRP94: heat shock protein 90 beta family member 1; HSPA5/GRP78: heat hock protein family A (Hsp70) member 5; HSPA8/HSC70: heat shock protein family A (Hsp70) member 8; INSIG1: insulin induced gene 1; LAMP2A: lysosomal associated membrane protein 2A; LDLR: low density lipoprotein receptor; LyTACs: lysosome targeting chimeras; MAP1LC3B/LC3B: microtubule associated protein 1 light chain 3 beta; MBTPS1: membrane bound transcription factor peptidase, site 1; MEF: mouse embryonic fibroblast; MST: microscale thermophoresis; MTOR: mechanistic target of rapamycin kinase; MVK: mevalonate kinase; PROTAC: proteolysis targeting chimera; RQ: respiratory quotient; SCAP: SREBF chaperone; SCD1: stearoyl-coenzemy A desaturase 1; SMAILD: sequestosome 1 mediated autophagy-independent lysosomal degradation; SQSTM1: sequestosome 1; SREBF: sterol regulatory element binding transcription factor; TNFRSF10B/DR5: TNF receptor superfamily member 10b; TRAF6: TNF receptor associated factor 6; UPR: unfolded protein response; WAT: white adipose tissue; XBP1: X-box binding protein 1
Introduction
The treatment of the metabolic syndrome induced by lipid disorders could potentially be aided by attenuating the synthesis of lipids. The central players in regulating lipid biosynthesis are a group of transcription factors termed SREBF/SREBPs, which includes three isoforms (SREBF1a, SREBF1c, and SREBF2) with distinct but overlapping functions. After synthesis, SREBFs are sequestered in the endoplasmic reticulum (ER) as precursor forms [Citation1,Citation2]. In the presence of cholesterol, SCAP, an ER-to-Golgi transport protein, undergoes a conformational change, and preserves SREBFs in the ER by forming a complex with INSIG1 (insulin induced gene 1). When cholesterol level falls, INSIG1 dissociates from the SCAP-SREBFs complex, allowing the complex to migrate to the Golgi apparatus, where SREBFs are cleaved by MBTPS1 and MBTPS2 [Citation3,Citation4]. The cleaved SREBFs are then translocated to the nucleus and initiate expression of a number of lipogenic genes containing SRE (sterol regulatory element) in their promoters [Citation5]. In addition to acting as an escort protein for SREBFs, physical association with SCAP seems to stabilize SREBFs. In Scap-deficient CHO cells, both the precursor and the nuclear form of SREBFs disappear. Without SCAP, SREBFs in the ER are unstable and cannot translocate to the Golgi apparatus. In hepatic Scap-deficient mice, all three SREBFs in the nucleus reduced dramatically, leading to an 80% decrease of cholesterol and fatty acid synthesis rate in the liver. Consequently, lipid synthesis was reduced to prevent fatty livers in db/db mice and sucrose-fed hamsters [Citation6]. As SCAP is an indispensable protein for the transport and activation of all three SREBF isoforms, targeting SCAP may be an attractive strategy for the treatment of metabolic diseases.
To date, a series of SCAP inhibitors have been reported, including cholesterol, fatostatin, and betulin [Citation7–9]. These compounds bind to SCAP and stabilize the SREBFs-SCAP-INSIG1 complex. Oxysterols, such as 25-hydroxycholesterol, 24(S)-hydroxycholesterol, and 27-hydroxycholesterol, do not cause SCAP conformational change, but still, elicit SCAP-INSIG1 binding [Citation10]. As these compounds abrogate the movement of the SCAP-SREBFs complex to the Golgi apparatus, SREBFs activities are inhibited, alleviating the symptoms of metabolic diseases, such as obesity, hyperlipidemia, and insulin resistance [Citation11]. However, accumulation of free cholesterol (FC) in the ER activates unfolded/misfolded protein accumulation, thus, increases ER stress and apoptosis [Citation12–14]. Although sterols bind to SCAP and inhibit SREBFs processing, sterols also activate ER stress signaling, such as the induction of DDIT3/CHOP (DNA damage inducible transcript 3) [Citation12,Citation15,Citation16]. Prolonged ER stress induces cardiac myocytes apoptosis [Citation17], fat accumulation, insulin resistance, and nonalcoholic steatohepatitis [Citation18,Citation19]. Meanwhile, oxysterols also activate NR1H3/LXR (nuclear receptor subfamily 1 group H member 3) [Citation20]. On the one hand, the activation of NR1H3 induces reverse cholesterol transport [Citation21–25], thus, inhibits the development of atherosclerosis in animal models. On the other hand, NR1H3 agonists also increase lipogenesis via SREBF1 c, resulting in hypertriglyceridemia and liver steatosis [Citation7,Citation22]. Hence, ideal SCAP inhibitors should inhibit the SREBF pathway without activating ER stress or NR1H3 to treat atherosclerosis and type-2 diabetes.
In the current study, using AlphaScreen-based cellular thermal shift assay (CETSA), we identified lycorine as a small compound that binds to SCAP. Unlike most other SCAP inhibitors, lycorine downregulates the SCAP protein level without changing its transcription. Once SCAP undergoes degradation, SREBFs are released and undergo ubiquitin-mediated protein degradation. Interestingly, SCAP is transferred to the lysosome for degradation in an autophagy-independent pathway. IP-MS data indicate that this process is mediated by SQSTM1. Compared to sterols, lycorine neither induces ER stress nor activates NR1H3. Lycorine treatment decreased the lipid levels in serum and tissues and increased insulin sensitivity in high-fat diet (HFD)-induced obese mice.
Results
Chemical screen and identification of lycorine, which directly binds to SCAP
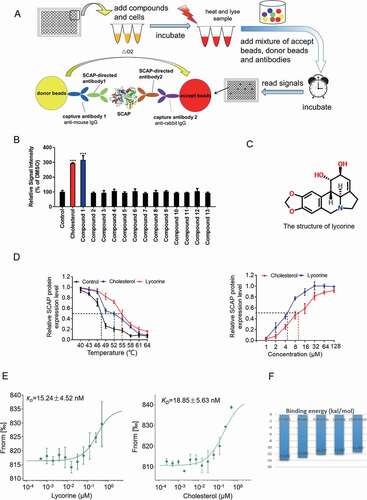
SCAP has been used as a target for the treatment of hyperlipidemia (http://bidd.nus.edu.sg/BIDD-Databases/TTD/). However, as an integral membrane protein located in the ER, screening for its direct inhibitors is very difficult. To identify small molecules directly targeting SCAP, an in vitro high-throughput assay system was established using AlphaScreen-based cellular thermal shift assay (CETSA) [Citation26–28]. The scheme for the screening process was shown in . If a compound binds with SCAP, the thermal stability will increase, and consequently, the signal corresponding to SCAP levels by AlphaScreen is elevated. Hundreds of compounds from our natural product library [Citation29] were screened using this assay system (). Representative results were shown in as a histogram of the AlphaScreen signal. Cholesterol was used as a positive control that interacts with SCAP [Citation10]. Lycorine (compound 1), an indolizidine alkaloid (), was found to significantly increase the AlphaScreen signal (). Further, it was shown that lycorine increased the thermal stability of SCAP in temperature- and dose-dependent manners (). Using the microscale thermophoresis (MST) method [Citation30,Citation31], the dissociation constant (KD) between lycorine and SCAP was determined as 15.24 ± 4.52 nM (), similar to that of cholesterol (KD = 18.85 ± 5.63 nM). The binding energy between SCAP (from fission yeast) [Citation32] and small molecules, including cholesterol, 25-hydroxyvitamin D (25OHD), betulin, fatostatin, and lycorine was calculated by the Molecular Operating Environment (MOE) (). Among these inhibitors of SCAP, 25OHD had the lowest binding energy (−13.892 kCal/mol). The binding energy of lycorine is −12.087 kCal/mol, which is comparable to that of cholesterol (). The software suite constructed models of the SCAP-inhibitors complex by homology modeling and ligand docking (Fig. S1A-E). In the computer simulation, we found two hydrogen bonds formed between the amino acid residues (A1029 and Y793) of yeast SCAP and lycorine in the WD40 domain (Fig. S1A). Guided by the docking model, we designed two points mutation in SCAP protein at the complex interface (A1029E, Y793E). The mutated SCAP protein is predicted to maintain the structural integrity and function (Fig. S1F), but the binding to lycorine was disrupted (Fig. S1G). Together, these results demonstrated that lycorine is a specific SCAP-binding compound.
Figure 1. Screen and identification of lycorine as an inhibitor of SCAP. (A) A scheme for in vitro screening of small molecules that bind SCAP. (B) Screening results of compounds targeting SCAP. Each compound (10 μM) was used for screening, as described in Figure 1A (n = 4). (C) The chemical structure of lycorine. (D) Dose- and temperature-dependent CETSA were performed to verify the interaction of lycorine with SCAP (n = 3). (E) The interaction between SCAP and lycorine or cholesterol was detected by MST. Lycorine is dissolved in DMSO and cholesterol is dissolved in ethanol (n = 3). (F) The binding energy of small molecules with SCAP. Error bars are represented as mean ± SEM. Statistical analysis was done with one-way ANOVA (Dunnett’s posttest). *p < 0.05, **p < 0.01, ***p < 0.001 vs control
Lycorine inhibits SREBFs activity and decreases cellular lipid levels without affecting ER stress or NR1H3 activity
The stability of SREBFs depends on the escort protein, SCAP, which is necessary for the activation of all the three SREBF isoforms [Citation33]. Next, the effect of lycorine on SREBFs activity was directly examined and compared with that of sterol [Citation34]. Lycorine significantly suppressed SREBFs activity (up to ~70%) in a dose-dependent manner () and did not cause obvious cytotoxicity (). Lycorine dose- and time-dependently decreased the mature SREBF1 ) and SREBF2 proteins (,). Interestingly, unlike the effect of sterol, which significantly increased the precursor SREBFs (,), lycorine, instead, decreased the levels of precursor SREBF1 and SREBF2 (), indicating that the mechanism of lycorine is different from that of sterol. Genes in cholesterol synthetic pathway, such as HMGCR (3-hydroxy-3-methylglutaryl-CoA reductase), HMGCS1 (3-hydroxy-3-methylglutaryl-CoA synthase 1), MVK (mevalonate kinase), and LDLR (low density lipoprotein receptor) were all reduced by lycorine treatment (). Similarly, genes involved in fatty acid and triglyceride syntheses, such as FASN (fatty acid synthase), ACACA (acetyl-CoA carboxylase alpha), SCD1 (stearoyl-CoA desaturase 1), and FADS2 (fatty acid desaturase 2) were significantly downregulated by lycorine (). Interestingly, lycorine did not affect the protein level of ATF6 (activating transcription factor 6) (Fig. S2A), which has a similar maturation process as SREBFs [Citation35]. Together, these results suggest that lycorine directly binds to SCAP and inhibits SREBFs activity by different mechanisms of sterol.
Figure 2. Lycorine inhibits the SREBF activity and decreases the cellular lipids without inducing ER stress and NR1H3 transactivation. (A) Lycorine downregulates SREBF activity. HL-7702/SRE-Luc cells were depleted of incubating in medium D for 16 h. The cells then were treated with different compounds as indicated. After incubation of another 16 h, cells were lysed with reporter lysis buffer and luciferase activity was measured (n = 4). (B) HL-7702 cells were treated with increasing concentrations of lycorine for 24 h, and cell viability was detected by MTT (n = 6). (C-F) HL-7702 cells were treated with cholesterol (20 μM) or lycorine (10, 20 μM) for 12 h (C and E), or lycorine (20 μM) for increasing time (D and F), whole-cell extracts underwent western blotting (WB) with indicated antibodies (left). Statistical analysis of expression of each protein was adjusted to ACTB (right) (n = 3). pSREBF1 or pSREBF2 represents precursor SREBF1 or precursor SREBF2; mSREBF1 or mSREBF2 represents mature SREBF1 or mature SREBF2. (G) HL-7702 cells were treated with 10 or 20 µM lycorine for 12 h, RNAs were extracted from these cells. The expression of various genes was analyzed by qRT-PCR (n = 3). (H) The cellular TG and TC contents were measured in HL-7702 hepatocytes treated with lycorine (5, 10 and 20 µM) for 16 h (n = 3). (I) HL-7702 cells were treated with indicated concentrations of lycorine for 16 h. 1–14 C-labeled acetic acid sodium salt was directly added into the medium and incubated for an additional 2 h. The fatty acid and total cholesterol were extracted and resolved by thin-layer chromatography. Radioactive products were visualized by phosphoimager and densitometric quantification is shown accordingly (n = 3). (J) The treated HL-7702 cells were fixed and stained with Filipin or Nile-Red. Quantification of the cellular cholesterol or neutral lipids was analyzed by image-pro plus (n = 3). (K) HL-7702 cells were treated with lycorine or sterol for 16 h, then RNAs were extracted. The expression of ER stress-related genes was analyzed by qRT-PCR (n = 3). (L) HL-7702 cells transfected with NR1H3 reporter and beta-gal plasmid were incubated with lycorine or sterol for 16 h, luciferase activity was then measured and normalized by the value of beta-gal (n = 6). (M) HL-7702 cells were treated with lycorine or sterol for 16 h, RNAs were extracted. The expression of NR1H3 target genes were analyzed by qRT-PCR (n = 3). Error bars are represented as mean ± SEM. Statistical analysis was done with one-way ANOVA (Dunnett’s posttest). *p < 0.05, **p < 0.01, ***p < 0.001 vs control
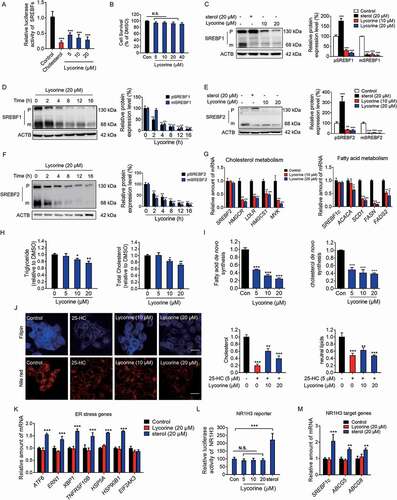
Consistent with the reduced expression of lipogenesis-related genes, lycorine treatment caused a significant decrease in the cellular level of total cholesterol (TC) and triglyceride (TG) in a concentration-dependent manner (). To measure de novo lipogenesis (DNL), [1–14 C] sodium acetate was used to measure the incorporation of 14 C into fatty acids or cholesterol [Citation36]. Lycorine significantly inhibited the DNL of both cholesterol and fatty acid in hepatocytes (). The reduced accumulation of cellular cholesterol and neutral lipids could be verified by filipin and Nile Red staining, respectively (). Consistent with the previous reports, sterols significantly increased gene expressions involved in ER stress, such as ATF6, ERN1 (endoplasmic reticulum to nucleus signaling 1), XBP1 (X-box binding protein 1), TNFRSF10B/DR5 (tumor necrosis factor receptor superfamily member 10b), HSPA5/GRP78 (heat shock protein family A [Hsp70] member 5) and HSP90B1/GRP94 (heat shock protein 90 beta family member 1) (), suggesting induced ER stress [Citation15,Citation37]. In contrast, lycorine did not influence the expression of ER stress-related genes (). Sterols also activated NR1H3 transcription activity that, in turn, upregulate the mRNA and protein levels of SREBF1 (,,). Consistent with the result of NR1H3 reporter assay, other NR1H3 target genes, including ABCG5 (ATP binding cassette subfamily G member 5) and ABCG8 (ATP binding cassette subfamily G member 8), were upregulated by sterols treatment (). In contrast, lycorine neither increased the NR1H3 reporter activity () nor affected the expression of NR1H3 target genes (). It was previously shown that sterols cause the accumulation of the precursor form of SREBFs, with a concomitant decrease in the mature form of SREBFs (,) [Citation10]. In contrast, lycorine treatment caused the decay of both precursor and mature SREBFs. This effect was neither due to inhibition of the phosphoinositide 3-kinase/PI3 K-AKT-MTOR (Fig. S2B) pathway nor to decreased transcription of SREBFs () [Citation38]. These results demonstrated that lycorine decreases cellular lipid levels through inhibiting SREBFs activity without affecting ER stress and NR1H3 activity, which is completely different from sterols.
Lycorine accelerates the degradation of SCAP
SREBF levels are essentially undetectable in Scap-deficient CHO-K1 cells and hepatic scap-deficient mice [Citation6]. After binding to SCAP, lycorine significantly decreased the SCAP protein level, a phenotype distinct from other SCAP inhibitors, such as anhydroicaritin (AHI), 25-HC, cholesterol, botulin, and fatostatin (). Putting back sterols reversed the effects of lycorine on SCAP, suggesting that there might be a competing relationship between these two different kinds of compounds (). Lycorine treatment decreased the SCAP protein level in time- and dose-dependent manners in HL-7702 cells (,) and HepG2 cells (Fig. S2C-D). Lycorine seems to regulate SCAP at the post-translational level since the exogenously overexpressed SCAP was also reduced by lycorine treatment (Fig. S2E). As SCAP protein level falls after lycorine treatment, SREBFs were then released and underwent degradation (Fig. S3A and S3B) [Citation33]. The accelerated SREBFs protein degradation was due to the increased polyubiquitination (Fig. S3C). Moreover, the degradation of SREBF1 was reversed by MG-132, a proteasome inhibitor (Fig. S3D), indicating that this degradation process depends on the proteasome pathway. Furthermore, overexpression of SCAP in HL-7702 cells largely reversed the lycorine-induced SREBFs degradation (). In SCAP KO hepatocytes, lycorine did not further decrease the precursor SREBF1 protein level (). These results suggest that lycorine decreases the stability of SREBFs through diminishing SCAP.
Figure 3. Lycorine decreases SCAP protein. (A) HL-7702 cells were treated with indicated compounds for 8 h, whole-cell extracts underwent WB with indicated antibodies. Statistical analysis of the expression of each protein was adjusted to ACTB (n = 3). (B) HL-7702 cells were pretreated with 10 μM sterol for 1 h, afterward, the cells were supplemented with 20 µM lycorine for 8 h, SCAP was detected by WB. Expression of each protein was adjusted to ACTB. Statistical analysis is on the right side (n = 3). (C-D) HL-7702 cells were treated with lycorine of indicated concentrations for 16 h (C), or lycorine (10 μM) with increasing time (D), whole-cell extracts underwent WB with indicated antibodies. Expression of each protein was adjusted to ACTB. Statistical analysis is on the right side (n = 3). (E) HL-7702 cells were transfected with MYC-SCAP plasmid for 24 h. The cells were incubated in medium D for 16 h and switched to medium D containing lycorine for 8 h. Then, the whole-cell extracts underwent WB with indicated antibodies (n = 3). (F) The wildtype or SCAP KO HL-7702 cells were incubated in medium D for 16 h and switched to medium D containing lycorine for 8 h, the whole-cell extracts underwent WB with indicated antibodies (n = 3). (G and H) SCAP KO HL-7702 cells (G) or SCAP KO HL-7702 cells transfected with MYC-SCAP (H) were treated with lycorine or sterol for 16 h, RNAs were extracted. The expression of ER stress-related genes was analyzed by qRT-PCR (n = 3). Error bars are represented as mean ± SEM. Statistical analysis was done with one-way ANOVA (Dunnett’s posttest). *p < 0.05, **p < 0.01, ***p < 0.001
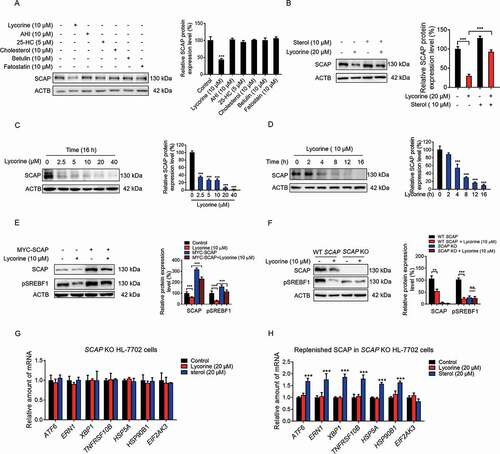
Because SCAP acts as a “receptor” for sterols in the ER [Citation33], we hypothesized that SCAP might mediate sterols-induced ER stress. The stimulated ER stress gene expression by sterols () was totally blunted in SCAP KO hepatocytes (). Replenishing SCAP restored the sterols-induced ER stress gene expression in SCAP KO hepatocytes (), suggesting that SCAP mediates sterol-induced ER stress-related gene expression. Regardless of SCAP expression level, lycorine treatment did not activate ER stress-related gene expression (, ,). As the ER stress is involved in the development of insulin resistance and progression to type-2 diabetes [Citation39]. This specific feature of lycorine might be superior to sterols.
Lycorine accelerates SCAP degradation in a proteasome- and autophagy-independent lysosomal pathway
Next, we investigated how lycorine reduced the SCAP protein level. As lycorine decreased SCAP protein in time- and concentration-dependent manners (,, and S2C-E), without changing the mRNA level of SCAP (), we reasoned that lycorine might influence SCAP at the post-transcriptional level. In the presence of protein synthesis inhibitor, cycloheximide, the degradation of SCAP protein was accelerated (), suggesting that lycorine promoted SCAP degradation. Surprisingly, when cells were treated with MG-132, AEBSF, or a protease inhibitors cocktail, lycorine-induced SCAP degradation was not reversed (Fig. S4A). Moreover, lycorine did not increase the ubiquitylation of SCAP (Fig. S4B), distinct from 25OHD, which induces the proteolytic processing and ubiquitin-mediated degradation of SCAP [Citation40]. These results suggest that lycorine induces SCAP degradation independent of the ubiquitin-proteasome pathway.
Figure 4. Lycorine accelerates SCAP degradation in an autophagy-independent manner. (A) HL-7702 cells were treated with lycorine for indicated dose and time. The SCAP mRNA level was analyzed by qRT-PCR (n = 3). (B) HL-7702 cells were incubated with 50 µM cycloheximide for 1 h, afterward, the cells were supplemented with 50 µM cycloheximide plus vehicle (DMSO), or 10 µM lycorine for indicated time. SCAP was detected by WB (n = 3). (C, E and F) HL-7702 cells were pretreated with 10 mM 3-MA (C), bafilomycin A1 (E) or an inhibitor mixture (10 mM NH4Cl and 100 µM leupeptin) (F) for 1 h. Afterward, the cells were supplemented with 20 µM lycorine for 8 h, SCAP was detected by WB (n = 3). (D) The wild type, atg5−/-, atg3−/- and atg7−/- MEF cells were treated with or without 20 µM lycorine for 8 h. The SCAP protein was detected by WB (n = 3). (G) HL-7702 cells were transfected with EGFP-SCAP for 24 h, then the cells were treated with 20 µM lycorine for 4 h, the lysosome was stained with LysoTracker™ Red. After the treatment, the images were captured with confocal microscopy (n = 3). Quantification of colocalizations. The analysis of Mander’s colocalization coefficient was performed as detailed in the Materials and Methods. (H-K) The wild type (H), atg3−/- (I), atg5−/- (J) or atg7−/- (K) MEF cells were pretreated with or without fatostatin (20 µM) for 1 h. The cells then were treated with or without 20 µM lycorine for 4 h. After the treatment, the images were captured with confocal microscopy (n = 3). Quantification of colocalizations. The analysis of Mander’s colocalization coefficient was performed as detailed in the Materials and Methods. Error bars are represented as mean ± SEM. Statistical analysis was done with one-way ANOVA (Dunnett’s posttest). *p < 0.05, **p < 0.01, ***p < 0.001
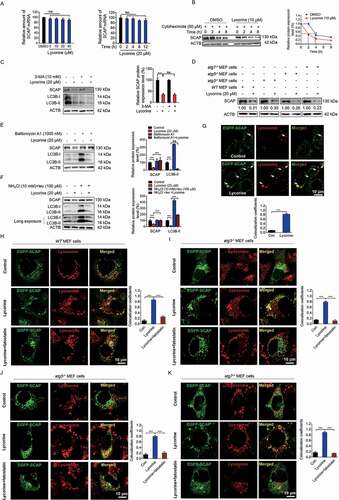
In addition to the ubiquitin-proteasome pathway, cellular proteins could also be degraded through the autophagic-lysosomal pathway. To verify whether lycorine promoted SCAP degradation through this pathway, we first inhibited autophagy using a series of inhibitors and siRNAs against autophagy-related (ATG) genes. Inhibiting autophagosomes formation by 3-MA [Citation41] did not reverse the lycorine-induced SCAP degradation (). Further, when ATG5 and ATG7 were knocked down, separately or simultaneously, in hepatocytes (Fig. S4C-F), the degradation of SCAP induced by lycorine was not reversed (Fig. S4G-I). Similarly, in autophagy-deficient atg3−/- (Fig. S4J), atg5−/- (Fig. S4K) or atg7−/- (Fig. S4L) MEF cells, lycorine still induced SCAP reduction ().
Next, we used a series of lysosomal acidification and lysosome enzyme activity inhibitors, such as bafilomycin A1, a leupeptin-NH4 Cl cocktail, NH4 Cl, and CQ [Citation42–44] to disrupt the lysosome activity. Lycorine-induced degradation of SCAP was largely eliminated (,, S4M, and S4N). Furthermore, we examined the effect of lycorine on autophagy in hepatocytes. It turned out that lycorine treatment significantly decreased the level of LC3B-II in dose- and time-dependent manners (,, S4M-N, and S5A-B). The level of NBR1 (NBR1, autophagy cargo receptor) and SQSTM1 was obviously increased by lycorine treatment (Fig. S5B). Further, we monitored the autophagic flux using the mRFP-GFP-LC3 reporter. If the LC3 turnover is weak, we will observe both GFP and RFP signals. When autophagic flux increases, both GFP and RFP will be incorporated into the lysosome, as GFP is more easily quenched and/or degraded in the lysosome than RFP, the RFP signal will dominate (Fig. S5C) [Citation45]. Therefore, the ratio of “RFP:GFP” reflects autophagic flux [Citation46]. In lycorine-treated cells, there was no increase in the ratio of “RFP:GFP” suggesting no increased autophagic flux (Fig. S5D), which is consistent with a former report [Citation47]. We, then, monitored SCAP localization in HL-7702 cells upon lycorine treatment. In untreated cells, only rare puncta of SCAP were colocalized with the lysosome. After lycorine treatment for 4 h, a large proportion of SCAP proteins were mobilized from the ER to the lysosome (). In autophagy-deficient atg3−/-, atg5−/-, or atg7−/- MEF cells, of which lysosomal activity is not affected, SCAP was also transported to the lysosome upon lycorine treatment (. Meanwhile, in lycorine-treated hepatocytes, the lysosomal activity was not affected (Fig. S5E), as quantified by the activity of acid phosphatase, a lysosomal key enzyme [Citation48] Together, these results indicated that lycorine might promote the degradation of SCAP through an autophagy-independent lysosomal pathway. Pharmacological inhibition of MBTPS1 has been reported to result in blockage of SCAP recycling from the Golgi apparatus to the ER, thus, leading to the lysosomal degradation of the SCAP-SREBF complex [Citation49]. Clearly, lycorine did not affect the MBTPS1 enzyme activity (Fig. S5F), suggesting that the mechanism of lycorine-induced degradation of SCAP is different from the MBTPS1 inhibitor.
There are also other forms of vesicle transport processes that escort proteins to the lysosome for degradation, such as chaperone-mediated autophagy (CMA), endosomal-microautophagy (eMI), ER-to-lysosome associated degradation (ERLAD), or endosomal sorting complex required for transport (ESCRT). CMA is a form of selective autophagy that relies on the HSPA8 (heat shock protein family A [Hsp70] member 8) chaperone that recognizes cytosolic substrate proteins containing the KFERQ-like motif. The CMA-mediated trafficking of protein also needs the binding between HSPA8 and LAMP2A (lysosome-associated membrane protein type 2A) [Citation50]. Proteins containing the KFERQ-like motif are also recognized by HSPA8 for transport into late endosomes [Citation50]. The knockdown of HSPA8 to disrupt CMA and eMI [Citation51,Citation52] did not affect lycorine-mediated SCAP degradation in hepatocytes (Fig. S5G and S5H). Similarly, knockdown of LAMP2A, a rate-limiting factor of CMA [Citation52], also did not affect the efficacy of lycorine (Fig. S5I and S5J). Activation of CMA by serum starvation [Citation46], also did not affect lycorine effects on SCAP (Fig. S5K). The effect of lycorine on the SCAP degradation was not affected in STX17 (Fig. S5L and S5M) or VAMP8 (Fig. S5N and S5O) knockdown hepatocytes, in which ERLAD pathway was disrupted [Citation53]. Similarly, knockdown of TSG101 [Citation54] did not affect lycorine-induced SCAP degradation (Fig. S5P and S5Q), suggesting that the ESCRT pathway was not involved in SCAP degradation by lycorine. In conclusion, the above results demonstrate that lycorine-induced hepatic SCAP degradation is neither through the ubiquitin-proteasome degradation pathway, nor through autophagy-mediated lysosomal degradation processes, including macroautophagy, CMA, eMI, ERLAD, and ESCRT pathways.
Lycorine induced SCAP degradation in an SQSTM1-mediated autophagy-independent lysosomal degradation (SMAILD) pathway
To dissect the mechanism by which lycorine transports SCAP to the lysosome, we immunoprecipitated the SCAP-containing complex from HL-7702 cells with or without lycorine treatment and compared the changes of its binding proteins by tandem mass spectrometry (). HL-7702 cells immunoprecipitated by IgG was similarly performed, and the identified proteins were served as nonspecific binders (Table S1). The SCAP-binding candidates identified by IP-MS are listed in Table S1. Besides SCAP itself, two other known SCAP-binding proteins, SREBF2 and SEC23 [Citation55] were pulled down (Fig. S6A), validating the IP-MS system. We enriched the function of these proteins and found 4 proteins involved in protein transport (Fig. S6B). The SCAP-binding candidates were analyzed with the volcano plots, which showed the variation of SCAP-binding proteins between lycorine and negative control samples (). In total, there were 164 differentially expressed proteins identified induced by lycorine, among which, 66 proteins exhibited increased binding to SCAP (the red dots), and 98 proteins exhibited a decreased binding to SCAP (the green dots). Thereinto, the top 10 proteins with increased binding affinity to SCAP were listed in . Among these SCAP-binding candidates, the binding between SQSTM1 (sequestosome 1) and SCAP was the most upregulated, 2.88-fold (). Based on the IP-MS and previous data, we hypothesized that in lycorine-treated hepatocytes, SQSTM1 might directly cargo SCAP into lysosome instead of via autophagosomes.
Figure 5. SQSTM1 mediates the lysosomal degradation of SCAP induced by lycorine. (A) A scheme for identified the proteins interacted with SCAP, which promoted by lycorine using IP-MS. (B) The experimental results were presented by volcano maps. (C) The top ten proteins interacting with SCAP promoted by lycorine. (D) 293 T cells were transfected with or without the indicated plasmids for 24 h. Immunoblotting for indicated proteins after immunoprecipitation of MYC from 293 T cells (n = 3). (E) HL-7702 cells were treated with or without 20 µM lycorine for 8 h. Immunoblotting for indicated proteins after immunoprecipitation of SCAP from HL-7702 cells (n = 3). (F) The schematic diagram of SCAP and its truncations. (G) 293 T cells transfected with Flag-SQSTM1 and the indicated HA-tagged SCAP constructs treated with 20 µM lycorine for 8 h and were subjected to immunoprecipitation with an anti-Flag antibody and levels of the co-immunoprecipitated HA-SCAP were detected with an anti-HA antibody (n = 3). (H) The schematic diagram of SQSTM1 and its truncations. (I-J) 293 T cells transfected with MYC-tagged SCAP and indicated Flag-SQSTM1-truncated constructs were treated with 20 µM lycorine and then were subjected to immunoprecipitation with an anti-MYC antibody. The levels of the co-immunoprecipitated Flag-SQSTM1 truncations were detected with an anti-Flag antibody (n = 3). (K) 293 T cells transfected with MYC-tagged SCAP and Flag-tagged SQSTM1TB (TRAF6 binding) domain (170–260) constructs were treated with 20 µM lycorine and then were subjected to immunoprecipitation with an anti-MYC antibody. The levels of the co-immunoprecipitated Flag-SQSTM1 TB domain was detected with an anti-Flag antibody (n = 3). Error bars are represented as mean ± SEM. Statistical analysis was done with one-way ANOVA (Dunnett’s posttest). *p < 0.05, **p < 0.01, ***p < 0.001
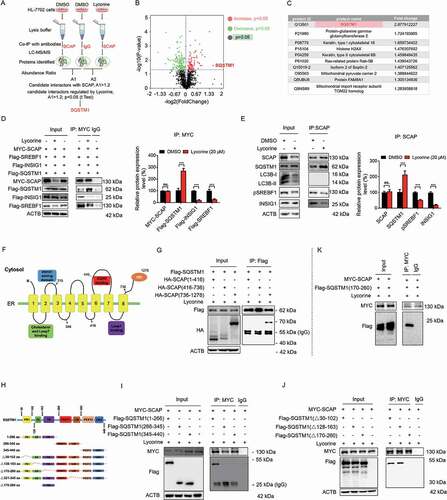
Consistent with IP-MS data, IP-western blot results confirmed that lycorine treatment significantly promoted the interaction of exogenous SCAP with SQSTM1, reduced the interaction of SCAP with INSIG1, and accelerated the uncoupling of SREBF from SCAP in 293T cells (). Consistently, lycorine increased endogenous SCAP-SQSTM1 interaction, reduced SCAP-INSIG1, and SCAP-SREBF1 interaction in hepatocytes ().
To further map the specific binding region between SCAP and SQSTM1, we first overexpressed a series of deletion constructs of HA-tagged SCAP together with a full-length of Flag-tagged SQSTM1 construct. This enabled us to define the region encompassing amino acids 736–1276 (the WD40 domain) as an SQSTM1 interaction region (SIR) (,). Conversely, we overexpressed a series of Flag-tagged deletion constructs of SQSTM1 together with a full-length MYC-tagged SCAP construct. It turned out that 1–266 fragment of SQSTM1 is required for the binding to SCAP (,). 1–266 fragment contains PB1 (Phox and Bem 1), ZZ (the zinc finger motif), and TB (the TNF receptor-associated factor 6 binding region) domains. We, then, overexpressed MYC-tagged SCAP together with Flag-tagged SQSTM1 deletion constructs lacking these three domains, respectively. Deleting the TB domain encompassing amino acids 170–260 in the full-length of SQSTM1 abolished the binding to MYC-SCAP (). Correspondingly, the overexpressed SQSTM1 TB domain was sufficient to interact with SCAP directly (). Together, these results suggest that SCAP interacts directly with SQSTM1. This interaction needs the WD40 domain of SCAP and the TB domain of SQSTM1.
Next, we investigated where SQSTM1 captured and trafficked SCAP to the lysosome. Fatostatin was reported to bind to SCAP and promote the interaction of SCAP with INSIG1 to detain the SCAP-SREBF complex in the ER [Citation8,Citation56]. Pre-treatment with fatostatin significantly increased SCAP-INSIG1 binding ( and S7A), perturbed SCAP-SQSTM1 interaction (,), thus blocking the SCAP translocation to the lysosome and largely diminishing lycorine-induced SCAP degradation (,). These data suggest that the trafficking of SCAP to the lysosome happens after SCAP exits from the ER. Interestingly, lycorine treatment did not induce SCAP colocalization with LC3B (Fig. S7B), further confirming that this trafficking system is independent of autophagy, consistent with former results (, S5, and S8). As the SCAP-SREBF complex departs the ER in transport vesicles coated by the COPII complex from the ER exit sites [Citation57], we, thus, evaluated the involvement of this trafficking machinery using the subunit SEC24D as a marker for the ER exit sites (ERES) [Citation58,Citation59]. There was an increased colocalization among SCAP, SQSTM1, and SEC24D upon lycorine treatment (Fig. S7C). Blocking the exit of SCAP by fatostatin pre-treatment totally intercepted SCAP colocalization with SEC24D and SQSTM1 (Fig. S7C), suggesting that the trafficking is suppressed. Together, these data indicate that the escort of SCAP by SQSTM1 happens after it leaves ER and in COPII-coated vesicles, probably from the ER exit sites.
Figure 6. Lycorine-induced SCAP degradation depends on the TB domain of SQSTM1 and can be reversed by fatostatin. (A) 293 T cells were transfected with the indicated plasmids for 24 h. Immunoblotting for indicated proteins after immunoprecipitation of MYC from 293 T cells (n = 3). (B) HL-7702 cells were pretreated with 20 µM fatostatin for 1 h. The cells were treated with or without 20 µM lycorine for 8 h. The protein level of SCAP was detected by WB (n = 3). (C) HL-7702 cells were transfected with EGFP-SCAP and SQSTM1-OFP for 48 h, then the cells were pretreated with 20 µM fatostatin for 2 h, then lycorine was added to these cells for another 4 h. The lysosome was stained by LysoTracker™ Red. After the treatment, the images were captured with confocal microscopy (n = 3). Quantification of colocalizations. The analysis of Mander’s colocalization coefficient was performed as detailed in the Materials and Methods. (D) The WT or sqstm1−/- MEF cells were replenished the indicated truncation of SQSTM1 for 24 h. The cells were treated with 20 µM lycorine for 8 h. The protein level of SCAP was detected by WB (n = 3). (E-K) The sqstm1−/- cells were replenished with the indicated truncation of SQSTM1 for 24 h. cells were treated with 20 µM lycorine for 4 h. After the treatment, the images were captured with confocal microscopy (n = 3). (L) Quantification of colocalizations. The analysis of Mander’s colocalization coefficient was performed as detailed in the Materials and Methods. (M) The protein level of SQSTM1 was detected by WB. Error bars are represented as mean ± SEM. Statistical analysis was done with one-way ANOVA (The Dunnett’s posttest). ***p < 0.001
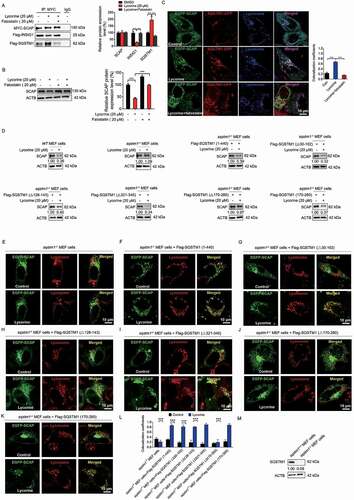
Next, we investigated whether the binding of SQSTM1 and SCAP is required for lycorine-mediated SCAP degradation. First, we found that silencing SQSTM1 by small interfering RNA (Fig. S8A) almost completely blocked the transportation of SCAP to the lysosome by lycorine (Fig. S8B). Consequently, lycorine-induced SCAP degradation was also reversed (Fig. S8C). Similarly, in sqstm1−/- MEF cells, lycorine no longer led to SCAP degradation (,), as well as SCAP lysosomal trafficking (). When full-length SQSTM1 was replenished back to sqstm1−/- MEF cells, SCAP protein degradation induced by lycorine is reconstructed (), because SCAP was transported back to the lysosome (). According to the molecular mapping results of SCAP-SQSTM1 interaction, the TB domain of SQSTM1 is required for its binding to SCAP. Consistently, replenishment of Flag-SQSTM1 (Δ30-102, lacking PB1 domain), Flag-SQSTM1 (Δ128-163, lacking ZZ domain), Flag-SQSTM1 (Δ321-345, lacking LC3 interaction region [LIR]), Flag-SQSTM1 (170–260, TB domain) that bound to SCAP () still captured SCAP to the lysosome () for degradation (). Replenishment of Flag-SQSTM1 (Δ170-260, lacking TB domain) that lost the binding affinity to SCAP failed to transport SCAP to the lysosome (), and, thus, did not restore lycorine efficacy on SCAP (). It should be noted that deleting the LIR domain that is crucial for selective autophagy [Citation60] did not interfere with SCAP-SQSTM1 interaction and lycorine-mediated SCAP lysosomal transportation and degradation (Fig. S8D), thus reinforcing the notion that this degradation pathway is autophagy-independent. Together, these data suggest that the binding of SQSTM1 and SCAP is required for SCAP lysosomal trafficking and degradation. Thus, we termed this new degradation pathway as SQSTM1-mediated autophagy-independent lysosomal degradation (SMAILD) pathway.
Lycorine ameliorates diet-induced obesity, hyperlipidemia, hepatic steatosis, and insulin resistance in mice
To verify the effects of lycorine in vivo, high-fat diet (HFD)-fed C57BL/6J mice were treated with vehicle (0.5% CMC-Na, chow), lovastatin (an inhibitor of HMGCR), or lycorine (15 or 30 mg/kg/d) for 6 weeks. During this process, we observed no obvious toxicity of lycorine or lovastatin, and food intake was not significantly different in all groups (). Compared with the chow diet-fed mice, the bodyweight of mice fed with HFD plus lycorine (30 mg/kg/d) or lovastatin (30 mg/kg/d) were significantly lighter (). The effect of lovastatin on body weight is consistent with a previous report [Citation61]. In addition, the fat:lean and fat:body weight ratios of lycorine- or lovastatin-treated mice were dramatically decreased (). These results demonstrate that lycorine ameliorates diet-induced obesity in mice.
Figure 7. Lycorine ameliorates diet-induced obesity, hyperlipidemia, hepatic steatosis, and insulin resistance in mice. Male C57BL/6 J mice at 6 weeks of age were randomly grouped (n = 6). Mice were allowed ad libitum access to water and different types of diets (HFD, high fat diet). Vehicle (0.5% CMC-Na, chow), lycorine (15 or 30 mg/kg), or lovastatin (30 mg/kg) was administrated to mice by gastric irrigation every day. After 6 weeks of treatment, the mice were sacrificed and subjected to a series of analyzes as indicated below. (A) Food intake (B) Bodyweight. (C) The ratio of fat and body weight or lean. (D) The effect of lycorine on serum TG, TC, LDL-c and HDL-c levels. (E) The effect of lycorine on serum GPT/ALT and GOT1/AST levels. (F) Effect of lycorine on TG and TC levels in the liver. (G) The weight of liver and WAT. (H) Oil red staining in liver and histological analysis of liver, WAT and BAT. Error bars are represented as mean ± SEM. Statistical analyzes were done with two-way ANOVA (Bonferroni’s test) (A) or one-way ANOVA (Dunnett’s posttest) (B-G). *p < 0.05, **p < 0.01, ***p < 0.001 vs HFD
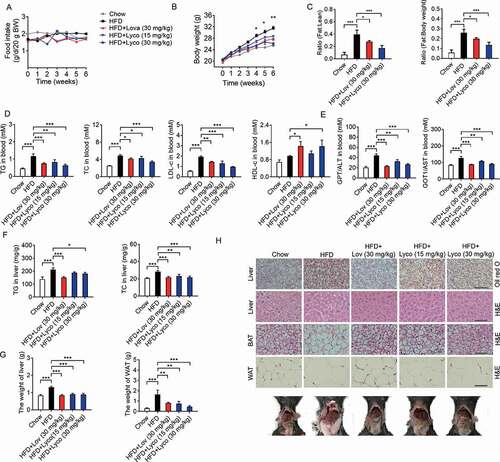
Next, we detected the lipid levels in blood, liver, and adipose tissues to determine the potential role of lycorine in the improvement of lipid accumulation of HFD-fed mice. As shown in , the serum TC and TG levels of lovastatin- and lycorine-treated mice were significantly lower than those of the HFD-fed mice. Lycorine increased HDL-c and reduced LDL-c, similarly as lovastatin (). Lipid accumulation in the liver leads to liver dysfunction, steatosis, and liver injury. GPT/ALT (glutamic-pyruvate transaminase [alanine aminotransferase] and GOT1/AST (glutamic-oxaloacetic transaminase 1) in the blood are the most common indicators for hepatic and extra-hepatic tissue damage, the elevated GPT/ALT and GOT1/AST induced by HFD dropped by lovastatin and lycorine treatment (). In addition, the hepatic TC, TG (), and liver weight () of lycorine-treated mice were obviously decreased, comparable to lovastatin. Moreover, lycorine-treated mice exhibited less lipid accumulation than vehicle-treated mice (). This result is consistent with previous data that lycorine notably inhibited hepatic TC and TG accumulation (). Lycorine also reduced the weight of white adipose tissue (WAT) (,) and the cell size of both WAT and brown adipose tissue (BAT) ().
Next, we detected whether lycorine improved HFD-induced insulin resistance. Compared with normal diet-fed mice, the HFD-fed mice exhibited impaired glucose tolerance and insulin resistance (Fig. S9A-D). Glucose tolerance and insulin resistance were markedly ameliorated in lycorine-treated HFD-fed mice (Fig. S9A-D). Furthermore, lycorine also decreased the elevated fasting blood glucose and insulin (Fig. S9E and S9F).
The oxygen consumption, carbon dioxide production, and total respiratory exchange ratio were not influenced by lycorine treatment (Fig. S9G-I). The energy expenditure (EE) and respiratory quotient (RQ) of lycorine treatment mice were still similar to HFD-fed mice (Fig. S9J and S9K). Meanwhile, we observed no obvious difference in the body temperature between lycorine- and vehicle-treated mice when they were exposed to the cold environment (Fig. S9L). These data suggest that lycorine does not influence the basic energy metabolism in HFD-induced obese mice.
Lycorine suppresses SREBFs without inducing ER stress or NR1H3 activity in vivo
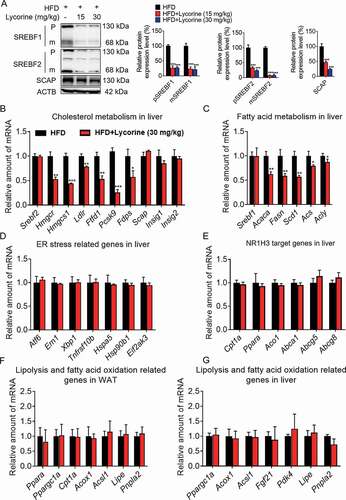
Next, we investigated the modulation of the expressions of SCAP, SREBFs, and their target genes in the liver of lycorine-treated HFD-induced obese mice. Similar to in vitro results, SCAP, along with precursor and mature SREBFs, were reduced in HFD-fed mice treated with lycorine (). The hepatic SREBF1 and SREBF2 target genes were obviously downregulated in lycorine-treated HFD-induced obese mice (,). Consistently, lycorine did not induce the expression of ER stress genes in vivo (). Moreover, lycorine did not affect the expression of NR1H3 target genes controlling cholesterol efflux and clearance (). The gene expression of genes related to lipolysis or beta-oxidation in liver and adipose tissues was detected. As shown in ,, the lipolysis-, fatty acid-, and beta-oxidation-related gene expressions were not influenced by lycorine in the liver and WAT of mice. These results suggested that lycorine treatment alleviated fat accumulation and metabolic syndrome, probably not by increasing lipolysis and beta-oxidation of fatty acid. Together, our results indicate that lycorine improves lipids metabolism, without inducing ER stress and activates NR1H3, which might contribute to lower lipid accumulation and enhance insulin sensitivity.
Figure 8. Lycorine decreases the protein level of SCAP-SREBF and regulates the expression of metabolic genes in vivo. (A) For each group, equal amounts of total proteins from the livers of 3 mice were subjected to WB with indicated antibodies. Statistical analysis of each protein expression was adjusted to ACTB as the loading control. (B-F) total RNAs were extracted from liver tissue, gene expression in mice liver. (G) total RNAs were extracted from WAT tissue, gene expression in WAT. n = 3, *p < 0.05, **p < 0.01, ***p < 0.001
Discussion
SCAP plays a central role in regulating lipid homeostasis since it is a prerequisite for the transport and activation of all three SREBF isoforms. Targeting SCAP to suppress SREBFs seems to be an attractive strategy for the treatment of metabolic diseases. In this study, we developed a cell-based screening method (CETSA) to search for SCAP binding molecules. Lycorine was discovered to bind to SCAP and suppressed the SREBF pathway ( and ). Previous known SCAP inhibitors, such as cholesterol and fatostatin, bind to SCAP and promote the interaction between SCAP and INSIG1. Oxysterols bind to INSIG1 to elicit SCAP-INSIG1 binding [Citation10]. All these molecules lead to the ER retention of the SCAP-SREBF complex. Moderate accumulation of ER luminal proteins triggers the unfolded protein response (UPR). When the amount of unfolded protein exceeds the folding capacity of the ER, ER stress is then induced [Citation62,Citation63]. In SCAP KO cells, sterol did not induce ER stress. When SCAP was put back to SCAP KO cells, sterol stimulated ER stress dramatically (). Similarly, fatostatin also caused ER stress [Citation64]. Severe ER stress in hepatocytes and macrophages leads to hepatocyte damage and atherosclerosis. Therefore, targeting SCAP and favoring the ER retention of SCAP-SREBFs complex may not be an ideal strategy to treat metabolic diseases. Unlike previously known SCAP inhibitors, lycorine promoted SCAP degradation ( and S2C-E). However, it did not induce ER stress regardless of the SCAP expression level ( and ). Meanwhile, lycorine did not activate NR1H3 ( and ). Together, these data suggest that targeting SCAP for degradation might be superior to anchoring SCAP-SREBFs in the ER. The stability of SREBFs depends on SCAP that escorts SREBFs to the Golgi apparatus via COPII vesicles [Citation65]. When SCAP was degraded in the presence of lycorine, SREBFs underwent ubiquitylation and proteasomal degradation (Fig. S3). Thus, lycorine reduced triglyceride and cholesterol levels in vitro and in vivo (, , and ).
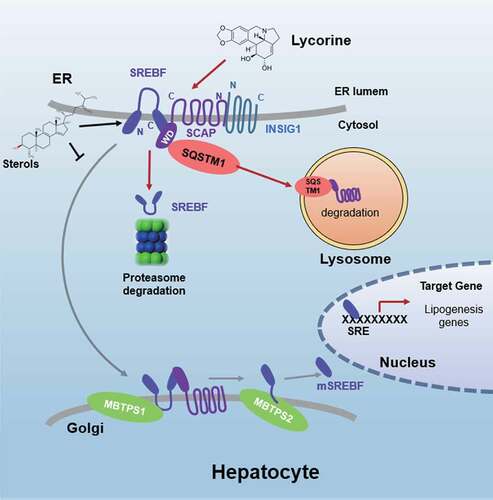
Figure 9. Schematic diagram of lycorine. Sterols block the SCAP-SREBFs transport from the ER to the Golgi apparatus by sequestering the SCAP-SREBFs complex in the ER lumen, which is a potential risk factor of ER stress. Lycorine binds to SCAP at the WD40 domain, which leads to the dissociation of SCAP-SREBFs from INSIG1. Once SCAP leaves the ER, it is captured by SQSTM1 and escorted to the lysosome for degradation. When SCAP proteins are reduced, SREBFs undergoes ubiquitylation and proteasomal degradation, thus lipogenic gene expression is suppressed
In this study, we identified a series of proteins that bind to SCAP (Table S1 and ), most of which have not been reported. The physiological role of these interactions remains largely unknown. Therefore, this information provides a very valuable clue for the further study of SCAP-related functions. SQSTM1 was discovered with the highest enrichment in SCAP pulldown samples after lycorine treatment (,). SQSTM1 binds with LC3 to form late autophagosome [Citation66,Citation67]; however, autophagy is not required for lycorine-triggered SCAP degradation ( and S5C-I). Lycorine facilitated SCAP-INSIG1 dissociation and promoted SCAP-SQSTM1 binding (,), then SQSTM1 escorts SCAP to the lysosome for degradation. Distinct from a membrane protein VANGL2 [Citation68], SCAP binds to SQSTM1 independent of PB1, ZZ, or LIR domain (). The binding between SREBFs and SQSTM1 got weaker after lycorine treatment (,), suggesting that SREBFs were released from SCAP and then underwent ubiquitylation and proteasomal degradation (Fig. S3). Therefore, we discovered a new route that SQSTM1 transports an ER-Golgi protein to the lysosome for degradation termed SMAILD. Lysosome degrades incoming materials, including organelles, proteins, and lipids. Materials delivered to the lysosome through endocytosis, autophagy, or direct diffusion with the lysosome [Citation69]. There are three forms of autophagy: eMI, macroautophagy, and CMA. SMAILD is different from these three forms of autophagy. SMAILD pathway has not been discovered before, we think there are two reasons: 1) SMAILD is very similar to and is, thus, very easily mistaken for the autophagic lysosomal degradation process; 2) The occurrence of this process is relatively weak and difficult to detect under normal physiological conditions (). Fortunately, lycorine greatly activates SMAILD (), making this degradation pathway discoverable. SQSTM1 was first discovered as a selected autophagy receptor [Citation70]. It co-aggregates with ubiquitinated substrates with its ubiquitin-associated (UBA) domain and, then, delivers polyubiquitinated cargoes to autophagy via the LIR domain [Citation71]. Since lycorine did not induce SCAP polyubiquitination, these two domains had no effect on SCAP transport (,). TRAF6 binding domain (TB) was reported to be essential for the forming of the TRAF6-SQSTM1 complex that is necessary for maintaining effective ubiquitin ligase activity of TRAF6 [Citation72]. In this study, we identified a novel function of the TB domain. It is sufficient and required for SQSTM1 to capture SCAP, leading to the trafficking of SCAP to the lysosome ( and ). SMAILD pathway happens after SCAP exits from the ER, and most probably in the COPII ER exit sites ( and S7). However, there are still many mysteries. For example, how are COPII vesicles escorted to the lysosome? Whether this transportation route is SCAP-specific, or can it be applied to other ER proteins? As SCAP is not ubiquitylated after lycorine treatment (Fig. S4B), are there other post-translational modifications, such as glycosylation, that facilitate the trafficking to the lysosome mediated by SQSTM1? Understanding the detailed mechanism that triggers SQSTM1-mediated lysosomal trafficking certainly will broaden our horizon and deepen our knowledge of how different degradation pathways are orchestrated to maintain protein homeostasis that is relevant to human physiology and pathology.
Targeting protein degradation is a powerful tool for drug discovery, especially for those proteins that are “undruggable” using conventional methods. A proteolysis-targeting chimera (PROTAC) technology has been used to initiate selective intracellular proteolysis of unwanted proteins [Citation73,Citation74]. PROTAC protein degrader, ARV-110, has been approved by the FDA for phase I clinical trial. Similarly, lysosome-targeting chimeras (LyTACs) mediates the efficient degradation of APOE, EGFR, CD274/PD-L1, etc [Citation75]. As SQSTM1 mediates an autophagy-independent lysosomal degradation pathway, this unique function could also be applied for the design of LyTACs.
Statins are the most widely prescribed drugs to treat hypercholesterolemia. As an inhibitor of HMGCR, statin blocks cholesterol biosynthesis. Meanwhile, inhibition of cholesterol synthesis in the liver stimulates SREBF, upregulates LDLR, and increases LDL uptake [Citation76]. Through these two mechanisms, statin effectively reduces the serum cholesterol level. However, statin activates SREBF and raises liver cholesterol and fatty acid biosynthetic enzymes, which lead to adverse effects [Citation77,Citation78]. In comparison, lycorine directly binds to SCAP, inhibits SREBF, and downregulates both cholesterol and fatty acid synthesis. When mice were fed with equal amounts of lovastatin or lycorine, lycorine showed similar or even better beneficial effects; for instance, lycorine decreased lipid levels to a greater extent than lovastatin in the liver, WAT, and BAT (). Moreover, lycorine showed a better effect than lovastatin in improving insulin sensitivity (Fig. S9), since it also decreases fatty acid and TG synthesis besides inhibiting cholesterol synthesis ().
Materials and methods
Materials
Lycorine (476-28-8) and AHI (118525-40-9) were purchased from Shanghai U-Sea bio-tech co., Ltd. 3-(4,5-dimethylthiazol-2-yl)-2,5-diphenyltetrazolium-bromide (MTT; 88417), cholesterol (C3045), 25-hydroxycholesterol (25-HC; H1015), lovastatin (1370600), INS (insulin) (1342106), mevalonate (50838), Nile-Red (19123) and paraformaldehyde (158127) were purchased from Sigma-Aldrich. Filipin (B6034) was purchased from APExBIo Technology. Cycloheximide (HY-12320), betulin (HY-N0083), AEBSF (HY-12821), CQ (HY-17589), 3-MA (HY-19312), PF-429242 (HY-13447A), fatostatin (HY-14452) and leupeptin (HY-18234A) were from MedChem Express. MG-132 (S2619) was purchased from Selleckchem Chemicals. AlphaLISA buffer (AL000F), AlphaScreen anti-mouse donor beads (AS104D), AlphaScreen anti-rabbit acceptor beads (AL104C) and AlphaScreen SureFire Lysis Buffer (TGLB10ML) were from PerkinElmer. Proteinase inhibitor cocktail (04693159001) and phosphatase inhibitors (4906845001) were from Roche. MBTPS1 peptide (ab223083), Acid Phosphatase Kit (ab83367) were from Abcam. LysoTracker Red (L12492) was from Invitrogen.
Primary antibodies
Anti-SREBF1/SREBP-1 (sc-8984), anti-MYC (sc-40) and anti-SCAP (13553) antibodies were from Santa Cruz Biotechnology. Anti-AKT (4691), anti-phospho-AKT (Ser473) (4060), anti-flag-tag (14793), anti-SQSTM1/p62 (8025), LC3B (3868), anti-ATF6 (65880), anti-MTOR (2983s), anti-phospho-MTOR (Ser2448; 2971s), anti-RPS6KB1/p70S6K (9202), anti-phospho-RPS6KB1/p70S6K (Thr389) (9206s) and anti-phospho-PI3K p85 alpha (Tyr458; 4228) antibodies were purchased from Cell Signaling Technology. Anti-ACTB/beta-actin (AF0003) antibody was purchased from Beyotime Biotechnology. Anti-SREBF2/SREBP2 (30682), anti-TSG101 (125001), anti-VAMP8 (76021) and anti-SCAP (125186) were from Abcam. Anti-PI3K p85 alpha (A0054) antibody was purchased from ABclonal Technology. Anti-STX17 (17815-1-AP) antibody was purchased from Proteintech Group.
siRNAs
SQSTM1 #1: 5ʹ-GCUUAGAGCUGCAAGGCAATT-3ʹ;
SQSTM1 #2: 5ʹ-GACUCGUGUUGCCUCUUUATT-3ʹ;
ATG5 #1: 5ʹ-GCUAUAUCAGGAUGAGAUATT-3ʹ;
ATG5#2: 5ʹ-GACGUUGGUAACUGACAAATT-3ʹ;
ATG7#1: 5ʹ-CCAACACACUCGAGUCUUU-3ʹ;
ATG7#2: 5ʹ-CCAACACACUCGAGUCUUU-3ʹ;
HSPA8/HSC70: 5ʹ-GCAAAGAAUCAAGUUGCAATT-3ʹ
STX17#1: 5ʹ-CGAUCCAAUAUCCGAGAAAUUTT-3ʹ;
STX17#2: 5ʹ-GAAUCUGUAGAAGAACUUAAG-3ʹ;
VAMP8#1: 5ʹ-CUUCAAGACGACAUCGCAGAA-3ʹ;
TSG101#1: 5ʹ-GCCUUAUAGAGGUAAUACAUA-3ʹ;
TSG101#2:5ʹ-GCCUUAUAGAGGUAAUACAUA-3ʹ;
Scrambled siRNA: 5ʹ-UUCUCCGAACGUGUCACGUTT-3ʹ
Plasmids
NR1H3 reporter gene, MYC-SCAP, Flag-SREBF1, HA-ubiquitin, Flag-INSIG1, Flag-SQSTM1, Cy3-INSIG1, EGFP-SCAP, Cy3-LC3B, SQSTM1-OFP and Flag-SQSTM1-lacking LIR were purchased from Sino Biological Inc. GFP-RFP-LC3, RFP-SEC24D was provided by Prof. Xiaowei Chen (Tsinghua University). HA-tagged SCAP deletion constructs were kindly provided by Prof. Peng Li (Tsinghua University) [Citation57]. Flag-tagged SQSTM1 deletion plasmids were kindly provided by Hua Xu (Huazhong University of Science and Technology) [Citation79].
Primers
Cell culture
HEK293T (293T cells) and HepG2 cell lines were obtained from the American Type Culture Collection (CRL-11268 and HB-8065, respectively). HL-7702 cells (KG063) were purchased from Keygen Biotechnology. WT, sqstm1−/-, atg3−/- and atg5−/- MEF cells were from Prof. Qing Zhong’s lab (Shanghai Jiaotong University, Shanghai), atg7−/- MEF cells were from Lei Qiang’s Lab (China Pharmaceutical University, Nanjing). All of the cell lines were grown in medium B under 37°C, 5% CO2.
Culture medium
Medium A: DMEM (Gibco, 11965092) containing 100 units/ml penicillin and 100 μg/ml streptomycin sulfate (Keygen Biotechnology, KGY0023); Medium B: medium A supplemented with 10% FBS (Gibco, 10100154); Medium C: a 1:1 mixture of Ham’s F-12 medium (Gibco, A2494301) and DMEM containing 100 units/ml penicillin and 100 μg/ml streptomycin sulfate; Medium D: medium C supplemented with 5% LPDS (Kalen Biomedical, 880100), 10 μM compactin (Sigma-Aldrich, 1443216) and 50 μM mevalonate.
CETSA screening
CETSA protocol was adapted from that of literature with slight alteration [Citation26–28]. Briefly, HepG2 cells incubated with cholesterol (20 μM) and DMSO (Sigma-Aldrich, D4540) for 1 h in the CO2 incubator at 37°C. Cells were collected in 1 mL of PBS (Keygen Biotechnology, KGB50010) containing protease inhibitors. Each cell suspension was divided into 10 different PCR tubes and heated in a thermal cycler (Applied Biosystems) at different temperatures for 3 min. After heating, tubes were kept at room temperature for 3 min. Cells were lysed by Lysis Buffer (PerkinElmer, TGLB10ML). The lysates (3 μl) were then transferred to 384-well ProxiPlates (PerkinElmer, 6008238) and followed by adding 6 μl a mix of anti-SCAP antibodies, AlphaScreen acceptor and donor beads. The plates were incubated overnight in the dark place at room temperature. The detection was executed in a microplate reader. To perform the CETSA experiments, an equal number of HepG2 cells were incubated with different concentrations of cholesterol (0, 5, 10, 20, 40, 80 μM) for 1 h in the CO2 incubator at 37°C. Following the incubation, cells were centrifugated to remove drug-containing media and washed with PBS, prepared for the CETSA experiment. In this case, the cells were heated at 55°C for 3 min, and the experiment was performed as described above. To perform the high throughput screening, an equal number of HepG2 cells were incubated with different compounds for 1 h in the CO2 incubator at 37°C. The experiment was performed as described above.
Cellular viability assay
Cells were seeded in 96-well plate at a density of 1 × 10⁴ cells per well and were treated with various concentrations of compounds. Each well was added 10 µL MTT (5 mg/ml) and incubated for 4 h. Carefully remove the supernatant and add 100 µL DMSO to each well. The OD value of each well was measured with a microplate reader (Multiskan FC).
Western blot analysis
Cells were harvested and suspended in lysis buffer (Beyotime Biotechnology, P0013J) containing protease inhibitor and phosphatase inhibitor. Protein samples were determined using the BCA method (Beyotime Biotechnology, P0009). The cell lysates were denatured at 95°C for 10 min. Proteins were separated by 8-12% SDS-PAGE and transferred to nitrocellulose (NC) membranes (Millipore, HATF00010). The membranes were blocked with 5% nonfat milk (BD Difco TM, 232100) in TBS (Aladdin, T196392) containing 0.075% Tween-20 (Merck, 93773) (TBST) for 1 h and indicated antibodies overnight at 4°C. The membranes were washed three times with TBST and indicated HRP-conjugated secondary antibody for 1 h at room temperature. Immunoblots were visualized by chemiluminescence detection kit (Tanon Science & Technology, 180–501). Quantitative analysis of each band was performed by Quality One software (Bio-Rad). All the loaded amounts of proteins (total 10–40 μg) were within the linear dynamic range of detection for the Chemiluminescence.
Immunoprecipitation
Cells were harvested and suspended in lysis buffer (Cell Signaling Technology, 9806) containing protease and phosphatase inhibitors. The cell lysates were centrifuged for 10 min at 14,000 g at 4°C. About 10% of the supernatant was used for western blot as inputs, while the rest of homogenates were incubated with specific antibodies at 4°C overnight. Then add protein A/G sepharose beads (Thermo Fisher Scientific, 78609) for 2 h at 4°C. The immunoprecipitation beads were washed with cold PBS for five times, followed by western blotting analysis.
IP-MS assay
Immunoprecipitation was performed as described above, but it was altered slightly. After incubating with protein A/G sepharose beads for 2 h, the immunoprecipitation beads were washed ten times with cold 50 mM Tris-Cl (PH 7.5), dissolved in mixed solution (8 M urea [Aladdin, U111904], 25 mM Tris-Cl, pH 7.5, 10 mM EDTA [Sigma-Aldrich, E9884]) and analyzed on an high-performance liquid chromatography system coupled to an Orbitrap Q Exactive mass spectrometer (Thermo Fisher Scientific). To generate an extracted ion chromatogram, the raw data were processed using Sequest and Proteome DiscovererTM) software (ThermoFisher Scientific).
qRT-PCR
Total RNAs were isolated using Trizol reagents (Vazyme, R401-01) and reverse transcribed into cDNA using HiScript Reverse Transcriptase kit (Vazyme, R123-01). Quantitative real-time PCR using SYBR Green Master Mix (Vazyme, Q111-02) was performed with Light-Cycler 480 (Roche Diagnostics GmbH). The primer sequences used in this study were listed in . The data were analyzed using Microsoft Excel and GraphPad Prism 6.
Table 1. Nucleotide sequences of gene-specific primers used for qRT-PCR, related to the experimental procedures
Filipin staining and Nile-Red staining
Cells were fixed with 4% paraformaldehyde for 30 min at room temperature, washed twice with PBS and stained with 0.5 mg/ml filipin or 0.5 μg/ml Nile-red in the dark for 30 min at room temperature. After staining, cells were washed with PBS three times to remove the excess dye. Fluorescence signals of stained cells were analyzed with an EVOS FL Auto microscope (life technologies). Quantification of the cellular neutral lipids or cholesterol was analyzed by Image-Pro Plus.
Reporter gene assay
293T cells were transfected with NR1H3-Luciferase using Lipofectamine 3000 (Invitrogen, L3000015) for 24 h, cells then were exposed to different compounds at concentrations of lycorine. Cells were lysed in 100 μl lysis buffer (Promega, E1941) sufficiently on a shaker for 40 min at room temperature. 50 μl of the total cell suspension were transferred to a 96-well white plate (E&K Scientific, EK-25075) for luciferase activity detection. The remaining cell suspension was used for beta-gal reporter gene assay with a kit (Beyotime Biotechnology, RG0036) according to the instructions of the manufacturer. The luciferase activity was measured immediately after adding 50 μl luciferase substrate (Promega, E1960) with a microplate reader and the intensity of beta-gal was also measured as the internal control.
Total cholesterol and triglyceride measurement
For the detection of intracellular TC and TG, the cells were collected in 1 ml PBS. 100 μl of the total cell suspension was used for protein quantification after lysing in RIPA lysis buffer (Cell Signaling Technology, 9806). The remaining cells were collected for lipid extraction by centrifugation at 800 g for 3 min at 4°C. After centrifugation, the supernatant was discarded. Cells were mixed with 1 ml of chloroform:methanol (2:1, v:v) adequately on a shaker for 3 h at room temperature. Add 500 μl NaCl (0.1 M) into each reaction tube and mix thoroughly. Organic phase was obtained by centrifugation at 3700 g for 10 min and evaporated to dryness. The residual liquid was re-suspended in 50 μl of 1% Triton X-100 (Sigma-Aldrich, T9284) in absolute ethanol. The concentrations of TC (wako, 290–63701) or TG (wako, 290–65801) were measured with a determination kit according to the instructions of the manufacturer, respectively.
For measurement of liver TC and TG, 40–50 mg of liver tissue was homogenized in 0.5 ml PBS. About 5 μl of the total homogenates were used for protein quantification, while the rest of homogenates were mixed with 1.6 ml of chloroform:methanol (2:1, v:v) adequately for lipid extraction. The following experimental procedures for the measurement of liver TC and TG were identical, as mentioned above.
Intracellular localization of SCAP
In brief, the cells were transfected with EGFP-SCAP plasmid for 24 h, and then incubated lycorine for another 8 h. After that, the cells were incubated with a lysosome tracker. Confocal images were captured with an LSM 710 confocal microscope (Zeiss). The merged pictures were generated by LSM 7 IMAGE browser (Zeiss). The JaCoP plug-in in ImageJ (http://rsb.info.nih.gov/ij/) software was used for the quantification of the various colocalizations.
Quantification of lysosomal activity
The lysosomal activity was quantified by determining the activity of acid phosphatase, a lysosomal key enzyme. 100,000 cells were lysed in citrate buffer and added to the substrate provided by the Acid Phosphatase Assay Kit (Sigma-Aldrich, CS0740). After incubation for 30 min at 37°C, the absorbance of the p-nitrophenol was determined at 405 nm in a microplate reader (Multiskan, FC). The OD of non-transfected cells was set as 100%.
Knockout of SCAP by CRISPR-Cas9
Targeting sequences were designed at CRISPR direct (http://crispr.mit.edu), provided by the Zhang Lab, MIT (Massachusetts Institute of Technology) 2015. The knockout SCAP HL-7702 cell line was generated by CRISPR-Cas9 targeting the following site: 5ʹ-TCGGCCCGCAGTCCGGTGCG-3ʹ. Briefly, SCAP complementary oligonucleotides with BbsI restriction site for guide RNAs (gRNAs) were synthesized and cloned into pHBcas9/gRNA puro vector (HANBIO, HBCR-001) and confirmed by sequencing, named pHBcas9/SCAP/gRNApuro. HL-7702 cells were transfected with pHBcas9/SCAP/gRNApuro plasmid using Lipofectamine 2000 (Invitrogen, 11668019) according to the manufacturer’s instruction. After transfection for 48 h, cells were selected for 3 d in the presence of 2 μg/ml puromycin (Sigma-Aldrich, P7255). Single colonies were isolated and the gene knockout clones were confirmed by immunoblotting.
Measurement of de novo fatty acid and cholesterol synthesis
De novo fatty acid and cholesterol were measured as previously described [Citation36]. Cells were treated with indicated concentrations of lycorine for 16 h. [1–14 C] acetate (PerkinElmer, NEC084 H001MC) (12 μCi/60 mm dish) was directly added in and incubated for an additional 2 h. The cells were washed and dissolved with 0.1 N NaOH, and cell suspensions were autoclaved for alkaline saponification. Then the nonpolar lipids (cholesterol) were extracted in petroleum ether and evaporated to dryness with N2. After the addition of concentrated HCl, polar lipids (fatty acids) were extracted in petroleum ether and evaporated to dryness with N2. 5 ml scintillation cocktail (PerkinElmer, 6013321) was added to the sample and the DPM value was detected.
In silico molecular docking
Molecular docking was performed using the Molecular Operating Environment (MOE) software (Chemical Computing Group Inc, Montreal, Quebec, Canada). A crystal structure of SCAP (from fission yeast) was downloaded from the protein data bank (PDB ID: 5 GRS) [Citation32]. This structure was protonated in the Molecular Operating Environment (MOE). The triangle matcher algorithm of the MOE software packages was selected to dock the identified hit compounds into the protein active site. The scoring function must comply with the following parameters: (1) specifying ASE Scoring to rank the poses output by the placement stage; (2) specifying forcefield refinement to relax the poses; (3) specifying Affinity dG scoring to rank the poses using the refinement stage. The free energy of binding was calculated from the contributions of the hydrophobic, ionic, hydrogen bond, and van der Waals interactions between the protein and the ligand, intramolecular hydrogen bonds and strains of the ligand. We observed that the docking poses were ranked by the binding free energy calculation in the S field [Citation80].
Microscale thermophoresis analysis
Recombinant human EGFP-SCAP, EGFP-SCAPA1029E/Y793E were expressed in Escherichia coli BL21 (DE3) strain (Tiangen Biotechnology, CB105) as C-terminal His-6-tagged fusion proteins by using the pET28a expression system (Novagen, 69864–3). The C-terminal tagged (His) 6 fusion proteins were purified by Ni2+-agarose affinity chromatography.
Compounds were titrated in different concentrations to purify recombinant human EGFP-SCAP or its mutant proteins. The reaction was performed in 50 mM HEPES (Keygen Biotechnology, KGR0087), pH 7.0, 50 mM NaCl, 0.01% Tween-20, 2 mM MgCl2. Then the samples were incubated at room temperature for 5 min before analyzing by microscale thermophoresis. A NanoTemper Monolith Instrument (NT.115) was used for measuring thermophoresis. In this instrument, an infra blue-Laser (IB-Laser) beam couples into the path of light (i.e., fluorescence excitation and emission) with a dichroic mirror and is focused into the sample fluid through the same optical element used for fluorescence imaging. The IB laser is absorbed by the aqueous solution in the capillary and locally heats the sample with a 1/e2 diameter of 25 μm. Up to 24 mW of laser power was used to heat the sample, without damaging the biomolecules. To analyze the thermophoresis of a sample, 10 μl was transferred in a glass capillary (NanoTemper, hydrophilic-treated). Thermophoresis of the protein in the presence of varying concentrations of the compound was analyzed for 30 s. Measurements were performed at room temperature, and the standard deviation was calculated from three independent experiments.
Animal experiments
The laboratory animal facility in the animal experimental center has been accredited by Association for Assessment and Accreditation of Laboratory Animal Care International. All experiments and animal care in this study were conducted in accordance with the national and international directives (the Provision and General Recommendation of Chinese Experimental Animals Administration Legislation and Guide for the Care and Use of Laboratory Animals, United States National Research Council, 2011) and approved by the Science and Technology Department of Jiangsu Province (SYXK (SU) 2016–0011). The C57BL/6 J (SPF grade, six weeks old, 20 ~ 24 g) were purchased from Nanjing University (Nanjing, China). The animals were kept under a consistent temperature (24°C) with 12 h light-dark cycle and fed standard food pellets (Jiangsu synergetic biology Co., Ltd, 1010039) with access to sterile water ad libitum. HFD (Research Diets, D12492) was contained 60% fat, 20.6% carbohydrate, and 19.4% protein w:w.
Metabolic measurements
After receiving different treatments for 6 weeks, mice were adapted to the comprehensive lab animal monitoring system (Columbus Instruments, Columbus, OH) for 24 h according to the instructions of the manufacturer. Consumption of food, water, oxygen and production of feces, urine, and carbon dioxide were recorded over a 24 h period. RQ equals volumes of CO2 released:volumes of O2 consumed.
Glucose tolerance and insulin tolerance tests
Glucose tolerance tests and insulin tolerance tests were performed on mice fasted overnight with free access to water. After an overnight fast, mice were gavaged with 2 g/kg glucose (Sigma-Aldrich, G8270) by i.g. or injected with 0.75 U/kg INS (Biosgarp, BS002) by i.p. Tail blood was drawn to determine the glucose levels before injection (time 0) and 15, 30, 60, 90 and 120 min after injection. All animals were sacrificed 3 d after glucose tolerance or insulin tolerance tests, and blood and liver were harvested. Area under the curve (AUC) was calculated to quantify the GTT and ITT results.
Serum and liver lipid determination
Serum TC and TG levels were measured with the kit according to the manufacturer’s instructions, and LDL-C (Applygen, E1018) and HDL-C (Applygen, E1017) levels were determined by the kits. Liver tissues were homogenized and centrifuged. Supernatants were collected, and TC and TG were determined.
Histological analysis of liver and adipose
Mice liver, adipose and aortas were fixed immediately after euthanasia in 4% paraformaldehyde at 4°C overnight and embedded in paraffin wax (Sigma-Aldrich, 327204). Paraffin sections (5 μm) were cut and mounted on glass slides for hematoxylin and eosin (H&E) staining. Liver sections were stained by oil red O (Sigma-Aldrich, O0625) and counterstained with hematoxylin (Sigma-Aldrich, H3136). Adipose tissues were stained with H&E.
The weight of fat analysis by NMR
To determine the fat content of animals, the mice received different treatments for 6 weeks were scanned with the minispec TD-NMR designed for experimental animals (Bruker). The fat content was calculated according to the measurement between the solid and liquid parts of the sample.
Immunohistochemistry
Thick sections (3 µm) were fixed in 4% paraformaldehyde, followed by deparaffinization, rehydration and antigen retrieval. Sections were blocked in PBS with 10% goat serum (Gibco, 16210064), incubated with described antibodies and HRP-tagged goat anti-rabbit as a secondary antibody. After washing, samples were incubated in diaminobenzidine (Sigma-Aldrich, D8001) for 5 min and counterstained in hematoxylin. Tissue slides were scored in a blinded fashion. No staining was observed with a negative control rabbit anti-IgG antibody. The images were measured blindly by one observer using Image-Pro Plus (Media Cybernetics, Silver Spring, USA).
Statistical analysis
All data were expressed as the means standard error (SE). Statistical significance was calculated by the student’s t-test, one-way ANOVA When ANOVA indicated a significant difference among the groups. The statistical difference between the two groups was compared using a stricter criterion for statistical significance. Differences with p < 0.05 were considered to be statistically significant (p* < 0.05, p** < 0.01, p*** < 0.001, ns. = Non-significance).
Supplemental Material
Download Zip (4.9 MB)Acknowledgments
We thank Prof. Li Yu from Tsinghua University for critical reading of our manuscript.
Disclosure statement
No potential conflict of interest was reported by the authors.
Supplementary material
Supplemental data for this article can be accessed here.
Additional information
Funding
References
- Hua X, Yokoyama C, Wu J, et al. SREBP-2, a second basic-helix-loop-helix-leucine zipper protein that stimulates transcription by binding to a sterol regulatory element. Proc Natl Acad Sci USA. 1993;90:11603–11607.
- Yokoyama C, Wang X, Briggs MR, et al. SREBP-1, a basic-helix-loop-helix-leucine zipper protein that controls transcription of the low density lipoprotein receptor gene. Cell. 1993;75:187–197.
- Rawson RB, Zelenski NG, Nijhawan D, et al. Complementation cloning of S2P, a gene encoding a putative metalloprotease required for intramembrane cleavage of SREBPs. Mol Cell. 1997;1:47–57.
- Sakai J, Rawson RB, Espenshade PJ, et al. Molecular identification of the sterol-regulated luminal protease that cleaves SREBPs and controls lipid composition of animal cells. Mol Cell. 1998;2:505–514.
- Briggs MR, Yokoyama C, Wang X, et al. Nuclear protein that binds sterol regulatory element of low density lipoprotein receptor promoter. I. Identification of the protein and delineation of its target nucleotide sequence. J Biol Chem. 1993;268:14490–14496.
- Moon YA, Liang G, Xie X, et al. The Scap/SREBP pathway is essential for developing diabetic fatty liver and carbohydrate-induced hypertriglyceridemia in animals. Cell Metab. 2012;15:240–246.
- Tang JJ, Li JG, Qi W, et al. Inhibition of SREBP by a small molecule, betulin, improves hyperlipidemia and insulin resistance and reduces atherosclerotic plaques. Cell Metab. 2011;13:44–56.
- Kamisuki S, Mao Q, Abu-Elheiga L, et al. A small molecule that blocks fat synthesis by inhibiting the activation of SREBP. Chem Biol. 2009;16:882–892.
- Radhakrishnan A, Ikeda Y, Kwon HJ, et al. Sterol-regulated transport of SREBPs from endoplasmic reticulum to Golgi: oxysterols block transport by binding to INSIG. Proc Natl Acad Sci USA. 2007;104:6511–6518.
- Adams CM, Reitz J, De Brabander JK, et al. Cholesterol and 25-hydroxycholesterol inhibit activation of SREBPs by different mechanisms, both involving SCAP and INSIGS. J Biol Chem. 2004;279:52772–52780.
- Watanabea M, Uesugi M. Small-molecule inhibitors of SREBP activation – potential for new treatment of metabolic disorders. Med Chem Commun. 2013;4:12.
- Devries-Seimon T, Li Y, Yao PM, et al. Cholesterol-induced macrophage apoptosis requires ER stress pathways and engagement of the type A scavenger receptor. J Cell Biol. 2005;171:61–73.
- Hager L, Li L, Pun H, et al. Lecithin:cholesterolacyltransferase deficiency protects against cholesterol-induced hepatic endoplasmic reticulum stress in mice. J Biol Chem. 2012;287:20755–20768.
- Sozen E, Ozer NK. Impact of high cholesterol and endoplasmic reticulum stress on metabolic diseases: an updated mini-review. Redox Biol. 2017;12:456–461.
- Feng B, Yao PM, Li Y, et al. The endoplasmic reticulum is the site of cholesterol-induced cytotoxicity in macrophages. Nat Cell Biol. 2003;5:781–792.
- Sekiya M, Yamamuro D, Ohshiro T, et al. Absence of nceh1 augments 25-hydroxycholesterol-induced ER stress and apoptosis in macrophages. J Lipid Res. 2014;55:2082–2092.
- Okada K, Minamino T, Tsukamoto Y, et al. Prolonged endoplasmic reticulum stress in hypertrophic and failing heart after aortic constriction: possible contribution of endoplasmic reticulum stress to cardiac myocyte apoptosis. Circulation. 2004;110:705–712.
- Ozcan U, Cao Q, Yilmaz E, et al. Endoplasmic reticulum stress links obesity, insulin action, and type 2 diabetes. Science. 2004;306:457–461.
- Bozaykut P, Sahin A, Karademir B, et al. Endoplasmic reticulum stress related molecular mechanisms in nonalcoholic steatohepatitis. Mech Ageing Dev. 2016;157:17–29.
- Repa JJ, Mangelsdorf DJ. The role of orphan nuclear receptors in the regulation of cholesterol homeostasis. Annu Rev Cell Dev Biol. 2000;16:459–481.
- Joseph SB, McKilligin E, Pei L, et al. Synthetic LXR ligand inhibits the development of atherosclerosis in mice. Proc Natl Acad Sci USA. 2002;99:7604–7609.
- Repa JJ, Berge KE, Pomajzl C, et al. Regulation of ATP-binding cassette sterol transporters ABCG5 and ABCG8 by the liver X receptors alpha and beta. J Biol Chem. 2002;277:18793–18800.
- Venkateswaran A, Laffitte BA, Joseph SB, et al. Control of cellular cholesterol efflux by the nuclear oxysterol receptor LXR alpha. Proc Natl Acad Sci USA. 2000;97:12097–12102.
- Terasaka N, Hiroshima A, Koieyama T, et al. T-0901317, a synthetic liver X receptor ligand, inhibits development of atherosclerosis in LDL receptor-de¢cient mice. FEBS Lett. 2003;536:6.
- Song C, Hiipakka RA, Liao S. Auto-oxidized cholesterol sulfates are antagonistic ligands of liver X receptors: implications for the development and treatment of atherosclerosis. Steroids. 2001;66:473–479.
- Jafari R, Almqvist H, Axelsson H, et al. The cellular thermal shift assay for evaluating drug target interactions in cells. Nat Protoc. 2014;9:2100–2122.
- Martinez Molina D, Jafari R, Ignatushchenko M, et al. Monitoring drug target engagement in cells and tissues using the cellular thermal shift assay. Science. 2013;341:84–87.
- Martinez Molina D, Nordlund P. The cellular thermal shift assay: a novel biophysical assay for in situ drug target engagement and mechanistic biomarker studies. Annu Rev Pharmacol Toxicol. 2016;56:141–161.
- Wang J, Shi ZQ, Xu X, et al. Triptolide inhibits amyloid-beta production and protects neural cells by inhibiting CXCR2 activity. J Alzheimers Dis. 2013;33:217–229.
- Jerabek-Willemsen M, Wienken CJ, Braun D, et al. Molecular interaction studies using microscale thermophoresis. Assay Drug Dev Technol. 2011;9:342–353.
- Wienken CJ, Baaske P, Rothbauer U, et al. Protein-binding assays in biological liquids using microscale thermophoresis. Nat Commun. 2010;1:100.
- Gong X, Li J, Shao W, et al. Structure of the WD40 domain of SCAP from fission yeast reveals the molecular basis for SREBP recognition. Cell Res. 2015;25:401–411.
- Radhakrishnan A, Sun LP, Kwon HJ, et al. Direct binding of cholesterol to the purified membrane region of SCAP: mechanism for a sterol-sensing domain. Mol Cell. 2004;15:259–268.
- Zheng ZG, Zhou YP, Zhang X, et al. Anhydroicaritin improves diet-induced obesity and hyperlipidemia and alleviates insulin resistance by suppressing SREBPs activation. Biochem Pharmacol. 2016;122:42–61.
- Ye J, Rawson RB, Komuro R, et al. ER stress induces cleavage of membrane-bound ATF6 by the same proteases that process SREBPs. Mol Cell. 2000;6:1355–1364.
- Zheng ZG, Zhang X, Liu XX, et al. Inhibition of HSP90β improves lipid disorders by promoting mature SREBPs degradation via the ubiquitin-proteasome system. Theranostics. 2019;9:5769–5783.
- Dasari B, Prasanthi JR, Marwarha G, et al. The oxysterol 27-hydroxycholesterol increases beta-amyloid and oxidative stress in retinal pigment epithelial cells. BMC Ophthalmol. 2010;10:22.
- Krycer JR, Sharpe LJ, Luu W, et al. The Akt-SREBP nexus: cell signaling meets lipid metabolism. Trends Endocrinol Metab. 2010;21:268–276.
- Salvado L, Palomer X, Barroso E, et al. Targeting endoplasmic reticulum stress in insulin resistance. Trends Endocrinol Metab. 2015;26:438–448.
- Asano L, Watanabe M, Ryoden Y, et al. Vitamin D metabolite, 25-hydroxyvitamin D, regulates lipid metabolism by inducing degradation of SREBP/SCAP. Cell Chem Biol. 2017;24:207–217.
- Mizushima N, Yoshimori T, Levine B. Methods in mammalian autophagy research. Cell. 2010;140:313–326.
- Shintani T, Klionsky DJ. Autophagy in health and disease: a double-edged sword. Science. 2004;306:990–995.
- Mauvezin C, Neufeld TP. Bafilomycin A1 disrupts autophagic flux by inhibiting both V-ATPase-dependent acidification and Ca-P60A/SERCA-dependent autophagosome-lysosome fusion. Autophagy. 2015;11:1437–1438.
- Pfister MF, Ruf I, Stange G, et al. Parathyroid hormone leads to the lysosomal degradation of the renal type II Na/Pi cotransporter. Proce Proc Natl Acad Sci USA. 1998;95:1909–1914.
- Kimura S, Noda T, Yoshimori T. Dissection of the autophagosome maturation process by a novel reporter protein, tandem fluorescent-tagged LC3. Autophagy. 2007;3:452–460.
- Klionsky DJ, Abdelmohsen K, Abe A, et al. Guidelines for the use and interpretation of assays for monitoring autophagy. Autophagy. 2016;12:1–222.
- Roy M, Liang L, Xiao X, et al. Lycorine downregulates HMGB1 to inhibit autophagy and enhances bortezomib activity in multiple myeloma. Theranostics. 2016;6:2209–2224.
- Kornfeld S. Trafficking of lysosomal enzymes. Faseb J. 1987;1:462–468.
- Shao W, Espenshade PJ. Sterol regulatory element-binding protein (SREBP) cleavage regulates Golgi-to-endoplasmic reticulum recycling of SREBP cleavage-activating protein (SCAP). J Biol Chem. 2014;289:7547–7557.
- Sahu R, Kaushik S, Clement CC, et al. Microautophagy of cytosolic proteins by late endosomes. Dev Cell. 2011;20:131–139.
- Morozova K, Clement CC, Kaushik S, et al. Structural and biological interaction of hsc-70 protein with phosphatidylserine in endosomal microautophagy. J Biol Chem. 2016;291:18096–18106.
- Tekirdag K, Cuervo AM. Chaperone-mediated autophagy and endosomal microautophagy: joint by a chaperone. J Biol Chem. 2018;293:5414–5424.
- Fregno I, Fasana E, Bergmann TJ, et al. ER-to-lysosome-associated degradation of proteasome-resistant ATZ polymers occurs via receptor-mediated vesicular transport. Embo J. 2018;37(17):e99259.
- Tekirdag K, Cuervo AM. Chaperone-mediated autophagy and endosomal microautophagy: jointed by a chaperone. J Biol Chem. 2018;293:5414–5424.
- Sun LP, Li L, Goldstein JL, et al. Insig required for sterol-mediated inhibition of Scap/SREBP binding to COPII proteins in vitro. J Biol Chem. 2005;280:26483–26490.
- Shao W, Machamer CE, Espenshade PJ. Fatostatin blocks ER exit of SCAP but inhibits cell growth in a SCAP-independent manner. J Lipid Res. 2016;57:1564–1573.
- Su L, Zhou L, Chen FJ, et al. Cideb controls sterol-regulated ER export of SREBP/SCAP by promoting cargo loading at ER exit sites. Embo J. 2019;38(8):e100156.
- Stephens DJ, Lin-Marq N, Pagano A, et al. COPI-coated ER-to-Golgi transport complexes segregate from COPII in close proximity to ER exit sites. J Cell Sci. 2000;113:2177–2185.
- Xiao C, Srinivasan R, Drenan RM, et al. Characterizing functional α6β2 nicotinic acetylcholine receptors in vitro: mutant β2 subunits improve membrane expression, and fluorescent proteins reveal responsive cells. Biochem Pharmacol. 2011;82:852–861.
- Birgisdottir ÅB, Lamark T, Johansen T. The LIR motif–crucial for selective autophagy. J Cell Sci. 2013;126:3237–3247.
- Otto J, Ordovas JM, Smith D, et al. Lovastatin inhibits diet-induced atherosclerosis in F1b Golden Syrian-Hamsters. Atherosclerosis. 1995;114:19–28.
- Lebeau P, Al-Hashimi A, Sood S, et al. Endoplasmic reticulum stress and Ca2+ depletion differentially modulate the sterol regulatory protein PCSK9 to control lipid metabolism. J Biol Chem. 2017;292:1510–1523.
- Yoshida H. ER stress and diseases. Febs J. 2007;274:630–658.
- Brovkovych V, Izhar Y, Danes JM, et al. Fatostatin induces pro- and anti-apoptotic lipid accumulation in breast cancer. Oncogenesis. 2018;7:66.
- Kuan YC, Hashidume T, Shibata T, et al. Heat shock protein 90 modulates lipid homeostasis by regulating the stability and function of sterol regulatory element-binding protein (SREBP) and SREBP cleavage-activating protein. J Biol Chem. 2017;292:3016–3028.
- Birgisdottir AB, Lamark T, Johansen T. The LIR motif-crucial for selective autophagy. J Cell Sci. 2013;126:3237–3247.
- Pankiv S, Clausen TH, Lamark T, et al. p62/SQSTM1 binds directly to Atg8/LC3 to facilitate degradation of ubiquitinated protein aggregates by autophagy. J Biol Chem. 2007;282:24131–24145.
- Puvirajesinghe TM, Bertucci F, Jain A, et al. Identification of p62/SQSTM1 as a component of non-canonical Wnt VANGL2-JNK signalling in breast cancer. Nat Commun. 2016;7:10318.
- Mrschtik M, Ryan KM. Lysosomal proteins in cell death and autophagy. Febs J. 2015;282:1858–1870.
- Komatsu M, Waguri S, Koike M, et al. Homeostatic levels of p62 control cytoplasmic inclusion body formation in autophagy-deficient mice. Cell. 2007;131:1149–1163.
- Liu WJ, Ye L, Huang WF, et al. p62 links the autophagy pathway and the ubiqutin–proteasome system upon ubiquitinated protein degradation. Cell Mol Biol Lett. 2016;21:29.
- Jadhav T, Geetha T, Jiang J, et al. Identification of a consensus site for TRAF6/p62 polyubiquitination. Biochem Biophys Res Commun. 2008;371:521–524.
- An S, Fu L. Small-molecule PROTACs: an emerging and promising approach for the development of targeted therapy drugs. EBioMedicine. 2018;36:553–562.
- Chi KR. Drug developers delve into the cell’s trash-disposal machinery. Nat Rev Drug Discov. 2016;15:295–297.
- Banik S, Pedram K, Wisnovsky S, et al. Lysosome targeting chimeras (LYTACs) for the degradation of secreted and membrane proteins. ChemRxiv. 2019. DOI:https://doi.org/10.26434/CHEMRXIV.7927061.V2.
- Goldstein JL, Brown MS. The LDL receptor. Arterioscler Thromb Vasc Biol. 2009;29:431–438.
- Kita T, Brown MS, Goldstein JL. Feedback regulation of 3-hydroxy-3-methylglutaryl coenzyme A reductase in livers of mice treated with mevinolin, a competitive inhibitor of the reductase. J Clin Invest. 1980;66:1094–1100.
- Singer II, Kawka DW, Kazazis DM, et al. Hydroxymethylglutaryl-coenzyme A reductase-containing hepatocytes are distributed periportally in normal and mevinolin-treated rat livers. Proce Proc Natl Acad Sci USA. 1984;81:5556–5560.
- Chen K, Zeng J, Xiao H, et al. Regulation of glucose metabolism by p62/SQSTM1 through HIF1α. J Cell Sci. 2016;129:817–830.
- Niu MM, Qin JY, Tian CP, et al. Tubulin inhibitors: pharmacophore modeling, virtual screening and molecular docking. Acta Pharmacol Sin. 2014;35:967–979.