
ABSTRACT
An increase in protein synthesis following learning is a fundamental and evolutionarily conserved mechanism of long-term memory. To maintain homeostasis, this protein synthesis must be counterbalanced by mechanisms such as protein degradation. Recent studies reported that macroautophagy/autophagy, a major protein degradation mechanism, is required for long-term memory formation. However, how learning regulates autophagy and recruits it into long-term memory formation remains to be established. Here, we show that inhibitory avoidance in rats significantly increases the levels of autophagy and lysosomal degradation proteins, including BECN1/beclin 1, LC3-II, SQSTM1/p62 and LAMP1, as well as autophagic flux in the hippocampus. Moreover, pharmacological inhibition or targeted molecular disruption of the learning-induced autophagy impairs long-term memory, leaving short-term memory intact. The increase in autophagy proteins results from active translation of their mRNA and not from changes in their total mRNA levels. Additionally, the induction of autophagy requires the immediate early gene Arc/Arg3.1. Finally, in contrast to classical regulation of autophagy in other systems, we found that the increase in autophagy upon learning is dispensable for the increase in protein synthesis. We conclude that coupling between learning-induced translation and autophagy, rather than translation per se, is an essential mechanism of long-term memory.
Abbreviations: AAV: adeno-associated virus; ARC/ARG3.1: activity regulated cytoskeletal-associated protein; ATG: autophagy related; DG: dentate gyrus; GFP: green fluorescent protein; IA: inhibitory avoidance; LAMP1: lysosomal-associated membrane protein 1; MAP1LC3B/LC3B: microtubule-associated protein 1 light chain 3 beta; ODN: oligodeoxynucleotide; qPCR: quantitative polymerase chain reaction; SBI: SBI0206965; SQSTM1/p62: sequestosome 1; SUnSET: surface sensing of translation; TRAP: translating ribosome affinity purification; ULK1: unc-51 like kinase 1
Introduction
A major evolutionarily conserved biological requirement of long-term memory formation is a significant increase in de novo protein synthesis. Different types of learning have been shown to elicit de novo mRNA translation, inhibition of which prevents the consolidation and storage of long-term memories [Citation1–3]. The proteins generated by this increased translation include gene expression regulators as well as effector proteins necessary for long-term synaptic plasticity and the restructuring of neural processes that store the new memory [Citation4].
The learning-induced increase in mRNA translation demands activation of homeostatic mechanisms, which must take place in order to rebalance protein homeostasis (proteostasis), hence maintaining a healthy system. A major process that controls proteostasis is protein degradation [Citation5–7]. Whereas de novo protein synthesis has been more extensively investigated in plasticity and memory, as well as in cognitive disorders [Citation3,Citation8,Citation9], much less is known about whether and how protein degradation contributes to these processes.
Protein degradation occurs via two main intracellular catabolic systems, the ubiquitin–proteasome and autophagy–lysosome systems, both of which have been implicated in long-term memory [Citation10,Citation11]. Although degradation of synaptic proteins via the ubiquitin-proteasomal system has been partially investigated, the potential regulation of long-term synaptic plasticity by autophagy has been much less explored.
Autophagy is an evolutionarily conserved degradation process that sequesters cytoplasmic proteins, lipids, nucleic acids, polysaccharides, and even organelles into double-membrane phagophores termed autophagosomes for subsequent lysosomal degradation. There are three distinct types of autophagy: chaperone-mediated autophagy (CMA), microautophagy, and macroautophagy/autophagy.
Autophagy is initiated by dephosphorylation of ULK1 (unc-51 like kinase 1), which leads to the nucleation and assembly of the initial phagophore membrane by the BECN1/beclin 1-containing class III phosphatidylinositol 3-kinase (PtdIns3K) complex [Citation12]. Maturation of the autophagosome is promoted by the activities of multiple proteins, including the conversion of the cytosolic form of MAP1LC3B/LC3B (microtubule-associated protein 1 light chain 3 beta; LC3B-I) to lipidated LC3B-II, which is recruited to the phagophore membranes. The increased level of LC3B-II correlates with increased number of autophagosomes, and thus, LC3B-II level is considered a proxy of the autophagic flux [Citation13].
Autophagy is key to maintaining the development, integrity, and survival of neurons [Citation6,Citation14], is regulated in response to cellular starvation, stressors and damage [Citation15], and is altered in diseases [Citation16,Citation17]. Deficiencies in autophagy are associated with disorders of aging [Citation18], neurodegeneration [Citation19,Citation20], and neural development [Citation21], all of which have in common a failure to remove damaged proteins and defective organelles. Although it is known that autophagy modulates synaptic organization and plasticity by degrading post-synaptic receptors [Citation22–24], our understanding of its contribution to learning and memory remains limited. Recent studies functionally implicated autophagy in memory formation. Hylin et al. [Citation25] found that water maze learning in mice increased the number of autophagosomes and that pharmacological inhibition of autophagy with 3-methyladenine or spautin-1 in the hippocampus prior to training disrupts long-term memory retention; conversely, activating autophagy with an activator peptide (Tat-Beclin 1) improved long-term memory. Glatigny et al. [Citation24] reported that contextual fear conditioning (CFC) in mice significantly increased mRNA levels of Pik3c3/Vps34 and Atg5 but decreased the levels of Sqstm1/p62. They also found that viral-mediated knockdown of the autophagy proteins RB1CC1/FIP200, BECN1 or ATG12 or hippocampal injection of autophagy pharmacological inhibitors spautin-1 and leupeptin disrupted novel object recognition and CFC memories, whereas Tat-Beclin 1 promoted retention of both types of memories. Bhukel et al. [Citation26] reported that impairing autophagy in the Drosophila learning center (mushroom body), but not in other brain regions, triggered changes normally restricted to aged brains. They also showed that blocking autophagy leads to impaired associative olfactory memory and a brain-wide ultrastructural increase of presynaptic active zones (metaplasticity), a state incompatible with memory formation.
Although these studies revealed that autophagy regulation takes place following learning and is implicated in memory formation, the mechanisms by which autophagy is regulated in response to learning remains unknown. In particular, the relation between de novo mRNA translation and autophagy remains to be understood. In fact, a fundamental and evolutionarily conserved requirement for long-term memory is de novo mRNA translation, which is rapidly induced upon learning [Citation3,Citation27,Citation28]. Thus far, studies on cancer, metabolic stress and cell survival have led to the general conclusion that activation of mRNA translation suppresses autophagy, whereas autophagy is required to generate amino acids for crucial protein synthesis [Citation29,Citation30]. Therefore, one would predict that autophagy induced by learning is necessary for the increase in mRNA translation.
Here, we employed inhibitory avoidance (IA) in rats to determine: i) whether learning regulates the levels of proteins critical for all stages of autophagy, ii) whether and how autophagy is linked to learning-induced translation, and iii) how this link contributes to memory formation.
Results
IA learning upregulated autophagy and lysosome proteins
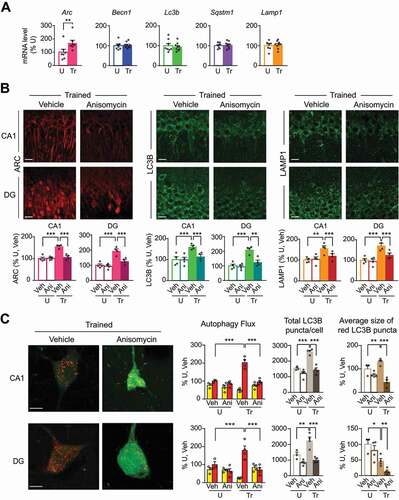
IA learning in rats, which produces a long-term contextual aversive memory after a single training trial, significantly increased the levels of proteins involved in various steps of autophagy and lysosomal degradation. Specifically, we carried out immunohistochemical staining of hippocampal rat sections at 1 h after training to relatively quantify: 1) BECN1, which is required for the nucleation of phagophore, 2) LC3B, which exists in an inactive cytosolic form that appears as diffused cytoplasmic immunostaining, and as phosphatidylethanolamine-conjugated form, which is recruited to autophagosomal membranes and appears as punctate immunostaining [Citation13], 3) SQSTM1/p62 (sequestosome 1), which interacts with poly-ubiquitinated protein aggregates through a ubiquitin-binding domain and with LC3B through its LC3-binding domain, and shuttles ubiquitinated proteins to autophagosome, and, 4) LAMP1 (lysosomal-associated membrane protein 1), a marker of the heterogeneous population of acidic vesicles including late endosomes and lysosomes.
As shown in , the levels of all these proteins significantly increased with training throughout the dorsal hippocampus relative to untrained controls. Morphological assessment of the immunofluorescence in CA1 stratum pyramidale and stratum radiatum and dentate gyrus (DG) stratum granulosum and stratum moleculare indicated that the proteins were mainly localized in neurons, except for SQSTM1 and LAMP1, which were detected in both neuronal and non-neuronal types of cells (Figure S1). Double immunostaining with antibodies specific for autophagy proteins and markers specific for neurons (MAP2 [microtubule-associated protein 2]), astrocytes (GFAP [glial fibrillary acidic protein]) or microglia (AIF1/IBA1 [allograft inflammatory factor 1]) further confirmed that the inductions of BECN1 and LC3B were found only in neurons. The number of colocalized elements was expressed as percent of cells positive for the autophagy or lysosomal marker relative to the neuronal, astrocyte of microglia marker. The induction of SQSTM1 was found to be 98% in neurons and about 2% in microglia, and the induction of LAMP1 was found to be 92.5% in neurons and about 6% in astrocytes and 1.5% microglia (data not shown).
Figure 1. IA learning increased the levels of autophagy and lysosome proteins in the dorsal hippocampus. Representative dorsal hippocampal sections (top panels; scale bar: 500 μm) and confocal images of fields of view of the CA1 and DG hippocampal subregions (scale bar: 20 μm) with higher-magnification enlargements below (scale bar: 5 μm) of the corresponding boxed areas immunostained for (A) BECN1, (B) LC3B, (C) SQSTM1, and (D) LAMP1. Sections were obtained from rats trained (Tr) and euthanized 1 h later (n = 4). Control untrained rats (U) were left in their home cages (n = 4). For each rat, 16 images (8 per side) were quantified and averaged. Dots represent the average values for each rat. Two independent experiments of n = 2 each. Bar graphs represent relative quantifications of total immunofluorescence intensities (Total), intensity in cell soma (Soma) versus processes (Process), and number and average size of puncta of the indicated proteins in CA1 and DG. (E) Representative western blots and densitometric analyses of LC3B (LC3-I and -II) normalized to ACTB, and the ratio LC3-II:LC3-I in dorsal hippocampus extracts obtained from rats trained and euthanized 1 h later. Control untrained rats (U) were left in their home cages. n = 9 rats per group. Two independent experiments of n = 5 each and n = 4 each, respectively. Data are expressed as mean percentages ± s.e.m of mean Untrained (U) values. Dots represent the average values for each rat. Unpaired t-test. * P < 0.05, ** P < 0.01, *** P < 0.001
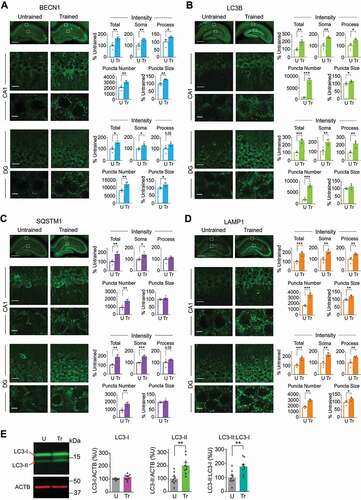
In the CA1 and DG hippocampal subregions, staining for all proteins exhibited both diffuse cytosolic and punctate fluorescence patterns. Punctate fluorescence of autophagy markers like LC3B, BECN1 and LAMP1, and substrates, like SQSTM1, is considered representative of autophagic structures [Citation31]; hence, in addition to total fluorescence intensity, we quantified the number and size of puncta.
Quantifications of confocal images taken in the soma or process layers revealed that IA training increased the total fluorescence intensity of BECN1, LC3B and LAMP1 in both soma and processes, but the increase in SQSTM1 intensity was observed exclusively in the soma (), suggesting that SQSTM1-selective autophagy mostly concerns neuronal cell bodies. Nuclei, which were identified by 4′,6-diamidino-2-phenylindole (DAPI) labeling, were negative for all four markers. In both CA1 and DG, training significantly increased the number of puncta of all markers and the average sizes of BECN1 and LAMP1 puncta. IA training significantly increased the average size of LC3B puncta in CA1, but not in DG, whereas the average size of SQSTM1 puncta did not change in either hippocampal subregion. The increased number of puncta, presumably indicating the number of autophagic structures, and size of puncta, a measure of the amount of cargo sequestered in the autophagic structures, suggests that IA learning considerably alters the autophagy process in the hippocampus. This increase in autophagy proteins, in fact, may be due to either increase in autophagosome formation or a blockade of autophagic flux, which would accumulate autophagy proteins because of inhibition of fusion of autophagosomes with lysosomes. Similar changes in immunofluorescence intensities of BECN1, LC3B, SQSTM1, and LAMP1 were also observed in the CA2 and CA3 subregions of the hippocampus (data not shown).
These training-induced changes in the dorsal hippocampus were selective for associative learning: unpaired context-shock experience (Un), which does not evoke IA memory [Citation32,Citation33], did not change the intensity, number, or size of BECN1, LC3B, SQSTM1, or LAMP1 puncta (Figure S1). Moreover, immunostaining of each autophagy marker was confirmed with additional antibodies (see methods for details, data not shown) and the specificity of antibodies used was confirmed by antisense oligodeoxynucleotide-mediated knockdown (see below).
Western blot analysis for LC3B revealed a significant increase in LC3B-II but no change in LC3B-I 1 h following training ().
Unfortunately, despite extensive attempts to quantify BECN1, SQSTM1 and LAMP1 by western blot analyses in dorsal hippocampal extracts (seven different types of lysis buffer and multiple tissue dissection conditions described in the methods section), we failed to produce reproducible results, except for LC3B in extracts obtained with sample buffer (described in the methods section). In other words, in some but not all repetitions of western blot experiments, we were able to detect significant increases in BECN1, SQSTM1 and LAMP1 (examples of no change shown Figure S2). The different outcome on BECN1, SQSTM1 and LAMP1 western blots compared to immunohistochemical assessments could be due to the injury response caused by tissue dissection required for western blots and/or relative changes vs. antibody reactivity. Alternatively, it is also possible that changes could not be reliably detected by western blot analysis due to a relatively limited number of cell populations affected by training. Nevertheless, these changes could be consistently detected by immunohistochemical analyses.
Collectively, our data demonstrated that IA learning upregulates proteins critical for autophagy throughout the dorsal hippocampus. The proteins accumulate with distinctive features in particular sub-regions and subcellular compartments.
IA learning increased autophagic flux
To measure autophagic flux, AAV-mCherry-GFP-LC3B was expressed in the dorsal hippocampus of rats [Citation34]. The fused mCherry-GFP-LC3B is a pH-sensitive sensor that is used to monitor autophagy in live cells. The GFP tag is acid-sensitive while the mCherry tag is acid-insensitive. As LC3B-II is recruited to autophagosomal membranes, the double-tagged mCherry-GFP-LC3B–labeled puncta appear yellow in autophagosomes. However, fusion of autophagosomes to late endosomes or lysosomes (i.e., when there is autophagic flux) results in acidic amphisomes or autolysosomes where the green fluorescence from GFP is lost, hence resulting in an increase in red puncta. Subsequently, the red fluorescence from mCherry is lost when the double-tagged protein is degraded.
Three weeks of viral infection showed reliable and strong expression of mCherry-GFP-LC3B in the dorsal hippocampus () and was used in all our autophagic flux experiments.
Figure 2. IA learning increased autophagic flux in the dorsal hippocampus. (A) Representative dorsal hippocampal sections (scale bar: 500 μm), confocal images of fields of view (scale bar: 50 μm), and higher-magnification enlargements (scale bar: 10 μm; below) taken from (B) CA1 and (C) DG subregions of dorsal hippocampus infected with AAV-mCherry-GFP-LC3B in rats trained (Tr) and euthanized 1 h later, compared with untrained (U) rats. Bar graphs represent relative quantifications of yellow and red LC3B puncta fluorescence intensity (autophagic flux), percentage of infected (transduced) cells containing LC3B puncta, total number of LC3B (yellow and red LC3B) puncta per cell, and average size of red LC3B puncta per cell in CA1 and DG. Data are shown as mean percentages ± s.e.m. of untrained control (U) mean values. n = 4 rats per group. Two independent experiments of n = 2 each. Autophagic flux: for each rat, 16 images (8 per side) were quantified and averaged. Total number and size of puncta: for each rat, 20–25 cells were quantified and averaged. Dots represent the average values for each rat. Two-way ANOVA followed by Sidak’s post-hoc analysis. Unpaired t-test was used for all other comparisons. * P < 0.05, ** P < 0.01, *** P < 0.001. Numeric values and detailed statistical analyses are reported in Table S1
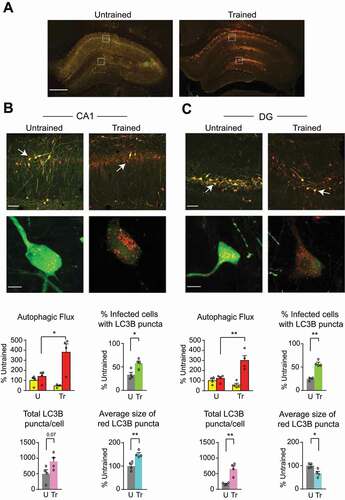
Autophagic flux was assessed 1 h after IA training by analyzing four parameters to measure autophagosome content and LC3B flux: (i) the percentage of infected (transduced) cells containing LC3B puncta to assess the changes in response to learning; (ii) the ratio between number of red and yellow LC3B puncta to evaluate LC3B flux; (iii) the total number of GFP and mCherry puncta per cell, to account for amount of vesicular content; and (iv) the average size of red LC3B puncta.
In the CA1 subregion of dorsal hippocampus of the untrained control rats, 41.4% of AAV-transduced cells contained LC3B puncta. The remaining 58.6% of transduced cells showed strong but diffused cytosolic LC3B staining. Upon IA training, the number of transduced cells were similar compared to that of untrained but the number of cells with LC3B puncta increased significantly to 59.6% of the transduced cells (). In the DG of untrained rats, 24.6% of transduced cells contained LC3B puncta. Upon training, the number of cells with LC3B puncta in DG increased significantly to 57.4% of the transduced cells (). Training also significantly increased the total number of LC3B puncta, especially the number of red LC3B puncta, indicating that LC3B punctate structures increased in acidified compartments. Notably, relative to untrained controls, trained rats showed a trend toward an increase in the number of LC3B puncta per cell, which was not statistically significant (p = 0.07); however, they had a significant increase in the size of red LC3B puncta in CA1 (). In DG, training significantly increased the number of LC3B puncta per cell and decreased the size of red puncta (). We concluded that IA training significantly augmented autophagic flux in the dorsal hippocampus. In addition, the differences in the size of red puncta in different sub-regions of the hippocampus suggested that autophagy is differentially regulated in the different hippocampal sub-regions.
Inhibition of autophagy impaired long-term memory
We then tested the effect of blocking autophagy–lysosome functions in the dorsal hippocampus of rats immediately after IA training on memory retention. First, we determined the dose-response curves of: i) SBI0206965 (SBI), a selective blocker of ULK1 phosphorylation that prevents initiation of phagophore formation; ii) bafilomycin A1, a vATPase inhibitor that blocks autophagosome–lysosome fusion, thus preventing autophagic flux, and two inhibitors of lysosomal function: iii) chloroquine, which blocks lysosomal acidification and iv) leupeptin, which blocks cysteine-serine-threonine peptidases. These experiments identified optimal doses of the autophagy-lysosomal inhibitors that significantly impaired memory retention (Figure S3).
Using the optimal doses, we then confirmed that SBI and bafilomycin A1 block autophagic flux in the hippocampus in vivo. By preventing degradation of autophagy proteins, these inhibitors are in fact expected to cause their accumulation [Citation31,Citation35]. Compared to vehicle, bilateral hippocampal injection of either 5 mM of SBI or 0.02 μM of bafilomycin A1 caused significant accumulation of training-induced LC3B and SQSTM1 in both CA1 and DG () at 1 h after training. Bafilomycin A1 significantly enhanced the cytoplasmic fluorescence (total intensity) of LC3B and SQSTM1 as well as the size of LC3B puncta, which appeared as large aggregates, in both CA1 and DG of trained rats; furthermore, it decreased the number of LC3B puncta but increased the number of SQSTM1 puncta in both hippocampal subregions. SBI significantly upregulated the level of cytoplasmic LC3B fluorescence; it also increased the size of LC3B puncta but significantly reduced the number of LC3B puncta in CA1, but not in DG, and did not change SQSTM1 puncta size or number in either subregion (). Neither SBI nor bafilomycin A1 changed the LC3B or SQSTM1 fluorescence intensities or puncta number and size in untrained rats, confirming that the changes in autophagy protein levels are IA learning-dependent (Figure S4A,B). As an increase in the intensity and size of LC3B and SQSTM1 puncta in the presence, as compared to absence, of a lysosome inhibitor, presumably correlates with the number of autophagosomes that would have been degraded during the treatment period [Citation31], we concluded that the inhibitors indeed blocked the progression of autophagy induced by IA learning.
Figure 3. Inhibition of autophagy impaired long-term memory. Representative immunofluorescence images of dorsal hippocampal sections (top panel; scale bar: 500 μm) and confocal images below (scale bar: 20 μm) of boxed CA1 and DG hippocampal subregions obtained from rats trained and bilaterally injected with vehicle (Tr, Veh), SBI0206965 (Tr, SBI) or bafilomycin A1 (Tr, Baf), and euthanized 1 h later. Sections were immunostained for (A) LC3B and (B) SQSTM1. Untrained control rats were bilaterally injected with vehicle and euthanized at matched timepoints (U, Veh). Right: bar graphs represent relative quantifications of total immunofluorescence intensities (Total), total number of puncta (Number), and average puncta size (Size). Data are presented as mean percentage ± s.e.m. of vehicle-injected untrained rats (U, Veh). For A and B, n = 4 rats per group; two independent experiments of n = 2 each. For each rat, 16 images (8 per side) were quantified and averaged. Dots represent the average values for each rat. One-way ANOVA followed by Tukey’s post-hoc analysis. (C-E) Experimental schedules are shown above graphs. (C) Memory retention is expressed as mean latency ± s.e.m. (in s). Rats were bilaterally injected (↑) with SBI, bafilomycin A1, chloroquine, or leupeptin immediately after training (Tr), and retention was tested 1 d (Test 1, T1) and 7 d (Test 2, T2) after training. One day later, the rats then underwent a reminder shock (RS) and were tested again one day later (9th day after training; Test 3, T3). n = 8–12 rats per group. For SBI, chloroquine and leupeptin: two independent experiments of n = 4 each. For bafilomycin A1: three independent experiments of n = 4 each. Two-way repeated measure ANOVA across testing times followed by Sidak’s post-hoc analysis. (D) Memory retention is expressed as mean latency ± s.e.m. (in s). Rats trained (Tr) and bilaterally injected (↑) with SBI, bafilomycin A1, chloroquine, or leupeptin immediately after training were tested 1 h later for short-term memory. (E) Rats trained (Tr) and injected (↑) immediately after with the autophagy inhibitors were assessed for average distance traveled (in cm), mean velocity (in cm/s), and time spent in the center of the open field (in s). For D and E, n = 8 rats per group. Two independent experiments of n = 4 each. One-way ANOVA followed by Tukey’s post-hoc analysis. * P < 0.05, ** P < 0.01, *** P < 0.001. Numerical values and detailed statistical analyses are reported in Table S1
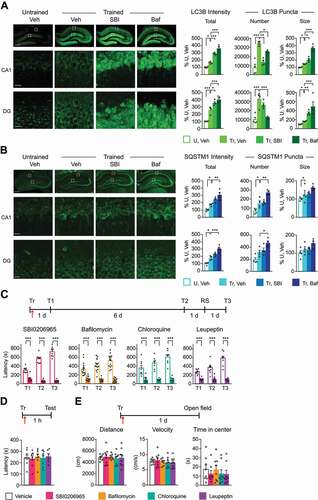
Finally, we determined the effect of all inhibitors on learning, short-term and long-term memory retentions. Bilateral hippocampal injection of SBI, bafilomycin A1, chloroquine (2 mM), or leupeptin (10 mM) immediately after IA training significantly impaired memory retention at 1 d (Test 1, T1) and 7 d (Test 2, T2) after training (). The memory loss caused by the inhibitors was not reversed by a reminder footshock (RS) given in a different context 1 d after Test 2 and tested 1 d later (Test 3, T3), indicating that blocking autophagy prevents memory consolidation and storage. Furthermore, bilateral injection of autophagy or lysosomal inhibitor had no effect on short-term memory (STM), tested 1 h after training (). The inhibitors’ failure to affect short-term memory indicated that their disruptive effects on long-term memory were not due to nonspecific alteration in the ability to perform the inhibitory avoidance task.
Furthermore, none of the inhibitors affected locomotion/anxiety measures, as determined by open field response 1 d after injection. In fact, compared to vehicle-injected controls, rats that received the injection of the autophagy inhibitors had similar total distance traveled, mean velocity, and time spent in the center of the open field arena (). Rats that received bilateral injection of inhibitors into the dorsal hippocampus, which exhibited memory impairment, were able to acquire a new IA memory following retraining, indicating that the hippocampus was not functionally damaged by the injection of the inhibitors (Figure S3). Finally, hippocampi injected with SBI or bafilomycin A1 showed no evidence of cell death, as determined by TUNEL immunostaining 24 h after injection (Figure S4C,D). We concluded that autophagy and lysosomal degradation in the hippocampus are required for long-term memory formation.
Knockdown of ATG7, BECN1, or LC3B disrupted long-term memory
To confirm the pharmacological data, we employed selective targeted knockdown of key proteins involved in autophagy or lysosomal functions. In order to avoid compensatory changes arising in response to persistent inhibition of autophagy, we used temporally limited knockdown approaches via antisense oligodeoxynucleotide (ODN) or siRNA delivery. These are efficient methods extensively proven to block increases in proteins evoked by learning [Citation32,Citation33,Citation36,Citation37]. Specifically, we employed antisense oligodeoxynucleotide (ODN) against either Becn1 or Lc3b, or siRNA against the autophagosome biogenesis regulator Atg7 [Citation38].
Compared to the respective control sequences, Atg7 siRNA and antisense ODNs against Becn1 or Lc3b, injected bilaterally into the dorsal hippocampus 0.5 h before IA training, significantly decreased the levels of the respective target proteins 1 h after training ( and S5A,B).
Figure 4. Knockdown of ATG7, BECN1, or LC3B expression impaired long-term memory. Experimental schedules shown at the top are related to: left panels, protein knockdown efficiency; middle panels, short-term memory; and right panels, long-term memory of (A) Atg7 siRNA, (B) Becn1 antisense-ODN, and (C) Lc3b antisense-ODN. Left panels: Representative western blot and densitometric analyses of ATG7 normalized to ACTB in dorsal hippocampus extracts obtained from rats bilaterally injected (↑) with Atg7 siRNA, and relative quantifications of total immunofluorescence intensities of BECN1 and LC3B in dorsal hippocampus sections obtained from rats bilaterally injected with antisense-ODNs (AS-ODN) against Becn1 or Lc3b relative to controls (control-siRNA or scrambled-ODN) 0.5 h before training and euthanized (Euth) 1 h after training. Control (Untrained, U) rats were bilaterally injected with the same interfering sequences and euthanized at matched timepoints. Western blot: n = 4 rats per group. Each dot represents a densitometric value from one rat. Immunostaining: n = 4 rats per group. Two independent experiments of n = 2 each. For each rat, 16 images (8 per side) were quantified and averaged. Dots represent the average values for each rat. Two-way ANOVA followed by Sidak’s post-hoc test showed significant knockdown. Middle panels: short-term memory retention expressed as mean latency ± s.e.m. (in s) of rats bilaterally injected (↑) with siRNA or antisense-ODNs 0.5 h before training (Tr) and tested 1 h after training (Test), relative to controls. Right panel: long-term memory, expressed as mean latency ± s.e.m. (in s) of rats bilaterally injected (↑) with Atg7 siRNA or antisense-ODNs or control sequences 0.5 h before training (Tr). Memory retention was tested 1 d (Test 1, T1) and 7 d after training (Test 2, T2). Rats then received a reminder shock (RS) 1 d later and were tested again the day after (Test 3, T3). Rats were then retrained and tested 1 d after re-training (Test 4, T4). For middle and right panels: n = 8 rats per group. Two independent experiments of n = 4 each. Two-way repeated-measures ANOVA followed by Sidak’s post-hoc analysis. * P < 0.05, ** P < 0.01, *** P < 0.001. Numerical values and detailed statistical analyses are reported in Table S1
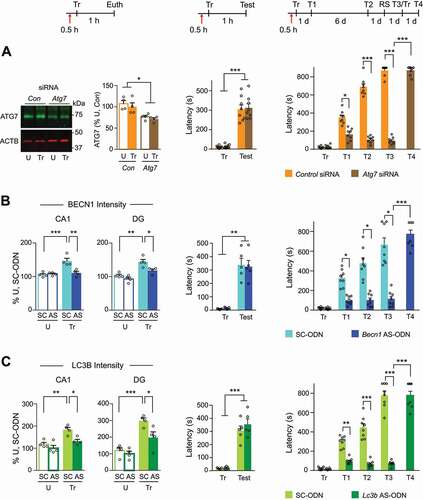
Atg7 siRNA and antisense ODNs against Becn1 or Lc3b significantly impaired memory retention 1 d after IA training (Test 1, T1) relative to the respective control sequences. Memory impairment persisted at 7 d after training (Test 2, T2) (). A reminder footshock given in a different context failed to reinstate memory (Test 3, T3), indicating an effect of memory formation rather than expression or inhibition. Retraining a day later resulted in significant memory retention the following day (Test 4, T4), showing that the disruption of memory by the antisense ODNs or siRNAs did not functionally damage the hippocampus. We detected no effects on short-term memory (STM) (), or locomotion and anxiety measures tested using the open field task (Figure S5C), with either antisense ODNs or Atg7 siRNA. In sum, similar to what we found with pharmacological inhibitors, also targeted molecular knockdown of ATG7, BECN1 or LC3B, restricted to a short temporal window around the time of IA learning, impaired the formation of long-term memory, while leaving learning and short-term memory intact.
Autophagy induced by IA learning required de novo translation, but this translation did not require autophagy
Next, we investigated whether IA learning-dependent upregulation of autophagy protein levels and autophagic flux resulted from transcriptional or translational regulation. Because the immediate early gene Arc/Arg3.1 (activity–regulated cytoskeletal-associated protein, encoding for the protein ARC/ARG3.1, thereafter referred to as ARC) is rapidly induced in neurons following stimuli at both the transcriptional and translational levels, its upregulation is widely used as an index of neuronal activation, particularly in learning and memory, where it plays critical roles [Citation39–41].
Quantitative polymerase chain reaction (qPCR) of dorsal hippocampal extracts revealed that, while, as expected, IA training significantly increased the mRNA level of Arc at 1 h after training, the mRNA levels of Becn1, Lc3b, Sqstm1 and Lamp1 in trained rats remained unchanged relative to untrained controls ().
Figure 5. Increase in the levels of autophagy proteins and autophagic flux following learning required de novo translation. (A) Quantification of relative mRNA levels of Arc, Becn1, Lc3b, Sqstm1 and Lamp1 in dorsal hippocampus 1 h after IA training. Data are presented as mean percentages ± s.e.m. of untrained rats (U). n = 7–9 rats per group. Two independent experiments of n = 5 each and n = 2–4 each. (B) Representative confocal images of CA1 and DG areas (scale bar: 20 μm) and quantifications showing ARC, LC3B, and LAMP1 immunofluorescence intensities from rats bilaterally injected with anisomycin (Ani) or vehicle (Veh) 0.5 h before training and euthanized 1 h after training. Control (Untrained) rats were bilaterally injected with anisomycin or vehicle and euthanized at matched timepoints. Data are presented as mean percentages ± s.e.m. of vehicle-injected untrained rats (U, Veh). n = 4 rats per group. Two independent experiments of n = 2 each. For each rat, 16 images (8 per side) were quantified and averaged. Dots represent the average values for each rat. Two-way ANOVA followed by Tukey’s post-hoc analysis. (C) Representative confocal images (scale bar: 10 μm) and quantifications of AAV-mCherry-GFP-LC3B–infected cells in CA1 and DG, showing red and yellow LC3B puncta in the dorsal hippocampus of rats bilaterally injected with anisomycin (Ani) or vehicle (Veh) 0.5 h before IA training and euthanized 1 h after training. Relative quantifications of total number of LC3B puncta per cell and average size of red LC3B puncta per cell in CA1 and DG areas. Data are presented as mean percentages ± s.e.m. of the value in vehicle-injected untrained rats (U, Veh). n = 4 rats per group. Two independent experiments of n = 2 each. Autophagic flux: for each rat, 16 images (8 per side) were quantified and averaged. Total number and size of puncta: for each rat, 20–25 cells were quantified and averaged. Dots represent the average values for each rat. Two-way ANOVA followed by Tukey’s post-hoc analysis. * P < 0.05, ** P < 0.01, *** P < 0.001. Numerical values and detailed statistical analyses are reported in Table S1
We then investigated the IA learning-induced translational regulation of ARC and two of the autophagy/lysosomal markers, LC3B and LAMP1, using the translation inhibitor anisomycin. Anisomycin or vehicle was injected bilaterally into the dorsal hippocampus 0.5 h before training, and, in parallel, into untrained controls. The animals were euthanized 1 h after training, or at matched timepoints for the control rats. Immunohistochemical analyses revealed that anisomycin blunted the training-dependent increases in ARC, LC3B, and LAMP1 intensities in both CA1 and DG () without changing the levels of the three proteins in untrained controls (Figure S6A). These data indicated that IA learning-dependent upregulation of ARC, LC3B and LAMP1 requires de novo translation. Furthermore, anisomycin given bilaterally 0.5 h before training completely blocked the training-induced autophagic flux, as determined by mCherry-GFP-LC3B immunofluorescence in CA1 and DG at 1 h after training ( and S6B) but had no effect in untrained rats. In fact, only in trained rats, anisomycin significantly decreased the intensity of red puncta, the total number of LC3B puncta per cell, the average size of red LC3B puncta in CA1 and DG cells (), and the percentage of infected (transduced) cells containing LC3B puncta (Figure S6C). Hence, learning-dependent upregulation of autophagy proteins and the resulting autophagic flux is regulated at the level of translation.
To further confirm that the increase of autophagy protein levels following IA learning is a consequence of active translation, we determined whether mRNAs encoding for autophagy proteins are bound to ribosomes. Toward this end, we immunoprecipitated phosphorylated RPS6 (ribosomal protein S6; Ser 240–244, hereafter pRPS6) and then performed qPCR on the ribosome-bound mRNAs to identify the fraction of mRNAs that are presumably undergoing translation in activated neurons [Citation41,Citation42]. Immunohistochemical staining confirmed the expected significant increase of pRPS6 protein levels in the dorsal hippocampus 1 h after training (). Immunoprecipitation with anti-pRPS6 antibody yielded a significantly higher amount of bound RNA from the dorsal hippocampal extracts of trained rats compared to untrained controls (). qPCR analyses of these pRPS6-bound RNA fractions showed significant enrichment of Arc, Lc3b, Sqstm1 and Lamp1 but not Becn1 mRNAs in trained rats relative to untrained controls ().
Figure 6. IA learning increased the recruitment of Arc and autophagy markers mRNAs to actively translating ribosomes. (A) Representative confocal images of CA1 and DG subregions (scalebar: 10 μm) showing p-RPS6 immunostaining 1 h after training. (B) RNA yield immunoprecipitated with anti-pRPS6 or control (IgG) antibody from dorsal hippocampal extracts of untrained (U) and trained (Tr) rats. n = 6 rats per group; Six independent experiments. Two-way ANOVA followed by Tukey’s post-hoc analysis. (C) Relative levels of Arc, Becn1, Lc3b, Sqstm1 and Lamp1 mRNAs determined by qPCR performed on RNA immunoprecipitated with anti-pRPS6 antibody or IgG from dorsal hippocampus extracts of untrained (U) and trained (Tr) rats. Each U and Tr anti-pRPS6 immunoprecipitation were normalized against its relative IgG group. n = 6 rats per group. Six independent experiments. Unpaired t-test. (D) Dorsal hippocampus images (scale bar: 500 μm) and representative confocal images of CA1 and DG subregions (scalebar: 10 μm) showing infection of AAV-hSyn-EGFP-RPL10A. (E) Yield of RNA immunoprecipitated using anti-GFP antibodies from dorsal hippocampal extracts of untrained (U) and trained (Tr) rats infected with AAV-EGFP-RPL10A (EGFP-RPL10A) compared to uninfected controls (Control). AAV-EGFP-RPL10A untrained or trained, n = 8 rats per group; uninfected untrained or trained, n = 4 rats per group. (F) qPCR performed on RNA immunoprecipitated with anti-GFP antibodies from dorsal hippocampus extracts of AAV-EGFP-RPL10A infected untrained (U) or trained (Tr) rats with primers specific for Arc, Becn1, Lc3b, Sqstm1 and Lamp1 mRNAs. Data were normalized against the respective control values. n = 8 rats per group. Eight independent experiments. Unpaired t-test. (G) Representative western blots and densitometric analyses expressed as mean ± s.e.m. of puromycin normalized to ACTB carried out in dorsal hippocampus extracts obtained from rats bilaterally co-injected with puromycin and bafilomycin A1 (Baf) or vehicle (Veh) 0.5 h before training and euthanized 1 h after training. A control sample without puromycin injection was included as negative control (Con). Data are presented as mean percentages ± s.e.m. of vehicle-injected untrained rats (U, Veh). n = 7 rats per group. Two independent experiments of n = 4 each and n = 3 each. Two-way ANOVA followed by Sidak’s post-hoc analysis. * P < 0.05, ** P < 0.01, *** P < 0.001. Numerical values and detailed statistical analyses are reported in Table S1
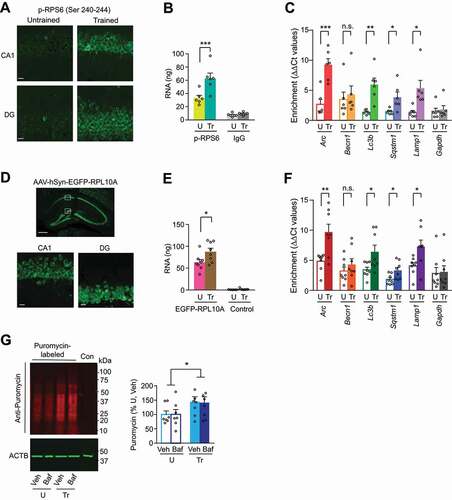
To confirm these data using another approach, we employed translating ribosome affinity purification (TRAP) [Citation43] using AAV-hSyn-EGFP-RPL10A. Three weeks of infection showed reliable expression of GFP-labeled ribosomal protein RPL10A specifically in neurons of dorsal hippocampus (). Anti-GFP antibodies immunoprecipitated significantly higher amounts of bound mRNAs from the dorsal hippocampi of trained rats compared to untrained controls (). qPCR analyses of GFP-RPL10A-bound mRNAs showed that there was a significant enrichment of Arc, Lc3b, Sqstm1 and Lamp1 but not Becn1 mRNAs 1 h after training relative to the untrained controls ().
The current general view suggests that autophagy is required to generate amino acids for crucial protein synthesis [Citation29,Citation30]. Therefore, to determine whether autophagy is necessary for the increase in protein synthesis evoked by IA learning, we assessed global protein synthesis in the dorsal hippocampi of rats by employing surface sensing of translation (SUnSET) [Citation44]. As shown in , the increase in global protein synthesis evoked 1 h after IA learning was not affected by the autophagy inhibitor bafilomycin A1 injected together with puromycin 0.5 h before training, indicating that learning-induced de novo translation does not require autophagy.
Collectively, these data indicated that IA learning significantly increases autophagy by regulating the translation of mRNAs encoding for autophagy proteins. They also showed that autophagy is dispensable for the increase in protein synthesis evoked with learning.
ARC was required for the increase in autophagy following IA learning
ARC is rapidly translated in active dendritic compartments following neuronal activation [Citation45] and is critical for trafficking endosomal network vesicles [Citation46], a subcellular compartment in potential communication with lysosomes. In addition, experiments in neuronal cultures suggested that ARC is a target of autophagy [Citation47]. Thus, we asked whether and how ARC induction relates to the induction of autophagy. Given the fact that ARC is rapidly translated following learning and that autophagy requires translation, here, we tested whether ARC induction is upstream of translation of autophagy proteins.
As shown by immunofluorescence-based relative quantification analyses in CA1 and DG, bilateral injection of Arc antisense ODN (AS-ODN) into the dorsal hippocampus compared to scrambled ODN (SC-ODN) 0.5 h before training, as expected [Citation36], validated the knockdown of the learning-dependent increase in ARC at 1 h after training. Arc-AS ODN did not change ARC levels in untrained control rats Notably, Arc-AS ODN also blunted the IA-dependent induction of LC3B and LAMP1 () without changing ARC, LC3B, or LAMP1 intensities in the hippocampi of untrained control rats ( and S7A), once again supporting the conclusion that upregulation of autophagy, like that of ARC, is learning-dependent. Consistent with these data, Arc-AS ODN also completely blocked the increase in autophagic flux in dorsal hippocampus, as determined by the fluorescence analyses of yellow and red LC3B puncta following AAV-mCherry-GFP-LC3B infection. Specifically, Arc-AS ODN significantly decreased the total number of LC3B puncta per cell, the average size of red LC3B puncta in CA1 cells (), and the percentage of infected (transduced) cells showing LC3B puncta (Figure S7B). Untrained control rats injected with either Arc-AS ODN or SC-ODN did not show any significant differences ( and S7C).
Figure 7. ARC is required for the learning-dependent increase in autophagy and autophagic flux. (A) Representative confocal images of CA1 and DG areas and relative quantifications showing ARC, LC3B, and LAMP1 immunofluorescence intensities in the dorsal hippocampi of rats bilaterally injected with Arc antisense ODN (AS-ODN) or scrambled ODN (SC-ODN) 0.5 h before IA training and euthanized 1 h after training. Control (Untrained, U) rats, which remained in their home cage, were bilaterally injected with Arc AS-ODN or SC-ODN and euthanized at matched time points. Data are presented as mean percentages ± s.e.m. of scrambled ODN–injected untrained rats (U, SC). n = 4 rats per group. Two independent experiments of n = 2 each. For each rat, 16 images (8 per side) were quantified and averaged. Dots represent the average values for each rat. Two-way ANOVA followed by Tukey’s post-hoc analysis. (B) Representative confocal images of CA1 and DG dorsal hippocampal subregions (scale bar: 10 μm) showing red and yellow LC3B puncta in rats bilaterally injected with Arc AS-ODN or SC-ODN 0.5 h before training and euthanized 1 h after training. Relative quantifications of fluorescence intensities of yellow and red LC3B puncta (Autophagic flux), total number of LC3B puncta per cell, and average size of red LC3B puncta per cell in CA1 and DG areas. Data are presented as mean percentages ± s.e.m. of scrambled ODN-injected untrained rats (U, SC-ODN). n = 4 rats per group. Two independent experiments of n = 2 each. Autophagic flux: for each rat, 16 images (8 per side) were quantified and averaged. Total number and size of puncta: for each rat, 20–25 cells were quantified and averaged. Dots represent the average values for each rat. Two-way ANOVA followed by Tukey’s post-hoc analysis. * P < 0.05, ** P < 0.01, *** P < 0.001. Numeric values and detailed statistical analyses are reported in Table S1
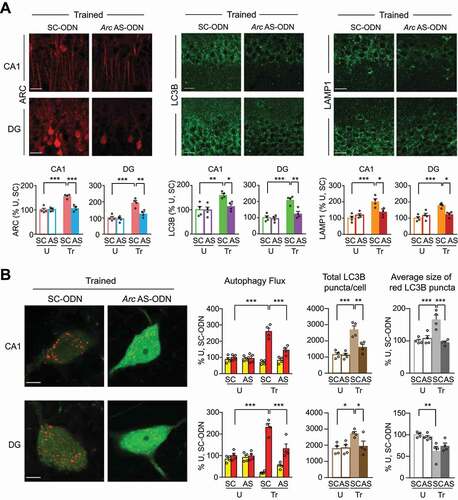
We concluded that ARC induced by training is required for the IA learning-dependent increase in autophagy proteins and autophagic flux.
Discussion
We showed that episodic learning leading to long-term memory causes significant upregulation of proteins involved in autophagy and lysosomal degradation as well as of autophagic flux in the dorsal hippocampus. Quantifications based on morphological assessment and confirmed by co-immunostaining with cell type-specific markers indicated that this upregulation occurs mostly in neurons. However, our data did not exclude that learning increases autophagy to a lesser extent also in other cell types, such as astrocytes and microglia. We also showed, in agreement with previous findings [Citation24–26], that autophagy induced by learning is required for long-term memory formation. Thus, autophagy, in addition to its established roles in neuronal survival and response to starvation, stress or injuries, plays a critical role in healthy brain functions, such as learning and memory.
We found that the increase in autophagy proteins upon IA learning does not result from changes in their mRNA levels, but rather from their translational regulation, as shown by multiple evidences that revealed increased recruitment of Lc3b, Sqstm1 and Lamp1 mRNAs to actively translating ribosomes upon training. This regulation at the translational level is peculiar, as in most biological systems investigated thus far, with the exception of two studies, one in Drosophila early oogenesis [Citation48] and the other in HEK cell cultures and nutrient starvation [Citation49], the regulation of autophagy and lysosomal pathways expression had been reported to occur mostly at the transcriptional [Citation50,Citation51] and post-translational levels [Citation52,Citation53]. Hence, our data suggest that in the brain, and particularly in neurons, the regulation of autophagy and lysosomal functions in response to experience follows distinctive regulations.
Furthermore, in contrast to starvation, stress, cancer and apoptosis, conditions in which autophagy and mRNA translation seem to be inversely related [Citation30,Citation54], we found that upon IA learning, there is a positive coupling between autophagy and de novo protein synthesis. We also found that while autophagy requires de novo translation, the global de novo translation evoked by IA learning is not dependent on autophagy, thus indicating that with learning, the regulation of translation is upstream of the induction of autophagy.
Important future questions to be addressed are: the identity of cargoes targeted by the learning-induced autophagy, the possible distinctive functions of compartmentalized regulations in pre-synaptic, post-synaptic, and soma structures and in distinct cell types, and the elucidation of whether and how selective regulations of autophagy occur in different functional conditions. For example, autophagy induced by starvation or injury may employ differential mechanisms of autophagy regulations compared to that evoked by learning.
Neurons are highly compartmentalized and, in response to stimuli, such as learning, undergo high rates of vesicle trafficking, membrane restructuring, and morphological changes, in addition to de novo protein synthesis [Citation46,Citation55]. Autophagy can rapidly supply material support, as well as control homeostatic regulation of all these changes. Thus, our data showing a coupling between the increase in protein synthesis and the induction of autophagy upon IA learning provide a possible explanation for how activated neurons can maintain protein homeostasis under healthy conditions. Furthermore, de novo translation is known to be required for structural plasticity of dendritic spines as well as of presynaptic compartments [Citation7,Citation56], and growing evidence suggests that activity induces translation near the stimulated spines to regulate cytoskeletal remodeling and spine morphogenesis [Citation55]. Hence, we propose that, rather than translation per se, it is the coupling of activity-dependent translation and autophagy that is critical for structural plasticity. We speculate that autophagy plays an important role in degrading molecules and/or structures that need to be removed in order to allow new changes to occur efficiently. We also speculate that this balance in activity-dependent protein synthesis and degradation is critical for maintaining healthy neuronal functions and that its alteration leads to diseases of protein accumulation.
We found that the IA learning-induced increase in levels of the autophagy proteins BECN1, LC3B, SQSTM1 and LAMP1, detected mostly in neurons, was widespread throughout the hippocampus and its subregions, indicating that autophagy, like de novo translation, occurs abundantly in a variety of neuronal populations. The distinct cellular and subcellular distribution of the increase in autophagy and lysosomal proteins BECN1, LC3B and LAMP1 indicated that these proteins augmented in both soma and processes of neurons whereas SQSTM1 increased only in the soma. SQSTM1 and LAMP1, however, also increased in astrocytes and microglia. Hence, distinct, cell type-specific and compartmentalized regulations of autophagy and lysosomal degradation processes [Citation14] underlie long-term memory.
Our data showing that IA learning significantly increases SQSTM1 level are in contrast to the earlier report of Glatigny et al. [Citation24], who found a decrease in SQSTM1 after a 4-d CFC training or 5 d water maze training. This difference could be due to the different post-training time of assessment, which, in our case was 1 h after a single IA learning event, whereas Glatigny et al. (2019) measured SQSTM1 level 1 h after 4 d of CFC training (with 3 exposures per day) or 5 d of water maze training (with 4 trials per day). Differences in SQSTM1 regulation could also be related to the different learning paradigms used or the strength of training. Although an increase in SQSTM1 is often linked to inhibited autophagy because SQSTM1 itself undergoes degradation [Citation31], the opposite has also been described, as, in fact, SQSTM1 increase has also been found concomitant to an increase in autophagic flux [Citation57]. Therefore, a single timepoint assessment of SQSTM1 levels cannot be taken as indication of an increase or decrease in autophagy. It should also be considered that autophagy is a dynamic process whereby some autophagy proteins themselves undergo degradation through autophagic flux; thus, assessing the levels of autophagy proteins over time, following learning, should reveal important information about their temporal progression. Finally, the regulation of SQSTM1 upon learning suggests that there could be a crosstalk between autophagy and proteasomal degradation of ubiquitinated proteins [Citation58]. Our results also do not exclude that macroautophagy occurs in parallel with the other common forms of the autophagy pathways, microautophagy and chaperone-dependent autophagy.
An intriguing finding of our studies is the requirement of ARC to increase autophagy in response to IA learning. Recently, Yan et al., (2018) [Citation47] reported that ARC is actually a target of autophagy because treatment of neuronal cultures with autophagy or lysosomal inhibitors resulted in ARC accumulation. Although the mechanisms by which ARC controls the increase in autophagy upon learning and might also be a target of autophagy remain to be elucidated, our results add to the established pleiotropic functions of ARC [Citation45,Citation46,Citation59,Citation60] and emphasize its contribution to the control of compartmentalized functions in activated neurons.
Given the severity of abnormal protein accumulation in neurodegeneration, aging and neurodevelopmental disorders [Citation9,Citation19], including autism, Alzheimer disease, prion disease, Parkinson disease, Huntington disease and amyotrophic lateral sclerosis, our results imply that deficits in stimulus-dependent regulations, rather than just baseline alterations, and the coupling between mRNA translation and autophagy might be a primary checkpoint dysregulated in aging and several other brain diseases.
Materials and methods
Animals
Adult male Long-Evans rats weighing 200–250 g (age 2–4 months) were used for the experiments. Rats were doubly housed or individually housed after surgery and maintained on a 12-h light/dark cycle with ad libitum access to food and water. Experiments were performed during the light cycle. All rats were handled for 3 min per day for 5 d before any procedure. All protocols complied with the National Institutes of Health Guide for the Care and Use of Laboratory Animals and were approved by the New York University Animal Welfare Committee. A total number of 672 rats were used for this study.
Cannulae implants
Rats were anesthetized with ketamine (75 mg/kg) and xylazine (10 mg/kg). Stainless steel cannulae (22 gauge) were implanted stereotactically and bilaterally to target dorsal hippocampi (4.0 mm posterior to bregma, 2.6 mm lateral from midline and 2.0 mm ventral). Rats were given meloxicam (3 mg/kg, once before surgery) for post-operational analgesia and allowed to recover for at least 8 d before any other procedures.
Inhibitory avoidance (IA)
IA was conducted as described in Chen et al. 2011 [Citation32]. Briefly, the IA chamber (Med Associates Inc®, MED-APA-B1 R; Fairfax, VT) consisted of a rectangular Perspex box, divided into a safe (lit) compartment and a shock (dark) compartment. Footshocks were delivered to the grid floor of the shock compartment via a constant-current scrambler circuit. The two compartments were separated by a sliding door. The chamber was located in a sound-attenuated room illuminated by dim red light. During the training session, each rat was placed in the safe compartment with its head facing away from the door. After 10 seconds (s) the door was automatically opened, allowing the rat access to the shock compartment. Latency to enter the shock compartment was taken as a measure of acquisition. A 2-s 0.6-mA footshock was administered and the rat was returned to its home cage 10 s after delivery of the footshock. Memory retention was tested at the indicated time points by placing the rat back into the safe compartment and by measuring the latency to enter the shock compartment after door opening. No footshock was administered during testing. Testing was terminated at 900 s and performed blind to treatments. The reminder shock (RS) procedure was used to test whether impaired memory could be re-instated; if reinstatement does not occur, it indicates lack of memory, while if reinstatement does occur, it indicates memory inhibition. RS consisted of giving the animals a 2-s 0.6-mA footshock in a different context, which was a square chamber (Med Associates Inc®, MED-VFC2-USB-R, Fairfax, VT) with three transparent walls, one opaque Plexiglas wall and a floor grid with narrower spacing, in a separate, well-lit room. Naive rats were handled but otherwise remained in the home cage (Untrained, U). During unpaired context-shock experience (Un), rats were briefly exposed to the training apparatus and an hour later given a footshock in the same context. This unpaired exposure does not evoke IA memory [Citation32,Citation33].
Open field behavior
Rats were allowed to freely explore an open field arena (75 cm x 75 cm x 20 cm) for 10 min, and their movements automatically tracked using Ethovision-XT (Noldus Information Technology). Locomotion was assessed using measures of total distance traveled (cm), as well as average velocity (cm/s). The arena was divided into 16 quadrants, and the time, measured in seconds (s) spent in the four center quadrants was taken as time spent in the center of the open field, which is generally used as a measure of anxiety.
Immunofluorescent staining
Immunofluorescent staining, confocal imaging and analyses of autophagy markers (BECN1, LC3B, SQSTM1, LAMP1) and ARC were done as described in Yazdankhah et al., 2014 [Citation61]; Martinet et al., 2017 [Citation62]; Pi et al., 2017 [Citation63]; Ye et al., 2017 [Citation37]. Briefly, rats were anesthetized with an intraperitoneal injection of 750 mg/kg chloral hydrate and transcardially perfused with 4% paraformaldehyde (Sigma-Aldrich, 158127) in 1x phosphate-buffered saline (PBS; 137 mM NaCl [Sigma-Aldrich, S3014], 2.7 mM KCl [Sigma-Aldrich P9541], 10 mM Na2HPO4 [Sigma-Aldrich, S5136] and 1.8 mM KH2PO4 [Sigma-Aldrich, P5655], pH 7.4). Their brains were post-fixed in the same solution overnight at 4°C, followed by 30% sucrose (30 g sucrose [Sigma-Aldrich, S0389] in 100 ml of 1x PBS, pH 7.4) for 72 h. 20 μm brain sections were collected as cryosections for free-floating immunofluorescent staining. Immunostaining was performed with antigen retrieval, which consisted of boiling the brain sections in nanopure H2O for 2 min. The sections were then incubated with the blocking solution (1x PBS, pH 7.4 with 0.25% Triton X-100 [Sigma-Aldrich, T8787], 4% normal goat serum [Cell Signaling Technology, 5425], 1% bovine serum albumin [Sigma-Aldrich, A2058]) for 2 h at room temperature, followed by incubation with the primary antibodies in the blocking solution for 24 h at 4°C. The following primary antibodies were used: rabbit anti-ARC antibody (1:2000; Synaptic Systems, 156 003), rabbit anti-BECN1/Beclin 1 antibody (1:500; Novus Biologicals, NB110-87318), mouse anti-LC3B antibody (1:500; Enzo Life Sciences, ALX-803-080-C100), guinea pig anti-SQSTM1/p62 antibody (1:1000; American Research Products, 03-GP62-C), rabbit anti-LAMP1 antibody (1:2000; Abcam, ab24170), and rabbit anti-phospho-RPS6/S6 ribosomal protein antibody (1:1000; Cell Signaling Technology, 2215). Subsequently the brain sections were given 3 washes, each of 15 min, with 1x PBST (1x PBS, pH 7.4 containing 0.025% Triton X-100), and then incubated with the secondary antibody, which consisted of goat anti-rabbit Alexa Fluor 488 (1:1000, Thermo Fisher Scientific, A32731) or goat anti-rabbit Alexa Fluor 647 (1:1000, Thermo Fisher Scientific, A32733) or goat anti-mouse Alexa Fluor 488 (1:1000, Thermo Fisher Scientific, A32723) or goat anti-guinea pig Alexa Fluor 488 (1:1000, Invitrogen, A-11073) for 2 h at room temperature. The sections were given 3 washes, each of 15 min, with 1x PBST, rinsed with 1x PBS, pH 7.4 and then mounted with Prolong Diamond antifade mountant with DAPI (Invitrogen, P36962). The following additional primary antibodies were also tested and confirmed the immunostaining patterns and results obtained with the autophagy and lysosomal markers used and shown in this study: BECN1: rabbit anti-BECN1 (1:500; Abcam, ab207612), LC3B: rabbit anti-LC3B antibody (1:250; Cell Signaling Technology, 2775), rabbit anti-LC3B antibody (1:500; Novus Biologicals, NB100-2220); SQSTM1: rabbit anti-SQSTM1 (1:500; Cell Signaling Technology, 5114); LAMP1: rabbit anti-LAMP1 antibody (1:1000; Novus Biologicals, NB120-19294).
Two sections between bregma −3.6 mm and −4.2 mm were used for each set of staining. Four images per subregion (CA1 and DG) per side for each animal were captured as z-stacked series of images by a Leica TCS SP8 confocal microscope (Leica microsystems, Wetzlar, Germany) at 63x magnification with 2x zoom. In all immunochemistry experiments n = 4 rats per group were used. For each rat, 16 images (8 per each side) were quantified and averaged. Experimenters blinded to experimental conditions quantified the images using ImageJ software (US, National Institutes of Health) and automated custom macro programs. For intensity measurements, images were processed to remove background and outlier noise. All images in each experiment were processed using the same parameters. The z-stack image was processed to generate the maximum projection image and the intensity was measured using ImageJ plugin.
Quantifications of autophagy markers in the cell soma and process areas were conducted by using a modification of a previously described method that measured immunofluorescence in hippocampal cell soma and processes [Citation64]. Quantifications of immunofluorescence intensity were performed on 63x 8-bit grayscale images and images were acquired using the same parameters every time. Using the free-hand line tool, we delimited the perinuclear areas visualized with the DAPI channel in the CA1 stratum pyramidale (40 μm length) and DG stratum granulosum (60 μm length) and saved them as “soma-ROI”. An area outside to the soma-ROI, of 50 μm in length in the CA1 stratum radiatum and of 70 μm in length in the DG stratum moleculare were saved as “process-ROI”. For each image, rolling ball radius of 10 was uniformly applied to subtract the background from the 8-bit grayscale images; the background was established on parallel sections incubated with only the secondary antibody. The soma-ROI and process-ROI were overlaid on the autophagy marker images and the mean gray values of the image stacks normalized over the number DAPI counts (ImageJ plugin) in each image were taken as the mean immunofluorescence intensity values.
Puncta analyses for all autophagy markers in cell soma and process were conducted as previously described to quantify GFP-LC3B puncta [Citation25]. Z-stack images of 250 μm2 were captured at 63x magnification with 2x zoom, within the cell soma or processes of CA1 and DG. Z-stack images were captured with a 0.3 μm step size to obtain better signals at a high resolution (1024 × 1024 pixels). Three images from the z-stack around the same focal plane were averaged to create a final image. In all puncta analysis experiments, n = 4 rats per group were used. For each rat, 16 images (8 per each side) were quantified and averaged. The analyses of number and size of puncta per 250 μm2 area was performed by an experimenter blind to the groups. A threshold was uniformly applied to the images of the autophagy markers to subtract the diffused/cytosolic immunostaining. As described by Klionsky and Eskelinen [Citation65], autophagosome size is approximately 0.5–2 μm in diameter and the lysosome size approximately 0.5 μm in diameter. These size parameters were used to identify the puncta of autophagy markers and are consistent with that recommended by Klionsky et al., 2016 [Citation57]. Merged puncta were isolated using “Watershed” function. “Analyze particle” plugin of ImageJ was used on the thresholded images to measure both “number” and “size” of puncta. Repetitive laser scanning over the tissues was avoided to prevent quenching of the fluorescent signal.
For LC3B immunofluorescence, as described by Rosenfeldt et al. [Citation66], the anti-LC3B clone 5F10 antibody recognizes both diffuse cytoplasmic LC3B (or LC3-I) and punctate LC3B (or LC3-II) staining. For quantifications of immunofluorescent intensities, we applied a threshold to subtract the diffuse cytosolic LC3-I staining and captured the punctate staining. As previously suggested [Citation66], this is a reliable method to detect differences in LC3B puncta indicative of autophagosome quantification.
The specificities of the immunostainings were confirmed by control brain sections stained with the respective secondary antibody alone, in the absence of primary antibody, which showed no immunoreactivity.
AAV-mCherry-GFP-LC3B injections, tissue processing and analyses
For measuring autophagic flux, we employed the AAV-mCherry-GFP-LC3B virus generated with the plasmid used by Castillo et al. (2017) [Citation34] and generously provided by Prof. Claudio Hetz (Institute of Biomedical Sciences, University of Chile). Rats were bilaterally injected into the dorsal hippocampi with AAV-mCherry-GFP-LC3B (1 μl per side) at a concentration of 5.79 × 10¹² Vg/ml. The rats remained in their homecages for three weeks to allow expression of the mCherry-GFP-LC3B. In experiments that also required injections of anisomycin or ODNs into the dorsal hippocampus, rats received bilateral cannulae implants targeting the dorsal hippocampus two weeks after viral injection. Rats were allowed to recover for at least one week after cannula implants before behavioral experiments. As described in the “Immunofluorescent staining” of the method section, the rats were euthanized and perfused transcardially with 4% paraformaldehyde prepared in 1x PBS, pH 7.4, and their brains were post-fixed in the same solution overnight at 4°C, followed by incubation in 1x PBS, pH 7.4 with 30% sucrose for 72 h. 20 μm brain sections were prepared using cryostat and used for immunohistochemical analyses. Sections were mounted with Prolong Diamond antifade mountant with DAPI (Invitrogen, P36962).
In all experiments, n = 4 rats per group was used. For each rat, two sections of dorsal hippocampus at bregma −3.6 mm and −4.2 mm (16 images, 8 per each side) were quantified and averaged. To measure red and yellow LC3B puncta number and size, CA1 and DG images were captured as z-stacked series of images by a Leica TCS SP8 confocal microscope (Leica microsystems) at 63x magnification with 2x zoom. Z-stack sections at 0.3 μm step-size were captured to obtain better signals at high resolution (1024 × 1024 pixels). Three images around a focal plane were taken and averaged for puncta analyses. Increasing the number of pictures per focal plane reduced the background favoring the clear detection of red and green dots. Repetitive laser scanning over the tissues was avoided to prevent quenching of the fluorescent signal. In order to avoid saturation issues, the threshold of red and green channels was set on trained conditions, where more red and less green immunostaining was present. All images in each experiment were processed using the same parameters. All images were converted into 16-bit (binarized) files, for both GFP and mCherry focal field (raw images). Background signal was excluded by using a threshold over which fluorescent intensity was considered as positive in relation to negative (non-injected) control images in the maximum slope of intensity for each channel. Integrated density of fluorescent signals of the background-subtracted images were determined for each channel using ImageJ plugins, including particle analysis and area coverage. Manual counting of dots was performed by experimenters blind to treatment and behavior conditions. Puncta number and size were determined as described in the above section “immunofluorescence staining’. The puncta number and average size were calculated by normalizing against the number of infected cells. Puncta analyses for these images were done using “Analyze particle” plugin of ImageJ. The ratio between red vs. yellow puncta was taken as a measure of autophagic flux.
Bilateral injection of pharmacological compounds into the dorsal hippocampus
SBI0206965 (SML1540), bafilomycin A1 (B1793), chloroquine diphosphate (C6628), leupeptin (L2884) and anisomycin (A9789) were purchased from Sigma-Aldrich. SBI0206965 was first dissolved in dimethyl sulfoxide (DMSO, Sigma-Aldrich, 276855) at 250 mM and then diluted to the final concentrations in 1x PBS, pH 7.4/0.1% DMSO as detailed in the Results. Bafilomycin A1 was first dissolved in DMSO at 100 μM and then diluted to the final concentrations in 1x PBS, pH 7.4/0.1% DMSO as detailed in the Results. Chloroquine diphosphate and leupeptin were dissolved in 1x PBS, pH 7.4 at the final concentrations as detailed in the Results. One μl of final concentrations of these inhibitors was injected per side into the dorsal hippocampi. Following the dose-response results, as detailed in the Results section, the optimal doses selected for each inhibitor were: 5 mM SBI0206965, 0.02 μM bafilomycin A1, 2 mM chloroquine and 10 mM leupeptin. These doses were employed for all subsequent experiments. The control vehicle solutions for SBI and bafilomycin A1 consisted of 1x PBS, pH 7.4/0.1% DMSO, and for chloroquine and leupeptin consisted of 1x PBS, pH 7.4.
Anisomycin was dissolved at 250 μg/μl in 3 N HCl (Sigma-Aldrich, H1758) at 37°C. The solution was then buffered to pH 7.3 and to a final concentration of 125 μg/μl by adding 3 N NaOH (Sigma-Aldrich, 72068) and saline (Sigma-Aldrich, S8776). The anisomycin solution was prepared fresh on the day of injection. The relative vehicle control solution was saline buffered to pH 7.3. Rats were injected with 1 μl per side through each guide cannula. The injection needle (28 gauge) extended 1.5 mm beyond the cannula. Injections were carried out bilaterally with an infusion pump (Harvard apparatus, B-13029, Holliston, MA) at a rate of 0.333 μl/min with 10 μl Hamilton syringes (Hamilton, 80365). The injection needle was left in place for 2 min following the injection to allow for complete dispersion of the solution into the tissue. At the end of the behavioral experiments, brain sections were examined under a light microscope to verify the cannula placement. Rats with incorrect placement were discarded from the study. Out of 656 rat surgeries, thirty-eight rats (6%) were removed from the study due to erroneous cannulae placements or surgery complications.
RNA extraction and qPCR analysis
RNA isolation followed by qPCR analyses were carried out as described in Chen et al., 2011 [Citation32]; Garcia-Osta et al., 2006 [Citation33]. Rats were euthanized by decapitation. Their brains were quickly extracted and the brain regions of interest, i.e., the dorsal hippocampi from bregma −1.6 mm to −5.4 mm, were rapidly dissected on ice using a brain matrix and immediately submerged into Qiazol (Qiagen, 79306). Dorsal hippocampi from both sides of the brain from each animal was used as one sample. Total RNA was isolated using the RNeasy Plus Universal Kit (Qiagen, 73404) following the manufacturer’s protocol and 250 ng of RNA was reverse transcribed using QuantiTect Reverse Transcription Kit (Qiagen, 205311). PCR amplification was performed as follows: an initial denaturation step at 95°C for 5 min, followed by 40 cycles at 94°C for 30 s, 60°C for 30 s, 72°C for 20 s, and a final extension step at 72°C for 10 min. Quantitative real-time PCR (qPCR) analysis was done using CFX96 Touch Real-Time PCR Detection System (Bio-Rad, 1855196, Hercules, CA) with iQ SYBR Green Supermix (Bio-Rad, 1708882). The sequences of primers used for RT-qPCR analysis are listed below (5ʹ – 3ʹ):
Arc (NM_019361.1) Forward primer: CCCTGCAGCCCAAGTTCAAG; Reverse primer: GAAGGCTCAGCTGCCTGCTC
Becn1 (NM_053739.2) Forward primer: TTGGCCAATAAGATGGGTCTGAA; Reverse primer: TGTCAGGGACTCCAGATACGAGTG
Lc3b (NM_022867.2) Forward primer: AGCTCTGAAGGCAACAGCAACA; Reverse primer: GCTCCATGCAGGTAGCAGGAA
Sqstm1 (NM_175843.4) Forward primer: AGGCTTTCAGGCGCACTACC; Reverse primer: TGGCCATTGTCAGTTCCTCATC
Lamp1 (NM_012857.2) Forward primer: TCTTCAGTGTGCAGGTCCAG; Reverse primer: TGGACCAGAGATTCCCTTTG
Gapdh (NM_017008.4) Forward primer: GAACATCATCCCTGCATCCA; Reverse primer: CCAGTGAGCTTCCCGTTCA.
Triplicates of each sample were analyzed by qPCR, and the averaged cycle threshold (Ct) value was used for quantification using the relative quantification method. The levels of total Arc or autophagy markers in each sample were normalized to the level of Gapdh of the same sample.
Oligodeoxynucleotides (ODN) injections
Atg7 siRNA (SMART pool Accell Atg7 siRNA, E-095596-00-0005) and control siRNA (Accell non-targeting pool control siRNA, D-001910-10-05) were purchased from GE Healthcare Dharmacon, Inc. One μL of Atg7 siRNA or control siRNA at 2.5 μg/ μL in 1x siRNA buffer (60 mM KCl, 6 mM HEPES pH 7.5, and 0.2 mM MgCl2) was injected bilaterally into the dorsal hippocampi 0.5 h before training.
ODNs used: Arc AS: 5ʹ- GTCCAGCTCCATCTGCTCGC – 3ʹ; Arc SC: 5ʹ- CGTGCACCTCTCGCAGCTTC – 3ʹ; Becn1 AS: 5ʹ- CCTTAGACCCCTCCATTCCTC – 3ʹ; Becn1 SC: 5ʹ- ACTCTCATCCCATCCCTGCTC – 3ʹ; Lc3b (targeting Map1Lc3b) AS: 5ʹ- CTTCTCGGACGGCATGGCGCG – 3ʹ; Lc3b SC: 5ʹ- GCAATGCGGTCCTTGCCGGCG – 3ʹ. The antisense ODNs were dissolved in 1x PBS, pH 7.4. The control scrambled ODNs contained the same base composition as the antisense-ODNs but in a randomized order and had no homology to any mammalian sequence in the GenBank database. The ODNs were phosphorothioated on the three terminal bases at each end to protect against degradation. The ODNs were reverse-phase cartridge-purified and purchased from Gene Link. Rats were bilaterally injected with 1 μl containing 2 nmol of ODNs per side into the dorsal hippocampi 0.5 h before training.
In vivo surface sensing of translation (SUnSET)
In vivo SUnSET was carried out as described [Citation44]. Injections of puromycin (puromycin dihydrochloride [50 μg per side]; Sigma, P8833), together with either vehicle (1x PBS, pH 7.4/0.1% DMSO) or bafilomycin A1 (2 nM) in 1 μl were injected bilaterally into the dorsal hippocampus 0.5 h prior to IA training. The rats were euthanized 1 h after training, their dorsal hippocampi were rapidly dissected, and protein extracts were prepared as described in the “Hippocampi collection and western blot analysis” section.
Ribosomal pRPS6 Immunoprecipitation
Immunoprecipitations of the RPS6 phosphorylated at Ser 240–244 were performed using rabbit anti-pRPS6 ribosomal protein antibody (Cell Signaling Technology, 2215) as previously described [Citation42].
Preparation of hippocampal extracts for immunoprecipitation: Rats were euthanized, and their hippocampi were rapidly dissected on ice in buffer B (1x HBSS [Thermo Fisher Scientific, 14185052], 4 mM NaHCO3 [Sigma-Aldrich, S5761], 2.5 mM HEPES pH 7.4 [Invitrogen, 15630080], 35 mM glucose [Sigma, G8270], 100 μg/ml cycloheximide [Sigma-Aldrich, 66–81-9]). Dorsal hippocampi from the brain of each rat were pooled and used as one sample. The pooled hippocampi were transferred to a glass homogenizer (VWR, KT886000-0020), and resuspended in 1 ml of buffer C (10 mM HEPES pH 7.4 [Invitrogen, 15630080], 150 mM KCl [Sigma-Aldrich, P5405], 5 mM MgCl2 [Sigma-Aldrich, M8266], 100 nM calyculin A [Sigma-Aldrich, C5552], 2 mM DTT [Sigma-Aldrich, DTT-RO], 100 U/ml RNaseOUT [Thermo Fisher Scientific, 10-777-019], 100 μg/ml cycloheximide [Sigma-Aldrich, 66-81-9], protease and phosphatase inhibitor cocktail [Thermo Fisher Scientific, A32965]). Samples were homogenized with 10 strokes of the glass homogenizer at 4°C. Homogenates were centrifuged at 2000 x g for 10 min at 4°C. The low-speed supernatant was transferred to a new tube on ice, to which 90 μl of 10% NP40 (A.G. Scientific, P-1505) and 90 μl of 1,2-diheptanoyl-sn-glycero-3-phosphocholine (DHPC, Avanti Polar Lipids, 850306P: 100 mg/0.69 ml) were added. This solution was centrifuged at 17000 x g for 10 min at 4°C. The resulting supernatant was transferred to a new tube. A 20 μl aliquot of this solution was removed, transferred to a new tube containing 350 μl buffer RLT (supplied with Qiagen RNeasy Micro Kit, 74004), and stored at −80°C (input RNA fraction). The remainder was used for immunoprecipitation: first, 20 μl of IgG-loaded Dynabeads (50% slurry) was used for pre-clearing. Then each supernatant was divided in half; one half was immunoprecipitated with beads loaded with anti-pRPS6 antibody and the other half with IgG antibody (control).
Preparation of Dynabeads for immunoprecipitations: 150 μl of protein A Dynabeads (Thermo Fisher Scientific, 10001D) were incubated with 4 μg of rabbit anti-pRPS6 antibody or equal concentration of rabbit IgG (Millipore Sigma, 12–370) in buffer A (10 mM HEPES pH 7.4, 150 mM KCl, 5 mM MgCl2, 1% NP40, 0.05% IgG-free BSA [Sigma-Aldrich, A2058]) at 4°C for 1 h under gentle rotation. Beads were washed three times with buffer A.
Immunoprecipitations, RNA extraction and qPCR: Immunoprecipitations were carried out for 1 h at 4°C. The beads were then washed four times with buffer D (10 mM HEPES pH 7.4, 350 mM KCl, 5 mM MgCl2, 2 mM DTT, 1% NP40, 100 U/ml RNaseOUT, and 100 μg/ml cycloheximide). The third wash was done by transferring the beads to a new tube and at RT. The RNA was then eluted by addition of buffer RLT (350 μl, supplied with Qiagen RNeasy Micro Kit) to the beads on ice; the beads were removed using a magnet, and the immunoprecipitated RNA was purified using the RNeasy Micro Kit. The concentration of RNA was assessed using NanoDrop™ One/OneC Microvolume UV-Vis Spectrophotometer (Thermo Fisher Scientific, ND-ONE-W), and the entire amount of RNA precipitated with anti-pRPS6 antibody or IgG was reverse-transcribed to cDNA using iScript™ Reverse Transcription Supermix kit (Bio-Rad, 1708841). qPCR was performed using the iQ™ SYBR® Green Supermix (Bio-Rad, 1708882). The sequences of primers used for RT-qPCR analysis are listed below (5ʹ – 3ʹ): Arc (NM_019361.1) Forward primer: CCCTGCAGCCCAAGTTCAAG, Reverse primer: GAAGGCTCAGCTGCCTGCTC; Becn1 (NM_053739.2) Forward primer: TTGGCCAATAAGATGGGTCTGAA, Reverse primer: TGTCAGGGACTCCAGATACGAGTG; Lc3b (NM_022867.2) Forward primer: AAGAGTGGAAGATGTCCGGC, Reverse primer: TGCAGGCGCCTTCTAATTATCT; Sqstm1 (NM_175843.4) Forward primer: AGGCTTTCAGGCGCACTACC, Reverse primer: TGGCCATTGTCAGTTCCTCATC; Lamp1 (NM_012857.2) Forward primer: TCTTCAGTGTGCAGGTCCAG, Reverse primer: TGGACCAGAGATTCCCTTTG; Gapdh (NM_017008.4) Forward primer: GAACATCATCCCTGCATCCA, Reverse primer: CCAGTGAGCTTCCCGTTCA.
Data analysis: The total amount of immunoprecipitated RNA was divided by the amount of RNA obtained from the input unit (fold-enrichment; ∆Ct value, IP/Input). IP/input of each pRPS6-immunoprecipitate was normalized against the IP/input of its control IgG-immunoprecipitate (∆∆Ct value). Mean ∆∆Ct values ± s.e.m. of trained relative to untrained rats provided the fold-enrichment index reported in figures.
Translating Ribosome Affinity Purification (TRAP)
Rats were bilaterally injected with AAV-hSyn-EGFP-RPL10A, 1 μl per side, at a concentration of 9.72 × 10¹² Vg/ml in their dorsal hippocampi. The rats remained in their home cages for three weeks to allow viral expression of the EGFP-RPL10A. Three weeks after infection, rats were euthanized, and immunoprecipitations were performed using monoclonal EGFP antibodies clone 19C8 and 19F7 antibody (purchased from Memorial Sloan Kettering, NY, core antibody facility) as previously described [Citation43].
Preparation of hippocampal extracts for immunoprecipitation: Rats were euthanized, and their hippocampi were rapidly dissected in ice-cold dissection buffer (1x HBSS, 4 mM NaHCO3, 2.5 mM HEPES pH 7.4, 35 mM glucose, 100 μg/ml cycloheximide). Dorsal hippocampi from both sides of the brain were pooled for each animal and used as one sample. The pooled hippocampi were transferred to a glass homogenizer (VWR, KT886000-0020), and resuspended in 1.0 ml of tissue-lysis buffer (10 mM HEPES pH 7.4, 150 mM KCl, 5 mM MgCl2, 100 nM calyculin A, 2 mM DTT, 100 U/ml RNaseOUT, 100 μg/ml cycloheximide, protease and phosphatase inhibitor cocktail). Samples were homogenized with 10 strokes of the glass homogenizer at 4°C. Homogenates were transferred to a microcentrifuge tube and centrifuged at 2000 x g for 10 min at 4°C. The low-speed supernatant was transferred to a new tube on ice, and to this solution was added 1/9 sample volume of 10% NP40 and 1/9 sample volume of 300 mM 1,2-diheptanoyl-sn-glycero-3-phosphocholine (DHPC: 100 mg/0.69 ml). This solution was mixed and then centrifuged at 17000 x g for 10 min at 4°C. The resulting high-speed supernatant was transferred to a new tube. A 20 μl aliquot of this solution was removed, transferred to a new tube containing 350 μl buffer RLT (supplied with Qiagen RNeasy Micro Kit), and stored at −80°C as input RNA. The remainder was used for immunoprecipitation, to which 200 μl of beads (50% slurry) loaded with Protein L/Ab was added.
Preparation of Dynabeads for immunoprecipitations: Streptavidin MyOne T1 Dynabeads (200 μl, Thermo Fisher Scientific, 65601) were incubated with 1 mg/ml of biotinylated Protein L (Thermo Fisher Scientific, 29997) in 1x PBS, pH 7.4 for 35 min at RT. Beads were washed five times with 1x PBS, pH 7.4 containing 3% weight/volume of IgG and protease-free BSA. This was followed by monoclonal EGFP or IgG (control) antibodies incubations (50 μg each of 19C8 and 19F7; 100 μg total, in 1 ml total volume) in low-salt buffer (20 mM HEPES pH 7.4, 150 mM KCl, 10 mM MgCl2, 1% NP40 in RNase-free water; EDTA-free protease inhibitors [one mini tablet per 10 ml], 0.5 mM DTT, 100 μg/ml cycloheximide, and 10 μl/ml RNaseOUT) for 1 h using gentle end-over-end rotation. After this step of antibody binding, Protein L/Ab loaded Dynabeads were washed three times with low-salt buffer and suspended in a in a 200 μl volume of low-salt buffer per condition.
Immunoprecipitations, RNA elution and qPCR: Immunoprecipitations were carried out for 16–18 h at 4°C. The Protein L/Ab beads were washed four times with high-salt buffer (20 mM HEPES pH 7.4, 350 mM KCl, 10 mM MgCl2, and 1% NP-40 in RNase-free water, 0.5 mM DTT and 100 μg/ml cycloheximide). At the third wash, the beads were transferred to a new tube and kept at RT for 10 min. After the wash, the RNA was eluted by adding buffer RLT (350 μl, supplied with Qiagen RNeasy Micro Kit) on ice; finally, the beads were removed using a magnet, and the immunoprecipitated RNA was purified using the RNeasy Micro Kit. The concentration of RNA was assessed using NanoDrop™ Spectrophotometer, and the entire amount of RNA precipitated with monoclonal EGFP antibodies was reverse transcribed to cDNA using iScript™ Reverse Transcription Supermix kit. qPCR was performed using the iQ™ SYBR® Green Supermix. The sequences of primers used for RT-qPCR analysis are (5ʹ – 3ʹ): Arc (NM_019361.1) Forward primer: CCCTGCAGCCCAAGTTCAAG, Reverse primer: GAAGGCTCAGCTGCCTGCTC; Becn1 (NM_053739.2) Forward primer: TTGGCCAATAAGATGGGTCTGAA, Reverse primer: TGTCAGGGACTCCAGATACGAGTG; Lc3b (NM_022867.2) Forward primer: AAGAGTGGAAGATGTCCGGC, Reverse primer: TGCAGGCGCCTTCTAATTATCT; Sqstm1 (NM_175843.4) Forward primer: AGGCTTTCAGGCGCACTACC, Reverse primer: TGGCCATTGTCAGTTCCTCATC; Lamp1 (NM_012857.2) Forward primer: TCTTCAGTGTGCAGGTCCAG, Reverse primer: TGGACCAGAGATTCCCTTTG; Gapdh (NM_017008.4) Forward primer: GAACATCATCCCTGCATCCA, Reverse primer: CCAGTGAGCTTCCCGTTCA.
Data analysis: The total amount of immunoprecipitated RNA was divided by the amount of RNA obtained from the input unit (fold-enrichment; ∆Ct value, IP/Input). IP/input of each GFP-immunoprecipitate was normalized against the IP/input of its control IgG-immunoprecipitate (∆∆Ct value). Mean ∆∆Ct values ± s.e.m. of trained relative to untrained rats provided the fold-enrichment index reported in figures.
Hippocampi dissection and western blot analysis
Protein extraction followed by western blot analyses were carried out as described in Chen et al., 2011 [Citation32]. Rats were killed by decapitation. Their brains were quickly dissected and the brain regions of interest, i.e., the dorsal hippocampi were collected from bregma −2.8 mm to −5.4 mm using a brain matrix. The collected tissues were snap-frozen on dry ice. Except for LC3B assessment, for which we used sample buffer (see below), the tissues were homogenized in radioimmunoprecipitation assay (RIPA) buffer (150 mM NaCl, 1% Triton X-100, 0.5% sodium deoxycholate [Sigma-Aldrich, D6750], 0.1% sodium dodecyl sulfate [SDS, Sigma-Aldrich, 436143], 5 mM EDTA [Invitrogen, AM9260], 10% glycerol [Sigma-Aldrich, G5516], 50 mM Tris, pH 8.0) supplemented with 0.5 mM phenylmethylsulfonyl fluoride (PMSF, Millipore Sigma, PMSF-RO), 2 mM 1,4-dithiothreitol (DTT, Sigma-Aldrich, DTT-RO), 1 mM EGTA (Millipore Sigma, 324626), 1 μM microcystin LR (Calbiochem, 475815), 10 mM sodium fluoride (NaF, Millipore Sigma, 919), 1 mM sodium orthovanadate (NaOV, New England Biolabs, P0758L), benzamidine hydrochloride (Sigma-Aldrich, B6506), protease inhibitor cocktail (Sigma-Aldrich, P8340) and phosphatase inhibitor cocktail 2 (Sigma-Aldrich, P5726) and 3 (Sigma-Aldrich, P0044), 10 μM leupeptin A (Sigma-Aldrich, L2023), 10 μM pepstatin A (Sigma-Aldrich, P5318) and 10 μM E-64 (Sigma-Aldrich, E3132).
Several lysis buffers were tested for detecting changes in the level of autophagy markers using western blot analyses (shown in Figure S2): (i) RIPA buffer with 0.05% β-mercaptoethanol as described above [Sigma-Aldrich, M3148], (ii) SDS lysis buffer with β-mercaptoethanol (50 mM Tris-Cl, pH 7.5, 150 mM NaCl, 1 mM EDTA, 1 mM EGTA, 50 mM NaF, 1 mM NaOV, 2% SDS [Sigma-Aldrich, L3771], 10 μM leupeptin A, 10 μM pepstatin A, 10 μM E-64, protease and phosphatase inhibitor cocktail tablet [Thermo Fisher Scientific, A32959; one tablet per 10 ml], 0.05% β-mercaptoethanol), (iii) RIPA buffer with 5 mM iodoacetamide (IAA) and 2 mM DTT, (iv) SDS lysis buffer with 5 mM IAA and 2 mM DTT, and (v) HEPES-sucrose buffer (0.32 M sucrose, 1 mM NaHCO3, 1 M HEPES, pH 7.5 [Thermo Fisher Scientific, 15630080], 0.25 mM CaCl2,1 mM MgCl2, 10 μM leupeptin A, 10 μM pepstatin A, 10 μM E-64, protease inhibitor cocktail tablet [one tablet per 10 ml]). Protein concentrations were determined by the Bio-Rad protein assay (Bio-Rad, 500–0006).
Protein extracts for LC3B western blot analyses were obtained using a modified protocol of Qu et al., 2017 [Citation66,Citation67]. The hippocampal tissue was immediately put into 1 ml of hot (boiled at 95°C) SDS/Laemmli sample buffer (1:10 wt/vol; 0.125 M Tris-Cl, pH 6.8, 2% SDS, 5% β-mercaptoethanol, 10% glycerol, 0.004% bromophenol blue [Sigma-Aldrich, B0126]), boiled immediately for 5 min and homogenized using a dounce homogenizer. The sample was then sonicated and centrifuged at 18000 x g for 5 min. To detect LC3B, lysates were diluted 1:10 in 1x sample buffer. Proteins were separated by 4–20% gradient gel (Bio-Rad, 5671094) and transferred to 0.2 μm PVDF transfer membrane (Thermo Scientific, 88520). After blocking in Odyssey® Blocking Buffer (LI-COR, 927–50000), membranes were incubated with mouse monoclonal anti-LC3B antibody (1:1000; Enzo Life Sciences, ALX-803-080-C100) at 4°C overnight. Rabbit anti-ACTB/actin antibody (1:20000; Santa Cruz Biotechnology, sc-1616 R) was used for loading normalization.
For all other markers, 20 μg of total protein extract per lane was resolved in denaturing SDS-PAGE gels, and transferred to Immobilon-FL transfer membrane (Millipore, IPFL00010). Primary antibodies: mouse anti-Puromycin antibody (1:2000; Millipore Sigma, MABE343), mouse anti-ATG7 antibody (1:2000; R & D Systems, MAB6608), mouse anti-ACTB/Actin antibody (1:20000; Santa Cruz Biotechnology, sc-47778). The latter was used for loading normalization. Secondary antibodies: goat anti-rabbit IRDye® 800CW conjugated antibody (1:20000; LI-COR, 926–32211) and goat anti-mouse IRDye® 680LT conjugated antibody (1:20000, LI-COR, 926–68020). Membranes were scanned on the LI-COR Odyssey imager (LI-COR, 9120, Lincoln, Nebraska) under non-saturating conditions. Data were quantified using pixel intensities with the Image Studio™ Lite Software according to manufacturer protocols (LI-COR).
TUNEL assay
TUNEL (terminal deoxynucleotide transferase [TdT]-mediated dUTP-digoxigenin nick-end labeling) staining, confocal imaging and cell-death analyses were performed as described in Sun et al. (2013) [Citation68]. Briefly, 20 μm brain sections were prepared using the same methods described previously for immunofluorescent staining. These brain sections were mounted on slides and allowed to dry at 55°C for 5 min. The slides were incubated in 1x PBS, pH 7.4 containing 0.5% Triton X-100 (PBST) in a Coplin jar at 85°C for 20 min to permeabilize the tissue. The slides were then rinsed three times in 1x PBS, pH 7.4, and then incubated with the In Situ Cell Death Detection Kit, Fluorescein (Roche, 11684795910) at 37 °C for 1 h (reagents prepared according to the manufacturer’s instructions) in a humidified chamber protected from light. After 3 × 10 min washes with 1x PBS, pH 7.4, the slides were mounted with mounting medium containing DAPI (Roche, provided with the kit). For positive control, the sections were incubated with DNase I (3000 U/ml in 50 mM Tris-HCl, pH 7.5, 1 mg/ml BSA) for 10 min at 15–25ºC to induce DNA strand breaks, prior to labeling.
Two sections at around bregma −3.6 mm and −4.2 mm, representing dorsal hippocampus, were imaged for analysis. Two images per subregion (CA1 and DG) per side for each animal were captured as z-stacked series of fluorescent images on a Leica TCS SP8 confocal microscope (Leica microsystems) at 40x magnification. Experimenters blind to the experimental conditions quantified the images using the ImageJ software (US National Institutes of Health) and automated custom macro programs. Briefly, all images in an experiment were processed using the same parameters to remove background and outlier noise. The z-stack image was processed to generate the maximum projection image and the number of TUNEL positive nuclei were counted in the green channel (fluorescein) image using “cell count” function of ImageJ. The number of TUNEL positive nuclei were expressed as percent of total DAPI counts in each image. The values obtained from 10 images per subregion per rat were averaged to get mean DAPI positive cell count for each condition.
A list of reagents used in this study is provided in Table S2
Statistical analysis
Data were analyzed using Prism 7 (GraphPad Software Inc.). No statistical method was used to predetermine sample sizes; sample size was determined based on our experience and the sample size used in similar studies [Citation32,Citation33,Citation37]. Replications: All experiments were carried out at least with 2 cohorts of animals for internal replication. Number of replicas is indicated in the figure legends. One-way ANOVAs followed by Tukey’s post-hoc analysis were performed when comparing groups for which a pairwise comparison of each group was required. Two-way ANOVAs (ordinary or repeated measure) followed by Tukey’s or Sidak’s post-hoc tests were used when two factors (such as treatment and testing) were compared. When two groups were compared, Student’s t-tests were used. All analyses were two-tailed. The significance of the results was accepted at p < 0.05.
Supplemental Material
Download Zip (2.2 MB)Acknowledgments
We thank Prof. Claudio Hetz (Institute of Biomedical Sciences, University of Chile) for generously providing the pAAV-mCherry-GFP-LC3B plasmid. We thank Dr. Theresa Swayne at the Confocal and Specialized Microscopy Shared Resource of the Herbert Irving Comprehensive Cancer Center at Columbia University (supported by NIH grant P30 CA013696) for providing image processing scripts and protocols. We thank Gabriella Pollonini for technical support. The studies presented in this manuscript were supported by the NIH grant MH065635 to CMA.
Disclosure statement
No potential conflict of interest was reported by the authors.
Supplementary material
Supplemental data for this article can be accessed here.
Data availability statement
All data and materials produced by this study are available from the corresponding author, [CMA], upon request.
Additional information
Funding
References
- Bourtchouladze R, Abel T, Berman N, et al. Different training procedures recruit either one or two critical periods for contextual memory consolidation, each of which requires protein synthesis and PKA. Learn Mem. 1998;5(4–5):365–374.
- Martin KC, Barad M, Kandel ER. Local protein synthesis and its role in synapse-specific plasticity. Curr Opin Neurobiol. 2000;10(5):587–592.
- Costa-Mattioli M, Sossin WS, Klann E, et al. Translational control of long-lasting synaptic plasticity and memory. Neuron. 2009;61(1):10–26.
- Kandel ER, Dudai Y, Mayford MR. The molecular and systems biology of memory. Cell. 2014;157(1):163–186.
- Dikic I. Proteasomal and autophagic degradation systems. Annu Rev Biochem. 2017;86(1):193–224.
- Kulkarni A, Chen J, Maday S. Neuronal autophagy and intercellular regulation of homeostasis in the brain. Curr Opin Neurobiol. 2018;51:29–36.
- Holt CE, Martin KC, Schuman EM. Local translation in neurons: visualization and function. Nat Struct Mol Biol. 2019;26(7):557–566.
- Sutton MA, Schuman EM. Dendritic protein synthesis, synaptic plasticity, and memory. Cell. 2006;127(1):49–58.
- Sossin WS, Costa-Mattioli M. Translational control in the brain in health and disease. Cold Spring Harb Perspect Biol. 2019;11(8):a032912.
- Kaang BK, Lee SH, Kim H. Synaptic protein degradation as a mechanism in memory reorganization. Neuroscientist. 2009;15(5):430–435.
- Shehata M, Inokuchi K. Does autophagy work in synaptic plasticity and memory? Rev Neurosci. 2014;25(4):543–557.
- Nazarko VY, Zhong Q. ULK1 targets Beclin-1 in autophagy. Nat Cell Biol. 2015;15(7):727–728.
- Kabeya Y, Mizushima N, Yamamoto A et al. LC3, GABARAP and GATE16 localize to autophagosomal membrane depending on form-II formation. J Cell Sci. 2004;117(13):2805–2812.
- Boecker CA, Holzbaur EL. Vesicular degradation pathways in neurons: at the crossroads of autophagy and endo-lysosomal degradation. Curr Opin Neurobiol. 2019;57:94–101.
- Galluzzi L, Bravo-San Pedro JM, Kroemer G. Defective autophagy initiates malignant transformation. Mol Cell. 2016;62(4):473–474.
- Rubinsztein DC. The roles of intracellular protein-degradation pathways in neurodegeneration. Nature. 2006;443(7113):780–786.
- Schneider JL, Cuervo AM. Autophagy and human disease: emerging themes. Curr Opin Genet Dev. 2014;26:16–23.
- Lionaki E, Markaki M, Palikaras K, et al. Mitochondria, autophagy and age-associated neurodegenerative diseases: new insights into a complex interplay. Biochim Biophys Acta. 2013;1847(11):1412–1423.
- Nixon RA. The role of autophagy in neurodegenerative disease. Nat Med. 2013;19(8):983–997.
- Wong YC, Holzbaur EL. Autophagosome dynamics in neurodegeneration at a glance. J Cell Sci. 2015;128(7):1259–1267.
- Tang G, Gudsnuk K, Kuo S-H, et al. Loss of mTOR-dependent macroautophagy causes autistic-like synaptic pruning deficits. Neuron. 2014;83(5):1131–1143.
- Shehata M, Abdou K, Choko K, et al. Autophagy enhances memory erasure through synaptic destabilization. J Neurosci. 2018;38(15):3809–3822.
- Nikoletopoulou V, Sidiropoulou K, Kallergi E, et al. Modulation of autophagy by BDNF underlies synaptic plasticity. Cell Metab. 2017;26(1):230–242.
- Glatigny M, Moriceau S, Rivagorda M, et al. Autophagy is required for memory formation and reverses age-related memory decline. Curr Biol. 2019;29(3):435–448.
- Hylin MJ, Zhao J, Tangavelou K, et al. A role for autophagy in long-term spatial memory formation in male rodents. J Neurosci Res. 2018;96(3):416–426.
- Bhukel A, Beuschel CB, Maglione M, et al. Autophagy within the mushroom body protects from synapse aging in a non-cell autonomous manner. Nat Commun. 2019;10(1):1318.
- Alberini CM. The role of protein synthesis during the labile phases of memory: revisiting the skepticism. Neurobiol Learn Mem. 2008;89(3):234–246.
- Shrestha P, Ayata P, Herrero-Vidal P, et al. Cell-type-specific drug-inducible protein synthesis inhibition demonstrates that memory consolidation requires rapid neuronal translation. Nat Neurosci. 2020;23(2):281–292.
- Lindqvist LM, Tandoc K, Topisirovic I, et al. Cross-talk between protein synthesis, energy metabolism and autophagy in cancer. Curr Opin Genet Dev. 2018;48:104–111.
- Saxton RA, Sabatini DM. mTOR signaling in growth, metabolism, and disease. Cell. 2017;169(2):361–371.
- Yoshii SR, Mizushima N. Monitoring and measuring autophagy. Int J Mol Sci. 2017;18(9):1865.
- Chen DY, Stern SA, Garcia-Osta A, et al. A critical role for IGF-II in memory consolidation and enhancement. Nature. 2011;469(7331):491–497.
- Garcia-Osta A, Tsokas P, Pollonini G, et al. MuSK expressed in the brain mediates cholinergic responses, synaptic plasticity, and memory formation. J Neurosci. 2006;26(30):7919–7932.
- Castillo K, Valenzuela V, Matus S, et al. Measurement of autophagy flux in the nervous system in vivo. Cell Death Dis. 2013;4(11):e917.
- Egan DF, Chun MH, Vamos M, et al. Small molecule inhibition of the autophagy Kinase ULK1 and identification of ULK1 substrates. Mol Cell. 2015;59(2):285–297.
- Guzowski JF, Lyford GL, Stevenson GD, et al. Inhibition of activity-dependent arc protein expression in the rat hippocampus impairs the maintenance of long-term potentiation and the consolidation of long-term memory. J Neurosci. 2000;20(11):3993–4001.
- Ye X, Kapeller-Libermann D, Travaglia A, et al. Direct dorsal hippocampal-prelimbic cortex connections strengthen fear memories. Nat Neurosci. 2017;20(1):52–61.
- Tanida I, Yamasaki M, Komatsu M, et al. The FAP motif within human ATG7, an autophagy-related E1-like enzyme, is essential for the E2-substrate reaction of LC3 lipidation. Autophagy. 2012;8(1):88–97.
- Bramham CR, Alme MN, Bittins M, et al. The Arc of synaptic memory. Exp Brain Res. 2010;200(2):125–140.
- Korb E, Finkbeiner S. Arc in synaptic plasticity: from gene to behavior. Trends Neurosci. 2011;34(11):591–598.
- Klann E, Dever TE. Biochemical mechanisms for translational regulation in synaptic plasticity. Nat Rev Neurosci. 2004;5(12):931–942.
- Knight ZA, Tan K, Birsoy K, et al. Molecular profiling of activated neurons by phosphorylated ribosome capture. Cell. 2012;151(5):1126–1137.
- Heiman M, Kulicke R, Fenster RJ, et al. Cell type-specific mRNA purification by translating ribosome affinity purification (TRAP). Nat Protoc. 2014;9(6):1282–1291.
- Schmidt EK, Clavarino G, Ceppi M, et al. SUnSET, a nonradioactive method to monitor protein synthesis. Nat Methods. 2009;6(4):275–277.
- Steward O, Farris S, Pirbhoy PS, et al. Localization and local translation of Arc/Arg3.1 mRNA at synapses: some observations and paradoxes. Front Mol Neurosci. 2014;7:101.
- Chowdhury S, Shepherd JD, Okuno H, et al. Arc/Arg3.1 interacts with the endocytic machinery to regulate AMPA receptor trafficking. Neuron. 2006;52(3):445–459.
- Yan J, Porch MW, Court-Vazquez B, et al. Activation of autophagy rescues synaptic and cognitive deficits in fragile X mice. Proc Natl Acad Sci U S A. 2018;115(41):E9707–E9716.
- Rojas-Rios P, Chartier A, Pierson S, et al. Translational control of autophagy by orb in the drosophila germline. Dev Cell. 2015;35(5):622–631.
- Liu X, Yao Z, Jin M, et al. Dhh1 promotes autophagy-related protein translation during nitrogen starvation. PLoS Biol. 2019;17(4):e3000219.
- Fullgrabe J, Ghislat G, Cho DH, et al. Transcriptional regulation of mammalian autophagy at a glance. J Cell Sci. 2016;129(16):3059–3066.
- Sakamaki JI, Long JS, New M, et al. Emerging roles of transcriptional programs in autophagy regulation. Transcription. 2018;9(2):131–136.
- McEwan DG, Dikic I. The Three Musketeers of Autophagy: phosphorylation, ubiquitylation and acetylation. Trends Cell Biol. 2011;21(4):195–201.
- Feng Y, Yao Z, Klionsky DJ. How to control self-digestion: transcriptional, post-transcriptional, and post-translational regulation of autophagy. Trends Cell Biol. 2015;25(6):354–363.
- Kim YC, Guan KL. mTOR: a pharmacologic target for autophagy regulation. J Clin Invest. 2015;125(1):25–32.
- Rangaraju V, Tom Dieck S, Schuman EM. Local translation in neuronal compartments: how local is local? EMBO Rep. 2017;18(5):693–711.
- Hafner AS, Donlin-Asp PG, Leitch B, et al. Local protein synthesis is a ubiquitous feature of neuronal pre- and postsynaptic compartments. Science. 2019;364(6441):eaau3644.
- Klionsky DJ, Abdelmohsen K, Abe A, et al. Guidelines for the use and interpretation of assays for monitoring autophagy (3rd edition). Autophagy. 2016;12:1–222. doi:https://doi.org/10.1080/15548627.2015.1100356. Erratum in: Autophagy. 2016;12(2):443. Selliez, Iban [corrected to Seiliez, Iban]. PMID: 26799652; PMCID: PMC4835977.
- Liu WJ, Ye L, Huang WF, et al. p62 links the autophagy pathway and the ubiqutin-proteasome system upon ubiquitinated protein degradation. Cell Mol Biol Lett. 2016;21(1):29.
- Shepherd JD. Arc - An endogenous neuronal retrovirus? Semin Cell Dev Biol. 2018;77:73–78.
- Okuno H, Minatohara K, Bito H. Inverse synaptic tagging: an inactive synapse-specific mechanism to capture activity-induced Arc/arg3.1 and to locally regulate spatial distribution of synaptic weights. Semin Cell Dev Biol. 2018;77:43–50.
- Yazdankhah M, Farioli-Vecchioli S, Tonchev AB, et al. The autophagy regulators Ambra1 and Beclin 1 are required for adult neurogenesis in the brain subventricular zone. Cell Death Dis. 2014;5(9):e1403.
- Martinet W, Roth L, De Meyer GRY. Standard Immunohistochemical assays to assess autophagy in mammalian tissue. Cells. 2017;6(3):17.
- Pi H, Li M, Tian L, et al. Enhancing lysosomal biogenesis and autophagic flux by activating the transcription factor EB protects against cadmium-induced neurotoxicity. Sci Rep. 2017;7(1):43466.
- Farris S, Lewandowski G, Cox CD, et al. Selective localization of arc mRNA in dendrites involves activity- and translation-dependent mRNA degradation. J Neurosci. 2014;34(13):4481–4493.
- Klionsky DJ, Eskelinen EL. The vacuole versus the lysosome: when size matters. Autophagy. 2014;2(2):185–187.
- Rosenfeldt MT, Nixon C, Liu E, et al. Analysis of macroautophagy by immunohistochemistry. Autophagy. 2012;8(6):963–969.
- Qu X, Yuan FN, Corona C , et al. Stabilization of dynamic microtubules by mDia1 drives Tau-dependent Aß1-42 synaptotoxicity. J Cell Biol. 2017;216(10):3161–3178.
- Sun D, McGinn M, Hankins JE, et al. Aging- and injury-related differential apoptotic response in the dentate gyrus of the hippocampus in rats following brain trauma. Front Aging Neurosci. 2013;5:95.