
ABSTRACT
Dysregulated microRNAs (miRNAs) are involved in carcinoma progression, metastasis, and poor prognosis. We demonstrated that in nasopharyngeal carcinoma (NPC), transactivated MIR106A-5p promotes a malignant phenotype by functioning as a macroautophagy/autophagy suppressor by targeting BTG3 (BTG anti-proliferation factor 3) and activating autophagy-regulating MAPK signaling. MIR106A-5p expression was markedly increased in NPC cases based on quantitative real-time PCR, miRNA microarray, and TCGA database analysis findings. Moreover, MIR106A-5p was correlated with advanced stage, recurrence, and poor clinical outcomes in NPC patients. In addition to three-dimensional cell culture assays, zebrafish and BALB/c mouse tumor models revealed that overexpressed MIR106A-5p targeted BTG3 and accelerated the NPC malignant phenotype by inhibiting autophagy. BTG3 promoted autophagy, and its expression was correlated with poor prognosis in NPC. Attenuation of autophagy, mediated by the MIR106A-5p-BTG3 axis, occurred because of MAPK pathway activation. MIR106A-5p overexpression in NPC was due to increased transactivation by EGR1 and SOX9. Our findings may lead to novel insights into the pathogenesis of NPC.
Abbreviations: ACTB: actin beta; ATG: autophagy-related; ATG5: autophagy related 5; BLI: bioluminescence; BTG3: BTG anti-proliferation factor 3; CASP3: caspase 3; ChIP: chromatin immunoprecipitation; CQ: chloroquine; Ct: threshold cycle; DAPI: 4ʹ,6-diamidino-2-phenylindole; DiL: 1,1ʹ-dioctadecyl-3,3,3ʹ,3ʹ-tetramethylindocarbocyanine perchlorate; EBSS: Earle’s balanced salt solution; EGR1: early growth response 1; GAPDH: glyceraldehyde-3-phosphate dehydrogenase; GEO: Gene Expression Omnibus; GFP: green fluorescent protein; IF: immunofluorescence; IHC: immunohistochemistry; ISH: in situ hybridization; MAP1LC3B: microtubule associated protein 1 light chain 3 beta; MIR106A-5p: microRNA 106a-5p; miRNAs: microRNAs; MKI67: marker of proliferation ki-67; mRNA: messenger RNA; MTOR: mechanistic target of rapamycin kinase; NPC: nasopharyngeal carcinoma; qRT-PCR: quantitative real-time PCR; siRNA: small interfering RNA; SOX9: SRY-box transcription factor 9; SQSTM1: sequestosome 1; TCGA: The Cancer Genome Atlas; WB: western blot.
Introduction
Nasopharyngeal carcinoma (NPC) is the most common form of head and neck cancer and is particularly prevalent in southern China and regions of Southeast Asia [Citation1]. Recurrence and distant metastases are key indicators for aggressive and life-threatening NPC. Therefore, identification of molecular mechanisms associated with malignant NPC, including markers for development and metastasis, is crucial.
microRNAs (miRNAs) encompass a cluster of small noncoding RNAs that are post-transcriptional negative regulators of mRNA that act by binding to the 3′-untranslated region (3′-UTR) of target genes, resulting in mRNA degradation or translational suppression [Citation2]. miRNAs regulate more than one-third of human mRNAs, and miRNA expression is dysregulated in some cancers [Citation3]. Aberrant miRNA expression results in altered regulation of target transcripts and has been implicated in multiple cancer processes, including tumor proliferation and metastasis [Citation4]. Although the specific ways in which aberrant miRNAs modulate NPC development and metastasis remain obscure, and there are many factors that contribute to cancer malignancy, miRNAs have been specifically demonstrated to alter cancer macroautophagy/autophagy [Citation5].
Autophagy, a dynamic catabolic process, where damaged organelles and protein aggregates are engulfed and digested, has been implicated in a wide array of physiological processes and in the pathogenesis of a diverse number of diseases, including cancer [Citation6,Citation7]. Research within the past decade has established that the biological and clinical significance of autophagy in the context of cancer is dependent on cancer type and genetic background [Citation8]. Considerable evidence has demonstrated that cytoprotective autophagy promotes tumor cell survival by allowing for nutrient uptake [Citation9]. In contrast, autophagy can also exhibit tumor-suppressive effects through a mechanism by which the tumor cells undergo programmed cell death [Citation10,Citation11]. In addition, oncogenic control of autophagy regulation may promote malignant transformation [Citation12]. Autophagy is a complex process that entails the sequential formation of autophagosomes and autolysosomes under the control of autophagy-related (ATG) genes and MAP1LC3B (microtubule associated protein 1 light chain 3 beta proteins) [Citation13]. Notably, miRNAs are characterized as important regulators of autophagy in cancer, and several autophagy-related miRNAs, including MIR23A, MIR29 C, and MIR214, accelerate malignant cancer phenotypes [Citation5,Citation14–17].
MIR106A-5p, cytogenetically located on Xq26.2, acts as oncogene and tumor suppressor in different cancers [Citation18,Citation19]. However, the regulatory mechanism underlying the oncogenic effects of MIR106A-5p has not been elucidated. We used miRNA microarray to characterize MIR106A-5p expression levels in NPC tissues. Clinical data were used to determine the relationship between MIR106A-5p and patient outcomes. Subsequent experiments demonstrated the mechanism by which MIR106A-5p modulates malignancy and autophagy in NPC. Lastly, we examined how MIR106A-5p was upregulated in NPC.
Results
Expression and clinical significance of MIR106A-5p in NPC
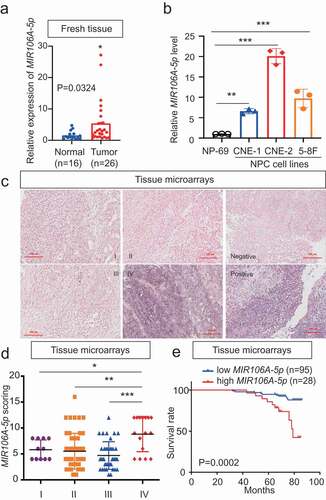
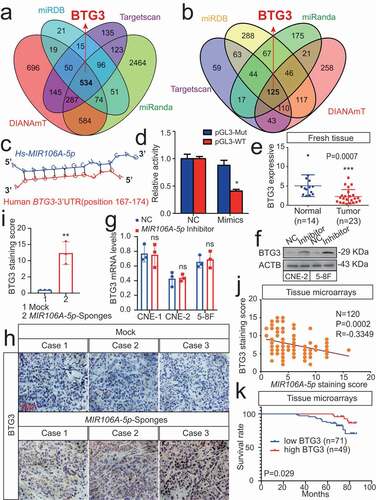
The expression profiles of NPC miRNAs were examined using a combined GEO cohort database (GEO accession number: GSE70970). This data showed that among the differentially expressed miRNAs, MIR106A-5p was significantly increased 4.8-fold in NPC tissues (Fig. S1A and S1B). MIR106A-5p overexpression was confirmed by quantitative real-time PCR (qRT-PCR) in both NPC tissue and serum samples ( and S1D). In addition, MIR106A-5p expression was dramatically increased in NPC cell lines, particularly the CNE-2 and 5–8 F lines (). Next, in situ hybridization (ISH) with NPC tissue microarrays showed that MIR106A-5p overexpression was more prominent in patients with clinical stage IV NPC than in patients with clinical stage I–III NPC (), indicating that dysregulation of MIR106A-5p may be closely related to terminal stage NPC. This finding was confirmed using a cohort from the GEO database (Fig. S1 C). Further, MIR106A-5p upregulation was significantly correlated with NPC recurrence (P = 0.048, Table S1). Among the 55 patients with recurrence, 98.18% (54/55) developed distant metastases. Together, these data suggest that MIR106A-5p serves as a valuable biomarker for predicting advanced cancer or recurrence in NPC. The ISH staining of MIR106A-5p was scored as 0–8 (low expression) or 9–16 (high expression) by the X-tile Software, and the survival rate analysis showed that patients with high MIR106A-5p expression had worse clinical outcome than patients with low MIR106A-5p expression (P = 0.0002, ). TCGA database queries, in agreement with our findings, showed MIR106A-5p overexpression in head and neck cancer (Fig. S1E) that was more prominent in clinical stage IV than stage I–III (Fig. S1 F). MIR106A-5p was also a valuable survival biomarker (Fig. S1 G). Overall, these findings indicated that NPC progression is associated with upregulated MIR106A-5p.
Figure 1. Expression and clinical significance of MIR106A-5p in NPC. (A) MIR106A-5p levels in fresh NPC and non-cancerous nasopharyngeal samples detected by qRT-PCR. P-values were calculated using two-tailed Student’s t-tests. (B) MIR106A-5p levels in NP-69 and NPC cell lines were examined by qRT-PCR (one-way ANOVA). CNE-1, CNE-2, 5–8 F, and 6–10B are human NPC cell lines; NP-69 is an immortalized normal nasopharyngeal epithelial cell line. (C) Representative MIR106A-5p ISH staining of NPC tissue microarrays, scale bar: 100 μm. (D) Statistical comparison of MIR106A-5p expression across clinical stages using one-way ANOVA. (E) The ISH staining score of MIR106A-5p in NPC tissue microarrays was defined as low expression (scores of 0–8) or high expression (scores of 9–16) by the X-tile Software. Then Kaplan-Meier analysis was used to compare overall survival using the log-rank test. All experiments were conducted with three independent replicates. All graphs show mean ± SEM of at least three independent experiments. *P < 0.05, **P < 0.01, ***P < 0.001
As MIR106B-5p and MIR106A-5p belong to the same miRNA family, the expression and role of MIR106B-5p in NPC were explored. It was shown that MIR106B-5p expression was only elevated in two of four NPC cell lines (Fig. S2A). A series of cellular analyzes found that MIR106B-5p does not affect the cell growth and migration of NPC cells (Fig. S2B-S2D).
MIR106A-5p accelerates the malignant NPC phenotype
Since MIR106A-5p upregulation was significantly associated with terminal disease stage, recurrence, and poor survival, the direct effects of MIR106A-5p on NPC cells were examined. CNE-2 and 5–8 F cells were transfected with MIR106A-5p sponges or inhibitor to generate cells with low MIR106A-5p expression (Fig. S3A and S3B). The functionality of the MIR106A-5p inhibitor was validated by measuring the known target cyclin-dependent kinase inhibitor 1A [Citation20] (Fig. S3 C). Using a series of cellular analyses, we found that NPC cells with decreased MIR106A-5p expression had impeded growth and migration capacity (Fig. S3D-J).
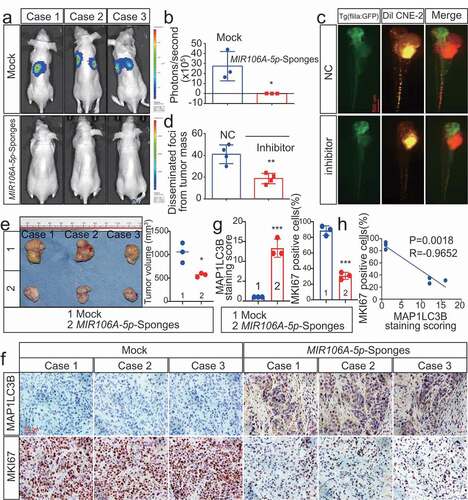
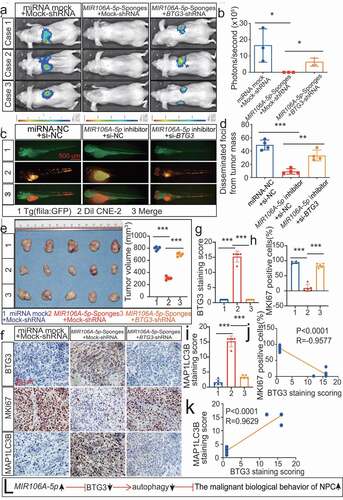
Zebrafish and BALB/c mice animal models were used to determine the in vivo function of MIR106A-5p. First, we injected luciferase-labeled CNE-2 cells with or without knockdown of MIR106A-5p into nude mice by tail vein injection, followed by monitoring the tumor growth by measuring the amount of bioluminescence (BLI). We found that the knockdown of MIR106A-5p significantly inhibited the metastatic ability of CNE-2 cells (). We used a zebrafish tumor model we have recently established for NPC metastasis research [Citation21,Citation22], DiI-labeled CNE2 cells with or without knockdown of MIR106A-5p were injected into blastulas, and cells that migrated away from the primary injection site were counted using fluorescence confocal microscopy 8 d after injection. During the experiment, tumor formation and cell survival in zebrafish were monitored by measuring the amount of BLI, and no statistical differences were observed between the two groups before the 8-d cutoff period. However, at 8-d post-injection, the results showed diminished NPC cell migration following MIR106A-5p knockdown (). These findings were complemented using mouse tumor xenografts where tumor size was measured following subcutaneous injection of high or low MIR106A-5p-expressing CNE-2 cells (). Mice injected with cells with low MIR106A-5p expression had reduced tumor growth (). Together, these findings provide evidence that MIR106A-5p accelerates NPC metastasis and growth. miRNAs are important regulators of autophagy, and loss of autophagy through miRNA disruption modulates tumor development and metastasis. Immunohistochemistry (IHC) analysis showed that xenografts with low MIR106A-5p expression had increased MAP1LC3B expression levels (), and MAP1LC3B expression levels were negatively correlated with MKI67 (marker of proliferation ki-67) expression in NPC xenografts (). Detection of cleaved CASP3 (caspase 3) expression indicated increased apoptosis in the low MIR106A-5p-expression group (Fig. S3 K and S3 L).
Figure 2. Silencing of MIR106A-5p inhibits NPC proliferation and migration in vivo. (A) Visualization of lung metastasis after intravenous injection of CNE-2 cells, with or without knockdown of MIR106A-5p, in BALB/c mice. Representative images of bioluminescence signals and normalized photon flux are shown. (B) Graph representing mean intensity of fluorescence 7 weeks after tumor injection (*P < 0.05, t-test). (C) CNE2 cells transfected with MIR106A-5p inhibitor and labeled with DiI were injected into the perivitelline space of zebrafish embryos. Migration of CNE2 cells was measured using fluorescence microscopy at day 8 post-injection. (D) Quantification of migratory cell numbers and analysis using Student’s t-test (**P < 0.01). (E) Cells with stable silencing of MIR106A-5p or control cells were subcutaneously transplanted in nude mice (n = 3 per group). Subcutaneous tumor volumes at day 21 are shown (*P < 0.05, t-test). (F) Immunohistochemistry (IHC) analysis of tumor MAP1LC3B and MKI67 expression across tumor groups. Scale bar: 50 μm. Quantification of IHC staining for MAP1LC3B and MKI67 expression using Student’s t-test (***P < 0.001) (G) and Pearson correlation between MAP1LC3B and MKI67 expression (H). Linear regression. All experiments were repeated three times. Data represent mean ± SEM
MIR106A-5p suppresses autophagy in NPC cells
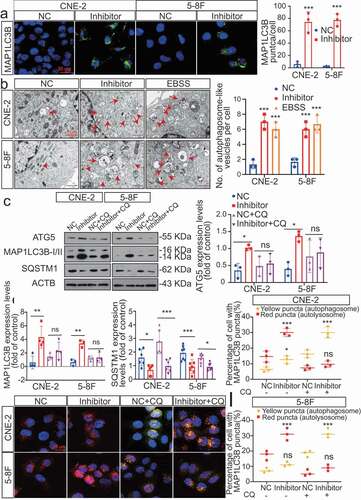
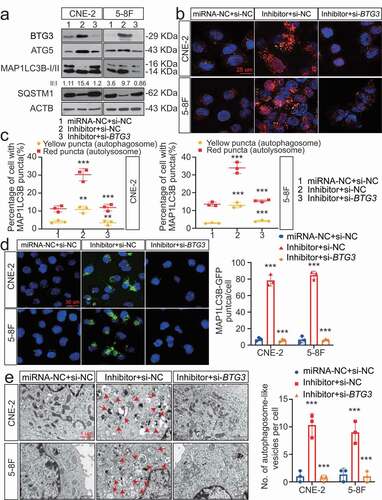
Based on these IHC results, we hypothesized that dysregulated MIR106A-5p expression might influence autophagy. Therefore, the effect of MIR106A-5p on autophagosome and autolysosome generation was evaluated. Of note, silencing MIR106A-5p expression markedly promoted expression of ATG genes and induced autophagic flux to generate autophagosomes and/or autolysosomes (), indicating that MIR106A-5p potently inhibits autophagy in NPC cells.
Figure 3. Silencing of MIR106A-5p promotes autophagy in NPC cells. (A) Left, immunofluorescence analysis of endogenous MAP1LC3B puncta in cells transfected with MIR106A-5p inhibitor or control. Right, total number of endogenous MAP1LC3B puncta per cell. Student’s t-test. (B) Left, transmission electron microscopy analysis of autophagy. Arrows indicate cell autophagosomes/autolysosomes. Right, quantification of the total autophagosome numbers per cell analyzed using Student’s t-tests. EBSS: Earle’s balanced salt solution. (C) Western blot (WB) analysis of changes in MAP1LC3B conversion, ATG5, and SQSTM1 levels induced by MIR106A-5p silencing in NPC cells in the absence (–) or presence (+) of 10 μmol/L chloroquine (CQ) treatment. ACTB was used as a loading control. (D-F) quantification of WB results from three independent experiments. (G-I) Cells were transiently transfected with mRFP-GFP-MAP1LC3B reporter, which differentiates between autophagosomes (GFP+ RFP+, yellow puncta) and autolysosomes (GFP− RFP+, red puncta). Cells were transfected with MIR106A-5p inhibitor in the absence or presence of CQ to inhibit autophagosome and lysosome fusion. Results were analyzed using two-way ANOVA with at least three independent replicates per condition. All experiments were repeated three times with similar results. Images in A–I are representative of three independent experiments. Data represent mean ± SEM. Unprocessed original scans of three independent blots are shown in Fig. S9
MIR106A-5p accelerates the NPC malignant phenotype by suppressing autophagy
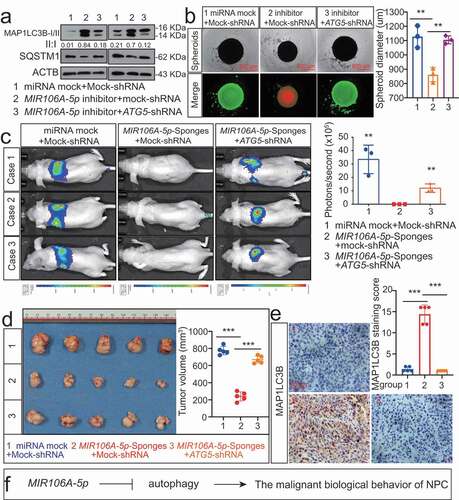
The function of MIR106A-5p-suppressed autophagy in NPC development and metastasis was examined by assessing the growth and migration capacities of cells following knockdown of ATG5. Knocking down ATG5 significantly decreased the autophagy induced by MIR106A-5p inhibition (). Since three-dimensional cell culture models more closely mimic the in vivo tumor microenvironment, three-dimensional NPC cell cultures were used to assess cell viability and proliferation. Silencing MIR106A-5p expression reduced spheroid formation and cell viability, and this phenotype was partially rescued by knocking down ATG5 (). Moreover, the decreased metastasis and growth induced by MIR106A-5p sponges in vivo was abolished following knockdown of ATG5 (). These findings indicate that MIR106A-5p-suppressed autophagy accelerates malignant NPC phenotypes ().
Figure 4. Blocking autophagy induced by MIR106A-5p inhibitor rescues NPC proliferation and migration. (A) WB analysis of MAP1LC3B-I, MAP1LC3B-II and SQSTM1 in cells transfected with MIR106A-5p inhibitor along with transfection of lentiviral ATG5-shRNA or mock vector. (B) Left, cell growth and viability analysis via three-dimensional spheroid formation assay. Red fluorescence represents dead cells and green fluorescence represents live cells. Right, spheroid diameter analyzed using one-way ANOVA (**P < 0.01, scale bar: 600 μm). (C) Left, visualization of lung metastasis after intravenous injection of stated cells. Right, mean intensity of fluorescence (**P < 0.01, one-way ANOVA). (D) Left, representative NPC xenografts in mice for indicated groups (n = 5 per group). Right, tumor volumes on day 21. (E) Tumors were analyzed by IHC for MAP1LC3B expression using one-way ANOVA. Scale bar: 50 μm. (F) Schematic diagram. All experiments were repeated three times. Data represent mean ± SEM. Images in A-B and E are representative of three independent experiments. All spheroid formation for three independent experiments in B and IHC images for every subcutaneous tumor in E are shown in Fig. S8. Unprocessed original scans of three independent blots are shown in Fig. S9
BTG3 is the direct target of MIR106A-5p and correlates with poor prognosis in head and neck cancer
Autophagy-related targets of MIR106A-5p were identified using four common bioinformatics tools to generate a pool of predicted candidate genes (). Detailed information of the target-gene scan is provided in Table S2. Among these targets, BTG3 (BTG anti-proliferation factor 3) was selected due to the potentially high-affinity binding sites of MIR106A-5p () and its role in regulating autophagy [Citation23]. Luciferase reporter assays showed biologically effective interactions between MIR106A-5p and the BTG3 3′-UTR (). In addition, BTG3 mRNA and BTG3 protein expression were decreased in NPC (, S5A and S5B). Interestingly, the BTG3 protein levels dramatically increased following MIR106A-5p inhibition, while BTG3 mRNA levels remained unchanged (). Of note, MIR106A-5p expression negatively correlated with BTG3 protein levels in NPC tissue microarrays (), whereas no inverse correlation was observed between MIR106A-5p and BTG3 mRNA levels in NPC tissues and TCGA database (Fig. S4A and S4B). These results indicated that MIR106A-5p might regulate BTG3 expression through translational suppression. Finally, Kaplan-Meier analysis revealed that low BTG3 levels were associated with worse clinical outcomes in NPC tissue microarrays (P = 0.029, ) and TCGA database (P = 0.003, Fig. S1 H). Collectively, these data suggest that MIR106A-5p directly regulates autophagy by targeting BTG3.
Figure 5. MIR106A-5p directly targets BTG3. (A) Venn diagram depicting predicted MIR106A-5p targets. (B) Venn diagram depicting MIR106A-5p targets with high target scores. (C) Schematic of predicted MIR106A-5p binding sequences in the 3′-UTR of BTG3. (D) MIR106A-5p overexpression reduced wild-type BTG3 3′-UTR luciferase activity but not mutant BTG3 3′-UTR luciferase activity (analyzed using Student’s t-test). (E) BTG3 levels in fresh NPC and non-cancerous nasopharyngeal samples detected by qRT-PCR. P-values were calculated using two-tailed Student’s t-tests. (F) WB analysis of changes in BTG3 levels induced by MIR106A-5p silencing. (G) qRT-PCR analysis of changes in BTG3 levels induced by MIR106A-5p silencing. (H) Representative IHC images of BTG3 staining in tissues collected from two groups of NPC xenografts. Scale bar: 50 μm. (I) Quantification of IHC staining for MAP1LC3B expression using Student’s t-test (**P < 0.01). (J) IHC staining of BTG3 expression in NPC tissue microarrays. Pearson correlation between BTG3 and MIR106A-5p expression was analyzed. (K) The ISH staining score of BTG3 in NPC tissue microarrays was defined as low expression (scores of 0–7) or high expression (scores of 8–16) by the X-tile Software. Kaplan-Meier analysis was used to compare overall survival using the log-rank test. All experiments were conducted with three independent replicates. All graphs show mean ± SEM of at least three independent experiments. Unprocessed original scans of three independent blots for F are shown in Fig. S9
BTG3 is essential for the suppression of autophagy by MIR106A-5p
Regulation of autophagy by BTG3 was determined through transfection experiments. Overexpression of BTG3 markedly increased induction of autophagy, which was consistent with the increased expression of ATGs (Fig. S5 C) and significant accumulation of autophagosomes and autolysosomes (Fig. S5 C and S5D). We showed that BTG3 was involved in the MIR106A-5p-associated inhibition of autophagy by transfecting NPC cells with siRNA against BTG3 (). A series of analyses demonstrated that knockdown of BTG3 abolished the capacity of MIR106A-5p inhibition to increase autophagy (), providing evidence that the suppression of autophagy by MIR106A-5p is dependent on its ability to decrease BTG3 levels. Additionally, immunofluorescence (IF) co-staining of MIR106A-5p, MAP1LC3B, and BTG3 was performed to show the MIR106A-5p-BTG3- MAP1LC3B signaling cascade (Fig. S5 F).
Figure 6. The MIR106A-5p-BTG3 axis regulates NPC cell autophagy. (A) Expression of MAP1LC3B conversion, ATG5, and SQSTM1 was measured by WB in MIR106A-5p-silenced NPC cells transfected with BTG3-specific siRNA or control. (B) Detection of autophagic flux with the mRFP-GFP-LC3 reporter in MIR106A-5p-silenced NPC cells transfected with BTG3-specific siRNA or control. Scale bar: 25 μm. (C) Analysis of autophagic flux using two-way ANOVA with at least three independent replicates per condition (**P < 0.01, ***P < 0.001). (D) Left, immunofluorescence analysis of endogenous MAP1LC3B puncta in cells. Scale bar: 30 μm. Right, total number of endogenous MAP1LC3B puncta per cell analyzed using two-way ANOVA with at least three independent replicates per condition (***P < 0.001). (E) Left, transmission electron microscopy analysis of autophagy. Arrows, autophagosomes/autolysosomes. Scale bar: 1 μm. Right, the total numbers of autophagosomes per cell were quantified and analyzed using two-way ANOVA with at least three independent replicates per condition (***P < 0.001). Experiments were conducted with at least three independent replicates. All experiments were repeated three times with similar results. Images in A-B and D-E are representative of three independent experiments. Data represent mean ± SEM. Unprocessed original scans of three independent blots are shown in Fig. S9
BTG3 is essential for MIR106A-5p to accelerate malignant NPC phenotypes
To further corroborate that the MIR106A-5p-BTG3 axis results in accelerated malignancy, NPC cells treated with MIR106A-5p sponges were transduced with lentiviral BTG3-shRNA (Fig. S5E and 7A-7E). MIR106A-5p inhibition reduced metastasis and growth of NPC cells, but these effects were significantly diminished following BTG3 knockdown ( and S6A-S6E). IHC analysis showed that autophagy was also reduced in the NPC xenograft group with accelerated malignant phenotype (), suggesting that the autophagy-suppressive and tumor-promoting effects of MIR106A-5p require BTG3 ().
Figure 7. The MIR106A-5p-BTG3 axis regulates proliferation and migration in NPC cells. (A) MIR106A-5p-silenced NPC cells were transfected with lentiviral BTG3-shRNA or control and inoculated into nude mice by tail vein injection. Visualization of lung metastasis in different groups are representative of three independent experiments. (B) Graph representing the mean intensity of fluorescence (*P < 0.05, one-way ANOVA). (C) MIR106A-5p-silenced NPC cells were transfected with BTG3-siRNA or control and labeled with DiI. Labeled cells were injected into the perivitelline space of zebrafish embryos to detect tumor cell metastasis by fluorescence microscopy. (D) Quantification of migratory cell numbers (**P < 0.01, ***P < 0.001, one-way ANOVA). (E) Left, representative NPC xenografts in mice for indicated groups (n = 5 per group). Right, tumor volumes on day 21. (F) Tumors were analyzed by IHC for BTG3, MKI67, and MAP1LC3B expression using one-way ANOVA. Scale bar: 50 μm. Quantification of IHC staining for BTG3 (G), MKI67 (H), and MAP1LC3B (I) expression using one-way ANOVA (***P < 0.001). (J) Pearson correlation between BTG3 and MKI67 expression and (K) MAP1LC3B and BTG3 expression. Linear regression. (L) Schematic diagram. All experiments were repeated three times. Data represent mean ± SEM. All IHC images for every subcutaneous tumor in F are shown in Fig. S8
The MIR106A-5p-BTG3 axis suppresses autophagy via the MAPK pathway
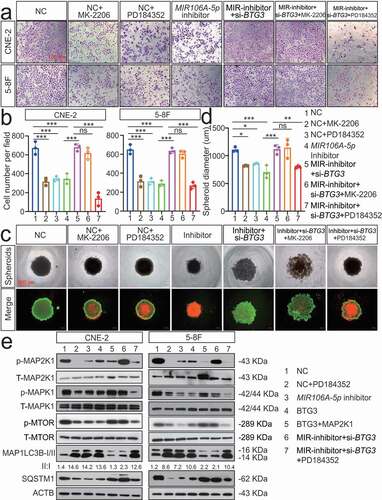
We next sought to identify BTG3-interacting partners involved in MIR106A-5p-induced autophagy. GST affinity-isolation assay was performed, which identified 253 BTG3-binding proteins (Fig. S7A). A detailed list of the binding proteins is provided in Table S3. There were no previously reported autophagic proteins among these interacting partners. To further investigate the mechanism by which BTG3 regulates autophagy, we focused on the autophagy-related pathways. Following KEGG pathway analysis of MIR106A-5p targets, the MAPK and AKT-MTOR pathways emerged as negative modulators of autophagy [Citation24] (Fig. S7B). Therefore, rescue experiments using inhibitors of these pathways were performed to investigate the relative contributions of these pathways to MIR106A-5p-BTG3-mediated tumor progression. We found that only suppression of MAP2K1/MEK activity with PD184352 significantly inhibited the cellular proliferation and migration induced by MIR106A-5p and BTG3 silencing; by contrast, inhibition of AKT activity by MK2206 failed to alter MIR106A-5p-BTG3-mediated tumor growth and migration (). MAPK signaling pathway PCR array analyses revealed expression level changes following MIR106A-5p silencing. The identities and heatmap data of 86 selected genes are shown in Fig. S11B. Overall, silencing of MIR106A-5p significantly reduced ATF2, CCNB2, CREB1, ETS2, KRAS, KSR1, MAP3 K4, MAPK1, MAPK6, MAPKAPK3, MYC, and RAC1 expression (Fig. S7 C and S7D). Furthermore, we examined whether MIR106A-5p-BTG3 axis-dependent autophagy inhibition in NPC resulted from activation of MAPK signaling. p-MAP2K1 and downstream p-MAPK1/ERK and p-MTOR levels were decreased when MIR106A-5p inhibition or BTG3 expression activated autophagy. After suppression of MAP2K1 activity with PD184352, p-MAP2K1, p-MAPK1, and p-MTOR levels and ATG expression were rescued in MIR106A-5p and BTG3 knockdown cells (), suggesting that activated MAPK signaling is partially responsible for the suppression of autophagy by the MIR106A-5p-BTG3 axis in NPC.
Figure 8. The MIR106A-5p-BTG3 axis regulates NPC cell autophagy by activating MAPK signaling. Rescue experiments with Transwell assay (A-B) and three-dimensional spheroid formation assay (C-D) were performed using inhibitors of AKT and MAPK signaling using MIR106A-5p-silenced NPC cells transfected with BTG3-specific siRNA or control. MK2206: AKT inhibitor. PD184352: MAP2K1 inhibitor. (B) The number of cells that invaded through the membrane was counted in 3 fields per group with three independent replicates (***P < 0.001, one-way ANOVA). Data represent mean ± SEM. (D) Spheroid diameters were analyzed using one-way ANOVA (*P < 0.05, **P < 0.01, ***P < 0.001, scale bar: 600 μm). (E) Rescue experiments with WB analysis of p-MAP2K1/MAP2K1, p-MAPK1/MAPK1, and p-MTOR/MTOR levels, as well as autophagy-related gene levels, in different conditions in NPC cells. PD184352: MAP2K1 inhibitor, BTG3: BTG3 overexpression vector, MAP2K1: MAP2K1 overexpression vector. All experiments were repeated three times with similar results. Images in A, C, and E are representative of three independent experiments. Data represent mean ± SEM. All spheroid formation images of three independent experiments in C are shown in Fig. S8. Unprocessed original scans of three independent blots are shown in Fig. S9
MIR106A-5p upregulation in NPC results from increased transactivation by EGR1 and SOX9
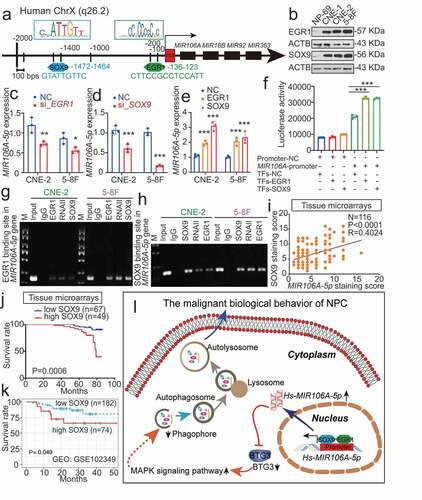
We then examined how MIR106A-5p was upregulated in NPC. Sequence analysis of the MIR106A-5p promoter identified putative binding sites for EGR1 (early growth response 1) and SOX9 (SRY-box transcription factor 9) at −136 and −1472, respectively (), suggesting that EGR1 and SOX9 regulate the transcription of MIR106A-5p. Notably, EGR1 and SOX9 were both upregulated in the NPC cell lines (). Silencing EGR1 and SOX9 expression decreased MIR106A-5p levels, and overexpression of EGR1 and SOX9 increased MIR106A-5p levels ( and S7E-S7 G). Furthermore, luciferase reporter assay and chromatin immunoprecipitation (ChIP) analysis showed that both EGR1 and SOX9 directly bound to the predicted binding sites of the MIR106A-5p promoter and transactivated MIR106A-5p (). Correlation between SOX9 and MIR106A-5p expression in NPC tissues using IHC and ISH assay show that SOX9 expression was positively correlated to MIR106A-5p levels (). Survival analysis of NPC tissue microarrays further showed that NPC patients with high SOX9 expression had poor prognosis when compared to those with low SOX9 expression (). GEO cohort database and TCGA database analysis also confirmed these prognostic findings ( and S1I). These results showed that MIR106A-5p overexpression in NPC results from increased transactivation by EGR1 and SOX9. A schematic overview of the mechanism by which MIR106A-5p autophagy modulation promotes malignant phenotypes is displayed in .
Figure 9. MIR106A-5p overexpression in NPC results from increased transactivation by EGR1 and SOX9. (A) Schematic diagram of predicted EGR1 and SOX9 binding sequences within a region 136 bp and 1472 upstream of the MIR106A-5p gene locus TSS. (B) Immunoblotting analysis of EGR1 and SOX9 in NP-69 and NPC cells. qRT-PCR analysis of MIR106A-5p expression after EGR1 (C) and SOX9 (D) knockdown or EGR1 and SOX9 overexpression (E). (F) Binding of transcription factors (EGR1 and SOX9) to the MIR106A-5p promoter in NPC cells was confirmed by dual-luciferase reporter assays. (G-H) ChIP assays were performed to determine the binding of both EGR1 and SOX9 to the MIR106A-5p promoter region in NPC cells. (I) IHC analysis of SOX9 expression in NPC tissue microarrays and correlation between MIR106A-5p expression levels and SOX9 staining score using Spearman’s rank correlation analysis. Kaplan-Meier analysis of the association of SOX9 expression was used to estimate survival time in NPC patients (J) and a GEO database cohort (accession number GEO: GSE102349) (K); differences in survival were analyzed using the log-rank test. (L) Schematic overview of the role of MIR106A-5p in promoting the malignant phenotype in NPC by modulating autophagy. MIR106A-5p targets BTG3 to activate MAPK signaling, which accelerates malignant NPC phenotypes by autophagy suppression. MIR106A-5p overexpression in NPC results from increased transactivation by EGR1 and SOX9. Experiments were conducted with at least three independent replicates. Data represent mean ± SEM. One-way ANOVA was used for statistical analysis (*P < 0.05, **P < 0.01, ***P < 0.001)
Discussion
Previous reports have identified altered miRNA expression in NPC, including instances of decreased expression of tumor-suppressive and increased expression of oncogenic miRNAs [Citation25]. The differentially expressed miRNA profiles of NPC in a cohort from the GEO database (GSE70970) showed that 97 miRNAs had significantly altered expression. Among them, 21 were EBV-related miRNAs, 20 of which have been previously reported to be involved in NPC progression. Among the remaining differentially expressed miRNAs, the miR-17 ~ 106 family, including MIR17, MIR106A and MIR106B, had significantly increased expression and drew our attention. The miR-17 ~ 106 family is reported to participate in multiple cancer cellular processes as oncogenic factors in a variety of tumor types [Citation26–28]. Several studies have suggested that MIR17 is involved in the development and tumorigenesis of NPC [Citation29,Citation30]; however, the expression and role of MIR106A/MIR106B in NPC have not been elucidated. Like previous studies suggesting that MIR106A-5p has tumor-promoting roles in hepatocellular carcinoma, colorectal cancer, and ovarian cancer [Citation31–33], this study showed that MIR106A-5p was significantly overexpressed and served as an oncogene in NPC.
NPC patients with cancers detected at an early stage can be effectively cured using standard therapies, but the prognosis of patients with advanced-stage disease is extremely poor. Following recurrence, therapy often fails, and advanced stage and recurrent NPC present a challenge to clinicians. This study showed that MIR106A-5p overexpression was significantly higher in patients with clinical stage IV and that MIR106A-5p levels significantly correlated with recurrence. These findings suggest the prognostic utility of MIR106A-5p levels in discrimination of terminal stage and risk of recurrence in NPC patients. Therefore, quantification of MIR106A-5p levels before initiation of therapy may predict the odds of recurrence and survival and would complement TNM staging.
Autophagy plays an intricate and context-dependent role in different cancer types [Citation34]. Autophagy is considered to be a tumor-suppressive mechanism in NPC. Lin et al. [Citation35] demonstrated that the autophagy machinery in NPC contained mutations and deletions in three critical autophagy genes, ATG2A, ATG7, and ATG13, suggesting low levels of autophagy in NPC. In parallel, there is published evidence showing that autophagy defects and high SQSTM1 (sequestosome 1) expression can facilitate epithelial to mesenchymal transition in NPC and promote metastasis [Citation36,Citation37]. In addition, autophagy deficiency in NPC is significantly correlated with chemotherapy and radiotherapy resistance [Citation38,Citation39]. Studies of NPC have identified autophagy inactivation as a consequence of dysregulation of SQSTM1, ANXA1, angiotensin-(1-7), and SSRP1 (structure specific recognition protein 1) [Citation36,Citation37,Citation40,Citation41]; however, how miRNAs regulate autophagy and the impact of miRNA-regulated autophagy on NPC malignancy are unclear [Citation42]. Previous studies reported that ATG7 and RUNX1 are targets of MIR106A-5p [Citation43–45], and both ATG7 and RUNX1 are known to participate in autophagy regulation [Citation46]. Therefore, we directly explored the role of MIR106A-5p in autophagy and the role of autophagy in NPC malignancy. This study showed that MIR106A-5p strongly impeded NPC autophagy, which in turn promoted pro-tumorigenic phenotypes.
In this study, we identified BTG3 as a new direct target of MIR106A-5p for its anti-autophagic effect and tumor-promoting function in NPC. Although several known targets of MIR106A-5p, such as ATG7 and RUNX1, have been reported to regulate autophagy, this is the first report of MIR106A-5p directly regulating autophagy by targeting BTG3. Tumor-suppressive functions of BTG3 have been reported [Citation23,Citation47], although not in the context of NPC. Gou et al. found that BTG3 overexpression increased MAP1LC3B and BECN1 expression in gastric cancer, indicating that BTG3 may regulate autophagy, but these findings were not further investigated [Citation23]. Paradoxically, MIR106A-5p expression was negatively correlated with BTG3 protein levels, but there was no inverse correlation between MIR106A-5p and BTG3 mRNA levels. Although we discovered that MIR106A-5p directly repressed BTG3 expression through binding the 3′-untranslated region of BTG3, the post-translational mechanism underlying the decrease in BTG3 protein levels, such as translational suppression, remains unknown and will be elucidated in future studies.
The MAPK signaling pathway acts downstream of MIR106A-5p, which is consistent with the results from our KEGG pathway analysis. Previous studies have confirmed the key negative regulation role of MAPK signaling in autophagy [Citation48]. In the present study, we demonstrated the specificity of the MIR106A-5p-BTG3 axis in regulating cellular autophagy and malignant phenotypes by activating MAPK signaling.
Lastly, this study examined how MIR106A-5p was upregulated in the context of NPC. According to previous reports, MIR106A-5p could be regulated by multiple long noncoding RNAs including RHOJ/TCL [Citation49], HOTAIRM1 [Citation33], H19 [Citation50], and OPI5-AS1 [Citation51]. However, there are few reports of the regulation of MIR106A-5p by transcription factors. Previous studies have reported that MIR106A-5p could be regulated by the transcription factor EGR1 in ovariectomized mice [Citation52]. Interestingly, our study was the first to demonstrate that EGR1 and SOX9 co-bind at the MIR106A-5p promoter and regulate the transcription of MIR106A-5p in NPC cells. Super-enhancers are clusters of enhancers that are occupied by exceptionally high densities of transcriptional machinery, including transcription factors, to drive robust expression of genes [Citation53]. It is therefore of great interest to further clarify how EGR1 and SOX9 co-activate MIR106A-5p expression and whether super-enhancers drive the overexpression of MIR106A-5p.
Overall, this study revealed the role of MIR106A-5p in autophagy and promotion of the NPC malignant phenotype. Our results suggest that quantification of MIR106A-5p is useful for predicting the odds of recurrence and survival prior to treatment. In conclusion, our findings can be used to provide new insights into the clinical application of autophagy-related NPC therapy.
Materials and methods
Human NPC specimens
Tissue and serum samples from pathologically confirmed cases of NPC were collected at the Affiliated Hospital of Nantong University following ethics committee approval (IRB number: 2018-L049). All included patients were informed and had not received any cancer therapies prior to biopsy. Tissue microarrays examining MIR106A-5p, BTG3, and SOX9 expression were performed by Outdo Biotechnology. Detailed patient clinicopathological features are listed in Table S4. The prognostic significance of MIR106A-5p, BTG3, and SOX9 was assessed by Kaplan–Meier analysis. The X-tile Software (version 3.6.1; Rimm Lab; Yale School of Medicine) was used to define MIR106A-5p, BTG3, and SOX9 low and high expression before survival analysis.
Cell culture
The normal nasopharynx epithelial cell line NP69 and the human NPC cell lines 6–10B (low tumorigenesis and low metastasis), 5–8 F (high tumorigenesis and high metastasis), CNE-2 (low differentiation), and CNE-1 (high differentiation) were as gift from the Sun Yat-Sen University and Xiang-Ya School of Medicine, which were cultured in the Otolaryngology Laboratory, Affiliated Hospital of Nantong University. NPC cells were cultured in RPMI 1640 (Biological Industries Israel Beit-Haemek, 01–100-1ACS) containing 10% FBS (Biological Industries Israel Beit-Haemek, 04–001-1ACS), and NP69 cells were maintained in keratinocyte-SFM (Thermo Fisher Scientific, 17005–042). Cells were grown at 37°C with 5% CO2. The CNE2 cell line was recently authenticated using short tandem repeat analysis [Citation54].
Transfection and transduction with plasmids, siRNAs, lentiviral vectors, miRNA sponges, inhibitors, and mimics
All transfection experiments were performed as previously described [Citation54]. Plasmids, siRNAs, lentiviral vectors, miRNA sponges, inhibitors, and mimics, along with their respective controls, were designed and obtained from Shanghai Genechem Co.Itd. Sequences are shown in Table S5. A tandem monomeric RFP-GFP-tagged MAP1LC3 (Shanghai Genechem Co.Itd, tfLC3) was used to determine autophagic flux.
qRT-PCR
RNA isolation and qRT-PCR: qRT-PCR was performed as described previously [Citation54]. Briefly, total RNA was isolated with Trizol (Thermo Fisher Scientific, 15596018), reverse transcribed to single-strand cDNA, and amplified using primers for BTG3 and SOX9. For qRT-PCR amplification, the reaction was performed in a 20 µL reaction volume containing 10 µL SYBR Green PCR Master Mix (Roche, 04913914001) using a Real-Time PCR System (Stepone P, Applied Biosystems, Grand Island, NY). Relative mRNA expression levels were normalized to GAPDH. The sequences of primers are listed in Table S6.
miRNA isolation and qRT-PCR: miRNAs were isolated using Trizol and the miRcute Serum/Plasma miRNA isolation Kit (TIANGEN, DP501). Bulge-loopTM miRNA qRT-PCR Prime Sets (one RT primer and a pair of qPCR primers for each set) specific for MIR106A-5p and MIR106B-5p are designed by Guangzhou Ribobio. cDNA synthesized from miRNAs were amplified with primers for MIR106A-5p and MIR106B-5p. Serum levels of MIR106A-5p were normalized to cel-MIR39, whereas tissue and cell levels of MIR106A-5p and MIR106B-5p were normalized to RNU6.
Zebrafish tumor model and microinjection
Zebrafish tumor models were developed as previously described [Citation22]. Animals were housed in the Laboratory Zebrafish Center at Nantong University. For tumor cell inoculation, 300 tumor cells in 5 nL RPMI 1640 medium labeled with 2 g/mL DiI (Beyotime, C1036) were injected into the perivitelline cavity of zebrafish embryos at 48 h post-fertilization using a microinjection system (WPI, Sarasota, Florida, USA).
BALB/c nude mice animal models
To assess the role of MIR106A-5p on NPC lung metastasis in vivo, CNE-2 cells were transfected with MIR106A-5p-specific sponges or empty vector. After that, 2 × 10⁶ luciferase-labeled CNE-2 cells in 100 µL RPMI 1640 medium were injected into the tail veins of 7 to 8-week-old male nude mice (n = 3 per group). To confirm the successful injection, the photon flux from the whole body of the mice was measured using the IVIS Lumina Series III (Caliper Life Sciences, Mountain View, CA, USA) weekly. Over the course of 7 weeks, the BLI analysis of each mouse was performed to monitor for lung metastasis.
To identify the function of MIR106A-5p-suppressed autophagy in NPC lung metastasis, MIR106A-5p-knockdown CNE-2 cells were transfected with or without lentiviral ATG5 shRNA. A volume of 100 µL RPMI 1640 medium containing 2 × 10⁶ luciferase-labeled cancer cells were injected into the tail vein of nude mice (n = 3 per group). The lung metastasis was monitored with BLI analysis over the course of 7 weeks.
To corroborate the role of MIR106A-5p-BTG3 axis results in NPC lung metastasis, NPC cells treated with MIR106A-5p sponges were transduced with lentiviral BTG3-shRNA or empty vector. The resultant cells were injected into the tail veins of nude mice (n = 3 per group) at a volume of 2 × 10⁶ cancer cells. Over the course of 7 weeks, BLI was detected.
Animal xenograft tumor model analysis was performed as previously described [Citation54]. In brief, 5-week-old male BALB/c mice were obtained from the Laboratory Animal Center of Nantong University and subcutaneously injected with 1 × 10⁶ NPC cells with or without knockdown of MIR106A-5p, ATG5, or BTG3. The mice were monitored daily for changes in tumor size with sliding calipers. All the mice were sacrificed 21 d after inoculation. The primary tumors were removed, fixed in 10% formalin, embedded in paraffin, and subjected to IHC.
ISH
ISH for MIR106A-5p was performed using the LNATM microRNA ISH kit (Exiqon, YD00610154-BCG) as previously described [Citation54]. Staining intensity and abundance of positive cells were divided into four grades: 1 (negative), 2 (weakly positive), 3 (moderately positive), and 4 (strongly positive) for staining intensity and 1 (0–25%), 2 (26–50%), 3 (51–75%), and 4 (>75%) for positive cell proportion. The final staining score was defined as the product of the two scores, with scores of 0–8 defined as MIR106A-5p low expression and scores of 9–16 defined as MIR106A-5p high expression.
IF
IF assays were performed as described previously [Citation55]. Slides were incubated with primary antibodies for MAP1LC3 (Cell Signaling Technology, 14600-1-AP; 1:200) and MKI67 (Proteintech, 27309-1-AP; 1:100) and visualized using Alexa Fluor-conjugated secondary antibodies (Invitrogen, A-11008). Slides were counterstained with Hoechst (Thermo Fisher Scientific, 62249) and imaged using confocal laser scanning microscopy (Leica Microsystems, Wetzlar, Germany, TCS SP-5).
Transmission electron microscopy
Transmission electron microscopy was performed as described previously [Citation56]. Briefly, 2.5% glutaraldehyde-fixed cells were post-fixed with 1% osmic acid (Sigma-Aldrich, O5500) followed by acetone dehydration. Dehydrated pellets were embedded in araldite CY212 for sectioning, followed by staining with alcoholic uranyl acetate (Polysciences, Inc., 6159–44-0) and alkaline lead citrate (Sigma-Aldrich, 15326). Autophagic vacuoles of the ultrathin sections were examined under a transmission electron microscope (JEOL Ltd, Tokyo, Japan, JEM-1230).
Spheroid formation and LIVE/DEAD Viability assay
A total of 20,000 CNE-2 cells were plated into Corning 96-well spheroid microplates (Corning, 4515), and spheroids were examined after 7 d. Following this, cells were stained using the LIVE/DEAD® Viability/Cytotoxicity Kit following the manufacturer’s protocols (Thermo Fisher Scientific, L3224). Cells were washed with phosphate-buffered saline (PBS; Gibco, 10010023), and 100 µL of a solution comprising 10 mL of PBS with 20 µL of 2 mM EthD-1 (Thermo Fisher Scientific, L3224) and 5 µl of 4 mM calcein AM (Thermo Fisher Scientific, L3224) was added to the microplates. Cells were incubated in this solution for 30 min at room temperature and imaged using fluorescence microscopy (Zeiss, Göttingen, German, Axio Obse).
ChIP
ChIP was performed with the ChIP Assay Kits (Merck, 17–295) following the manufacturer’s protocol. Briefly, cells were crosslinked with 1% formaldehyde and sonicated to generate DNA fragments between 200 and 1000 bp. The precleared supernatant was then incubated with antibodies against EGR1 (Santa Cruz Biotechnology, sc-101033; 5 µg; polyclonal mouse), SOX9 (Abcam, ab3697; 5 µg; polyclonal rabbit), or an isotype control IgG (Millipore; 345701, 1 µg; mouse IgG). PCR was performed using primers for MIR106A-5p promoter-binding sites (EGR1: [forward] 5′-TGGGATCTTCCGCCTCCATTC-3′, [reverse] 5′-CCAGGATGAGAAGTTTAGTGTCCCA-3′; SOX9: [forward] 5′-CAGTTGGGAACTTGATCCAGACAT-3′, [reverse] 5′-ACCCCTCCTCCCAGTCCTC-3′). DNA isolated from total nuclear extract was used as the PCR input control, and PCR products were analyzed by gel electrophoresis using a 2% agarose gel.
Luciferase reporter assay
Assays were performed as described previously [Citation54]. Briefly, wild-type BTG3 (NM_001130914.1) 3′-UTR segments were PCR-amplified and inserted into the pGL3-Control vector (Promega, E1741) to generate BTG3 wild-type plasmids. Mutant 3′-UTR segments of BTG3 (BTG3 MUT1) containing mutated sequences at MIR106A-5p complementary sites were generated by performing site-directed mutation of the wild-type BTG3 plasmid.
Primers used in the cloning experiments were as follows:
Human BTG3-3′UTR-XhoI-left:
5′-CTCGAGTCTTAAAAAATATATGCACTTTAAAGCTT-3′
Human BTG3-3′UTR-HindIII-right:
5′-AAGCTTTAAAGTGCATATATTTTTTAAGACTCGAG-3′
Human BTG3-3′-MUTR-XhoI-left:
5′-CTCGAGTCTTAAAAAATATGTATTCACTAAAGCTT-3′
Human BTG3-3′-MUTR-HindIII-right:
5′-AAGCTTTAGTGAATACATATTTTTTAAGACTCGAG-3′
Western blot and IHC
Western blot and IHC were performed as described previously [Citation55]. Antibodies are listed in . For western blot analysis, 20 µg of lysate were separated on SDS-PAGE gels and transferred to PVDF membrane (Millipore, ISEQ00010). The membrane was incubated with the indicated primary antibodies. ImageJ software was used for analysis and verification that the band detection was within the linear range.
Table 1. Antibodies used for western blot and immunohistochemistry
Transwell assay
Migration assay was performed using Transwell inserts (Corning, 3422) with a pore size of 8 µm. A total of 5 × 10⁴ cells suspended in medium without serum were added in the upper chambers, and medium containing 10% fetal bovine serum was added to the lower chambers. After 16 h of incubation, the cells attached to the upper side were removed, and the cells attached to the underside of the membrane were fixed and stained with crystal violet. Digital images were obtained from the membranes, and five random fields were counted per chamber.
Statistical analysis
Statistical analysis was performed using GraphPad Prism 6 and SPSS 19.0 software. Results from at least three independent experiments are presented as the mean ± S.D. Correlation analysis was performed using Spearman’s rank correlation coefficient. Survival analysis was analyzed using Kaplan-Meier survival curves. One-way ANOVA and two-tailed Student’s t-tests were used to determine statistical significance. P-values of P < 0.05 were considered statistically significant.
Ethical approval
This study received ethics approval from the Affiliated Hospital of Nantong University (IRB number: 2018-L049).
In vivo studies were approved by the committee on the Ethics of Animal Experiments of Nantong University (RDD number: 20180227-008). All mouse experiments followed NIH Guidelines and were approved by the Administration Committee of Experimental Animals, Jiangsu Province, China (Approval ID: SYXK (SU) 2007-0021).
Supplemental Material
Download MS Word (20.4 MB)Disclosure statement
The authors have no conflicts of interest to declare with regard to this manuscript.
Supplementary material
Supplemental data for this article can be accessed here.
Additional information
Funding
References
- Chua MLK, Wee JTS, Hui EP, et al. Nasopharyngeal carcinoma. Lancet. 2016;387(10022):1012–1024.
- Croce CM. Causes and consequences of microRNA dysregulation in cancer. Nat Rev Genet. 2009;10(10):704–714.
- Suzuki HI, Katsura A, Matsuyama H, et al. MicroRNA regulons in tumor microenvironment. Oncogene. 2015;34(24):3085–3094.
- Volinia S, Calin GA, Liu CG, et al. A microRNA expression signature of human solid tumors defines cancer gene targets. Proc Natl Acad Sci U S A. 2006;103(7):2257–2261.
- Li H, Jin X, Chen B, et al. Autophagy-regulating microRNAs: potential targets for improving radiotherapy. J Cancer Res Clin Oncol. 2018;144(9):1623–1634.
- Galluzzi L, Pietrocola F, Levine B, et al. Metabolic control of autophagy. Cell. 2014;159(6):1263–1276.
- Doherty J, Baehrecke EH. Life, death and autophagy. Nat Cell Biol. 2018;20(10):1110–1117.
- Zhan L, Li J, Wei B. Autophagy therapeutics: preclinical basis and initial clinical studies. Cancer Chemother Pharmacol. 2018;82(6):923–934.
- Katheder NS, Khezri R, O’Farrell F, et al. Microenvironmental autophagy promotes tumour growth. Nature. 2017;541(7637):417–420.
- Liang XH, Jackson S, Seaman M, et al. Induction of autophagy and inhibition of tumorigenesis by beclin 1. Nature. 1999;402(6762):672–676.
- Henry WS, Laszewski T, Tsang T, et al. Aspirin suppresses growth in PI3K-Mutant breast cancer by activating AMPK and inhibiting mTORC1 signaling. Cancer Res. 2017;77(3):790–801.
- Bae SY, Byun S, Bae SH, et al. TPT1 (tumor protein, translationally-controlled 1) negatively regulates autophagy through the BECN1 interactome and an MTORC1-mediated pathway. Autophagy. 2017;13(5):820–833.
- Bishop E, Bradshaw TD. Autophagy modulation: a prudent approach in cancer treatment? Cancer Chemother Pharmacol. 2018;82(6):913–922.
- Guo W, Wang H, Yang Y, et al. Down-regulated miR-23a contributes to the metastasis of cutaneous melanoma by promoting autophagy. Theranostics. 2017;7(8):2231–2249.
- Huang L, Hu C, Cao H, et al. MicroRNA-29c increases the chemosensitivity of pancreatic cancer cells by inhibiting USP22 mediated autophagy. Cell Physiol Biochem. 2018;47(2):747–758.
- Hu JL, He GY, Lan XL, et al. Inhibition of ATG12-mediated autophagy by miR-214 enhances radiosensitivity in colorectal cancer. Oncogenesis. 2018;7(2):16.
- Wu H, Liu C, Yang Q, et al. MIR145-3p promotes autophagy and enhances bortezomib sensitivity in multiple myeloma by targeting HDAC4. Autophagy. 2019;16(4):683–697.
- Li X, Zhu Y, Zhang H, et al. MicroRNA-106a-5p inhibited c2c12 myogenesis via targeting PIK3R1 and modulating the PI3K/AKT signaling. Genes (Basel). 2018;9:7.
- Yang G, Zhang R, Chen X, et al. MiR-106a inhibits glioma cell growth by targeting E2F1 independent of p53 status. J Mol Med (Berl). 2011;89(10):1037–1050.
- Xia X, Lu H, Li C, et al. miR-106b regulates the proliferation and differentiation of neural stem/progenitor cells through Tp53inp1-Tp53-Cdkn1a axis. Stem Cell Res Ther. 2019;10(1):282.
- Lee SL, Rouhi P, Dahl Jensen L, et al. Hypoxia-induced pathological angiogenesis mediates tumor cell dissemination, invasion, and metastasis in a zebrafish tumor model. Proc Natl Acad Sci U S A. 2009;106(46):19485–19490.
- Shan Y, You B, Shi S, et al. Hypoxia-induced matrix metalloproteinase-13 expression in exosomes from nasopharyngeal carcinoma enhances metastases. Cell Death Dis. 2018;9(3):382.
- Gou WF, Yang XF, Shen DF, et al. The roles of BTG3 expression in gastric cancer: a potential marker for carcinogenesis and a target molecule for gene therapy. Oncotarget. 2015;6(23):19841–19867.
- Schmelzle T, Hall MN. TOR, a central controller of cell growth. Cell. 2000;103(2):253–262.
- Tan G, Tang X, Tang F. The role of microRNAs in nasopharyngeal carcinoma. Tumour Biol. 2015;36(1):69–79.
- Luo B, Kang N, Chen Y, et al. Oncogene miR-106a promotes proliferation and metastasis of prostate cancer cells by directly targeting PTEN in vivo and in vitro. Minerva Med. 2018;109(1):24–30.
- Wang Z, Wang B, Shi Y, et al. Oncogenic miR-20a and miR-106a enhance the invasiveness of human glioma stem cells by directly targeting TIMP-2. Oncogene. 2015;34(11):1407–1419.
- Mendell JT. miRiad roles for the miR-17-92 cluster in development and disease. Cell. 2008;133(2):217–222.
- Chen C, Lu Z, Yang J, et al. MiR-17-5p promotes cancer cell proliferation and tumorigenesis in nasopharyngeal carcinoma by targeting p21. Cancer Med. 2016;5(12):3489–3499.
- Hu Z, Zhou S, Luo H, et al. miRNA-17 promotes nasopharyngeal carcinoma radioresistance by targeting PTEN/AKT. Int J Clin Exp Pathol. 2019;12(1):229–240.
- Deng P, Wu Y. Knockdown of miR-106a suppresses migration and invasion and enhances radiosensitivity of hepatocellular carcinoma cells by upregulating FBXW7. Int J Clin Exp Pathol. 2019;12(4):1184–1193.
- Liu J, Huang Y, Wang H, et al. MiR-106a-5p promotes 5-FU resistance and the metastasis of colorectal cancer by targeting TGFbetaR2. Int J Clin Exp Pathol. 2018;11(12):5622–5634.
- Chao H, Zhang M, Hou H, et al. HOTAIRM1 suppresses cell proliferation and invasion in ovarian cancer through facilitating ARHGAP24 expression by sponging miR-106a-5p. Life Sci. 2020;243:117296.
- Yang H, Ni HM, Ding WX. The double-edged sword of MTOR in autophagy deficiency induced-liver injury and tumorigenesis. Autophagy. 2019;15(9):1671–1673.
- Lin DC, Meng X, Hazawa M, et al. The genomic landscape of nasopharyngeal carcinoma. Nat Genet. 2014;46(8):866–871.
- Yang Q, Zhang MX, Zou X, et al. A prognostic bio-model based on SQSTM1 and N-stage identifies nasopharyngeal carcinoma patients at high risk of metastasis for additional induction chemotherapy. Clin Cancer Res. 2018;24(3):648–658.
- Zhu JF, Huang W, Yi HM, et al. Annexin A1-suppressed autophagy promotes nasopharyngeal carcinoma cell invasion and metastasis by PI3K/AKT signaling activation. Cell Death Dis. 2018;9(12):1154.
- Mo N, Lu YK, Xie WM, et al. Inhibition of autophagy enhances the radiosensitivity of nasopharyngeal carcinoma by reducing Rad51 expression. Oncol Rep. 2014;32(5):1905–1912.
- Lin YT, Wang HC, Hsu YC, et al. Capsaicin induces autophagy and apoptosis in human nasopharyngeal carcinoma cells by downregulating the PI3K/AKT/mTOR Pathway. Int J Mol Sci. 2017;18:7.
- Ai J, Li W, Zeng R, et al. Blockage of SSRP1/Ets-1/Pim-3 signalling enhances chemosensitivity of nasopharyngeal carcinoma to docetaxel in vitro. Biomed Pharmacother. 2016;83:1022–1031.
- Lin YT, Wang HC, Chuang HC, et al. Pre-treatment with angiotensin-(1-7) inhibits tumor growth via autophagy by downregulating PI3K/Akt/mTOR signaling in human nasopharyngeal carcinoma xenografts. J Mol Med (Berl). 2018;96(12):1407–1418.
- Cheng JZ, Chen JJ, Wang ZG, et al. MicroRNA-185 inhibits cell proliferation while promoting apoptosis and autophagy through negative regulation of TGF-beta1/mTOR axis and HOXC6 in nasopharyngeal carcinoma. Cancer Biomark. 2018;23(1):107–123.
- Hai B, Ma Y, Pan X, et al. Melatonin benefits to the growth of human annulus fibrosus cells through inhibiting miR-106a-5p/ATG7 signaling pathway. Clin Interv Aging. 2019;14:621–630.
- Chen K, Pan G. Dysregulation of microRNA-106a-5p-RUNX1 axis associates with clinical progression and prognosis of osteosarcoma patients. Pathol Res Pract. 2019;215(12):152686.
- Hao H, Xia G, Wang C, et al. miR-106a suppresses tumor cells death in colorectal cancer through targeting ATG7. Med Mol Morphol. 2017;50(2):76–85.
- Wang X, Blagden C, Fan J, et al. Runx1 prevents wasting, myofibrillar disorganization, and autophagy of skeletal muscle. Genes Dev. 2005;19(14):1715–1722.
- Chen X, Chen G, Cao X, et al. Downregulation of BTG3 in non-small cell lung cancer. Biochem Biophys Res Commun. 2013;437(1):173–178.
- Levy JMM, Towers CG, Thorburn A. Targeting autophagy in cancer. Nat Rev Cancer. 2017;17(9):528–542.
- Luo LH, Jin M, Wang LQ, et al. Long noncoding RNA TCL6 binds to miR-106a-5p to regulate hepatocellular carcinoma cells through PI3K/AKT signaling pathway. J Cell Physiol. 2020;235:6154–6166.
- Zhang X, Liu X, Ni X, et al. Long non-coding RNA H19 modulates proliferation and apoptosis in osteoarthritis via regulating miR-106a-5p. J Biosci. 2019;44:6.
- Wang LW, Li XB, Liu Z, et al. Long non-coding RNA OIP5-AS1 promotes proliferation of gastric cancer cells by targeting miR-641. Eur Rev Med Pharmacol Sci. 2019;23(24):10776–10784.
- Cong J, Wang C, Pu D, et al. Expression of early growth response 1 affects miR-106a/signal transducer and activator of transcription 3 regulating cognitive impairment in ovariectomized mice. Menopause. 2014;21(10):1143–1150.
- Jiang Y, Jiang YY, Xie JJ, et al. Co-activation of super-enhancer-driven CCAT1 by TP63 and SOX2 promotes squamous cancer progression. Nat Commun. 2018;9(1):3619.
- Bao L, You B, Shi S, et al. Metastasis-associated miR-23a from nasopharyngeal carcinoma-derived exosomes mediates angiogenesis by repressing a novel target gene TSGA10. Oncogene. 2018;37(21):2873–2889.
- You B, Shan Y, Shi S, et al. Effects of ADAM10 upregulation on progression, migration, and prognosis of nasopharyngeal carcinoma. Cancer Sci. 2015;106(11):1506–1514.
- Sun Y, Huang YH, Huang FY, et al. 3ʹ-epi-12beta-hydroxyfroside, a new cardenolide, induces cytoprotective autophagy via blocking the Hsp90/Akt/mTOR axis in lung cancer cells. Theranostics. 2018;8(7):2044–2060.