
ABSTRACT
Recently, we identified a novel mechanism of lipotoxicity in the kidney proximal tubular cells (PTECs); lipid overload stimulates macroautophagy/autophagy for the renovation of plasma and organelle membranes to maintain the integrity of the PTECs. However, this autophagic activation places a burden on the lysosomal system, leading to a downstream suppression of autophagy, which manifests as phospholipid accumulation and inadequate acidification in lysosomes. Here, we investigated whether pharmacological correction by eicosapentaenoic acid (EPA) supplementation could restore autophagic flux and alleviate renal lipotoxicity. EPA supplementation to high-fat diet (HFD)-fed mice reduced several hallmarks of lipotoxicity in the PTECs, such as phospholipid accumulation in the lysosome, mitochondrial dysfunction, inflammation, and fibrosis. In addition to improving the metabolic syndrome, EPA alleviated renal lipotoxicity via several mechanisms. EPA supplementation to HFD-fed mice or the isolated PTECs cultured in palmitic acid (PA) restored lysosomal function with significant improvements in the autophagic flux. The PA-induced redistribution of phospholipids from cellular membranes into lysosomes and the HFD-induced accumulation of SQSTM1/p62 (sequestosome 1), an autophagy substrate, during the temporal and genetic ablation of autophagy were significantly reduced by EPA, indicating that EPA attenuated the HFD-mediated increases in autophagy demand. Moreover, a fatty acid pulse-chase assay revealed that EPA promoted lipid droplet (LD) formation and transfer from LDs to the mitochondria for beta-oxidation. Noteworthy, the efficacy of EPA on lipotoxicity is autophagy-dependent and cell-intrinsic. In conclusion, EPA counteracts lipotoxicity in the proximal tubule by alleviating autophagic numbness, making it potentially suitable as a novel treatment for obesity-related kidney diseases.
Abbreviations: 4-HNE: 4-hydroxy-2-nonenal; ACTB: actin beta; ADGRE1/F4/80: adhesion G protein-coupled receptor E1; ATG: autophagy-related; ATP: adenosine triphosphate; BODIPY: boron-dipyrromethene; BSA: bovine serum albumin; cKO: conditional knockout; CML: N-carboxymethyllysine; COL1A1: collagen type I alpha 1 chain; COX: cytochrome c oxidase; CTRL: control; DGAT: diacylglycerol O-acyltransferase; EPA: eicosapentaenoic acid; FA: fatty acid; FFA: free fatty acid; GFP: green fluorescent protein; HFD: high-fat diet; iKO: inducible knockout; IRI: ischemia-reperfusion injury; LAMP1: lysosomal-associated membrane protein 1; LD: lipid droplet; LRP2: low density lipoprotein receptor-related protein 2; MAP1LC3: microtubule-associated protein 1 light chain 3; MTORC1: mechanistic target of rapamycin kinase complex 1; OA: oleic acid; PAS: periodic-acid Schiff; PPAR: peroxisome proliferator activated receptor; PPARGC1/PGC1: peroxisome proliferator activated receptor, gamma, coactivator 1; PTEC: proximal tubular epithelial cell; ROS: reactive oxygen species; RPS6: ribosomal protein S6; SDH: succinate dehydrogenase complex; SFC/MS/MS: supercritical fluid chromatography triple quadrupole mass spectrometry; SQSTM1/p62: sequestosome 1; TFEB: transcription factor EB; TG: triglyceride; TUNEL: terminal deoxynucleotidyl transferase dUTP nick end labeling.
Introduction
Macroautophagy (hereafter autophagy) is a highly conserved degradation system that regulates intracellular homeostasis [Citation1–3]. Cytoplasmic components, such as organelles and proteins, are sequestered into a double-membrane cytosolic vesicle called an autophagosome. Then, the autophagosome fuses with a lysosome, resulting in the degradation of the sequestered materials. Since the beginning of autophagy studies in 1957, autophagic vacuoles have frequently been observed in the proximal tubules of the kidneys [Citation4]. Subsequently, 60 years later, the essential roles of autophagy in maintaining the function of the proximal tubular epithelial cells (PTECs) have been elucidated using the PTEC-specific autophagy-deficient mice in both physiological and pathological settings [Citation5–9].
PTECs consistently uptake free fatty acids (FAs) from circulation and the glomerular filtrate and utilize them for ATP synthesis through beta-oxidation. Regardless, studies regarding lipid metabolism in the kidneys have been insufficient. We have recently found that the stagnation of autophagy is a novel mechanism of lipotoxicity in PTECs; 1) during a lipid overload, phospholipids redistribute from the plasma and organelle membranes into lysosomes for degradation by autophagy; 2) a long-term lipid overload places a burden on the lysosomal system associated with a phospholipid accumulation and inadequate acidification; 3) a lysosomal dysfunction, in turn, stagnates the autophagic activity; and 4) a genetic autophagy ablation makes lipotoxicity apparent, which manifests as mitochondrial dysfunction, an inflammasome activation, and fibrosis in the kidneys [Citation10].
The pharmacological modulation of autophagy is a promising method for reducing lipotoxicity in kidneys. However, simple autophagy activation may lead to increased lysosomal stress, resulting in increased phospholipid accumulation. Alternatively, autophagy inhibition can phenocopy the autophagy-deficient mice, leading to the maximization of lipotoxicity. Thus, pharmacological correction of phospholipid accumulation that restores the autophagic flux may be a novel therapeutic method.
Omega-3 FAs are polyunsaturated and have a double bond at the third carbon atom from the end of the carbon chain. Among them, eicosapentaenoic acid (EPA) lowers triglyceride (TG) levels without raising the low-density lipoprotein cholesterol levels [Citation11]. Previous studies have indicated that EPA exerts pleiotropic biological actions, including anti-inflammatory processes [Citation12], anticancer action [Citation13], and cardiovascular protection [Citation14]. EPA also has a direct physiochemical effect on the membrane lipid organization, wherein it can be incorporated into the phospholipid bilayer of cell membranes [Citation15] and increase the membrane fluidity by modulating the lipid composition [Citation16,Citation17]. However, other studies have shown that EPA intercalates into the hydrocarbon core region of the membrane lipid bilayer, where EPA may interfere with the propagation of free radicals without inducing any significant changes in membrane fluidity [Citation15,Citation18]. In addition, EPA may influence the membrane protein-mediated responses, lipid-mediator generation, cell signaling, and gene expression in many different cell types [Citation19]. Several studies have shown that EPA induces an autophagic activation in many cell types [Citation20–22]; however, many of these studies do not provide in-depth insights into the mechanisms of EPA-induced autophagy activation. Based on this information, in the present study, we investigated whether EPA supplementation alleviated renal lipotoxicity, particularly by modulating autophagy.
Results
EPA reduces a high-fat diet (HFD)-induced phospholipid accumulation in the PTEC lysosomes
To investigate the therapeutic efficacy of EPA against an HFD-induced phospholipid accumulation, eight-week-old PTEC-specific atg5-deficient (Atg5 F/F; Kap-Cre [kidney androgen regulated protein]), hereafter, referred to as the atg5-conditional knockout mice, atg5-cKO and Atg5 F/F control (referred to as Atg5 F/F-CTRL) mice were fed with a normal diet (ND), an HFD, or an HFD with EPA for two months, referred to as the nonobese, obese, and EPA-supplemented obese mice, respectively. The HFD-induced formation of cytosolic vacuoles in the PTECs of control mice, most of which were margined with LAMP1 (lysosomal associated membrane protein 1) and positively stained with toluidine blue and Nile red, which can detect not only lipid droplets (LDs) but also phospholipids, was analyzed [Citation23] (). The majority of the Nile red-positive lipids were merged with LAMP1 (Fig. S1A), while the vacuolar contents were stained with Luxol fast blue, which is generally used to identify the myelin-containing phospholipids (Fig. S1B). Together, these data suggest that the vacuoles are lysosomes that contain phospholipids. The number and size of these enlarged lysosomes and phospholipid accumulation were significantly decreased by EPA ().
Figure 1. EPA reduces an HFD-induced phospholipid accumulation in the PTEC lysosomes. (A, B) Images of PAS staining, LAMP1 immunostaining, toluidine blue staining, and Nile red staining of the kidney cortical regions of the nonobese, obese, and EPA-supplemented obese mice (n = 6 to 7 in each group). Sections were immunostained for LRP2, a marker of proximal tubules (blue) (A, middle) and counterstained with DAPI (blue) (B). (C) The number (per proximal tubule) and the sizes (per area [mm2]) of Nile red-positive puncta under each condition was counted in at least 10 high-power fields (× 600) (each high-power field contains 10 to15 proximal tubules) (n = 3 in each group). (D-I, K-P) Electron micrographs of the kidneys of the obese and the EPA-supplemented obese Atg5 F/F-CTRL (D-I) and atg5-cKO mice (K-P) (n = 3 in each group). (J) Images of PAS-stained kidney cortical regions of the nonobese, obese, and EPA-supplemented obese atg5-cKO mice (n = 6 to 7 in each group). Bars: 50 μm (A, B, J), 5 μm (D, E, G, H, K, L, N, O), and 500 nm (F, I, M, P). Values represent means ± SE. Statistically significant differences (*P < 0.05) are indicated. All images are representative of multiple experiments. BM, basement membrane; L, lysosomes; TL, tubular lumen; M, mitochondria; arrows, autophagosomes, *, nucleus. Magnified images of lysosomes or mitochondria are presented. CTRL: Atg5 F/F-CTRL mice; cKO: atg5-cKO mice
![Figure 1. EPA reduces an HFD-induced phospholipid accumulation in the PTEC lysosomes. (A, B) Images of PAS staining, LAMP1 immunostaining, toluidine blue staining, and Nile red staining of the kidney cortical regions of the nonobese, obese, and EPA-supplemented obese mice (n = 6 to 7 in each group). Sections were immunostained for LRP2, a marker of proximal tubules (blue) (A, middle) and counterstained with DAPI (blue) (B). (C) The number (per proximal tubule) and the sizes (per area [mm2]) of Nile red-positive puncta under each condition was counted in at least 10 high-power fields (× 600) (each high-power field contains 10 to15 proximal tubules) (n = 3 in each group). (D-I, K-P) Electron micrographs of the kidneys of the obese and the EPA-supplemented obese Atg5 F/F-CTRL (D-I) and atg5-cKO mice (K-P) (n = 3 in each group). (J) Images of PAS-stained kidney cortical regions of the nonobese, obese, and EPA-supplemented obese atg5-cKO mice (n = 6 to 7 in each group). Bars: 50 μm (A, B, J), 5 μm (D, E, G, H, K, L, N, O), and 500 nm (F, I, M, P). Values represent means ± SE. Statistically significant differences (*P < 0.05) are indicated. All images are representative of multiple experiments. BM, basement membrane; L, lysosomes; TL, tubular lumen; M, mitochondria; arrows, autophagosomes, *, nucleus. Magnified images of lysosomes or mitochondria are presented. CTRL: Atg5 F/F-CTRL mice; cKO: atg5-cKO mice](/cms/asset/4c22472d-56e8-48c4-ad7d-b4be33152509/kaup_a_1782034_f0001_oc.jpg)
Electron microscopy revealed that the HFD-induced increases in lamellar structures in the lysosomes, which correspond to accumulated phospholipids, that decreased in the EPA-supplemented obese control mice, while the number of autophagic vacuoles (autophagosomes or autolysosomes) increased (). These findings were confirmed by an increase in the GFP-positive puncta, which represent autophagosomes, in GFP-MAP1LC3 (microtubule-associated protein 1 light chain 3) transgenic mice (Fig. S1 C). Both the obese and the EPA-supplemented obese atg5-cKO mice showed a high accumulation of cytosolic amorphous substrates compared to those exhibited by the nonobese atg5-cKO mice, while an HFD-induced vacuolar formation was rarely observed in the atg5-cKO mice (). In contrast, high levels of aggregation of fragmented and swollen mitochondria with derangement of the cristae were observed in both the obese and the EPA-supplemented obese atg5-cKO mice (), suggesting that the effect of EPA was autophagy-dependent.
EPA improves the HFD-induced mitochondrial dysfunction, inflammation, and fibrosis
We next evaluated whether EPA alleviated the HFD-induced mitochondrial dysfunction, inflammation, and fibrosis in kidneys. EPA supplementation restored the HFD-induced reduction in the mitochondrial respiration activity, as assessed by COX (cytochrome c oxidase) and SDH (succinate dehydrogenase) staining, in the obese mice (). A more prominent decline in both staining types was observed in the obese atg5-cKO mice, which was incompletely prevented by EPA. Similarly, EPA attenuated an HFD-induced increase in the oxidative stress, as assessed by staining for 4-hydroxy-2-nonenal (HNE) and N-carboxymethyllysine (CML) in the kidneys of the obese control mice, which was abrogated in the obese atg5-cKO mice (Fig. S2A). EPA also significantly decreased the HFD-induced ADGRE1/F4/80-positive macrophage infiltration and increased expression of IL1B in the macrophages of the obese mice, but the decrease was not observed in the obese atg5-cKO mice (Fig. S2B and S2 C). Furthermore, to investigate the long-term consequences of EPA supplementation, we monitored these mice for up to 10 months. In the Atg5 F/F-CTRL mice, EPA attenuated the HFD-induced tubular injuries, such as brush border loss, tubular dilatation, and cast formation, and interstitial fibrosis, although cytosolic vacuolar formation in the PTECs increased compared with the younger EPA-supplemented obese Atg5 F/F-CTRL mice (Fig. S3A-C). However, these effects of EPA were not observed in the obese atg5-cKO mice kidneys. These data suggest that EPA counteracts lipotoxicity at least partly through the modulation of autophagy.
Figure 2. EPA improves the HFD/PA-induced mitochondrial dysfunction in PTECs. (A, B) Images of COX (A) and SDH (B) staining in the kidney cortical regions of the nonobese, obese, and EPA-supplemented obese Atg5 F/F-CTRL and atg5-cKO mice (n = 3 in each group). (C, D) The mitochondrial membrane potential (C) and ROS (D) of the autophagy-competent and autophagy-deficient PTECs treated with each treatment (0.25% BSA, 0.25 mM PA, 0.125 mM OA, 0.05 mM EPA, PA plus OA, and PA plus EPA) for 12 h were assessed by TRME- (n = 4 to 6) and MitoSOX Red-staining (n = 9 to 11), respectively. Quantitative data of relative intensity were also provided. (C, D) Values are normalized against the signal intensity of BSA-treated autophagy-competent PTECs. (E) Cell survival of the autophagy-competent and autophagy-deficient PTECs incubated with the indicated concentrations of BSA, PA, OA, EPA, PA plus OA, or PA plus EPA for 12 h (n = 8). (F) Representative images of western blot analysis for cleaved CASP3 [Asp175] (n = 3). Bars: 100 μm (A, B) and 10 μm (C, D). Data are provided as means ± SE. Statistically significant differences. *P < 0.05 (C, D); *P < 0.05 vs. autophagy-competent cells of corresponding treatment; #P < 0.05 vs. BSA-treated control cells; †P < 0.05 vs. PA-treated control cells (E) are indicated. All images are representative of multiple experiments. Atg5+: autophagy-competent PTEC; atg5−/−: autophagy-deficient PTEC. CTRL: Atg5 F/F-CTRL mice; cKO: atg5-cKO mice
![Figure 2. EPA improves the HFD/PA-induced mitochondrial dysfunction in PTECs. (A, B) Images of COX (A) and SDH (B) staining in the kidney cortical regions of the nonobese, obese, and EPA-supplemented obese Atg5 F/F-CTRL and atg5-cKO mice (n = 3 in each group). (C, D) The mitochondrial membrane potential (C) and ROS (D) of the autophagy-competent and autophagy-deficient PTECs treated with each treatment (0.25% BSA, 0.25 mM PA, 0.125 mM OA, 0.05 mM EPA, PA plus OA, and PA plus EPA) for 12 h were assessed by TRME- (n = 4 to 6) and MitoSOX Red-staining (n = 9 to 11), respectively. Quantitative data of relative intensity were also provided. (C, D) Values are normalized against the signal intensity of BSA-treated autophagy-competent PTECs. (E) Cell survival of the autophagy-competent and autophagy-deficient PTECs incubated with the indicated concentrations of BSA, PA, OA, EPA, PA plus OA, or PA plus EPA for 12 h (n = 8). (F) Representative images of western blot analysis for cleaved CASP3 [Asp175] (n = 3). Bars: 100 μm (A, B) and 10 μm (C, D). Data are provided as means ± SE. Statistically significant differences. *P < 0.05 (C, D); *P < 0.05 vs. autophagy-competent cells of corresponding treatment; #P < 0.05 vs. BSA-treated control cells; †P < 0.05 vs. PA-treated control cells (E) are indicated. All images are representative of multiple experiments. Atg5+: autophagy-competent PTEC; atg5−/−: autophagy-deficient PTEC. CTRL: Atg5 F/F-CTRL mice; cKO: atg5-cKO mice](/cms/asset/c8956a16-82d5-4b78-b9e5-c1c466475226/kaup_a_1782034_f0002_oc.jpg)
We next investigated the mechanisms of the effects of EPA on the saturated palmitic acid (PA)-induced cellular damage and the role of autophagy using cultured autophagy-deficient or autophagy-competent PTECs. We also compared the effects of a monounsaturated oleic acid (OA), which has been found to attenuate a PA-induced lipotoxicity [Citation24]. The reduction in the mitochondrial membrane potential assessed by tetramethylrhodamine ethyl ester (TMRE) staining, the production of the mitochondrial reactive oxygen species (ROS) assessed by the MitoSOX Red staining, and the reduction in cell survival assessed with a 3-(4, 5-dimethylthiazol-2-yl)-5 (3-carboxymethonyphenol)-2-(4-sulfophenyl)-2 H-tetrazolium (MTS) assay and western blot analysis for cleaved CASP3/caspase-3 (Asp175) were observed in the PA-treated autophagy-competent PTECs, all of which were alleviated by a co-incubation with OA or EPA (). However, these effects of OA or EPA tended to decrease in the autophagy-deficient PTECs, suggesting that the effects of EPA against lipotoxicity may have been autophagy-dependent and cell-intrinsic.
Mechanisms for the therapeutic efficacy of EPA: improving the metabolic syndrome
Metabolic profiles under fed and starved conditions in mice fed with an ND, an HFD, or an HFD with EPA for two months from 8 weeks of age have been shown in . EPA supplementation reduced the body weight, plasma levels of cholesterol, TGs, and phospholipids with no change in food intake, blood glucose, and plasma levels of non-esterified FAs and insulin under fed conditions.
Table 1. Metabolic profiles of the nonobese, obese, and EPA-supplemented obese mice
Mechanism for therapeutic efficacy of EPA: alleviation of the HFD/PA-induced lysosomal dysfunction and impairment in autophagic flux
To examine whether EPA directly attenuated the PA-induced lysosomal dysfunction in PTECs in vitro, we added EPA or OA to the PA-treated PTECs stably expressing GFP-MAP1LC3. In the PA-treated PTECs, we observed the increased size and number of the LysoTracker Red-positive dots compared with BSA-, OA-, and EPA-treated controls, and most of the enlarged lysosomes were colocalized with GFP, which indicated inadequate acidification as GFP should be degraded in acidic environments (). Co-incubation of OA or EPA tended to decrease this colocalization. We next utilized the LysoSensor Yellow/Blue reagent to directly evaluate lysosomal acidification. PA treatment significantly increased the blue:yellow ratio in the acidic vesicular organelles, whereas co-incubation of OA or EPA decreased the blue:yellow ratio, indicating that OA or EPA improved the PA-induced inadequate lysosomal acidification ().
Figure 3. EPA alleviates the HFD/PA-induced lysosomal dysfunction and impairment in autophagic flux. (A) PTECs stably expressing GFP-MAP1LC3 were stained with LysoTracker Red, and counterstained with DAPI (blue) after each treatment (0.25% BSA, 0.25 mM PA, 0.125 mM OA, 0.05 mM EPA, PA plus OA, or PA plus EPA) for 12 h (n = 5). The number of GFP- or the LysoTracker-positive or double-positive dots was counted (right). (B) PTECs were stained with the pH indicator LysoSensor Yellow/Blue after each treatment for 12 h (n = 5). The blue/yellow ratio is presented (right). (A, B) Bars: 10 μm. (C) Autophagic flux in the PTECs treated with each treatment for 6 h was assessed by the conversion from MAP1LC3-I to MAP1LC3-II after bafilomycin A1 treatment (n = 3, respectively). The levels of MAP1LC3-II and autophagic flux index (defined as the proportion of the levels of MAP1LC3-II in the presence of bafilomycin A1 to the levels of MAP1LC3-II in the absence of bafilomycin A1) are shown. Data are provided as means ± SE. Statistically significant differences (*P < 0.05 vs. PA treated cells (A, B); * P < 0.05 (C) are indicated. All images are representative of multiple experiments
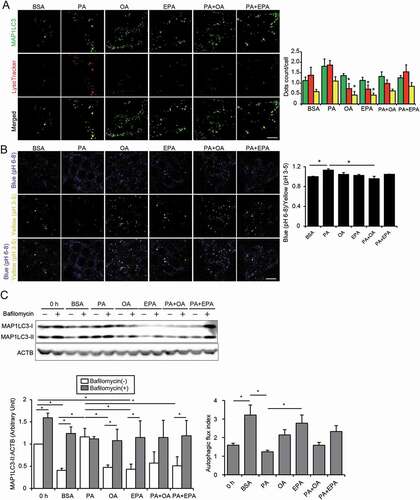
We next investigated the effects of OA or EPA treatment on the PA-induced stagnation of autophagy in the cultured PTECs. Treatment with BSA, OA, or EPA exhibited a substantial increase in LC3-II in the presence of bafilomycin A1, a specific inhibitor of the vacuolar-type H+-translocating ATPase (V-ATPase), indicating their high autophagic flux at a basal state (). In contrast, PA treatment strongly increased the conversion of LC3-I to LC3-II with no additional increase in LC3-II observed in the presence of bafilomycin A1. Notably, co-incubation with OA or EPA efficiently alleviated the PA-induced stagnation of autophagic flux, as demonstrated by the observation that LC3-II increased in the presence of bafilomycin A1.
To determine the possible cellular mechanisms of the EPA-mediated improvement in autophagic flux in PTECs under fed and starved conditions, we investigated the two key signaling pathways that modulate autophagy: MTORC1 (mechanistic target of rapamycin kinase complex 1) and TFEB (transcription factor EB). Immunohistochemical staining for the p-RPS6 (phosphorylated ribosomal protein S6) downstream of MTORC1 in the kidney samples revealed that the MTORC1 signal was hyperactivated and persisted even after 24 h of starvation in the PTECs of the obese mice (Fig. S4A). Immunohistochemical staining for TFEB, a master regulator of lysosomal biogenesis and autophagy [Citation25], revealed that a starvation-induced cytoplasm-to-nucleus translocation of TFEB was blunted in the PTECs of the obese mice (Fig. S4B). EPA supplementation suppressed the MTORC1 pathway and resurged the translocation of TFEB in 24-h starved obese mice, which may contribute to the restoration of autophagic flux (Fig. S4A and S4B).
Mechanism for the therapeutic efficacy of EPA: reduction in autophagy demand
PA promotes phospholipid redistribution into the lysosomes for autophagic degradation in PTECs [Citation10]. To investigate whether OA or EPA modulated this redistribution, the cultured PTECs were initially labeled with trace amounts of phosphatidylcholine fluorescent-tagged at its FA tail (FL HPC) for 16 h and chased in the PA-treated PTECs with or without OA or EPA (). In the PA-treated PTECs, the FL HPC signal on membranes decreased, and the colocalization of FL HPC with the LysoTracker Red significantly increased, while co-incubation with OA or EPA preserved the FL HPC signal on the cellular membranes, and the number and size of FL HPC- and the LysoTracker Red-merged dots significantly decreased ().
Figure 4. EPA alleviates the HFD/PA-induced increase in the autophagy demand. (A, B) A fluorescent FA pulse-chase assay was performed to investigate whether EPA modulated the PA-induced phospholipid redistribution into the lysosomes for autophagic degradation in PTECs. (A) Schematic illustration of a pulse-chase assay. (B) FL-HPC-loaded PTECs were chased after each treatment (0.25% BSA, 0.25 mM PA, 0.125 mM OA, 0.05 mM EPA, PA plus OA, or PA plus EPA) for 6 h (n = 4 to 5), and the subcellular localization of FL-HPC was determined by staining with the LysoTracker Red. To determine phospholipid accumulation in the lysosomes, the number and size of the merged dots were counted (right). (C) Kidney cortical regions of the nonobese, obese, and EPA-supplemented obese mice (Atg5 F/F-CTRL and atg5-iKO) were immunostained for SQSTM1 and ubiquitin after treatment with vehicle or tamoxifen 3 weeks before euthanasia (n = 4 to 5 in each group). Magnified images from the tamoxifen-treated atg5-iKO mice are also presented. The number of SQSTM1- or ubiquitin-positive dots was counted in at least 10 high-power fields (× 400). Bars: 10 μm (B, C). Data are provided as means ± SE. Statistically significant differences (*P < 0.05) are indicated. All images are representative of multiple experiments. CTRL: Atg5 F/F-CTRL mice; iKO: atg5-iKO mice
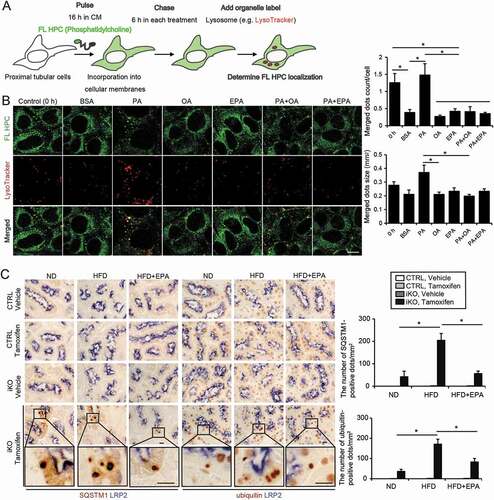
As this observation suggested that OA or EPA may have reduced the PA-induced demand on autophagy, we evaluated the EPA-mediated changes in autophagy demand using the tamoxifen-inducible PTEC-specific autophagy-deficient mice (Atg5 F/F; Ndrg1-Cre [N-myc downstream regulated gene 1], hereafter referred to as atg5-inducible knockout mice, atg5-iKO). Eight-week-old (Atg5 F/F-CTRL and atg5-iKO) mice were fed with an ND, an HFD, or an HFD supplemented with EPA for two months. Three weeks before euthanasia, mice received tamoxifen to induce the genetic ablation of Atg5. The accumulation of SQSTM1 and ubiquitin represents the amount of substrate requiring degradation during the three-week period. The three-week ablation of autophagy triggered the increased the accumulation of SQSTM1- and ubiquitin-positive protein aggregates in the obese atg5-iKO mice, but these decreased in the EPA-supplemented obese atg5-iKO mice, indicating that EPA supplementation attenuated the HFD-mediated increase in an autophagy demand ( and S5).
Mechanism for the therapeutic efficacy of EPA: increase in LD formation by supplementation with FAs from cellular membranes
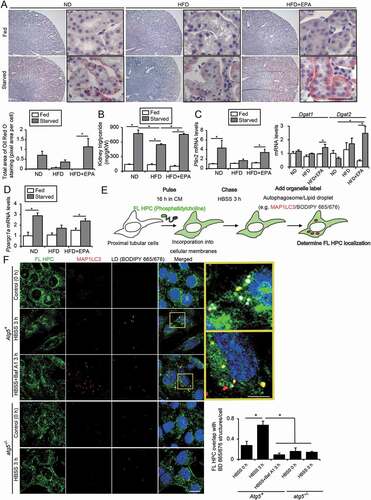
During starvation, plasma levels of the adipose-derived FAs increase, intracellular LDs are formed by FA uptake and hydrolyzed for use in PTECs. Additionally, 24 h of starvation induces LD formation, while an additional 24 h of starvation leads to a decrease in the number and size of LDs in PTECs [Citation26]. We investigated the effects of EPA on the formation of LDs in the PTECs of obese mice under fed and starved conditions. Under fed conditions, there were very few Oil Red O-positive LDs in the PTECs of nonobese, obese, and EPA-supplemented obese mice. Additionally, 24 h of starvation led to LD formation in the nonobese mice, which was blunted in obese mice (). Notably, EPA restored the starvation-induced LD formation and energy metabolism in the obese mice, as assessed by an Oil-red O staining, kidney TG content, and the mRNA levels corresponding to the genes encoding the LD-associated proteins PLIN2/Adrp (perilipin 2), DGAT1 (diacylglycerol O-acyltransferase 1), and DGAT2, the enzymes that catalyze the final reaction in the synthesis of TG from diacylglycerol [Citation27], and PPARGC1A/PGC1A (peroxisome proliferator activated receptor gamma, coactivator 1 alpha) ().
Figure 5. EPA increases LD formation by supplementation with FAs from cellular membranes during starvation. (A-D) Images and quantification of Oil Red O-staining, TGs level per g kidney weight (gKW), and the mRNA levels of Plin2, Dgat1, Dgat2, and Ppargc1a in the kidney cortical regions of the nonobese, obese, and EPA-supplemented obese mice that were either fed or subjected to 24 h of starvation (n = 4 to 7 in each group). (A) Counterstaining was performed with hematoxylin. (E, F) To investigate whether starvation-induced autophagy contributed to the production and delivery of FAs to LD stores, a fluorescent FA pulse-chase assay was performed. (E) Schematic illustration of an FA pulse-chase assay. (F) FL-HPC-loaded autophagy-competent, and autophagy-deficient PTECs were chased after treatment with Hank’s balanced salt solution for 3 h, and the subcellular localization of FL-HPC was determined. LDs were labeled with BODIPY 665/676 (white). Autophagosomes were immunostained with MAP1LC3 (red) and counterstained with DAPI (blue) (n = 5 in each group). To determine phospholipid redistribution in LDs, the number of the FL-HPC and BODIPY 665/676-merged dots were counted. Bars: 50 μm (A) and 10 μm (F). Data are provided as means ± SE. Statistically significant differences (*P < 0.05) are indicated. All images are representative of multiple experiments. Atg5+: autophagy-competent PTEC; atg5−/−: autophagy-deficient PTEC
Next, we investigated the LD-forming effect of the co-incubation of OA or EPA with PA in vitro. This co-incubation tended to increase the mRNA levels of Dgat1 and Dgat2 (Fig. S6A). Electron microscopy revealed that there were few LDs in the autophagy-competent PTECs treated with BSA or PA and that PA induced a massive spicule formation in the cytosol-containing undigested proteins and organelles, whereas OA or EPA promoted the formation of clear and smooth LDs (Fig. S6B). Notably, the co-incubation of OA or EPA with PA increased the irregular and lumpy LD formation in the autophagy-competent PTECs, which was abrogated in the autophagy-deficient PTECs.
Based on these observations, we hypothesized that starvation-induced autophagy contributes to the production and delivery of FAs to LD stores. To confirm this, we performed an FA pulse-chase assay using FL HPC (). Cultured PTECs were initially labeled with trace amounts of FL HPC for 16 h. In the PTECs chased with DMEM plus 5% fetal bovine serum, the FL HPC signal was preserved on the cellular membrane structures whereas in the starved PTECs chased with Hank’s balanced salt solution, the signal on the membranes decreased and, instead, colocalized with the boron-dipyrromethene (BODIPY) 665/676-labeled LDs, indicating that FFAs in the cellular membranes redistributed into LDs (). The active involvement of autophagy in an FFA mobilization was examined by immunostaining for MAP1LC3 in the cultured PTECs (). Upon starvation, the FL HPC signal was identified in the autophagosomes or LDs (, inset, upper), while treatment with bafilomycin A1 increased the trapping of FL HPC in autophagosomes in the autophagy-competent PTECs ( inset, lower). FL HPC/autophagosome/LD colocalization and decreases in the FL HPC signal were inhibited under autophagy deficiency. Together, these data suggest that autophagy facilitates the LD growth by supplying them with FAs hydrolyzed from cellular membrane phospholipids during starvation.
Mechanism for the therapeutic efficacy of EPA: the promotion of an FA transfer from LDs to the mitochondria for beta-oxidation in an autophagy-dependent manner
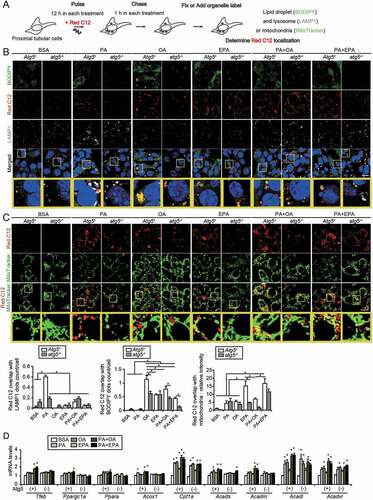
Next, we performed a pulse-chase assay using BODIPY 558/568 C12 (Red C12), a fluorescent FA, to trace the fate of FAs modulated by OA or EPA in more detail. PTECs were loaded with Red C12 (1 μM) in addition to each treatment (BSA, PA, OA, EPA, PA plus OA, and PA plus EPA) for 12 h (pulse), rinsed, administered without Red C12 for 1 h (chase), immunostained for LAMP1, and labeled with BODIPY 493/503 (LDs) or MitoTracker Green FM (mitochondria) to determine Red C12 localization (). The increase in the size and number of the BODIPY 493/503-positive LDs after OA or EPA treatment was observed in the autophagy-competent PTECs (). In the PA-treated PTECs, the Red C12-positive dots were almost completely merged with LAMP1, while in the OA-treated PTECs, they were almost completely merged with the BODIY 493/503-positive LDs. This result was also observed under EPA treatment, although OA treatment was more effective in mobilizing Red C12 into LDs. Notably, the co-incubation of OA or EPA with PA reduced the lysosomal localization of Red C12 and increased the incorporation of Red C12 into LDs in the autophagy-competent PTECs. However, the preferable localization in LDs by EPA or OA treatment decreased in the autophagy-deficient PTECs. The MitoTracker Green FM staining in the autophagy-competent PTECs incubated with EPA, PA plus OA, or PA plus EPA demonstrated that the reticular Red C12 signal merged with the mitochondria (). In contrast, the colocalization of mitochondria and Red C12 tended to decrease in the autophagy-deficient PTECs incubated with PA plus OA or PA plus EPA, suggesting that autophagy was necessary to transfer FAs into the mitochondria, as well as the LD stores. Consistent with these observations, co-incubation of OA or EPA with PA increased the mRNA levels of Tfeb, Ppargc1a, Ppara (peroxisome proliferator activated receptor alpha), and FA beta-oxidation genes, such as Acox1/Aox (acyl-coenzyme A oxidase 1, palmitoyl) and Acadm/Mcad (acyl-coenzyme A dehydrogenase, medium chain), in the autophagy-competent PTECs but not in the autophagy-deficient PTECs (). These data suggest that EPA promotes an FA transfer from LDs to the mitochondria for beta-oxidation in an autophagy-dependent manner.
Figure 6. EPA promotes an FA transfer from LDs to the mitochondria for beta-oxidation. A fluorescent FA pulse-chase assay was performed to trace the fate of FAs modulated by OA or EPA. (A) Schematic illustration of an FA pulse-chase assay. (B, C) Autophagy-competent or autophagy-deficient PTECs were supplied with 1 μM of Red C12 and each treatment (0.25% BSA, 0.25 mM PA, 0.125 mM OA, 0.05 mM EPA, PA plus OA, or PA plus EPA) for 12 h, and, rinsed, administered without Red C12 for 1 h, and the subcellular localization of Red C12 was determined (n = 5 in each group). (B) LDs were labeled with BODIPY 493/503, and lysosomes were immunostained for LAMP1 (white) and counterstained with DAPI (blue). To determine incorporation of Red C12 into LDs or lysosomes, the number of the Red C12 and BODIPY or LAMP1-merged dots were counted, respectively. (C) Mitochondria were labeled with MitoTracker Green FM. To determine redistribution into the mitochondria, the relative intensity of the merged area (yellow) was assessed. (D) The mRNA levels of Tfeb, Ppargc1a, Ppara, and FA beta-oxidation genes were assessed in the autophagy-competent and autophagy-deficient PTECs treated with each treatment for 12 h (n = 6). Cpt1a: carnitine palmitoyltransferase 1a; Acads: acyl-Coenzyme A dehydrogenase, short-chain; Acadl: acyl-Coenzyme A dehydrogenase, long-chain; Acadvl: acyl-Coenzyme A dehydrogenase, very long chain. (B, C) Bars: 10 μm. Data are provided as means ± SE. Statistically significant differences (*P < 0.05 vs. autophagy-competent cells of corresponding treatment; #P < 0.05 vs. BSA-treated control cells) are indicated. All images are representative of multiple experiments. Atg5+: autophagy-competent PTEC; atg5−/−: autophagy-deficient PTEC
EPA supplementation improves the HFD-induced vulnerability toward an ischemia-reperfusion (IR) injury in obese mice
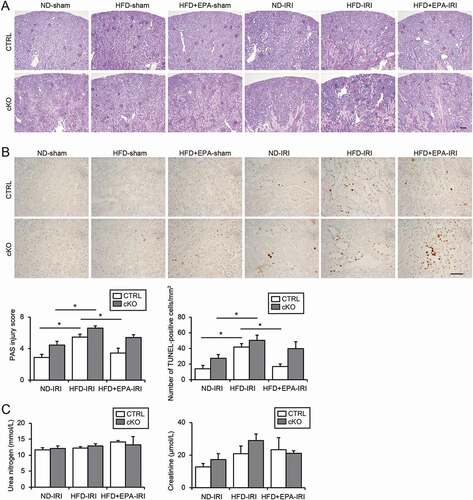
We subjected mice to an IR injury (IRI) to determine whether restored autophagic flux by EPA supplementation improved the HFD-induced vulnerability to ischemic stress. Severe tubular injury with many sediments in the IR-injured obese Atg5 F/F-CTRL mice was attenuated in the EPA-supplemented obese Atg5 F/F-CTRL mice (). The number of terminal deoxynucleotidyl transferase dUTP nick-end labeling (TUNEL)-positive apoptotic tubular cells after an IRI significantly decreased in the EPA-supplemented obese mice compared with those in the obese Atg5 F/F-CTRL mice (). However, this attenuating effect of EPA was diminished by an autophagy deficiency, confirming the importance of an EPA-induced restoration of autophagic flux against an IRI. Renal function, as assessed by the plasma urea nitrogen and creatinine, did not show significant differences among all groups, presumably because mice were subjected to a unilateral IRI ().
Figure 7. EPA improves the HFD-induced vulnerability toward an IRI in obese mice. (A, B) Images of PAS- (A) and TUNEL- (B) staining on kidney cortexes of the nonobese, obese, and EPA-supplemented obese Atg5 F/F-CTRL and atg5-cKO mice 2 d after a unilateral IRI or sham operation (n = 5 to 11 in each group). (A) The tubular injury score was shown. (B) The number of TUNEL-positive PTECs was calculated in at least 10 high-power fields (× 400). Bars: 100 μm (A) and 50 μm (B). (C) The plasma urea nitrogen and creatinine were measured. Data are provided as means ± SE. Statistically significant differences (*P < 0.05) are indicated. All images are representative of multiple experiments. CTRL: Atg5 F/F-CTRL mice; cKO: atg5-cKO mice
Discussion
In this study, we demonstrated that EPA reduced several hallmarks of lipotoxicity in PTECs, including phospholipid accumulation in the lysosomes, mitochondrial dysfunction, inflammation, and fibrosis. Efficacy of EPA is not only improved with an improvement in metabolic syndrome but is also based on several cell-intrinsic and autophagy-dependent mechanisms. EPA alleviates the lysosomal dysfunction and impairment in autophagic flux, reduces the autophagy demand, and promotes an LD formation and FA transfer from LDs to the mitochondria for beta-oxidation. These mechanisms are mutually interconnected; for example, improved lysosomal function and autophagic flux promote the FA supply for LD formation, and, conversely, increasing the production of ATP improves lysosomal acidification.
Although our in vitro study demonstrated that OA was more effective at promoting an LD formation, while EPA was more effective at promoting FA transfer from LDs to the mitochondria for beta-oxidation (), overall, OA and EPA comparably attenuated the PA-induced lipotoxicity, indicating that they may share a common mechanism. OA strongly promotes TG accumulation and rescues the PA-induced apoptosis partly by channeling excess saturated FAs into the TG stores [Citation24]. Two DGAT enzymes catalyze the final and only committed step in TG biosynthesis; the ER-resident polytopic DGAT1 mediates the formation of small LDs, while DGAT2 adopts a hairpin structure and traffics to the surface of LDs, where it facilitates local TG synthesis and LD expansion [Citation27]. Emerging findings indicate a role for the DGAT1-dependent LD biogenesis in mitigating lipotoxicity under multiple conditions, including obesity [Citation28], incubation with exogenous saturated FAs [Citation28], lipotoxic cardiomyopathy [Citation29], hypoxic stress [Citation30], and starvation [Citation31]. To examine the role of DGAT in the protective effect of EPA treatment, we treated PTECs with DGAT1 or DGAT2 inhibitors. When DGAT activity was inhibited, EPA failed to prevent the PA-induced impairment in the lysosomal function, as assessed by CTSD (cathepsin D) activation, autophagic flux, mitochondrial function, and cell survival (Fig. S7A-D), suggesting that LD formation by DGAT may play a key role in the protective function of EPA.
Accumulating evidence suggests that EPA influences membrane lipid dynamics and structural organization. EPA intercalates into the membrane lipid bilayer, where it interferes with the propagation of free radicals induced by the high levels of glucose [Citation15]. The same research group demonstrated that EPA reduced membrane fluidity, inhibited the cholesterol domain formation, and normalized the bilayer width in atherosclerotic-like model membranes [Citation32], although other research groups have reported different findings [Citation16,Citation17]. These studies support that EPA enables the cellular membranes to be easily degraded, which leads to improved lysosomal function and increased autophagic flux, and reduces the demand of autophagy for membrane renovation. Our observation that the PA-induced increases in ceramide and diacylglycerol in the cytosol, which manifest as a “bad” cellular membrane, was blunted by EPA or OA supplementation also supports this notion (Fig. S8). As EPA incorporates into the mitochondrial membranes [Citation32], it is easy to infer that EPA supplementation also enables the damaged mitochondria to be easily degraded and/or reduces the demand for mitophagy. Alternatively, considering that steps in the autophagic pathway are composed of multiple membrane-trafficking processes, EPA may facilitate the autophagic pathway irrespective of the quality and quantity of the substrates, which remain to be elucidated.
We previously reported that HFD induces autophagy despite the activation of the MTOR pathway [Citation10]. The EPA-induced suppression of MTOR activation, observed in the present study and other recent studies [Citation33–35], suggest that autophagy induction by EPA may counteract lipotoxicity. Indeed, it has been reported that omega-3 FAs reverse lipotoxicity through the induction of autophagy in nonalcoholic fatty liver disease [Citation35]. However, considering that HFD activates autophagy along with stagnation at the later stage, a simple induction of autophagy can place a greater burden on the lysosomal system, leading to the deterioration of lipotoxicity. We found that EPA also enhanced the TFEB activity, which not only stimulated autophagy, but also promoted lysosomal biogenesis, lysosomal functions, and PPARGC1A expression [Citation36]. Therefore, EPA may synergistically counteract renal lipotoxicity by facilitating multiple steps in the autophagic processes and the entire lipid metabolism.
Even if a lipid overload per se may not lead to an injury in the kidneys, it contributes to kidney injury in combination with other factors. IRI is a common and clinically important example of second factors in the multiple-hit mechanism because enhanced autophagy plays a compensatory or protective role during IRI [Citation5], and tubular functions are jeopardized under stagnation of autophagy. Indeed, we have previously reported that an HFD-induced stagnation of autophagy predisposes PTECs to IRI. Our observation that EPA reduces the HFD-induced vulnerability toward IRI makes it a promising therapeutic strategy for other kidney diseases that require proper autophagy enhancement. The stagnation of autophagy is also observed in aging kidneys, where the gradual accumulation of waste, such as the damaged mitochondria, prevents the enhancement of autophagic activity [Citation7]. Therefore, EPA may slow kidney aging through the modulation of cellular membranes and, thus, the reduction of autophagy demand. Indeed, EPA attenuates age-related losses of the mitochondrial function in the skeletal muscles of aged mice [Citation37].
In conclusion, EPA counteracts lipotoxicity in the proximal tubules by alleviating autophagic numbness, which paves the way for a novel treatment of obesity-related kidney diseases.
Materials and methods
Mice
GFP-MAP1LC3 transgenic, atg5-cKO (Atg5 F/F; Kap-Cre), and atg5-iKO (Atg5 F/F; Ndrg1-Cre) mice, were used as described previously [Citation5,Citation7]. Eight-week-old mice were fed with an ND (12.8% of kcal from fat: 5% fat, 23% protein, and 55% carbohydrate; Oriental Yeast, OYC2103800) or HFD (62.2% of kcal from fat: 35% fat, 23% protein, and 25% carbohydrate; Oriental Yeast, OYC2900100) for 2 or 10 months. EPA (purity > 98%, gifted by Mochida Pharmaceutical) was mixed into the HFD at 3.6% (wt/wt). For the induction of Atg5 deletion, tamoxifen (Sigma-Aldrich, T5648; 1 mg/10 g body wt) dissolved in corn oil (Sigma-Aldrich, C8267) was injected at a concentration of 10 mg/mL 3 d a week. Kidney ischemia was induced, and tubular injury and kidney functions were assessed, as described previously [Citation5]. All animal experiments were approved by the Animal Research Committee of Osaka University and conformed to the Japanese Animal Protection and Management Law (No.25).
Antibodies and reagents
We used the following antibodies; LRP2/MEGALIN (low density lipoprotein receptor-related protein 2) (gifted by Dr. Michigami, Department of Bone and Mineral Research, Osaka Medical Center and Research Institute for Maternal and Child Health, Japan), COL1A1 (Abcam, ab34710), SQSTM1 (Medical and Biological Laboratory [MBL], PM045), ubiquitin (Cell Signaling Technology, 3936), ATG5 (MBL, PM050), MAP1LC3 (Cell Signaling Technology, 2755 for western blotting, MBL, PM036 for immunostaining), TFEB (Invitrogen, PA1–31552), IL1B (Cell Signaling Technology, 12242), p-RPS6 (Ser235/236; Cell Signaling Technology, 2211), ACTB (Sigma-Aldrich, A5316), ADGRE1 (BIO-RAD, MCA497), LAMP1 (BD Biosciences, 553792), 4-HNE (JaICA, MHN-020P), CML (Transgenic, KH024), cleaved CASP3/caspase-3 (Asp175; Cell Signaling Technology, 9661), CTSD (Santa Cruz Biotechnology, sc-6486), biotinylated secondary antibodies (Vector Laboratories, BA-1000 [anti-rabbit IgG], BA-2001 [anti-mouse IgG], BA-4000 [anti-rat IgG]), horseradish peroxidase-conjugated secondary antibodies (DAKO, P0448 [anti-rabbit IgG], P0447 [anti-mouse IgG]), and Alexa Fluor-conjugated secondary antibody (Invitrogen, 21202 [anti-mouse Alexa Fluor 488], A31572 [anti-rabbit Alexa Fluor 555], A31570 [anti-mouse Alexa Fluor 555], and A21247 [anti-rat Alexa Fluor 647]).
Histological analysis
Histological analysis was performed as described previously with modifications [Citation7]. Antigen retrieval on paraffin-embedded sections, double staining for SQSTM1 (or ubiquitin) and LRP2, quantification of the percentage of the COL1A1- (or ADGRE1-) positive area, electron microscopy analysis, toluidine blue, Nile red, Luxol fast blue, Oil Red O and TUNEL staining, and assessment of the kidney injury were performed as described previously [Citation7,Citation10]. For electron microscopy analysis, autophagosomes were identified as ribosome-free double- or partially double-membrane vesicles with identified cargo or contents of comparable density to the surrounding cytosol; autolysosomes were identified as single-membrane vesicles with contents at a density lower than the surrounding cytosol and cargo suggestive of degradation.
Biochemical parameters
Blood samples were collected from mice under anesthesia. Plasma was obtained after centrifugation (15 min, 845 × g, 4°C) and concentrations of urea nitrogen, creatinine, glucose, total cholesterol, TGs, FFAs, and phospholipids were measured using the BUN-Test-Wako (Wako, 279–36201), CRE-EN Kainos (Kainos, TKA7500), Glucose CII-test (Wako, 439–90901), Cholesterol E-test (Wako, 439–17501), Triglyceride E-test (Wako, 432–40201), NEFA C-test (Wako, 279–75401), and Phospholipid C-test (Wako, 433–36201), respectively. Total tissue TGs were measured using the Triglyceride E-test after samples were weighed and homogenized by polytron, and total lipids were extracted, in accordance with the methods of a previous study [Citation38]. All kits were used in accordance with the manufacturer’s instructions.
Cell culture
Autophagy-deficient and autophagy-competent PTEC lines used in the present study were in accordance with the methods described previously [Citation5]. Sodium PA (Sigma-Aldrich, P9767), OA (Sigma-Aldrich, O7501), or EPA (Sigma-Aldrich, E6627) were dissolved in 50% ethanol and vigorously mixed with BSA (Sigma-Aldrich, A8806) in phosphate-buffered saline (pH 7.4; composed of 137 mM NaCl [Wako, 191–01665], 8 mM Na2HPO4 [Wako, 196–02835], 2.7 mM KCl [Nacalai tesque, 28514–75], 1.5 mM KH2PO4 [Wako, 169–04245]) at a molar ratio of 6.6:1, filter-sterilized, and added to the culture media at the indicated final concentrations. To block the DGAT-dependent LD formation, PTECs were treated with the DGAT1 inhibitor A922500 (Sigma-Aldrich, A1737) or the DGAT2 inhibitor PF-06424439 (Sigma-Aldrich, PZ0233). To assess the autophagic activity, PTECs were treated with 200 nM of bafilomycin A1 (Wako, 023–11641) for 1 h at 37°C before harvest. MTS assays were performed using the CellTiter 96 AQueous One Solution Cell Proliferation Assay (Promega, G3580), according to the manufacturer’s instructions.
Assessment of lysosomal acidification
To assess the lysosomal acidification, PTECs stably expressing GFP-MAP1LC3 were stained with 50 nM LysoTracker Red DND-99 (Invitrogen, L7545) for 30 min at 37°C or stained with 1 μM of LysoSensor Yellow/Blue DND-160 (PDMPO; Invitrogen, L7528) for 1 min at 37°C, as per a method described previously [Citation10].
Fluorescent FA pulse-chase assay
A Fluorescent FA pulse-chase assay using Beta-BODIPY FL C12-HPC (FL HPC) (Invitrogen, D-3792) or BODIPY 558/568C12 (Red C12; Invitrogen, D3835) was performed as per a method described previously with slight modifications [Citation39]. Detailed protocols have been described in the results section. The number and size of the phospholipid/lysosome-merged dots were quantified using the ImageJ plug-in (NIH).
Assessment of mitochondrial function
Mitochondrial membrane potential, ROS production, and COX/SDH staining were assessed as per a method described previously [Citation6].
Quantitative RT-PCR and western blot analysis
Quantitative RT-PCR and western blot analyses were performed as per a method described previously [Citation40]. The sequences of the primers used, except Dgat1 and Dgat2, have been described previously [Citation7,Citation10,Citation26]. The sequences of the Dgat1 and Dgat2 primers were as follows: Dgat1-F, 5´- ctgtgctcatgtatgtccacgact −3´; Dgat1-R, 5´- ctggctcataccagtgctgagatt −3´; Dgat2-F, 5´- gcaagaagtttcctggcataaggc −3´; Dgat2-R, 5´- gcaggacacactagaagtgagctt −3´.
Lipidomic analysis
Lipid extraction from PTECs was performed using the Bligh and Dyer method [Citation41]. The levels of ceramide and diacylglycerol were quantified using supercritical fluid chromatography triple quadrupole mass spectrometry (SFC/MS/MS) in a multiple reaction monitoring mode [Citation42,Citation43]. The SFC/MS/MS system was composed of an SFC (ACQUITY UPC2 [Waters, Milford, MA, USA]) and a triple quadrupole mass spectrometer (Xevo TQ-S micro [Waters]).
Statistical analysis
All results have been presented as means ± standard error (SE). Statistical analyses were conducted using the JMP software (SAS Institute). Multiple-group comparisons were performed using analysis of variance with post-testing using the Tukey-Kramer test. The difference between two experimental values was assessed using the Student’s t-test when appropriate. Statistical significance was defined as P < 0.05.
Supplemental Material
Download PDF (2 MB)Acknowledgments
We thank N. Mizushima at the University of Tokyo, for the Atg5F/F and GFP-MAP1LC3 mice; T. Michigami at the Osaka Medical Center and Research Institute for the LRP2 antibody; and N. Horimoto for technical assistance. This work was also partly performed at the Cooperative Research Project Program of the Medical Institute of Bioregulation, Kyushu University.
Disclosure statement
The authors declare that they have no conflict of interest.
Supplementary material
Supplemental data for this article can be accessed here.
Additional information
Funding
References
- Levine B, Kroemer G. Autophagy in the pathogenesis of disease. Cell. 2008;132(1):27–42.
- Choi AMK, Ryter SW, Levine B. Autophagy in human health and disease. N Engl J Med. 2013;368(7):651–662.
- Mizushima N, Komatsu M. Autophagy: renovation of cells and tissues. Cell. 2011;147(4):728–741.
- Clark SL. Cellular differentiation in the kidneys of newborn mice studies with the electron microscope. J Biophys Biochem Cytol. 1957;3(3):349–362.
- Kimura T, Takabatake Y, Takahashi A, et al. Autophagy protects the proximal tubule from degeneration and acute ischemic injury. J Am Soc Nephrol. 2011;22(5):902–913.
- Namba T, Takabatake Y, Kimura T, et al. Autophagic clearance of mitochondria in the kidney copes with metabolic acidosis. J Am Soc Nephrol. 2014;25(10):2254–2266.
- Yamamoto T, Takabatake Y, Kimura T, et al. Time-dependent dysregulation of autophagy: implications in aging and mitochondrial homeostasis in the kidney proximal tubule. Autophagy. 2016;12(5):801–813.
- Maejima I, Takahashi A, Omori H, et al. Autophagy sequesters damaged lysosomes to control lysosomal biogenesis and kidney injury. Embo J. 2013;32(17):2336–2347.
- Takahashi A, Takabatake Y, Kimura T, et al. Autophagy inhibits the accumulation of advanced glycation end products by promoting lysosomal biogenesis and function in the kidney proximal tubules. Diabetes. 2017;66(5):1359–1372.
- Yamamoto T, Takabatake Y, Takahashi A, et al. High-fat diet-induced lysosomal dysfunction and impaired autophagic flux contribute to lipotoxicity in the kidney. J Am Soc Nephrol. 2017;28(5):1534–1551.
- Brinton EA, Mason RP. Prescription omega-3 fatty acid products containing highly purified eicosapentaenoic acid (EPA). Lipids Health Dis. 2017;16(1):23.
- Wall R, Ross RP, Fitzgerald GF, et al. Fatty acids from fish: the anti-inflammatory potential of long-chain omega-3 fatty acids. Nutr Rev. 2010;68(5):280–289.
- Wendel M, Heller AR. Anticancer actions of omega-3 fatty acids–current state and future perspectives. Anticancer Agents Med Chem. 2009;9(4):457–470.
- Watts GF, Mori TA. Recent advances in understanding the role and use of marine ω3 polyunsaturated fatty acids in cardiovascular protection. Curr Opin Lipidol. 2011;22(1):70–71.
- Mason RP, Jacob RF. Eicosapentaenoic acid inhibits glucose-induced membrane cholesterol crystalline domain formation through a potent antioxidant mechanism. Biochim Biophys Acta. 2015;1848(2):502–509.
- Lu L, Okada N, Nakatani S, et al. Eicosapentaenoic acid-induced changes in membrane fluidity and cell adhesion molecules in cultured human keratinocytes. Br J Dermatol. 1995;133(2):217–222.
- Yang X, Sheng W, Sun GY, et al. Effects of fatty acid unsaturation numbers on membrane fluidity and α-secretase-dependent amyloid precursor protein processing. Neurochem Int. 2011;58(3):321–329.
- Borow KM, Nelson JR, Mason RP. Biologic plausibility, cellular effects, and molecular mechanisms of eicosapentaenoic acid (EPA) in atherosclerosis. Atherosclerosis. 2015;242(1):357–366.
- Mason RP, Jacob RF, Shrivastava S, et al. Eicosapentaenoic acid reduces membrane fluidity, inhibits cholesterol domain formation, and normalizes bilayer width in atherosclerotic-like model membranes. Biochim Biophys Acta - Biomembr. 2016;1858(12):3131–3140.
- Fukui M, Kang KS, Okada K, et al. EPA, an omega-3 fatty acid, induces apoptosis in human pancreatic cancer cells: role of ROS accumulation, caspase-8 activation, and autophagy induction. J Cell Biochem. 2013;114(1):192–203.
- Gao B, Han Y-H, Wang L, et al. Eicosapentaenoic acid attenuates dexamethasome-induced apoptosis by inducing adaptive autophagy via GPR120 in murine bone marrow-derived mesenchymal stem cells. Cell Death Dis. 2016;7(5):e2235.
- Hsu H-C, Chen C-Y, Chiang C-H, et al. Eicosapentaenoic acid attenuated oxidative stress-induced cardiomyoblast apoptosis by activating adaptive autophagy. Eur J Nutr. 2014;53(2):541–547.
- Brown WJ, Sullivan TR, Greenspan P. Nile red staining of lysosomal phospholipid inclusions. Histochemistry. 1992;97(4):349–354.
- Listenberger LL, Han X, Lewis SE, et al. Triglyceride accumulation protects against fatty acid-induced lipotoxicity. Proc Natl Acad Sci U S A. 2003;100(6):3077–3082.
- Martina JA, Chen Y, Gucek M, et al. MTORC1 functions as a transcriptional regulator of autophagy by preventing nuclear transport of TFEB. Autophagy. 2012;8(6):903–914.
- Minami S, Yamamoto T, Takabatake Y, et al. Lipophagy maintains energy homeostasis in the kidney proximal tubule during prolonged starvation. Autophagy. 2017;13(10):1629–1647.
- Bhatt-Wessel B, Jordan TW, Miller JH, et al. Role of DGAT enzymes in triacylglycerol metabolism. Arch Biochem Biophys. 2018;655:1–11.
- Koliwad SK, Streeper RS, Monetti M, et al. DGAT1-dependent triacylglycerol storage by macrophages protects mice from diet-induced insulin resistance and inflammation. J Clin Invest. 2010;120(3):756–767.
- Liu L, Trent CM, Fang X, et al. Cardiomyocyte-specific loss of diacylglycerol acyltransferase 1 (DGAT1) reproduces the abnormalities in lipids found in severe heart failure. J Biol Chem. 2014;289(43):29881–29891.
- Ackerman D, Tumanov S, Qiu B, et al. Triglycerides promote lipid homeostasis during hypoxic stress by balancing fatty acid saturation. Cell Rep. 2018;24(2596–2605.e5). DOI:https://doi.org/10.1016/j.celrep.2018.08.015.
- Nguyen TB, Louie SM, Daniele JR, et al. DGAT1-dependent lipid droplet biogenesis protects mitochondrial function during starvation-induced autophagy. Dev Cell. 2017;42(1):9–21.e5.
- Mason RP, Jacob RF, Shrivastava S, et al. Eicosapentaenoic acid reduces membrane fluidity, inhibits cholesterol domain formation, and normalizes bilayer width in atherosclerotic-like model membranes. Biochim Biophys Acta. 2016;1858(12):3131–3140.
- Yasuda M, Tanaka Y, Kume S, et al. Fatty acids are novel nutrient factors to regulate mTORC1 lysosomal localization and apoptosis in podocytes. Biochim Biophys Acta. 2014;1842(7):1097–1108.
- Liu M, Zhou L, Zhang B, et al. Elevation of n-3/n-6 PUFAs ratio suppresses mTORC1 and prevents colorectal carcinogenesis associated with APC mutation. Oncotarget. 2016;7(47):76944–76954.
- Wei H-K, Deng Z, Jiang S-Z, et al. Eicosapentaenoic acid abolishes inhibition of insulin-induced mTOR phosphorylation by LPS via PTP1B downregulation in skeletal muscle. Mol Cell Endocrinol. 2017;439(5):116–125.
- Settembre C, De Cegli R, Mansueto G, et al. TFEB controls cellular lipid metabolism through a starvation-induced autoregulatory loop. Nat Cell Biol. 2013;15(6):647–658.
- Herbst EAF, Paglialunga S, Gerling C, et al. Omega-3 supplementation alters mitochondrial membrane composition and respiration kinetics in human skeletal muscle. J Physiol. 2014;592(6):1341–1352.
- Folch J, Lees M, Sloane Stanley GH. A simple method for the isolation and purification of total lipides from animal tissues. J Biol Chem. 1957;226(1):497–509.
- Rambold AS, Cohen S, Lippincott-Schwartz J. Fatty acid trafficking in starved cells: regulation by lipid droplet lipolysis, autophagy, and mitochondrial fusion dynamics. Dev Cell. 2015;32(6):678–692.
- Matsui I, Ito T, Kurihara H, et al. Snail, a transcriptional regulator, represses nephrin expression in glomerular epithelial cells of nephrotic rats. Lab Invest. 2007;87(3):273–283.
- Bligh EG, Dyer WJ. A rapid method of total lipid extraction and purification. Can J Biochem Physiol. 1959;37(8):911–917.
- Tsugawa H, Ohta E, Izumi Y, et al. MRM-DIFF: data processing strategy for differential analysis in large scale MRM-based lipidomics studies. Front Genet. 2014;5:471.
- Takeda H, Koike T, Izumi Y, et al. Lipidomic analysis of plasma lipoprotein fractions in myocardial infarction-prone rabbits. J Biosci Bioeng. 2015;120(4):476–482.