
 ?Mathematical formulae have been encoded as MathML and are displayed in this HTML version using MathJax in order to improve their display. Uncheck the box to turn MathJax off. This feature requires Javascript. Click on a formula to zoom.
ABSTRACT
Turnover of cellular organelles, including endoplasmic reticulum (ER) and mitochondria, is orchestrated by an efficient cellular surveillance system. We have identified a mechanism for dual regulation of ER and mitochondria under stress. It is known that AMFR, an ER E3 ligase and ER-associated degradation (ERAD) regulator, degrades outer mitochondrial membrane (OMM) proteins, MFNs (mitofusins), via the proteasome and triggers mitophagy. We show that destabilized mitochondria are almost devoid of the OMM and generate “mitoplasts”. This brings the inner mitochondrial membrane (IMM) in the proximity of the ER. When AMFR levels are high and the mitochondria are stressed, the reticulophagy regulatory protein RETREG1 participates in the formation of the mitophagophore by interacting with OPA1. Interestingly, OPA1 and other IMM proteins exhibit similar RETREG1-dependent autophagosomal degradation as AMFR, unlike most of the OMM proteins. The “mitoplasts” generated are degraded by reticulo-mito-phagy – simultaneously affecting dual organelle turnover.
Abbreviations: AMFR/GP78: autocrine motility factor receptor; BAPTA: 1,2-bis(o-aminophenoxy)ethane-N,N,N′,N′-tetraacetic acid; BFP: blue fluorescent protein; CCCP: carbonyl cyanide m-chlorophenyl hydrazone; CNBr: cyanogen bromide; ER: endoplasmic reticulum; ERAD: endoplasmic-reticulum-associated protein degradation; FL: fluorescence, GFP: green fluorescent protein; HA: hemagglutinin; HEPES: 4-(2-hydroxyethyl)-1-piperazineethanesulfonic acid; IMM: inner mitochondrial membrane; LIR: LC3-interacting region; MAP1LC3/LC3: microtubule associated protein 1 light chain 3; MFN: mitofusin, MGRN1: mahogunin ring finger 1; NA: numerical aperature; OMM: outer mitochondrial membrane; OPA1: OPA1 mitochondrial dynamin like GTPase; PRNP/PrP: prion protein; RER: rough endoplasmic reticulum; RETREG1/FAM134B: reticulophagy regulator 1; RFP: red fluorescent protein; RING: really interesting new gene; ROI: region of interest; RTN: reticulon; SEM: standard error of the mean; SER: smooth endoplasmic reticulum; SIM: structured illumination microscopy; SQSTM1/p62: sequestosome 1; STED: stimulated emission depletion; STOML2: stomatin like 2; TOMM20: translocase of outer mitochondrial membrane 20; UPR: unfolded protein response.
Introduction:
Macroautophagy/autophagy is an evolutionarily conserved cellular quality control process by which cytosolic constituents, including long-lived proteins, aggregates, aged or damaged organelles, like the ER and the mitochondria, are engulfed by specialized double-membrane compartments. The first step of autophagosome formation is the development of a phagophore. It gradually becomes a cup-shaped structure and engulfs the cytosolic components marked for destruction [Citation1]. This eventually forms an autophagosome, which fuses with lysosome and leads to degradation of internal cargo. Basal levels of autophagy help in the removal of harmful components that could accumulate and hinder normal cellular functions. Autophagy also helps in degrading cellular components in specific physiological states of development or nutrient starvation [Citation2]. Inefficient functioning of this quality control mechanism is implicated in many debilitating diseases like cancer and neurodegeneration [Citation3].
Pieces of evidence suggest that phagophores can originate from various organelles, like the plasma membrane, Golgi, mitochondria and the ER; the source of the membrane, however, is often governed by the specific nature and location of the cellular component destined for degradation [Citation4–8]. The dynamic nature and structure of the ER facilitate interaction of its membranes with those of closely apposed organelles like mitochondria, Golgi, peroxisomes and the plasma membrane [Citation9–11]. Mitochondrial outer membranes contribute to the formation of starvation-induced autophagosomes. There is evidence where a tail-anchored outer mitochondrial membrane (OMM) protein but not other OMMs or inner mitochondrial membrane (IMM) proteins diffuse into newly formed autophagosomes from the mitochondria [Citation12]. It is reported that the autophagy protein MAP1LC3/LC3 can also be recruited in an ATG5- and ATG7-dependent manner to membranes derived from the plasma membrane [Citation13]. Studies in yeast, plants and animals demonstrate the involvement of ER-mitochondria encounter structures (ERMES) in the formation of autophagosomes [Citation14–16]. ER–Golgi intermediate compartment (ERGIC) has been shown to be a key site for the biogenesis of autophagosome membrane [Citation17]. The role of ER proteins in cellular autophagy is an emerging field of research. The reticulon family of proteins such as RTN3 (reticulon 3) and RETREG1, along with other ER proteins, SEC62, CCPG1 (cell cycle progression 1), ATL3 (atlastin GTPase 3) and the intrinsically disordered protein TEX264 have been identified as important mediators of reticulophagy (also referred as ER-phagy) [Citation18–23]. However, it remains an open question whether other ER proteins act as co-factors for these reticulophagy receptors in similar quality control processes. ER E3 ligases are essential components of the ER-associated degradation (ERAD), but whether these are involved in other pathways of surveillance remain undeciphered.
The presence of abnormal and misfolded proteins in the ER often leads to ER stress. In order to reestablish ER homeostasis, there is immediate activation of unfolded protein response (UPR). This involves translational attenuation of global protein synthesis, transcriptional induction of genes that function as ER chaperones and activation of selective degradation of the aggregated proteins. Recent pieces of evidence also suggest deregulation of autophagy [Citation24,Citation25]. Although ERAD and autophagy have been widely studied in the light of modulating E3 ligases, the molecular basis of regulation and turnover of ERAD E3 ligases under stress are still elusive.
E3 ubiquitin ligases can regulate their own levels besides being regulated by other ligases. One such ER E3 ligase is AMFR (autocrine motility factor receptor). SYVN1 (synoviolin 1) targets AMFR for proteasomal degradation and in turn affects the levels of INSIG1 (insulin-induced gene 1) [Citation26,Citation27]. AMFR is ubiquitinated by TRIM25 (tripartite motif-containing protein 25) for proteasomal degradation, although the physiological relevance is unknown [Citation28]. AMFR ubiquitinates ERAD substrates like CFTR (cystic fibrosis transmembrane conductance regulator) and APOB (apolipoprotein B) and targets them for proteasomal degradation, thus playing an important role in alleviating ER stress [Citation29,Citation30]. High AMFR levels trigger mitophagy as it leads to increased ubiquitination and degradation of mitofusins along with an increase in recruitment of LC3 (MAP1LC3A) to the mitochondria-associated ER [Citation31]. The mechanistic basis of this observation, though, remains obscure. A recent study from our laboratory has demonstrated that AMFR is ubiquitinated and degraded by the cytosolic E3 ligase MGRN1 (mahogunin ring finger 1) protein [Citation32]. MGRN1 is a RING E3 ligase, loss of which is implicated in adult-onset spongiform neurodegeneration (phenotypically similar to prion diseases), and other developmental defects in mice [Citation33–36]. AMFR-MGRN1 interaction and ubiquitination occur in cells under normal conditions. However, when cells are stressed as is indicated by an increase in the levels of cytosolic Ca2+, MGRN1-dependent ubiquitination and degradation of AMFR are abrogated [Citation32]. This leads to elevated levels of the ER ligase, induction of mitophagy and altered intraorganellar dynamics [Citation32,Citation37].
Here, we show that mitophagy, triggered by overexpression of AMFR or by increase in the levels of cytosolic Ca2+, is due to destabilization of mitochondria and generation of “mitoplasts” (devoid of OMM). This is mitigated by a dual regulatory mechanism to reestablish cellular homeostasis. First, autophagosomal degradation of AMFR is mediated by the reticulophagy receptor and regulator, RETREG1. Depletion of RETREG1 compromises AMFR turnover. Secondly, we show that when AMFR levels are high and mitophagy is triggered, ER forms the mitophagophore. RETREG1 participates in this process of ER membrane wrapping of the mitochondria; for this, it interacts with the IMM protein, OPA1. Interestingly, OPA1, along with other IMM proteins, exhibit similar RETREG1-dependent autophagosomal degradation as AMFR. The “mitoplast” generated are degraded at the lysosomes, along with AMFR. However, OMM proteins do not participate in this process. The “mitoplasts” are degraded by reticulo-mito-phagy – a process which simultaneously affects dual organelle turnover. Our study identifies a unique mode of autophagy, where during mitophagy, RETREG1-mediated degradation of AMFR would downregulate the protein levels of AMFR, eventually also turning down mitophagy to reestablish homeostasis in cells.
Results
AMFR destabilizes mitochondria leading to the formation of mitoplast
It is known that elevated levels of AMFR are detrimental for the cell as this leads to ubiquitination and degradation of mitofusins (MFN1 and MFN2) and perpetuates mitophagy [Citation31,Citation32]. In such a situation, it is plausible to hypothesize that the OMM would get destabilized, exposing the IMM, at least partially. It could also result in a hollow, unstable structure with naked IMM called “mitoplast.” To validate this, HeLa cells were transfected with mito-BFP that localizes to the cristae and labels IMM and TOMM20-mCherry to label the OMM and analyzed by multiple imaging techniques (). TOMM20-mCherry signal bordering around the mito-BFP could be detected in 3D projections of z-stack images of control cells (without AMFR overexpression) ( and S1A). Here, mitochondria appeared normal in their elongated status. However, in samples with exogenous AMFR, hollow vesicle-like structures of TOMM20-mCherry were present; an increase in number of such structures was detected in bafilomycin A1-treated samples. As previously reported, AMFR overexpression led to perinuclear clustering of fragmented mitochondria. Since it is known that overexpression of AMFR promotes mitophagy, we argued that inhibiting autophagosomal clearance of mitochondria, as with bafilomycin A1 treatment, should enrich the population of unstable mitochondria. A quantitative analysis of the z-stack images revealed the presence of TOMM20-mCherry structures within the proximity (roughly 47 nm radius neighborhood) of the mito-BFP demarcated IMM boundary in the controls. These structures were significantly less in cells overexpressing AMFR (). The overlap index between mito-BFP and TOMM20-mCherry was significantly less with AMFR overexpression as compared to the controls (). IMM boundary and its neighboring/overlapping OMM structures were extracted via image processing algorithms (see Materials and Methods). These results indicated lower abundance of OMM structures near close vicinity of the IMM boundary in cells overexpressing AMFR; bafilomycin A1 treatment further compromised the neighborhood and overlapping indices.
Figure 1. High levels of AMFR induce “mitoplast” formation. (A) HeLa cells transfected with AMFR-FLAG or EmpVec along with mito-BFP and TOMM20-mCherry were either treated with Baf or left untreated and imaged under live-cell conditions. Control cells were left untreated. Images are single slices from z-stacks. Note: detection of mitoplasts in the presence of AMFR as indicated by white arrowheads. ~85 cells from 6 independent experiments were analyzed. Immunoblot of the lysates post imaging were probed with anti-FLAG and anti-VCL antibodies confirm AMFR transfection and loading. Scale bar: 5 μm. (B and C) Box plot representations of the neighborhood index (B) and overlap index (C) of TOMM20-mCherry structures representing OMM within close proximity (roughly 47 nM radius neighborhood) of the IMM boundary marked by mito-BFP signal; analyses of images in panel A. The central line and the plus (+) symbol in each box show the median and mean value, respectively. *** p ≤ 0.001 using unpaired 2-tailed Student’s t-test. (D) Cells similarly transfected and treated as in panel A were imaged live in the slice 3D-SIM mode; mito-GFP was used instead of mito-BFP. Images are 3D-projections obtained from z-stacks using ImageJ. Mitoplasts indicated by white arrowheads. Note that rotating the reconstructed images by 60° angle confirmed absence of TOMM20-mCherry signal from the mito-GFP-positive “mitoplasts”. ~30 cells from 3 independent experiments were analyzed Immunoblot of the lysates post imaging were probed with anti-FLAG and anti-VCL antibodies confirm AMFR transfection and loading. Scale bar: 5 μm. (E) Enlarged views of a portion of the middle slices from images represented in panel D. Scale bar: 1 μm. Note the presence of “mitoplasts” (white arrowheads), “hollow vesicle-like outer membranes (yellow arrowheads)” and “mitochondria with partial OMM (cyan arrowheads)” – the three phenotypes of unstable mitochondria. Enhanced detection of these events in presence of Baf. (F and G) Image analyses similar to panels B and C done with the 3D-SIM data also revealed similar trend of fewer TOMM20-mCherry-positive structures near close vicinity and or overlaying the mito-GFP boundary cells overexpressing AMFR as compared to control. *** p ≤ 0.001 using unpaired 2-tailed Student’s t-test. (H) Representative transmission electron micrographs of cells transfected with EmpVec (i–iii) or AMFR (iv–vi). White arrowheads indicate ER-mitochondria junctions (i and iii); Fg denotes “fragmented outer mitochondrial membrane” (iv); arrow marks “OMM peeling off” (v); and red arrowheads indicate “ER phagophore with internalized mitochondria” (vi). Red dotted line demarcates the boundary of the ER phagophore. Note increased events of “unstable mitochondria” in AMFR-IRES-GFP-expressing sorted cells. (I) Mitochondrial length (major and minor axes) and eccentricity calculated from the electron micrographs of cells transfected with EmpVec and AMFR using image processing toolbox of MATLAB. * p ≤ 0.05, using unpaired 2-tailed Student’s t-test. Error bars, ±SEM
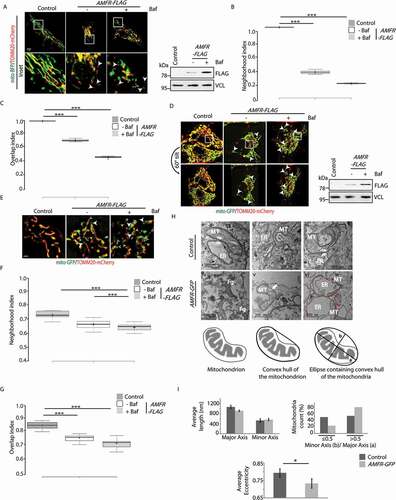
Super resolution imaging in the slice 3D-SIM mode confirmed the above results (). In AMFR-overexpressing cells, we detected: (i) hollow vesicle-like TOMM20-mCherry-coated structures without any IMM component, (ii) “mitoplasts” that were only positive for mito-GFP and (iii) TOMM20-mCherry structures with pores from which mito-GFP-labeled IMM could be seen escaping. Treatment with bafilomycin A1 enhanced these phenotypes while controls lacked such structures. Rotating the 3D-projection image by 60° angle confirmed that the “mitoplasts” did not have OMM components. OMM and IMM were closely apposed in control cells. Enlarged views of AMFR-overexpressing cells clearly exhibited the three phenotypes of unstable mitochondria, namely, “mitoplasts,” “hollow vesicle-like outer membranes” and “mitochondria with partial OMM” ( and S1B). Image analyses with the 3D-SIM data of AMFR-overexpressing cells also revealed lower propensity of OMM boundary in close vicinity of the IMM structures (). Bafilomycin A1 treatment compromised the neighborhood and overlapping indices.
Super-resolution imaging with OPA1-GFP (an IMM protein) and TOMM20-mCherry further confirmed the presence of “hollow vesicle-like outer membranes of TOMM20-mCherry without OPA1-GFP inside, in AMFR-overexpressed cells (Figure S2A). “Mitoplasts” (positive only for OPA1-GFP) and mitochondria with partial OMM (OPA1-GFP-positive puncta partially surrounded by TOMM20-mCherry) were also detected. Bafilomycin A1 treatment enhanced these phenotypes. On the contrary, control cells had abundance of mitochondria with OPA1-GFP completely surrounded by TOMM20-mCherry.
Since we hypothesized that enhanced degradation of mitofusins due to elevated protein levels of AMFR led to destabilization of mitochondria and “mitoplast” generation, it was obvious to verify if the presence of RING domain mutant (AMFR RINGmut) could abrogate the phenotype. HeLa cells transfected with mito-RFP and SYNJ2BP/OMP-GFP (to mark the OMM) were co-transfected with FLAG-tagged-AMFR or AMFR RINGmut and imaged (Figure S2B). Unstable mitochondrial phenotypes were detected in AMFR-overexpressed samples, with an increase in number of such structures upon bafilomycin A1 treatment. However, in cells with AMFR RINGmut, SYNJ2BP-GFP bordered around the mito-RFP signal similar to the control cells. Perinuclear clustering of fragmented mitochondria was detected in presence of AMFR, while cells with AMFR RINGmut had mitochondria spread throughout the cell, like the controls. Similarly, AMFR depletion in cells, did not lead to destabilization of mitochondria or “mitoplast” generation – these cells were phenotypically similar to the controls (Figure S2 C).
As a physiological validation of “mitoplast” generation, HeLa cells treated with Ca2+ releasing drugs (thapsigargin or CCCP) were imaged. Thapsigargin and CCCP treatments destabilize the ER and mitochondrial Ca2+ stores, respectively, while BAPTA is an intracellular Ca2+ chelator. Imaging results showed the presence of mitochondria with partial OMM, hollow vesicle-like outer membranes and “mitoplasts” (Figure S3A). Unstable mitochondria were not detected in control cells or those with BAPTA. Similar treatment with CCCP in SHSY5Y and Cos7 cells also showed the presence of unstable mitochondria. In both these cell lines, AMFR overexpression also resulted in “mitoplast” generation, thus suggesting a cell line independent phenomenon (Figure S3B). Further, we found that CYCS (cytochrome c, somatic) was released from the mitochondrial intermembrane space (IMS) into the cytosol in AMFR-overexpressing cells treated with CCCP (5 µM, 2 h) when compared with the controls (Figure S4A and S4B).
Transmission electron microscopy (TEM) revealed that in control cells, ER and mitochondria were closely apposed, forming ERMES (Figure 1Hi and 1Hiii) as previously reported [Citation14,Citation38,Citation39] or in near proximity (Figure 1Hii). However, EM micrographs of cells overexpressing AMFR revealed the presence of unstable mitochondria with “fragmented outer membrane” (), “OMM peeling off” (Figure 1Hv), and structures where “ER phagophore had internalized mitochondria” (Figure 1Hvi). Mitochondrial eccentricity calculated from these micrographs also suggested significant deformation in shape of these organelles in cells overexpressing AMFR as compared with the controls (). These results clearly suggest that high levels of AMFR lead to destabilization of the mitochondria. Hence, it is rational to suggest that cells should harbor internal regulatory mechanisms to alleviate AMFR levels and prevent destabilization of mitochondria.
Autophagic degradation of AMFR is mediated by RETREG1
It is already known that increased cytosolic Ca2+ perturbs proteasomal degradation of AMFR [Citation32,Citation37]. To analyze the degradation of AMFR in presence of high cytosolic Ca2+, HeLa cells treated with either thapsigargin (400 nM, 6 h) or CCCP (20 µM, 4 h) were lysed and compared for the preferred pathway of degradation. In addition, these cells were subjected to drug treatments with MG132 (to block proteasomal degradation) or bafilomycin A1 (to inhibit autophagy). We detected that in the presence of high cytosolic Ca2+, the degradation of AMFR was primarily through the autophagic pathway (). To further establish this, we used a mutant of AMFR with its IQ domain deleted (AMFR∆IQ) and hence lacking its Ca2+-sensing ability [Citation37]. In the presence of this mutant, cells preferred proteasomal degradation of AMFR even when cytosolic Ca2+ levels were high (thapsigargin or CCCP treatment).
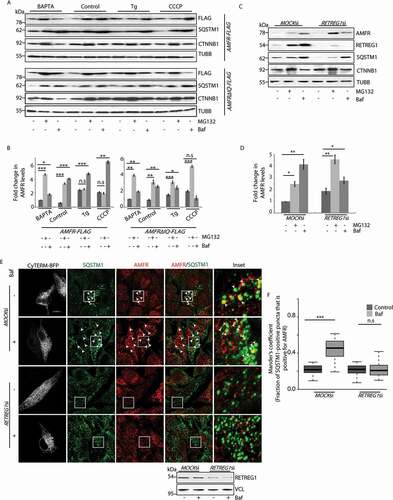
Figure 2. Autophagic degradation of AMFR is mediated by RETREG1. (A) HeLa cells transfected with AMFR-FLAG or AMFR∆IQ-FLAG were subjected to treatments with indicated drugs, lysed and analyzed by western blots for the levels of AMFR. Protein levels of CTNNB1 and SQSTM1 were used for verifying whether at the given doses MG132 and bafilomycin A1 block the proteasomal and autophagosomal pathways, respectively. TUBB was used as the loading control. (B) Histogram plotted with data from panel A was from 3 independent experiments. n.s-Not significant (p = 0.4,0.4,0.08), * p ≤ 0.05, ** p ≤ 0.01, *** p ≤ 0.001, using unpaired 2-tailed Student’s t-test. Error bars, ±SEM. (C) MOCK siRNA or RETREG1 siRNA transfected cells were treated with the indicated drugs. AMFR levels were analyzed by western blots. Note similar enrichment of proteins in cells with MOCKsiRNAs upon drug treatment. RETREG1, CTNNB1, SQSTM1 and TUBB were used as controls. (D) Graph plotted with analyses of panel C. Data represents 5 independent experiments. * p ≤ 0.05, ** p ≤ 0.01, using unpaired 2-tailed Student’s t-test. Error bars, ±SEM. (E) Cells transfected with similar siRNAs as in panel C were subjected to Baf treament or left untreated, immunostained with antibodies against AMFR and SQSTM1, and imaged. The ER was marked by CyTERM-BFP. Images are 3D-projections obtained from z-stacks using ImageJ. Enlarged views of the areas within the white boxes are also shown (insets); arrowheads indicate colocalization between AMFR and SQSTM1. Efficiency of RETREG1 depletion was verified by immunoblotting; VCL was used as loading control. Scale bar: 5 μm. (F) Images from panel E were analyzed by using the Coloc2 plugin in Fiji to calculate Mander’s coefficient that measures SQSTM1 pixels, which were also positive for AMFR in 120 ROIs taken from 85 cells over 5 independent experiments. n.s-Not significant (p = 0.55), ***p < 0.001, using unpaired 2-tailed Student’s t-test
It is known that MGRN1-mediated proteasomal degradation of AMFR is perturbed in the presence of high cytosolic Ca2+ or when the cytosolic ligase is functionally compromised [Citation32]. Hence, we checked if MGRN1 depletion promoted autophagosomal degradation of AMFR. Comparing AMFR levels across HeLa cell lysates showed MGRN1-depleted samples had higher levels of AMFR in presence of bafilomycin A1 than those with MG132. In control cell, treatment with either of the drugs induced AMFR accumulation (Figure S4 C and S4D). On the contrary, when MGRN1 was overexpressed in HeLa cells, we detected a pronounced increase in AMFR levels in lysates with MG132, suggesting that proteasomal degradation was preferred over the autophagic pathway (Figure S4E and S4 F). This is a cell line-independent phenomenon as similar results were obtained in SHSY5Y cells (Figure S4 G and S4 H). AMFR mRNA levels were not significantly affected by changes in MGRN1 expression (Figure S4I and S4 J).
These suggest a dual mode of degradation of this ER E3 ligase, the choice of pathway depends on the physiological context of the cell. This is probably due to multiple reasons: first, elevated levels of AMFR are detrimental for the cell as it stimulates degradation of some mitochondrial proteins and perpetuates mitophagy [Citation31,Citation32]; secondly, higher levels of AMFR could also increase cellular ERAD [Citation37] and lack of it leads to acute ER stress [Citation40]. It may be argued that since AMFR is an autocrine motility factor receptor, its internalization could lead to degradation at the lysosomes. While it is known that AMFR is internalized upon stimulation with GPI/AMF [Citation41], there is no evidence so far to suggest autophagosomal degradation of ER-localized AMFR.
We next tried to establish a plausible mechanism by which AMFR protein gets degraded by autophagy. RETREG1 and other members of this reticulon protein family are ER-resident receptors that promote degradation of this organelle by autophagy (termed, ‘reticulo/ER-phagy’). RETREG1 potentiates reticulophagy by binding to the autophagy modifier LC3 [Citation18]. As AMFR is also an ER membrane protein, we speculated that RETREG1 could be instrumental in its degradation. RETREG1-depleted HeLa cells showed preferential accumulation of AMFR in MG132-treated samples when compared with the controls (). This indicated that autophagy is the preferred mode of degradation for AMFR in the presence of RETREG1; its depletion led to proteasomal degradation of AMFR. The 3D projections of immunostained HeLa cells also suggested a similar phenomenon. RETREG1-depleted cells had significantly lesser number of SQSTM1-positive AMFR puncta than the controls (); the ER was marked by CyTERM-BFP. This effect was amplified in the presence of bafilomycin A1. AMFR mRNA levels were not significantly affected by changes in RETREG1 expression (Figure S4 K and S4 L). Similarly, mRNA levels of RETREG1 remained unperturbed when AMFR was knocked down (Figure S4 M). Thus, these results cumulatively emphasize that AMFR gets degraded by selective autophagy of the ER and probably by a RETREG1-dependent pathway.
LC3 binding motif of RETREG1 is essential for autophagic degradation of AMFR
Next, we found that the LC3 binding motif of RETREG1 was essential for the autophagy-dependence of AMFR. It is already known that RETREG1ΔLIR lacks LC3-binding ability and does not participate in reticulophagy [Citation18]. RETREG1-depleted cells were transiently transfected with the indicated constructs to check their ability to restore autophagosomal degradation of AMFR. Cells were left untreated or subjected to treatment with MG132 or bafilomycin A1. Autophagy block in cells with exogenous RETREG1 led to AMFR accumulation. Instead, when the RETREG1 mutant (RETREG1ΔLIR) was used, treatment with bafilomycin A1 did not lead to accumulation of AMFR. Proteasomal block with MG132 led to increased levels of AMFR in control cells and those with RETREG1ΔLIR (). These results were corroborated by imaging studies with HeLa cells. Bafilomycin A1-treated RETREG1-overexpressing cells had significantly higher number of AMFR-positive SQSTM1 puncta when compared with the controls or those with RETREG1ΔLIR (); the ER was marked by CyTERM-BFP. Importantly, the turnover of AMFR was significantly impaired in cells with compromised RETREG1 ().
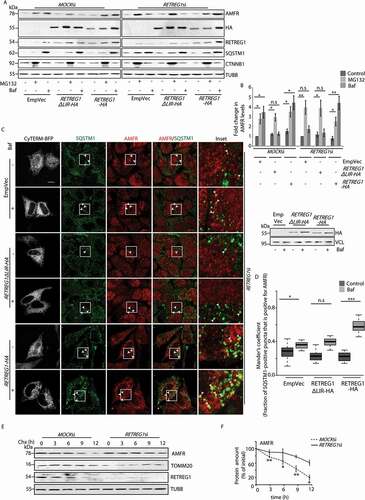
Figure 3. LC3 binding motif of RETREG1 is essential for autophagic degradation of AMFR. (A) MOCK or RETREG1 siRNAs-treated HeLa cells were transfected with RETREG1-HA, FAM134ΔLIR-HA or control vectors. Cells were then treated with the indicated drugs, lysed and immunoblotted against AMFR. Note: elevated levels of AMFR in Baf-treated RETREG1-HA-expressing cells unlike the other sets where the E3 ligase was enriched in MG132 samples. HA, RETREG1, SQSTM1 and TUBB were used as controls. The difference in migration pattern of RETREG1ΔLIR-HA is likely due to the presence of negatively charged amino acid residues when compared with RETREG1-HA. Antibody against RETREG1 could not detect HA-tagged RETREG1 or RETREG1ΔLIR. (B) The fold-changes in AMFR from data analyzed in panel A plotted from 8 independent experiments. n.s-Not significant (p > 0.7), * p ≤ 0.05, ** p ≤ 0.01 using unpaired 2-tailed Student’s t-test. Error bars, ±SEM. (C) Cells similarly treated as in panel A were transfected with CyTERM-BFP and immunostained for AMFR and SQSTM1, and imaged. Images are 3D-projections obtained from z-stacks using ImageJ. Enlarged views of the areas within the white boxes are also shown (insets); colocalization between the two proteins indicated by arrowheads. Transfection efficiencies of RETREG1-HA and RETREG1ΔLIR-HA were confirmed by immunoblotting with anti-HA antibody; VCL was used as loading control. Scale bar: 5 μm. (D) Graph representing the number of AMFR-positive SQSTM1 puncta per cell was plotted with data from panel C. Mander’s coefficient represents the fraction of SQSTM1-positive puncta that were positive for AMFR in 135 ROIs taken from 80 cells over 4 independent experiments. n.s-Not significant (p = 0.15), *p < 0.05, ***p < 0.001, using unpaired 2-tailed Student’s t-test. (E) Lysates from cells transiently transfected with MOCKsiRNAs or RETREG1siRNAs and treated with cycloheximide (Chx, 100 μg/ml) for indicated periods of time. Western blot analyses show change in AMFR levels across samples over time. The levels of TOMM20, RETREG1 and TUBB serve as loading controls. (F) Graph quantifying these data shows results from 3 independent experiments. Error bars, ±SEM. The significance was calculated between each data point (n) and (n-1). n.s-Not significant, *p < 0.05, **p < 0.01, using unpaired 2-tailed Student’s t-test. Note that with RETREG1 knockdown, change in AMFR levels were not significant (with 0.07 ≥ p ≤ 0.8)
RETREG1 potentiates autophagic degradation of IMM
It is well-established that overexpression of functional AMFR leads to ubiquitination of mitofusins, promoting their degradation [Citation31]. This also results in enhanced mitophagy [Citation31,Citation32]. Our initial results indicate that overexpression of AMFR destabilizes the mitochondria. Hence, it was logical to verify the fate of mitochondrial proteins. In control cells, bafilomycin A1 treatment led to the enrichment of IMM proteins (OPA1 and STOML2) when compared with the untreated samples (). These IMM proteins did not elicit bafilomycin A1 dependence in RETREG1-depleted samples. Exogenous expression of RETREG1 restored bafilomycin A1-dependent IMM protein accumulation. Instead, RETREG1ΔLIR did not lead to similar enrichment of IMM proteins. Irrespective of the RETREG1 status, the OMM protein (MFN1 and TOMM20) levels did not show bafilomycin A1 dependence. MFN1 levels decreased with RETREG1 depletion (due to high AMFR level). These results re-iterate that the IMM proteins require RETREG1 for their degradation at the autophagosomes, while those of the OMM do not. Like AMFR (), the turnover of OPA1 and STOML2 was also significantly impaired in cells with compromised RETREG1 (). However, the turnover of MFN1 remained unaffected by RETREG1 depletion (). RETREG1 knockdown did not significantly alter the mRNA levels of OPA1 (Figure S4 N). RETREG1 knockout HeLa, SHSY5Y and retreg1 knockout MEF cells showed elevated protein levels of AMFR and OPA1, unlike the controls; MFN1 levels were reduced in samples with RETREG1 knockout (Fig S4O). retreg1 knockout MEF cells overexpressing AMFR showed further enrichment of OPA1 when treated with bafilomycin A1. Together, these results suggest a role of RETREG1 in regulating the protein levels of AMFR and the IMM proteins and not their transcripts.
Figure 4. LC3 binding motif of RETREG1 is essential for autophagic degradation of IMM proteins. (A) MOCK or RETREG1 siRNAs-treated HeLa cells were transfected with RETREG1-HA, RETREG1ΔLIR-HA or control vectors. Cells were then treated with Baf or left untreated, lysed and immunoblotted against the indicated antibodies. Note: exogenous expression of RETREG1-HA in cells depleted with siRNAs against RETREG1 rescued the expression patterns of mitochondrial proteins similar to controls. HA, RETREG1, SQSTM1 and TUBB served as controls. (B) Graphs indicate fold-change of all mitochondrial proteins analyzed in panel A. Data analyzed from 7 independent experiments. n.s- Not significant (p > 0.2 for OPA1, p > 0.5 for STOML2, p ≥ 0.2 for MFN1, p ≥ 0.1 for TOMM20. * p ≤ 0.05 using unpaired 2-tailed Student’s t-test. Error bars, ±SEM. (C) Similar experiment as in panel E was performed to check for the protein levels of OPA1 and STOML2 by western blot analyses across samples over time. The levels of TOMM20, RETREG1 and TUBB serve as loading controls. (D) Graphs quantifying these show results from 3 independent experiments. Error bars, ±SEM. The significance was calculated between each data point (N) and (n-1). n.s-Not significant, *p < 0.05, ***p < 0.001, using unpaired 2-tailed Student’s t-test. Note that with RETREG1 knockdown, change in OPA1 levels were not significant (with 0.1 ≥ p ≤ 0.3), change in STOML2 also followed a slower kinetics. (E) Similar experiment as in panel C was performed for the indicated periods of time to validate the protein levels of MFN1. TUBB serves asloading control. (F) Graph quantifying results from panel E. Data represents 3 independent experiments. Error bars, ±SEM. The significance was calculated as in panel D. n.s-Not significant, using unpaired 2-tailed Student’s t-test. Note that with REGREG1 knockdown, change in MFN1 levels was not significant (with 0.1 ≥ p ≤ 0.3)
Proteasomal degradation of MFN1 has been shown to require recruitment of VCP to the mitochondria [Citation42]. The dominant-negative mutant, VCPQQ (VCPE305Q, E578Q; deficient in its ATPase activity and hence inhibits VCP-mediated retrotranslocation) was used for comparison. In cells with VCPQQ, MFN1 levels remained unaltered in the presence of MG132, clearly indicating that VCP activity was essential for MFN1 degradation via the proteasome (Figure S5A and S5B). Bafilomycin A1 treatment led to enrichment of OPA1 and STOML2 levels in presence of VCP; though an increase in their levels was also detected in MG132-treated samples. Their autophagosomal degradation was compromised in the presence of VCPQQ – probably because the OMM was intact. AMFR degradation by either of the pathways did not show VCP-dependence.
To measure the autophagy degradation competence, cells were treated with rapamycin and assayed for clearance of LC3 before and after drug withdrawal. Rapamycin treatment increased the LC3-II:I ratio in controls as well as RETREG1-depleted cells. In controls, the drug withdrawal led to a significant reduction in the LC3-II:I ratio and an increase in AMFR and OPA1 protein levels. However, in RETREG1-depleted cells, AMFR and OPA1 did not significantly alter with either rapamycin treatment or its withdrawal (Figure S5 C). Again, suggesting that autophagic degradation of AMFR and OPA1 occurs in the presence of RETREG1. As previously reported, RETREG1 depletion did not alter the general autophagy degradation competence (Figure S5 C [Citation18],). It is suggested that mitochondrial proteins, like FKBP8/FKBP38 and BCL2 (members of the OMM), get repartitioned into the ER during conditions of stress [Citation43]. This could be a plausible reason for the apparent discrepancy in the degradation pattern of the IMM and OMM proteins. Together, our results so far indicate that a part of the mitochondria (the IMM) along with the ER E3 ligase (AMFR) gets degraded via autolysosomal degradation; this is potentiated by the ER-resident autophagy receptor RETREG1. AMFR here is a mitochondria destabilizing agent and acts as a co-factor of RETREG1 in potentiating mitophagy. This would imply the requirement of a cognate partner (or an adaptor molecule) on the mitochondria for RETREG1 to interact.
ER and IMM are closely apposed during mitophagy
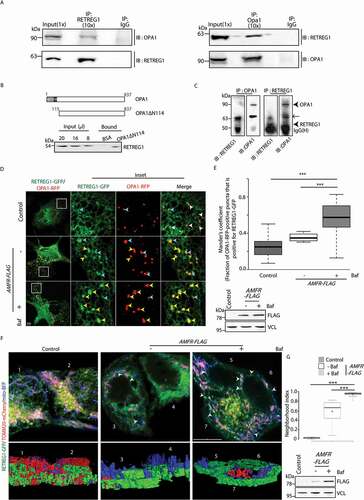
To test this hypothesis, it was obvious to check if proteins of the IMM and autophagy associated ER proteins interact. Protein interactors of RETREG1 and RTN3 collected from a previous study [Citation20] were compared to reveal that RETREG1 could probably interact with OPA1, among a few other IMM target proteins (Figure S6). This exercise suggested a plausible interaction of PHB2, a recently identified IMM receptor involved in mitophagy [Citation44], with both RETREG1 and RTN3. On the contrary, OPA1 was found to specifically associate with RETREG1 (Figure S6A and S6B). A similar scan with yet another reticulophagy receptor, CCPG1 [Citation21], did not yield any mitochondrial membrane protein interactor. Further, a scan for LC3-interacting region (LIR) within the mitochondrial membrane proteins revealed that OPA1 did not contain the LIR (Figure S6 C). This suggested that degradation of OPA1 could be possible by either of the two ways – (i) via a non-LC3-mediated route, or (ii) by interacting with a LC3 binding partner for its degradation. Since enrichment of OPA1 in bafilomycin A1-treated samples was already detected, the second possibility seemed more logical. We next tested if OPA1 was the IMM adaptor interacting with RETREG1. The interaction between these two proteins could be demonstrated biochemically in three ways. First, it was validated by co-immunoprecipitation studies between OPA1 and RETREG1 in mouse brain and HeLa cell lysates (, S6D and S6E). Secondly, RETREG1 from a detergent-solubilized crude brain lysate could be pulled down more efficiently by immobilized recombinant truncated OPA1 (OPA1ΔN114) than the immobilized BSA control (). The first 114 amino acids were deleted to remove the matrix-targeting signal (MTS) and transmembrane (TM) domains of OPA1 [Citation45]. This reduced the complexity of its purification while still retaining the domain exposed to the IMS and likely to interact with RETREG1. Thirdly, in vitro-expressed RETREG1 interacted with recombinant OPA1ΔN114 (). This was further confirmed by live-cell imaging studies, which showed significant colocalization between OPA1-RFP and RETREG1-GFP in the presence of exogenous AMFR when compared with the control; this effect was enhanced in the presence of bafilomycin A1 treatment (). However, similar colocalization between OPA1 and RETREG1 was not observed in AMFR-depleted cells or the presence of AMFR RINGmut; bafilomycin A1 did not significantly affect either of these phenotypes (Figure S7A and S7B).
Figure 5. RETREG1 and OPA1 interact during reticulo-mitophagy. (A) Mouse brain lysates were immunoprecipitated with indicated antibodies. Western blot analyses show co-immunoprecipitation of endogenous RETREG1 with OPA1. Reverse co-immunoprecipitations validate the interaction. IP indicates “immunoprecipitate”. Proportion of lysate loaded as input and used for immunoprecipitation are denoted in brackets by ‘X’. (B) Line diagram showing the part of full-length OPA1 that was deleted to generate the recombinant OPA1ΔN114. A detergent lysate of normal adult mouse brain was passed over immobilized BSA or recombinant OPA1ΔN114, and the bound products, along with different amounts of input brain lysate, were analyzed by immunoblot for RETREG1. (C) For in vitro co-immunoprecipitation, bacterial pellet lysate with recombinant full-length His-tagged RETREG1 was combined with recombinant OPA1ΔN114 (refer Materials and Methods). Note that reverse co-immunoprecipitation validates interaction. Since bacterial pellets were used as the source for the recombinant full-length RETREG1, this reticulon family protein was in an enriched but not pure form. Perhaps, due to this, a bacterial periplasmic folding chaperone with an inactive PPIase domain (~63 kDa) from the E. coli BL21 (DE3) was also co-immunoprecipitated. ← periplasmic protein in bacteria, recombinant RETREG1 and OPA1ΔN114. (D) HeLa cells were transfected with RETREG1-GFP and OPA1-RFP along with EmpVec or AMFR-FLAG. Note: increased colocalization between the two proteins upon overexpression of AMFR. Enlargedviews of the images (insets) are also shown; Baf treatment enhances this effect. Vesicles indicated by arrowheads (yellow – colocalization between RETREG1-GFP and OPA1-RFP, cyan – partial overlap, and white – no colocalization). AMFR expression was verified by immunoblotting; VCL was used as loading control. Scale bar: 5 μm. Note an abundance of white arrowheads in the control shows lack of colocalization between RETREG1-GFP and OPA1-RFP; AMFR overexpression leads to increase in partial (cyan) or complete (yellow) overlap between the two signals. (E) Images from panel D were analyzed by using the Coloc2 plugin in Fiji to calculate Mander’s coefficient that measures RETREG1-GFP pixels, which were also positive for OPA1-RFP in 180 ROIs taken from ~93 cells over 5 independent experiments. ***p < 0.001, using unpaired 2-tailed Student’s t-test. (F) Cells transfected with AMFR-FLAG or EmpVec along with RETREG1-GFP, mito-BFP and TOMM20-mCherry were either treated with Baf or left untreated and imaged under live-cell conditions. Control cells were left untreated. Images are 3D-projections obtained from z-stacks using ImageJ. Co-expression of RETREG1-GFP (ER), mito-BFP (IMM) indicated by white arrowheads. ~75 cells from 5 independent experiments were analyzed. Immunoblot of the lysates post imaging were probed with anti-FLAG and anti-VCL antibodies confirm AMFR transfection and loading. Bottom panel depicts snapshots of 3D reconstructed images generated by rotating them ~90° on the Y-axis; cells numbered for ease of visualization. Scale bar: 5 μm. (G) Box plot representations of the neighborhood index of RETREG1-GFP structures representing ER within close proximity (roughly 94 nM radius neighborhood) of the IMM boundary marked by mito-BFP signal, analyses of images in panel A. *** p ≤ 0.001 using unpaired 2-tailed Student’s t-test
We further evaluated the validity of the interaction between OPA1 and RETREG1 in two physiologically relevant situations. In presence of high cytosolic Ca2+, when treated with thapsigargin or CCCP, cells showed significant colocalization between OPA1-GFP and RETREG1-RFP compared with the controls (untreated or with BAPTA) (Figure S8A). We next assessed the pathological pertinence of this phenotype. MGRN1 is suggested to interact with an aberrant metabolic isoform of the expressed cell surface glycoprotein, mammalian prion protein (referred to as CtmPRNP). Increased generation of CtmPRNP is known to cause spongiform neurodegeneration in animal models [Citation46,Citation47] and also affects the activity of MGRN1 in cell culture systems [Citation48]. CtmPRNP is enriched in cells either by expressing artificial constructs (PRNPKH-II or SA-PRNP) or through a naturally occurring human disease variant (PRNPA117 V). Expression of the CtmPRNP-generating constructs results in elevated protein levels of AMFR, due to its compromised degradation by MGRN1, along with increased formation of mitophagophores [Citation32]. Here again, live-cell imaging studies showed significant colocalization between OPA1-GFP and RETREG1-RFP in the presence of CtmPRNP when compared with the wild type PRNP control (Figure S8B).
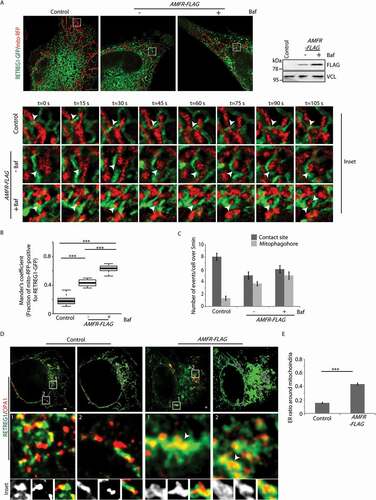
Results so far suggest that in stressed cells, mitochondria are destabilized and the IMM is exposed. This facilitates RETREG1-OPA1 interaction and promotes the formation of mitophagophores. For this, the ER and the IMM should be in close proximity. To verify this, HeLa cells were transfected with mito-BFP, TOMM20-mCherry, RETREG1-GFP. In AMFR-overexpressed cells, RETREG1-GFP was detected in close proximity of mito-BFP-positive “mitoplasts” ( and S8 C). Bafilomycin A1 treatment significantly increased the number of ER structures (RETREG1-GFP) in the vicinity of the IMM (mito-BFP) than the untreated cells (). 3D reconstruction of these images corroborated the results (Movies M1-M3). Controls did not show RETREG1-GFP and IMM in close proximity. As before, elongated mitochondria were detected in control cells while they were dissembled and fragmented in presence of exogenous AMFR. RETREG1 in the vicinity of mito-BFP was also detected in Cos7 cells with high cytosolic Ca2+ (thapsigargin- or CCCP-treated) when compared with the controls (untreated or with BAPTA) (Figure S9A and S9B). 3D reconstruction of the images corroborated these results. Further, live-cell imaging studies showed that in AMFR-overexpressing cells, the ER engulfed the mitochondria and led to the formation of an ER-mitophagophore (). Bafilomycin A1 treatment enhanced the propensity of such events. In control cells, these events were rare or absent. In controls, while ER-mitochondria contact sites could be detected, these did not culminate in mitophagophore formation ().
Figure 6. ER forms mitophagophore around “mitoplasts”. (A) Cells transfected with AMFR-FLAG or EmpVec along with RETREG1-GFP and mito-RFP were either treated with Baf or left untreated and imaged under live-cell conditions for 5 min. Control cells were left untreated. Enlarged views of the areas within the white boxes over the indicated time-points are also shown. Contact between RETREG1-GFP and mito-RFP indicated by white arrowheads. Note the successful formation of mitophagophore by ER in the presence of AMFR. Immunoblot of the lysates post-imaging were probed with anti-FLAG and anti-VCL antibodies confirm AMFR transfection and loading. ~35 cells from 3 independent experiments were analyzed. Scale bar: 5 μm. (B) Mander’s coefficient shows the fraction of mito-RFP positive for RETREG1-GFP in 90 ROIs. ***p < 0.001, using unpaired 2-tailed Student’s t-test. (C) Graph showing the number of indicated events per cell over 5 min from cells analyzed in panel A was plotted. (D) Cells transfected with AMFR-FLAG or EmpVec along with RETREG1-HA and OPA1-GFP were fixed, immunostained and imaged by STED super-resolution microsopy. Enlarged views of the areas within the white boxes are indicated. Note: increased presence of ER-mitophagophores in cells with AMFR as marked by white arrowheads. 8 cells from 2 independent experiments were imaged. Right panel for each cell depicts 2D reconstructed images; RETREG1 in green (ER), OPA1 in red (mitochondria) and overlap between the two in purple. Scale bar: 1 μm. (E) Histogram plotting the ER ratio around mitochondria was plotted by analyzing STED images. At least 400 mitochondria were analyzed. *** p ≤ 0.001 using unpaired 2-tailed Student’s t-test
Subsequently, using stimulated emission depletion (STED) microscopy (with achievable ~35-40 nm resolution in biological samples) [Citation49,Citation50], we detected OPA1 puncta inside RETREG1-positive vesicles upon overexpression of AMFR. These vesicles were significantly lesser in the control samples without AMFR ().
AMFR and IMM proteins are detected in autophagosomes
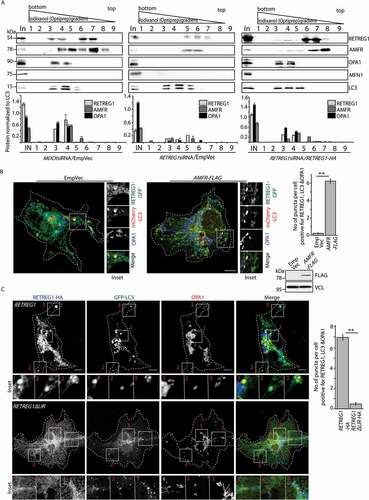
To establish the identity of the ER-engulfed mitochondrial vesicles, cell lysates were fractionated. Subcellular fractions enriched for LC3-positive vesicles showed presence of AMFR and OPA1 in MOCK siRNA-treated samples. These fractions were also enriched for RETREG1. However, in samples from RETREG1-depleted cells, OPA1 could not be detected; RETREG1 and AMFR levels were drastically low. Exogenous expression of RETREG1 again led to enrichment of AMFR and OPA1 in LC3-positive vesicular fractions, suggesting that overexpressed RETREG1 rescued the phenotype. MFN1, however, could not be detected in these LC3-positive vesicular fractions (). Immunocytochemistry of Cos7 cells exogenously expressing AMFR, showed increased colocalization between OPA1, mCherry-LC3 and RETREG1-GFP when compared with control cells (). To further validate that autophagosomal degradation of OPA1 required LC3 binding of RETREG1, cells transfected with AMFR and GFP-LC3 along with HA-tagged RETREG1 or RETREG1ΔLIR were immunostained and imaged. Immunocytochemistry showed presence of OPA1-positive puncta inside RETREG1 and LC3-positive vesicles. However, vesicles positive for RETREG1, OPA1 and LC3 could not be detected in cells with RETREG1ΔLIR ().
Figure 7. AMFR and IMM proteins are located in autophagosomes. (A) Cos7 cells treated with MOCK or RETREG1 siRNAs for 48 h were transfected with RETREG1-HA or control vector, followed by Baf treatment. All samples were fractionated using a 60% iodixanol (OptiPrep) gradient. Fractions of 450 μl (lanes numbered 1 through 9) were collected from the bottom to the top. Fractions were immunoblotted against LC3, RETREG1 (or HA), OPA1, MFN1 and AMFR. Note that RETREG1-depleted cells have less AMFR and OPA1 in LC3-positive fractions, these proteins could again be detected upon exogenous expression of RETREG1-HA; MFN1 detected only in whole-cell lysate (In). Distribution of LC3 was similar across the 3 samples. Graphs show the distribution of the proteins RETREG1, OPA1, AMFR and MFN1 in the samples normalized to LC3 levels; the numbers in the graphs correspond to the lane numbers in the blots above. Data represent means ±SEM from 3 independent experiments. Antibody against RETREG1 could not detect HA-tagged RETREG1; hence antibody against HA was used for the rescue experiment with RETREG1-HA. (B) Cells transfected with RETREG1-GFP and mCherry-LC3 along with AMFR-FLAG or EmpVec were immunostained against OPA1 and imaged. Histogram plotting the number of puncta per cell positive for OPA1, LC3 and RETREG1. Immunoblot of the lysates post imaging were probed with anti-FLAG and anti-VCL antibodies confirm AMFR transfection and loading. ~35 cells from 4 independent experiments were analyzed. Error bars, ±SEM. ** p ≤ 0.01 using unpaired 2-tailed Student’s t-test. Scale bar: 5 μm. (C) Cells transfected with AMFR-FLAG and GFP-LC3 along with HA-tagged RETREG1 or RETREG1ΔLIR were immunostained against HA and OPA1, and imaged. Histogram plotting the number of puncta per cell positive for OPA1, LC3 and RETREG1. ~40 cells from 5 independent experiments were analyzed. Error bars, ±SEM. Note lesser number of vesicles positive for all three proteins in cells with RETREG1ΔLIR. ** p ≤ 0.01 using unpaired 2-tailed Student’s t-test. Scale bar: 5 μm
To further validate the interaction between OPA1 and RETREG1, Cos7 cells depleted of OPA1 were analyzed for their mitochondrial DNA content [Citation51]. In spite of AMFR overexpression, significantly higher amounts of mitochondrial DNA were present in OPA1 knockdown when compared with the controls (Figure S9 C). Similarly, HeLa cells were also monitored for the presence of mitoplasts in RETREG1-positive SQSTM1 vesicles (Figure S9D). Cells were transfected with mito-RFP to detect mitochondria/“mitoplasts” in the absence of OPA1. In control cells, AMFR overexpression led to an increase in the number of SQSTM1 vesicles positive for RETREG1-GFP and mito-RFP as before. A significant decrease in the number of such vesicles was detected in OPA1-depleted cells, even with AMFR overexpression. The numbers of RETREG1-GFP-positive SQSTM1 puncta were similar across samples with high levels of AMFR, irrespective of the OPA1 status (Figure S9D). Thus, OPA1 was required for successful reticulo-mito-phagy events in AMFR-overexpressing cells. This IMM protein was, however, not required for the autophagosomal turnover of AMFR (Figure S9E).
Our results so far led us to propose a direct interaction between RETREG1 and OPA1, especially when AMFR protein levels are high. For clearance of “mitoplasts” from cells, OPA1 acts as an adaptor for the LIR-containing autophagy/mitophagy receptor RETREG1. A simultaneous degradation of the co-factor AMFR would lower its levels in cells to bring back normalcy. It must be stated that RETREG1 assisted autophagosomal degradation of AMFR and OPA1 could be via separate autophagosomes – the three proteins need not populate the same degradative compartment simultaneously. Nevertheless, they should all finally end up in lysosomes.
AMFR and IMM proteins are detected in lysosomes
Hence, we decided to check whether these molecular players could be identified in lysosomes (). For this, cells combinatorially treated with lysosomal blockers (E64D, pepstatin A and leupeptin) were lysed and fractionated to enrich lysosomes [Citation52]. Increased levels of AMFR, OPA1 and RETREG1 were detected in presence of lysosomal blockers; the corresponding fractions also showed elevated LAMP1 levels (). AMFR, OPA1 and RETREG1 could be detected in the control samples also but not to the same extent. MFN1 however could not be detected in the lysosomal fractions in either of the experimental conditions. The enhanced detection of the shorter isoforms of OPA1 in the presence of the lysosomal blockers re-iterated a loss of mitochondrial homeostasis. Previous reports state that a balance between the long membrane-bound forms of OPA1 (L-OPA1) and its shorter soluble isoforms (S-OPA1) exist in healthy mitochondria, a key player in maintaining the fusion-fission dynamics of the organelle [Citation53].
Figure 8. AMFR and IMM proteins are detected in lysosomes. (A) HeLa cells either treated combinatorially with 10 μM leupeptin, 10 μM pepstatin A and 1 μM E64D for 24 h or left untreated were lysed, fractionated to enrich lysosomes and analyzed by western blots for the indicated proteins. Input – unfractionated whole-cell lysate. (B) The scatter plot gives a graphical overview of the amount of proteins in the respective fractions for AMFR, OPA1, RETREG1, and LAMP1 under the experimental conditions in panel A. The red box marks the lysosome-enriched fractions. ‘Lyso blockers’ denotes combinatorial drug treatment to block lysosomal activity. (C) Pie charts and table depicting mass spectrometric analyses of abundance of various proteins in lysosome-enriched fractions from MOCK or RETREG1 siRNAs-treated cells. (D) Histogram plotting the number of different mitochondrial proteins based on their localization. ** p ≤ 0.01, using unpaired 2-tailed Student’s t-test. Error bars, ±SEM. (E) MaxQuant was used to identify proteins from the peptides generated in the mass spectrometric analyses. Mean LFQ intensities were transformed to log base 2 and standard deviation between data sets was calculated using Perseus [Citation96]. Table shows comparison of LFQ intensities of indicated proteins between MOCK and RETREG1 siRNA-treated cells. Data represent 3 independent experiments. Error represents standard deviation between sets. (F) HeLa cells transfected with OPA1-GFP or MFN1-YFP along with AMFR-FLAG were fixed, immunostained for FLAG and CD63, and imaged. Images are 3D-projections obtained from z-stacks using ImageJ. Enlarged views of the areas within the white boxes are also shown (insets). AMFR-FLAG-positive CD63 puncta with OPA1-GFP are indicated by white arrowheads. Cartoon depicts method for scoring protein colocalization. Note that while AMFR-FLAG-positive CD63 puncta are present under both experimental conditions, MFN1-YFP was not detected in these structures. Scale bar: 15 μm. (G) Graph plotting Mander’s coefficient to show the fraction of CD63-positive puncta also positive for AMFR, OPA1 (IMM) and MFN1 (OMM)
![Figure 8. AMFR and IMM proteins are detected in lysosomes. (A) HeLa cells either treated combinatorially with 10 μM leupeptin, 10 μM pepstatin A and 1 μM E64D for 24 h or left untreated were lysed, fractionated to enrich lysosomes and analyzed by western blots for the indicated proteins. Input – unfractionated whole-cell lysate. (B) The scatter plot gives a graphical overview of the amount of proteins in the respective fractions for AMFR, OPA1, RETREG1, and LAMP1 under the experimental conditions in panel A. The red box marks the lysosome-enriched fractions. ‘Lyso blockers’ denotes combinatorial drug treatment to block lysosomal activity. (C) Pie charts and table depicting mass spectrometric analyses of abundance of various proteins in lysosome-enriched fractions from MOCK or RETREG1 siRNAs-treated cells. (D) Histogram plotting the number of different mitochondrial proteins based on their localization. ** p ≤ 0.01, using unpaired 2-tailed Student’s t-test. Error bars, ±SEM. (E) MaxQuant was used to identify proteins from the peptides generated in the mass spectrometric analyses. Mean LFQ intensities were transformed to log base 2 and standard deviation between data sets was calculated using Perseus [Citation96]. Table shows comparison of LFQ intensities of indicated proteins between MOCK and RETREG1 siRNA-treated cells. Data represent 3 independent experiments. Error represents standard deviation between sets. (F) HeLa cells transfected with OPA1-GFP or MFN1-YFP along with AMFR-FLAG were fixed, immunostained for FLAG and CD63, and imaged. Images are 3D-projections obtained from z-stacks using ImageJ. Enlarged views of the areas within the white boxes are also shown (insets). AMFR-FLAG-positive CD63 puncta with OPA1-GFP are indicated by white arrowheads. Cartoon depicts method for scoring protein colocalization. Note that while AMFR-FLAG-positive CD63 puncta are present under both experimental conditions, MFN1-YFP was not detected in these structures. Scale bar: 15 μm. (G) Graph plotting Mander’s coefficient to show the fraction of CD63-positive puncta also positive for AMFR, OPA1 (IMM) and MFN1 (OMM)](/cms/asset/cd41e173-ef29-4a12-8e4b-fc93bd9b5ef3/kaup_a_1783118_f0008_oc.jpg)
Detection of OPA1 in the lysosomes does not refute the argument that it could be a piece-meal degradation of certain IMM proteins that occurs via this mechanism, rather than en masse degradation of the “mitoplast.” To address this, a comparison of proteomes from lysosome enriched fractions showed that control cells had more mitochondrial proteins than samples from RETREG1-depleted cells ( and Table S1). For this, lysosomal fractions were isolated from cells that were priorly treated with a low dose of CCCP (5 μM) to induce mitophagy. The number of ER proteins was similar across samples, though AMFR levels behaved differently. One plausible reason might be the presence of other LC3 receptors on the ER that can compensate for the loss of RETREG1. In both sets, the number of IMM and matrix proteins was larger than the number of OMM proteins. This supports our hypothesis that when cells undergo stress, IMM proteins undergo autophagic degradation, while those of the OMM are primarily degraded by the proteasome (). Proteomic analyses of lysosome enriched fractions showed the presence of OPA1 in lysosomes of control cells but not in those of RETREG1-depleted cells. Controls also had higher amounts of AMFR. OMM proteins like TOMM22 were significantly less abundant and similar between the two sets ().
Imaging results showed colocalization of OPA1-GFP in AMFR-positive CD63-marked lysosomes (). MFN1-YFP, however, could not be detected in similar vesicles. These results support the hypothesis that under stress when AMFR levels are elevated, cells undergo reticulo-mito-phagy that simultaneously eliminates some ER proteins along with nonfunctional “mitoplasts” by a dual organelle regulatory mechanism.
Discussion
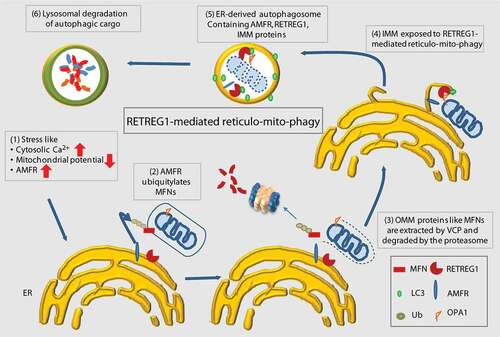
This study elucidates a unique mechanism whereby the reticulophagy receptor RETREG1 participates in a dual regulatory mechanism in removing the causative agent triggering mitophagy (AMFR) while simultaneously also clearing out the defective mitochondria. This is significant because here is an example where ER and mitochondria might increase their communications with one another under stress. This triggers a dynamic synergistic response – ER and mitochondria together get degraded en-bloc in a novel cellular quality control method. We show that cellular stress mediated by the overexpression of AMFR can be mitigated by a RETREG1-dependent autophagosomal degradation mechanism. While it is established that excess AMFR triggers mitophagy, we show that this leads to “mitoplast” generation. Autophagosomal degradation of these destabilized mitochondria is also mediated by RETREG1. For this, OPA1 from the IMM-exposed “mitoplasts” interacts with RETREG1. RETREG1 participates in the process of ER membrane wrapping of the mitochondria. Interestingly, IMM protein exhibit RETREG1-dependent autophagosomal degradation; however, the OMM proteins do not. AMFR acts as a co-factor that promotes generation of “mitoplasts”. OPA1, which gets exposed due to “mitoplast” generation acts as the adaptor for RETREG1. This eventually initiates mitophagy ().
Figure 9. Summary cartoon. Schematic diagram summarizing the results. Under conditions of stress, when the levels of AMFR are high, loss of OMM proteins destabilizes the mitochondria. RETREG1 interacts with OPA1 (at the IMM) and utilizes its LIR motif to assemble a phagophore around the mitochondria. Excess AMFR also gets degraded along with the “mitoplasts” at the lysosomes by this specialized “reticulo-mito-phagy” process
It is well-established that cytosolic Ca2+ levels affect many protein-protein interactions [Citation54–56]. During acute stress when there is high cytosolic Ca2+, the interaction between MGRN1 and AMFR is abrogated, and the intracellular levels of the ER E3 ligase increases and mitophagy sets in [Citation31,Citation32]. This is also associated with corresponding increase in ER-mitochondria junctions and disruption in the relative distribution of ER sheets and tubules [Citation37]. Hence, under such situations to lower the levels of AMFR and probably to downregulate mitophagy, an alternate mode of AMFR degradation would be essential. Preferential autophagosomal degradation of AMFR in presence of thapsigargin and CCCP supports this argument.
AMFR is known to regulate ER-mitochondria contacts and also potentiate ER-mitochondria Ca2+ coupling; while presence of GPI/AMF (glucose-6-phosphate isomerase; also known as autocrine motility factor) has an opposite effect on these contacts [Citation57]. First, it is well-established that fluctuating cytosolic Ca2+ levels affect AMFR-mediated formation and dissociation of ER-mitochondria contacts [Citation57–59]. Secondly, depletion of mitofusins leads to enhanced ER-mitochondria Ca2+ crosstalk and increased sensitivity to mitochondrial Ca2+-mediated cell death [Citation58,Citation60]. Thirdly, elevated levels of AMFR induces mitophagy; this E3 ligase ubiquitinates and degrades mitofusins via proteasomal degradation [Citation31,Citation61]. Also, phosphorylation of AMFR has been shown to affect AMFR-dependent mitofusin degradation [Citation62]. Finally, previous reports show that the ATG protein, ATG14, relocalizes to the ER-mitochondria contact site after starvation (a cellular stress) and ATG5 is identified at these junctions until the formation of the autophagosome is complete [Citation14]. Hence, when AMFR levels are high, it is plausible that the autophagosome assembly and formation occurs at the MAM junctions or ERMES. For this, the ER would contribute membrane toward the autophagophore formation and engulf destabilized mitochondria. These unstable mitochondria are depleted of mitofusins. Simultaneous degradation of AMFR at these mitophagophores would help in restoring the protein levels of this ERAD E3 ligase without employing any additional cellular mechanism.
ER among many other organelles supplies membranes toward the formation of the autophagophores [Citation63,Citation64]. Autophagosomes have also been shown to associate with specialized areas of the ER called “omegasome” [Citation65]. Electron-tomography as well as 3D-tomography has revealed that the phagophore membranes are connected with rough ER [Citation66,Citation67]. Studies have identified several ER-resident proteins as specific receptors for reticulophagy [Citation68]. In yeast, Atg39 and Atg40 serve as the reticulophagy receptors for perinuclear and peripheral ER, respectively [Citation69]. Very recently, Atg40 along with the COPII-cargo adaptor complex Sfb3/Lst1-Sec23 has been suggested to affect stress-induced reticulophagy [Citation70]. In mammals, six reticulophagy receptors have so far been identified. First, RETREG1, a reticulon family protein present on ER sheets, is crucial for maintaining ER homeostasis under stress [Citation18,Citation71]. This report suggests that depletion and excess of RETREG1 are both detrimental for ER morphology [Citation18,Citation72] and could lead to ER deformation. Secondly, RTN3 acts as a specific reticulophagy receptor for ER tubules [Citation20]. Thirdly, the translocon complex protein, SEC62, has been shown to regulate ER physiology and help recovery during stress [Citation19]. These three receptors have LC3-interacting region (LIR) or Atg8-interacting motif (AIM) to bind to Atg8. More recently, another ER-resident protein, CCPG1 (cell-cycle progression gene 1) has been identified as a non-canonical cargo receptor [Citation21]. It has the LIR motif for interaction with core autophagy proteins and “FIR” (FIP200 interacting region) motif to interact with the ULK complex [Citation21]. ATL3 utilizes GABARAP-mediated reticulophagy for selective degradation of tubular ER [Citation22]. While TEX264, a ubiquitously expressed reticulophagy receptor, can interact with either LC3 or GABARAP [Citation23]. Compartmentalization of these reticulophagy receptors into distinct ER subdomains could affect the accompanying cargo degraded [Citation73]. RETREG1-dependent autophagosomal degradation of the ER transmembrane protein, AMFR hence involves reticulophagy. The LIR motif of RETREG1 is crucial in this autophagosomal degradation of AMFR.
Reticulophagy is a regulatory mechanism to maintain ER homeostasis under conditions of stress [Citation19,Citation74]. Since ER and mitochondria are closely coupled organelles, mitochondrial turnover could likely be dependent on reticulophagy. This supposition is based on the fact that during mitophagy, OMM proteins (like FKBP8 and BCL2) translocate from the mitochondria to the ER [Citation43]. Under stress, ER-mitochondria contact sites are also known to populate ATG factors during autophagosome formation [Citation14]. Recently, it has been shown that the IMM protein, PHB2 (prohibitin 2) acts as a mitophagy receptor and is involved in targeting depolarized mitochondria for autophagic degradation [Citation44]. Likewise, in our study, when AMFR levels are high, RETREG1-mediated reticulophagy is one of the mechanisms to reestablish ER homeostasis. The high levels of AMFR likely induce VCP-mediated proteasomal degradation of the OMM proteins, mitofusins. It is already established that PRKN-mediated polyubiquitination leads to an ERAD-like extraction of proteins from the OMM (also referred to as OMMAD) by VCP and subsequent degradation by the proteasome [Citation75–79]. It is suggested that the proteolysis of OMM proteins is necessary for mitophagy [Citation75,Citation80]. The loss of mitofusins and generation of mitoplasts leads to increased association of IMM with the ER. For this, the interaction between OPA1 and RETREG1 provides a mechanism by which the unstable mitochondria are recognized and engulfed into a reticulo-mito-phagophore. Other than reticulophagy, RETREG1 has also been implicated in ER-to-lysosome-associated degradation pathway (ERLAD) for the clearance of proteasome-resistant polymers of alpha1-antitrypsin Z (ATZ) [Citation81]. RETREG1-LC3-II complexes are involved in this process, where ER-derived vesicles fuse with and release their contents into endolysosomes. Unlike reticulophagy, ERLAD does not involve ER capture within autophagosomes. Here, we show an amalgamation of both these mechanisms where ER-derived autophagophores form around mitoplasts by RETREG1-OPA1 interaction, and clearance of the cargo requires RETREG1-LC3 binding. A very recent report suggests the involvement of RETREG1-mediated reticulophagy in eliminating misfolded procollagens from the ER lumen via the ER-resident lectin chaperone, CANX (calnexin) [Citation82]. This provides an example where RETREG1 acts at the juncture of ER protein quality control and selective autophagy of specific proteins. RETREG1-mediated turnover of the ERAD E3 ligase AMFR, together with the mitoplasts generated, as discussed here, hence contributes another example of crosstalk between the two quality control mechanisms.
Our study possibly demonstrates one of the mechanisms where ERMES-mediated formation of mitophagophore requires AMFR as the trigger, RETREG1 as the ER molecular player and OPA1 as its mitochondrial counterpart. The RETREG1-mediated ER membrane wrapping of “mitoplasts” as detected here is possible due to the presence of its reticulon-homology domain (RHD) responsible for inducing high-membrane curvatures and vesicle formation [Citation83]. The process of “reticulo-mito-phagy” would help in getting rid of unstable “mitoplasts”, downregulate high AMFR levels as well as restore ER and mitochondrial homeostasis. The E3 ligase, AMFR emerges as the co-factor in this specialized quality control process where it initially destabilizes the mitochondria; RETREG1 then mediates formation of the mitophagophore and potentiates dual organellar degradation.
It would be crucial to study the other likely conditions when “reticulo-mito-phagy” occurs, especially under pathological conditions. It is already established that functional sequestration of MGRN1 by disease-causing CtmPRNP mutants [Citation48] yields similar results as in the presence of high cytosolic Ca2+ [Citation32,Citation84]. High levels of AMFR and enhanced mitophagophore formation in the presence of CtmPRNP mutants [Citation32] thus seemed plausible where selective autophagy of AMFR and increased reticulo-mito-phagy could get initiated. Increased interaction between RETREG1 and OPA1 in the presence of CtmPRNP and familial prion disease-causing mutants supports this hypothesis. Impaired proteostasis, accumulation of misfolded proteins and abundance of cytosolic inclusion bodies, eventually leading to compromised neuronal survival and progressive neuronal degeneration have been linked to functional depletion of RETREG1 [Citation85–89]. Hence, in the future, it would be interesting to extrapolate our study on reticulo-mito-phagy to other neurodegenerative diseases where ER stress and hence high cytosolic Ca2+ are commonly prevalent.
Materials and methods
Constructs, antibodies and reagents
MGRN1, RFP-tagged MGRN1, PRNP constructs and pCDNA4.1 (a gift of Ramanujan S Hegde, Cambridge, UK) have been described previously [Citation36,Citation48]; mito-RFP, FLAG-tagged-AMFRΔIQ has been described previously [Citation37]; MFN1-YFP has been described previously [Citation32]. HA-tagged-RETREG1 (referred to as RETREG1-HA) and HA-tagged-RETREG1-mutLIR (referred to as RETREG1LIR-HA) were gifts of Ivan Dikic (Frankfurt, Germany); mito-BFP and TOMM20-mCherry were derived from Addgene (55,146; deposited by Michael Davidson); pCMV3-mRETREG1-GFPSpark and pCMV3-mRETREG1-HA constructs were procured from Sino Biological Inc. (MG5A3310-ACG, MG5A3310-CY respectively); FLAG-tagged AMFR, FLAG-tagged RING mutant AMFR, and AMFR-IRES-GFP were gifts of Ivan Nabi (Vancouver, Canada); pAcGFP1-Mito (mito-GFP) was a gift of Subrata Banerjee (Kolkata, India); pDEST-EGFP C mOPA1 (referred as OPA1-GFP) was gifted by Kjetil Tasken (Oslo, Norway); VCP/p97 and VCPQQ were gifts of Yihong He (Bethesda, USA); CyTERM–BFP was a gift from Erik Snapp (Ashburn, USA); SYNJ2BP/OMP25-GFP was a gift of Ramanujan S Hegde (Cambridge, UK). RETREG1-RFP,mCherry-LC3 and OPA1-RFP were generated using standard cloning techniques. OPA1ΔN114 was generated by cloning residues 115–837 of OPA1 into pRSET-A vector (a gift of Ramanujan S Hegde, Cambridge, UK). GFP-LC3 was a gift of Nitai P Bhattacharyya (Kolkata, India)
Antibodies were from the following sources: AMFR/GP78 (Santa Cruz Biotechnology, sc-166,358), MFN1 (Abcam, ab57602), OPA1 (a, Thermo Fisher Scientific, MA5-16,149 and b, BD Transduction Laboratories, 612,607), TUBB/β-tubulin (Abcam, ab7792), CTNNB1/β-catenin (Abcam, ab6302), ACTB/β-Actin (Abcam, ab8226), TOMM70 (Abcam, ab83841), GAPDH (Abcam, ab8245), CYCS/cytochrome c (Abcam, ab110325), RETREG1/FAM134B (Abcam, ab151755), STOML2 (Abcam, ab191884), TOMM20 (Abcam, ab56783), SQSTM1/p62 (Thermo Fisher Scientific, PA20839), HA (Novus Biologicals, MAB0601), LC3 (Novus Biologicals, NB100-2220), LAMP1 (H4A3 clone, Developmental Studies Hybridoma Bank, University of Iowa), CD63 (BD Pharmingen, 556,019), VCL (vinculin; Abcam, ab129002), The MGRN1, GFP and FLAG antibodies were gifts of Ramanujan S Hegde (Cambridge, UK).
MG132 (C2211), rapamycin (R0395), cycloheximide (C7698), CCCP (C2759), bafilomycin A1 (B1793), pepstatin A (P5318), leupeptin (L2884), E-64D (E8640), thapsigargin (T9033) and BAPTA-AM (A1076) were from Sigma Aldrich; Universal FastStart Syber Green Master (Rox) was from Roche, TRIzol reagent was from Invitrogen. Drug treatments used in the study is as follows: MG132 (25 µM, 4 h), CCCP (20 µM, 4 h), BAPTA-AM (20 µM, 4 h), bafilomycin A1 (300 nM,10 h), thapsigargin (400 nM, 6 h), E-64d (1 μM, 24 h), pepstatin A (10 μM, 24 h) and leupeptin (10 μM, 24 h), cycloheximide (100 μg/ml), rapamycin (200 nM, 24 h) unless otherwise indicated.
Cell culture and transfection
Cell lines used for the experiments were HeLa (human cervical cancer cell line), SHSY5Y (human neuroblastoma cell line), Cos7 (monkey kidney fibroblasts) and MEF (mouse embryonic fibroblasts). Maintenance of cells in culture was as before [Citation36]. Briefly, cells were grown in 10% fetal bovine serum (FBS; Gibco, Grand Island, NY, USA)/Dulbecco’s modified Eagle’s medium (DMEM; Himedia, Mumbai, India) at 37°C and 5% CO2. HeLa, gift of Ramanujan S Hegde (Cambridge, UK); SHSY5Y cells, gift of Debashis Mukhopadhyay (Kolkata, India); Cos7, gift of Mitradas M Panicker (Bangalore, India); and MEF, gift of Nagaraj Balasubramanian (Pune, India) were grown under standard cell culture conditions. For transfections of cells, Lipofectamine 2000 (Invitrogen, Carlsbad, CA, USA) was used as per the manufacturer’s instructions. 24 h post-transfection, cells were lysed in suitable buffers. All tissue culture plasticware used for microscopy were from Nunc, Rosklide, Denmark, and bottom coverglass dishes used were from SPL Lifesciences, Gyeonggi-do, Korea.
siRNA-mediated knockdown studies
For siRNA-mediated knockdown, ON-TARGETplus SMARTpool siRNAs from Thermo Fisher Scientific (Dharmacon Products, Lafayette, CO, USA) were used, consisting of the following individual siRNAs against MGRN1 (L-022620-00-0020), human AMFR/GP78 (L-006522-00-0010), GFP (D-001300-01-20) and non-targeting siRNA (D-001810-01-20). The siRNA against RETREG1/FAM134B (4,392,420) and OPA1 (AM16708) was purchased from Ambion, USA. siRNAs were transfected using Lipofectamine 2000 following the manufacturer’s instructions.
Cells knocked down for 48 h were transfected with indicated constructs if required followed by respective drug treatments if required. Twenty to 24 h post-transfection, they were used for experiments.
All tissue culture plastic-ware and Lab-Tek 8-well chambered slides used for microscopy were from Nunc, bottom coverglass dishes used for microscopy were from SPL Lifesciences.
Cas9 and guide RNA (gRNA) expression plasmids-mediated knockout
For generating RETREG1/FAM134B knockout cell lines, “All-in-one, ready-to-use Cas9 and guide RNA (gRNA) expression plasmids” from Sigma Aldrich were used, consisting of the following gRNAs against RETREG1/FAM134B (target IDs: HS0000064709 and HS0000064711, target exon:7, gene ID: 54,463). The plasmid cassettes were using Lipofectamine 2000 following the manufacturer’s instructions. RFP-positive cells were selected and used in subsequent experiments. The transfection efficiency was ≥80%. Both the expression plasmids have similar knockout efficiencies. Data represented are all with target ID: HS0000064709.
Immunocytochemistry
For immunocytochemistry, cells were fixed with either 4% formaldehyde or methanol as per the requirement of the antibody, like before [Citation36,Citation48]. Cells were permeabilized using 10% FBS/PBS/0.1% saponin (Sigma-Aldrich, S4521) for 60 min, followed by overnight staining in primary antibody at 4°C and 60 min incubation in secondary antibody at room temperature. The samples were then imaged using confocal microscopy using Nikon A1 R+ Ti-E with N-SIM and FCS microscope systems.
Western blotting and immunoprecipitation
The protocol for western blotting was as described previously [Citation36]. 10% Tris-tricine gels were used for SDS-PAGE followed by western blotting. Quantification of western blots was done using Quantity One software of Bio-rad. At least 3 independent experiments were performed, and band intensities were normalized to loading control. p-values were determined using Student’s t-test. For immunoprecipitation, cells were lysed in immunoprecipitation buffer [50 mM Tris-HCl, pH7.5, 150 mM NaCl, 0.1% Triton X-100 (Sigma Aldrich, T8787), 1% IGEPAL (Sigma Aldrich, 18,896), 1 mM PMSF (Sigma Aldrich, 78,830), protease inhibitor cocktail (Sigma Aldrich, P8340)], and immunoprecipitation was performed under denaturing condition as described previously [Citation36].
For in vitro immunoprecipitation, bacterial pellet with recombinant full-length His-tagged RETREG1 were lysed by freeze-thawing (25 cycles), resuspended in immunoprecipitation buffer, combined with recombinant OPA1ΔN114. Immunoprecipitation and immunoblotting were performed as above. The bacterial pellets were used as the source for the recombinant full-length RETREG1; hence this reticulon family protein was in an enriched but not pure form. Perhaps, due to this, a bacterial periplasmic folding chaperone with an inactive PPIase domain (~63 kDa) from the E.coli BL21 (DE3)-(Thermo Fisher Scientific, ECO114) was also co-immunoprecipitated. However, BLASTp [Citation90] scans with both full-length RETREG1 as well as the epitope of the RETREG1 antibody (UniProt ID: Q9H6L5) retrieved only a single hit containing 38 amino acid stretch (region: 133–171) of this bacterial protein with only 13 identical residue match with an insignificant E-value of 9.9.
Mouse brain lysate
Brain lysates were generated from non-transgenic mice and analyzed as previously described [Citation91].
Brain lysate binding assay
Approximately 3 mg of recombinant truncated OPA1 (OPA1ΔN114) or BSA fraction V (Sigma-Aldrich, A2153) was immobilized on cyanogen bromide (CNBr)-activated Sepharose beads (Sigma Aldrich, C9142). 500 μl brain lysate was clarified by centrifugation and diluted with 1500 μl of buffer containing 20 mM Tris-HCl, pH7.5, 150 mM NaCl, 0.5% Triton X-100, 0.5% sodium deoxycholate, 1 mM PMSF, protease inhibitor cocktail (MilliporeSigma). 500 μl of this was incubated overnight at 4°C with 25 μl each of the immobilized protein-conjugated beads. Beads were washed with buffer and then eluted in SDS.
Preparation of mitochondria enriched fractions
Cos7 cells were lysed in mitochondrial isolation buffer (10 mM HEPES [Sigma Aldrich, H3375]-KOH buffer, pH 7.4, containing 0.22 M mannitol [Sigma Aldrich, M4125], 0.07 M sucrose [Sigma Aldrich, S8501]), by passing through a 25 G needle attached to a 1 ml syringe 10 times. A small fraction of this was saved as the whole-cell lysate. This was centrifuged at 600 g to pellet unlysed cell debris, nuclear fractions. The remaining solution was centrifuged at 4000 g to get the mitochondria enriched fraction, which was then washed twice with isolation buffer. The supernatant was collected as the cytosolic fraction.
Subcellular fractionation for lysosome enrichment
The protocol followed was as described previously [Citation52]. In brief, HeLa cells under lysosomal blocked conditions and corresponding controls were lysed in Lysosome isolation buffer or STE (250 mM sucrose, 20 mM Tris, pH 7.4, 5 mM magnesium chloride, 2 mM EDTA (Sigma Aldrich, E9884), protease inhibitor) manually. Lysates were centrifuged at 800 g to eliminate unlysed cell debris and nuclear fractions. The post-nuclear supernatant was layered on a continuous 23% v:v Percoll (Sigma Aldrich P4937) and 10% 2.5 M sucrose gradient followed by centrifugation at 59,000 g for 30 min to get the lysosome enriched fraction (identified as a visible ring). The fractions were TCA precipitated and analyzed by western blots.
Subcellular fractionation for autophagosome enrichment
Six 15 cm dishes each of Hela cells treated with MOCK siRNAs and RETREG1 siRNAs were washed in PBS, pelleted, resuspended in 1 ml isolation buffer (IB containing 0.25 M sucrose, 1 mM EDTA, 20 mM HEPES-NaOH, pH 7.4 and protease inhibitor cocktail) lysed using syringe lysis. This was centrifuged at 1000 g for 10 min to get rid of nuclei and unlysed cells. The supernatant (PNS) was centrifuged at 10 min at 3000 g. The supernatant then was collected and centrifuged for 15 min at 17,000 g. The pellet containing the vesicular fraction was resuspended in 1 ml IB. The suspension was loaded on top of an iodixanol (Sigma-Aldrich, D1556) gradient made up of five 1.6 ml fractions of iodixanol (5, 10, 16, 24, and 30%) followed by ultracentrifugation for 17 h at 100,000 g and 4°C. 1 ml fractions were collected from the bottom with a needle, TCA precipitated and analyzed by western blots.
Proteomic analyses of lysosome enriched fractions
Six 15 cm dishes of HeLa cells were each treated with RETREG1siRNA and MOCK siRNA for 48 h. Following this, cells were treated with leupeptin and E64D for 16 h. Lysosomal fractions were isolated using the Thermo Lysosome enrichment kit (#89,839, Thermo Fisher Scientific). These fractions were then processed for mass spectrometric analyses to identify the proteins in lysosome enriched fractions. Samples were prepared for mass spectrometry by solubilizing the lysosomal pellet in 8 M urea (Sigma Aldrich, U5128). This was then treated with 10 mM DTT (Sigma Aldrich, D8255) at 45°C and 40 mM chloroacetamide (Sigma Aldrich, 22,790) at room temperature to reduce and alkylate proteins. Proteins were then digested in solution with trypsin (Promega, V5111) overnight at 37°C. Tryptic digestion was terminated by acidifying with 10% trifluoroacetic acid (Sigma Aldrich, 302,031) for 10 min on ice. Peptides were stage-tipped and analyzed by liquid chromatography-coupled MS/MS on an Orbitrap mass spectrometer. Raw data was processed with MaxQuant and fragment peaks were searched against human UNIPROT database. Up to two missed tryptic cleavages were allowed. Both protein and peptide false discovery rate were set to 1%. Identified proteins were then sorted by LFQ intensities. Proteins corresponding to LFQ intensity of <1E+8 was used for further analyses. These proteins were run against genes from the mitoproteome database (http://www.mitoproteome.org) to analyze how many mitochondrial proteins were present. Proteins were further classified as inner mitochondrial membrane proteins (IMM), outer mitochondrial membrane proteins (OMM), and matrix proteins using the same mitoproteome database. The Human Proteome Atlas was used to retrieve 443 ER proteins. The identified proteins were screened against this proteome to see how many ER proteins were present in the samples. Similar lysosomal enrichment in both the samples was ensured by comparing the protein list with a list of annotated lysosomal genes taken from published data [Citation92].
Quantitative reverse transcription and real-time PCR
After specific treatments, cells were harvested for immediate RNA extraction. Total RNA was prepared using TRIzol reagent (Invitrogen, 15,596,026) according to the manufacturer’s protocol. Quantitative reverse transcription-PCR (qRT-PCR) was used to compare the expression of RETREG1 (forward primer, 5′-TGAAGGTGAAGACTTTGGACC-3′; reverse primer, 5′-AAACAATGGACACAAAAATGCAC-3′), AMFR (forward primer, 5′-AGCGCTTCCCCTGGCCCAGCC-3′; reverse primer, 5′-GGCGCCGGCGGCTCAGGCTG-3′), and OPA1 (forward primer, 5′-AATATAAATGGATTGTGCCTGACA-3′; reverse primer, 5′-AGGTAAAAAAGTCCTTCAATAAGC-3′) genes. The two sets of primers used for the housekeeping gene HPRT (set-I, forward primer, 5ʹ-TGGCTTATATCCAACACTTCGTGG-3ʹ; reverse primer, 5ʹ-GACACTGGCAAAACAATGCAGAC-3ʹ), (set-II, forward primer, 5ʹ-GACACTGGCAAAACAATGCAGAC-3ʹ, reverse primer, 5ʹ-TGGCTTATATCCAACACTTCGTGG-3ʹ).
Total DNA isolation and quantitative real-time PCR to check the mitochondrial DNA (mtDNA) levels with respect to the nuclear DNA (nDNA) between MOCKsiRNA and OPA1siRNA samples were performed as described previously [Citation32]. The following primers were used MT-CO2/COX2 (mitochondrially encoded cytochrome c oxidase II (MT-CO2 Fwd: ATCAAATCAATTGGCCACCAATGGTA, MT-CO2Rev: TTGACCGTAGTATACCCCCGGTC) and GAPDH (GAPDH Fwd: AGAAGGCTGGGGCTCATTTG, GAPDH Rev: AGGGGCCATCCACAGTCTTC)
Confocal imaging and image analyses
Confocal imaging was done using the Zeiss LSM710/ConfoCor 3, Nikon A1 R+ Ti-E with N-SIM and FCS microscope system. Ar-ion laser (for GFP excitation or Alexa-Fluor 488 with the 488 nm line), a He-Ne laser (for RFP, Alexa-Fluor 594 excitation with the 561 line were used with 100 × 1.4 NA oil immersion objective and 63 × 1.4 NA oil immersion objective. He-Ne laser for Alexa-Fluor 633 with the 633 line was also used with the same objective. RETREG1-GFP- and mito-RFP-transfected cells were imaged in CO2 independent media maintaining conditions of live-cell imaging as described previously [Citation32]. Cells were imaged taking z-stacks with z interval of 0.25 μm. Image analyses and 3D projections were done in FIJI. Quantitative analysis was done for 50–100 cells from more than 3 independent experiments.
All images in an experiment were acquired using identical parameters without detector saturation and by sequential scanning to help minimize the bleed-through effect. Background was corrected using the threshold value for all channels to remove background and noise levels completely. Raw data (without postprocessing) were used for the quantification. Images analyzed for colocalization between indicated proteins was by using the Coloc2 plugin in Fiji (NIH, Bethesda, MD, USA). Manders’ coefficient was noted to measure pixels positive for one protein that were also positive for the second indicated protein taken from regions within 2 μm from the cell periphery. This method was used for 50–100 cells over 3 independent experiments. From each cell, 2 regions of interest (ROIs; of 4 μm2) were chosen, one in the perinuclear region and another at the periphery. For all microscopy experiments, data was plotted using Microsoft Excel (Microsoft, Redmond, WA, USA). Cell imaged continuously in live-cell imaging mode for 5 min. To score for ER-mitochondria contact points, 2 peripheral regions of interest (ROIs; of 4 μm2) were chosen (2 μm from the cell periphery and at least 10 μm apart) and analyzed in Fiji using the Coloc2 plugin. For representation in figures, all images in an experiment were processed for brightness and contrast parameters in Adobe Photoshop to the same extent to maintain uniformity in representation.
3D live structured illumination microscopy (3D-SIM)
3D-SIM images were obtained using Nikon N-SIM on Eclipse Ti Inverted Microscope equipped with a Piezo stage, a Plan Apochromat 100x (NA 1.49) oil-immersion objective and 405/488/561/647 nm diode lasers. Image stacks were recorded with a z-distance of 125 − 150 nm. 15 images (5 different phases X 3 different angles) were captured for each XY plane; final images were reconstructed from these 15 raw reconstruction and alignment were performed using NIS-Elements AR software with N-SIM module.
Thin-section transmission electron microcopy
Cell pellets (sorted AMFR-IRES-GFP and EmpVec) were washed thrice with ice-cold 1X PBS (pH 7.4) and then fixed with 2X fixative [1X fixative: 2% glutaraldehyde (Electron Microscopy Sciences, 16,200), 4% paraformaldehyde (Electron Microscopy Sciences, 15,700) in 0.1 M sodium cacodylate buffer (Electron Microscopy Sciences, 11,650), pH 7.4) for 10 min at room temperature. After removing the fixative solution, again 1X fixative solution was applied to the samples and incubated for another 30 min. After fixation, pellets were washed thrice with 0.1 M sodium cacodylate buffer. The solidified cell pellet–agar block was post-fixed with 1% OsO4 (Electron Microscopy Sciences, 19,150) [1.5% potassium ferrocyanide (Electron Microscopy Sciences, 26,603–01)] in cacodylate buffer for 60 min on ice. En bloc stain with 1% uranyl acetate (Electron Microscopy Sciences, 22,400–4) was performed for 30 min. Pellets were dehydrated in a graded ethanol series (30%, 50%, 70%, 90%, 100% I, 100% II) using Pelco Biowave (Ted Pella, Inc.) at 150 W for the 40 S. Further dehydration was with acetone for 5 min. Following this, eponate solution (50 ml eponate solution; individual components of this solution comes within the EMBED 812 EMBEDDING KIT with DMP-30 [Electron Microscopy Sciences, 14,120]: 18 ml NMA, 25 ml eponate, 7 ml DDSA, 0.6 ml DMP-30) was added at 1:1 ratio with acetone and infiltrated using Pelco Biowave at 350 W for 3 min; this was repeated twice with 100% eponate solution. Fresh eponate solution was added and samples kept under vacuum overnight. Pellets were placed in embedding molds were polymerized with eponate solution at 60°C oven for 48 h. Ultrathin sections cut using Leica UC7 ultramicrotome were observed under JEOL 1400 plus transmission electron microscope with Gatan 2 k X 2 k digital camera.
Stimulated emission depletion (STED) microscopy
Immunostaining of CHO cells was performed as previously described [Citation37,Citation50]. For these experiments antibodies used were: primary mouse-anti-HA (1:100, Biolegend, MMS-101P); and secondary anti-mouse star 580 (Abberior, N1202-ab580-L, 1:50), anti-GFP(conjugated nanobody)-635p (1:50, Abberior, N0301-ab635P-L). All STED images were collected using Abberior confocal STED microscope (Abberior, Germany) with QUAN scanner. An oil-immersion Plan-Apo 1.4NA DIC-grade objective and the 560/640/775 nm combination of lasers were used. The doughnut profile (coherent-hybrid, CH-STED) was generated by phase modulation on a spatial light modulator (Abberior easySTED module) to obtain a supra-2D and supra-confocal resolution [Citation93]. The imaging condition was adequate to achieve ~35-40 nm resolution in our samples. Detectors are avalanche photodiodes which were gated to reject the confocal baseline signal. STED images were deconvolved using Huygens Software using the appropriate PSFs (SVI, Netherlands).
Quantitative image analyses
12 µm X 12 µm confocal and 3D-SIM images were collected as z-stacks, where each layer of the stack was converted into 256 × 256 pixel matrix so that each pixel represents a unit distance of ~47 nm. Images with various color channels were processed via implementation of morphological operations using MATLAB image processing toolbox [Citation94]. IMM, OMM and ER structures were automatically segmented using morphological operations like contrast stretching, erosion, opening, and dilation. IMM boundary or the perimeter was calculated using the bwperim function of the MATLAB image processing toolbox. The neighborhood and overlap indices were calculated by identifying the OMM and ER color pixels using 3 × 3 and 5 × 5 pixel squares, respectively. In other words, OMM and ER structures were registered using 47 nm and 94 nm radii circles, respectively with respect to each IMM perimeter point. The following formulae were used to calculate the neighborhood and overlap index.
Where is the number of boundary pixels of segmented IMMs and
are the OMM or ER pixels in specified neighborhood region for the ith slice of the z-stack.
Where p is the total number of pixels in segmented IMM and n is the total number of OMM pixels of the ith slice which share the same coordinates.
3D models of the cellular substructures were created by combining the z-stack images and converting the 3D pixel matrix into Cartesian coordinates. Cartesian coordinates of each z-stack image were converted into 3D surface model using the PyMOL software [Citation95].
TEM images were converted into binary images with a high threshold index of 0.9 using im2bw function of the MATLAB image processing toolbox. These images were further processed using imfill and bwareaopen functions, respectively. Finally, regionprops function was applied to calculate the major (a) and minor (b) axes length and eccentricity of the selected mitochondria. Convex hull of the manually traced mitochondria were estimated also using the regionprops function. Eccentricity was calculated using the following formula:
Mitochondrial shape was estimated by the ratio between the minor and major axes (b/a) where b/a ≤ 0.5 and >0.5 indicating elliptical and circular shapes, respectively.
For analyses of STED images, process red (mitochondria) and green (ER) color channels separately using MATLAB image processing toolbox [Citation94]. Imhist function was used for histogram (frequency) analysis of each pixel value and further imadjust was used for filtering out darker background pixels consisting of almost 90% of total pixels in each image. A shorter and most relevant range of pixel values representing the mitochondria was utilized for further image analyses. Mitochondrial pixels with lower intensity (≤20% of the maximum intensity pixel) were removed using imbw and smaller spots (≤10 pixels) were removed via a size threshold.
ER-mitochondria overlap was estimated by calculating the ratio of ER representing pixels with respect to the pixels representing mitochondrial area and its neighborhood. Mitochondria area and neighborhood was calculated using regionprops function where neighborhood region was defined within a 5 pixel width from the mitochondrial periphery.
Statistical analysis
For all experiments, at least 3 biological replicates were obtained unless otherwise indicated. Graphs have been plotted by exporting data of ImageJ to MS Excel 2007. Error bars represent mean ± standard error unless otherwise indicated. 2‐tailed type 3 Students t‐test has been used for calculating statistical significance of experiments. Boxplots have been generated using BoxplotR.
Supplemental Material
Download Zip (34.8 MB)Acknowledgments
We thank I. R. Nabi, I. Dikic, S. Banerjee, Y. He, E. L. Snapp, K. Tasken and N. P. Bhattacharyya for plasmids; R. S. Hegde for cells, plasmids, antibodies and brain lysate; D. Mukhopadhyay for cells; M. M. Panicker for cells; N. Balasubramanian for cells; we thank Kunihiro Uryu and Nadine Soplop (Electron Microscopy Resource Center, Rockefeller University) for their help in TEM sample preparation; we thank I. Dikic (Institute of Biochemistry II, Goethe University) for use of mass spectrometry facility; we also thank P·K Chakraborty at Towa Optics (I) Pvt. Ltd. for help with live 3D-SIM experiment. We are grateful to A. Pereira and H. Maiato for help with STED experiments and providing access to the Abberior confocal STED microscope at Chromosome Instability & Dynamics lab, i3S, Porto. We acknowledge OC and SC laboratory members for their help and support throughout the study, especially Z. Kaul, P. Das and S. Maity for technical help. OC is supported by the “Integrative Biology on Omics Platform Project”, intramural funding of the Department of Atomic Energy (DAE), Government of India. OC is partially funded by SERB, Department of Science & Technology (EMR/2016/002706), Government of India. DM acknowledges financial support from University Grants Commission [D. M.; F2-32/1998 (SA-1)]. SC acknowledges CSIR-IICB for infrastructural support and SD acknowledges CSIR for PhD fellowship. SCJ acknowledges the Foundation for Science and Technology (FCT), Portugal for Fellowship/Work Contract (SFRH/BPD/87479/2012) and Research Grant (PTDC/BIA-CEL/32631/2017).
Disclosure statement
The authors declare no conflict of interest, financial or otherwise.
Supplementary material
Supplemental data for this article can be accessed here.
Additional information
Funding
References
- Mizushima N. Autophagy: process and function. Genes Dev. 2007;21:2861–2873.
- Mizushima N. The pleiotropic role of autophagy: from protein metabolism to bactericide. Cell Death Differ. 2005;12:1535–1541.
- Rubinsztein DC, Codogno P, Levine B. Autophagy modulation as a potential therapeutic target for diverse diseases. Nat Rev Drug Discov. 2012;11:709–730.
- Lamb CA, Yoshimori T, Tooze SA. The autophagosome: origins unknown, biogenesis complex. Nat Rev Mol Cell Biol. 2013;14:759–774.
- Graef M, Friedman JR, Graham C, et al. ER exit sites are physical and functional core autophagosome biogenesis components. Mol Biol Cell. 2013;24:2918–2931.
- Longatti A, Tooze SA. Recycling endosomes contribute to autophagosome formation. Autophagy. 2012;8:1682–1683.
- Ravikumar B, Moreau K, Jahreiss L, et al. Plasma membrane contributes to the formation of pre-autophagosomal structures. Nat Cell Biol. 2010;12:747–757.
- van der Vaart A, Griffith J, Reggiori F. Exit from the Golgi is required for the expansion of the autophagosomal phagophore in yeast Saccharomyces cerevisiae. Mol Biol Cell. 2010;21:2270–2284.
- English AR, Voeltz GK. Endoplasmic reticulum structure and interconnections with other organelles. Cold Spring Harb Perspect Biol. 2013;5(4):a013227.
- Helle SC, Kanfer G, Kolar K, et al. Organization and function of membrane contact sites. Biochim Biophys Acta Mol Cell Res. 2013;1833:2526–2541.
- Prinz WA. Bridging the gap: membrane contact sites in signaling, metabolism, and organelle dynamics. J Cell Biol. 2014;205:759–769.
- Hailey DW, Rambold AS, Satpute-Krishnan P, et al. Mitochondria supply membranes for autophagosome biogenesis during starvation. Cell. 2010;141:656–667.
- Sanjuan MA, Dillon CP, Tait SW, et al. Toll-like receptor signalling in macrophages links the autophagy pathway to phagocytosis. Nature. 2007;450:1253–1257.
- Hamasaki M, Furuta N, Matsuda A, et al. Autophagosomes form at ER–mitochondria contact sites. Nature. 2013;495:389–393.
- Böckler S, Westermann B. ER-mitochondria contacts as sites of mitophagosome formation. Autophagy. 2014;10:1346–1347.
- Zhuang X, Chung KP, Jiang L. Origin of the autophagosomal membrane in plants. Front Plant Sci. 2016;7:1655.
- Ge L, Melville D, Zhang M, et al. The ER–Golgi intermediate compartment is a key membrane source for the LC3 lipidation step of autophagosome biogenesis. Elife. 2013;2:e00947.
- Khaminets A, Heinrich T, Mari M, et al. Regulation of endoplasmic reticulum turnover by selective autophagy. Nature. 2015;522:354–358.
- Fumagalli F, Noack J, Bergmann TJ, et al. Translocon component Sec62 acts in endoplasmic reticulum turnover during stress recovery. Nat Cell Biol. 2016;18:1173–1184.
- Grumati P, Morozzi G, Hölper S, et al. Full length RTN3 regulates turnover of tubular endoplasmic reticulum via selective autophagy. Elife. 2017;6:e25555.
- Smith MD, Harley ME, Kemp AJ, et al. CCPG1 is a non-canonical autophagy cargo receptor essential for ER-Phagy and pancreatic ER proteostasis. Dev Cell. 2018;44:217–232.
- Chen Q, Xiao Y, Chai P, et al. ATL3 is a tubular ER-phagy receptor for GABARAP-mediated selective autophagy. Curr Biol. 2019;29:846–855.
- Chino H, Hatta T, Natsume T, et al. Intrinsically disordered protein TEX264 mediates ER-phagy. Mol Cell. 2019;74:909–921.
- Buchberger A, Bukau B, Sommer T. Protein quality control in the cytosol and the endoplasmic reticulum: brothers in arms. Mol Cell. 2010;40:238–252.
- Matus S, Lisbona F, Torres M, et al. The stress rheostat: an interplay between the unfolded protein response (UPR) and autophagy in neurodegeneration. Curr Mol Med. 2008;8:157–172.
- Ballar P, Ors AU, Yang H, et al. Differential regulation of CFTRΔF508 degradation by ubiquitin ligases gp78 and Hrd1. Int J Biochem Cell Biol. 2010;42:167–173.
- Shmueli A, Tsai YC, Yang M, et al. Targeting of gp78 for ubiquitin-mediated proteasomal degradation by Hrd1: cross-talk between E3s in the endoplasmic reticulum. Biochem Biophys Res Commun. 2009;390:758–762.
- Wang Y, Ha SW, Zhang T, et al. Polyubiquitylation of AMF requires cooperation between the gp78 and TRIM25 ubiquitin ligases. Oncotarget. 2014;5:2044–2051.
- Liang JS, Kim T, Fang S, et al. Overexpression of the tumor autocrine motility factor receptor Gp78, a ubiquitin protein ligase, results in increased ubiquitinylation and decreased secretion of apolipoprotein B100 in HepG2 cells. J Biol Chem. 2003;278:23984–23988.
- Morito D, Hirao K, Oda Y, et al. Gp78 cooperates with RMA1 in endoplasmic reticulum-associated degradation of CFTRΔF508. Mol Biol Cell. 2008;19:1328–1336.
- Fu M, St-Pierre P, Shankar J, et al. Regulation of mitophagy by the Gp78 E3 ubiquitin ligase. Mol Biol Cell. 2013;24:1153–1162.
- Mukherjee R, Chakrabarti O. Ubiquitin-mediated regulation of the E3 ligase GP78 by MGRN1 in trans affects mitochondrial homeostasis. J Cell Sci. 2016;129:757–773.
- He L, Lu XY, Jolly AF, et al. Spongiform degeneration in mahoganoid mutant mice. Science. 2003;299:710–712.
- Cota CD, Bagher P, Pelc P, et al. Mice with mutations in Mahogunin ring finger‐1 (Mgrn1) exhibit abnormal patterning of the left–right axis. Dev Dyn. 2006;235:3438–3447.
- Jiao J, Kim HY, Liu RR, et al. Transgenic analysis of the physiological functions of Mahogunin ring finger‐1 isoforms. Genesis. 2009;47:524–534.
- Srivastava D, Chakrabarti O. Mahogunin-mediated α-tubulin ubiquitination via noncanonical K6 linkage regulates microtubule stability and mitotic spindle orientation. Cell Death Dis. 2014;5:e1064.
- Mukherjee R, Bhattacharya A, Sau A, et al. Calmodulin regulates MGRN1-GP78 interaction mediated ubiquitin proteasomal degradation system. Faseb J. 2018;33:1927–1945.
- Paillusson S, Stoica R, Gomez-Suaga P, et al. There’s something wrong with my MAM; the ER–mitochondria axis and neurodegenerative diseases. Trends Neurosci. 2016;39:146–157.
- Demetriadou A, Morales-Sanfrutos J, Nearchou M, et al. Mouse Stbd1 is N-myristoylated and affects ER-mitochondria association and mitochondrial morphology. J Cell Sci. 2017;130:903–915.
- Zhang T, Kho DH, Wang Y, et al. Gp78, an E3 ubiquitin ligase acts as a gatekeeper suppressing nonalcoholic steatohepatitis (NASH) and liver cancer. PLoS One. 2015;10:e0118448.
- Shankar J, Kojic LD, St-Pierre P, et al. Raft endocytosis of AMF regulates mitochondrial dynamics through Rac1 signaling and the Gp78 ubiquitin ligase. J Cell Sci. 2013;126:3295–3304.
- Xu S, Peng G, Wang Y, et al. The AAA-ATPase p97 is essential for outer mitochondrial membrane protein turnover. Mol Biol Cell. 2011;22:291–300.
- Saita S, Shirane M, Nakayama KI. Selective escape of proteins from the mitochondria during mitophagy. Nat Commun. 2013;4:1410.
- Wei Y, Chiang WC, Sumpter R, et al. Prohibitin 2 is an inner mitochondrial membrane mitophagy receptor. Cell. 2017;168:224–238.
- Ishihara N, Fujita Y, Oka T, et al. Regulation of mitochondrial morphology through proteolytic cleavage of OPA1. Embo J. 2006;25:2966–2977.
- Hegde RS, Mastrianni JA, Scott MR, et al. A transmembrane form of the prion protein in neurodegenerative disease. Science. 1998;279:827–834.
- Rane NS, Chakrabarti O, Feigenbaum L, et al. Signal sequence insufficiency contributes to neurodegeneration caused by transmembrane prion protein. J Cell Biol. 2010;188:515–526.
- Chakrabarti O, Hegde RS. Functional depletion of mahogunin by cytosolically exposed prion protein contributes to neurodegeneration. Cell. 2009;137:1136–1147.
- Singh H, Lu R, Rodríguez PFG, et al. Visualization and quantification of cardiac mitochondrial protein clusters with STED microscopy. Mitochondrion. 2012;12:230–236.
- Jana SC, Mendonça S, Machado P, et al. Differential regulation of transition zone and centriole proteins contributes to ciliary base diversity. Nat Cell Biol. 2018;20:928.
- Gonzalez‐Hunt CP, Rooney JP, Ryde IT, et al. PCR‐based analysis of mitochondrial DNA copy number, mitochondrial DNA damage, and nuclear DNA damage. Curr Protoc Toxicol. 2016;67:11–20.
- Radisky DC, Kaplan J. Iron in cytosolic ferritin can be recycled through lysosomal degradation in human fibroblasts. Biochem J. 1998;336:201–205.
- MacVicar T, Langer T. OPA1 processing in cell death and disease–the long and short of it. J Cell Sci. 2016;129:2297–2306.
- Vito P, Lacaná E, D’adamio L. Interfering with apoptosis: ca2+-binding protein ALG-2 and Alzheimer’s disease gene ALG-3. Science. 1996;271:521–525.
- Missotten M, Nichols A, Rieger K, et al. Alix, a novel mouse protein undergoing calcium-dependent interaction with the apoptosis-linked-gene 2 (ALG-2) protein. Cell Death Differ. 1999;6:124–129.
- Park S, Scheffler TL, Rossie SS, et al. AMPK activity is regulated by calcium-mediated protein phosphatase 2A activity. Cell Calcium. 2013;53:217–223.
- Wang HJ, Guay G, Pogan L, et al. Calcium regulates the association between mitochondria and a smooth subdomain of the endoplasmic reticulum. J Cell Biol. 2000;150:1489–1498.
- Wang PT, Garcin PO, Fu M, et al. Distinct mechanisms controlling rough and smooth endoplasmic reticulum contacts with mitochondria. J Cell Sci. 2015;128:2759–2765.
- Goetz JG, Genty H, St-Pierre P, et al. Reversible interactions between smooth domains of the endoplasmic reticulum and mitochondria are regulated by physiological cytosolic Ca2+ levels. J Cell Sci. 2007;120:3553–3564.
- Filadi R, Greotti E, Turacchio G, et al. Mitofusin 2 ablation increases endoplasmic reticulum–mitochondria coupling. Proc Natl Acad Sci U S A. 2015;112:2174–2181.
- Mukherjee R, Chakrabarti O. Regulation of Mitofusin1 by Mahogunin Ring Finger-1 and the proteasome modulates mitochondrial fusion. Biochim Biophys Acta Mol Cell Res. 2016;1863:3065–3083.
- Li L, Gao G, Shankar J, et al. p38 MAP kinase–dependent phosphorylation of the Gp78 E3 ubiquitin ligase controls ER–mitochondria association and mitochondria motility. Mol Biol Cell. 2015;26:3828–3840.
- Tooze SA, Yoshimori T. The origin of the autophagosomal membrane. Nat Cell Biol. 2010;12:831–835.
- Mercer TJ, Gubas A, Tooze SA. A molecular perspective of mammalian autophagosome biogenesis. J Biol Chem. 2018;293:5386–5395.
- Axe EL, Walker SA, Manifava M, et al. Autophagosome formation from membrane compartments enriched in phosphatidylinositol 3-phosphate and dynamically connected to the endoplasmic reticulum. J Cell Biol. 2008;182:685–701.
- Hayashi-Nishino M, Fujita N, Noda T, et al. A subdomain of the endoplasmic reticulum forms a cradle for autophagosome formation. Nat Cell Biol. 2009;11:1433–1437.
- Ylä-Anttila P, Vihinen H, Jokitalo E, et al. 3D tomography reveals connections between the phagophore and endoplasmic reticulum. Autophagy. 2009;5:1180–1185.
- Mizushima N. A dual binding receptor for ER-phagy. Dev Cell. 2018;44:133–135.
- Mochida K, Oikawa Y, Kimura Y, et al. Receptor-mediated selective autophagy degrades the endoplasmic reticulum and the nucleus. Nature. 2015;522:359–362.
- Cui Y, Parashar S, Zahoor M, et al. A COPII subunit acts with an autophagy receptor to target endoplasmic reticulum for degradation. Science. 2019;365:53–60.
- Rubinsztein DC. Cell biology: receptors for selective recycling. Nature. 2015;522:291–292.
- Liao Y, Duan B, Zhang Y, et al. Excessive ER-phagy mediated by the autophagy receptor FAM134B results in ER stress, the unfolded protein response, and cell death in HeLa cells. J Biol Chem. 2019;294:20009–20023.
- Dikic I. Open questions: why should we care about ER-phagy and ER remodelling? BMC Biol. 2018;16::131.
- Schuck S, Gallagher CM, Walter P. ER-phagy mediates selective degradation of endoplasmic reticulum independently of the core autophagy machinery. J Cell Sci. 2014;127:4078–4088.
- Chan NC, Salazar AM, Pham AH, et al. Broad activation of the ubiquitin–proteasome system by Parkin is critical for mitophagy. Hum Mol Genet. 2011;20:1726–1737.
- Yoshii SR, Kishi C, Ishihara N, et al. Parkin mediates proteasome-dependent protein degradation and rupture of the outer mitochondrial membrane. J Biol Chem. 2011;286:19630–19640.
- Narendra D, Walker JE, Youle R. Mitochondrial quality control mediated by PINK1 and Parkin: links to parkinsonism. Cold Spring Harb Perspect Biol. 2012;4:a011338.
- Kim NC, Tresse E, Kolaitis RM, et al. VCP is essential for mitochondrial quality control by PINK1/Parkin and this function is impaired by VCP mutations. Neuron. 2013;78:65–80.
- Pickrell AM, Youle RJ. The roles of PINK1, parkin, and mitochondrial fidelity in Parkinson’s disease. Neuron. 2015;85:257–273.
- Tanaka A, Cleland MM, Xu S, et al. Proteasome and p97 mediate mitophagy and degradation of mitofusins induced by Parkin. J Cell Biol. 2010;191:1367–1380.
- Fregno I, Fasana E, Bergmann TJ, et al. ER‐to‐lysosome‐associated degradation of proteasome‐resistant ATZ polymers occurs via receptor‐mediated vesicular transport. Embo J. 2018;37:e99259.
- Forrester A, De Leonibus C, Grumati P, et al. A selective ER‐phagy exerts procollagen quality control via a Calnexin‐FAM134B complex. Embo J. 2018;38:e99847.
- Bhaskara RM, Grumati P, Garcia-Pardo J, et al. Curvature induction and membrane remodeling by FAM134B reticulon homology domain assist selective ER-phagy. Nat Commun. 2019;10:2370.
- Kaul Z, Chakrabarti O. Tumor susceptibility gene 101 regulates predisposition to apoptosis via ESCRT machinery accessory proteins. Mol Biol Cell. 2017;28:2106–2122.
- Davidson G, Murphy S, Polke J, et al. Frequency of mutations in the genes associated with hereditary sensory and autonomic neuropathy in a UK cohort. J Neurol. 2012;259:1673–1685.
- Murphy SM, Davidson GL, Brandner S, et al. Mutation in FAM134B causing severe hereditary sensory neuropathy. 2012;83:119–120. J Neurol Neurosur Psychiatry.
- Ilgaz Aydinlar E, Rolfs A, Serteser M, et al. Mutation in FAM134B causing hereditary sensory neuropathy with spasticity in a Turkish family. Muscle Nerve. 2014;49:774–775.
- Chiramel AI, Dougherty JD, Nair V, et al. FAM134B, the selective autophagy receptor for endoplasmic reticulum turnover, inhibits replication of Ebola virus strains Makona and Mayinga. J Infect Dis. 2016;214:319–325.
- Islam F, Gopalan V, Lam AK. RETREG1 (FAM134B): A new player in human diseases: 15 years after the discovery in cancer. J Cell Physiol. 2018;233:4479–4489.
- Altschul SF, Madden TL, Schäffer AA, et al. Gapped BLAST and PSI-BLAST: a new generation of protein database search programs. Nucleic Acids Res. 1997;25:3389–3402.
- Rane NS, Kang SW, Chakrabarti O, et al. Reduced translocation of nascent prion protein during ER stress contributes to neurodegeneration. Dev Cell. 2008;15:359–370.
- Brozzi A, Urbanelli L, Germain PL, et al. hLGDB: a database of human lysosomal genes and their regulation. Database (Oxford). 2013. bat024. doi:https://doi.org/10.1093/database/bat024.
- Pereira A, Sousa M, Almeida AC, et al. Coherent-hybrid STED: high contrast sub-diffraction imaging using a bi-vortex depletion beam. Opt Express. 2019;27:8092–8111.
- Gonzalez RC, Woods RE, Eddins SL. Digital Image Processing Using MATLAB. Upper Saddle River, NJ, USA: Prentice-Hall, Inc.; 2003.
- DeLano WL. Pymol: an open-source molecular graphics tool. J Neurol Neurosurg Psychiatry. 2002;40:82–92. CCP4 Newsl Protein Crystallogr.
- Tyanova S, Temu T, Sinitcyn P, et al. The Perseus computational platform for comprehensive analysis of (prote) omics data. Nat Methods. 2016;13:731–740.