
ABSTRACT
Impaired macroautophagy/autophagy has been implicated in experimental and human nonalcoholic steatohepatitis (NASH). However, the mechanism underlying autophagy dysregulation in NASH is largely unknown. Here, we investigated the role and mechanism of TXNIP/VDUP1 (thioredoxin interacting protein), a key mediator of cellular stress responses, in the pathogenesis of NASH. Hepatic TXNIP expression was upregulated in nonalcoholic fatty liver disease (NAFLD) patients and in methionine choline-deficient (MCD) diet-fed mice, as well as in palmitic acid (PA)-treated hepatocytes. Upregulation of hepatic TXNIP was positively correlated with impaired autophagy, as evidenced by a decreased number of MAP1LC3B/LC3B (microtubule-associated protein 1 light chain 3 beta) puncta and increased SQSTM1/p62 (sequestosome 1) expression. Deletion of the Txnip gene enhanced hepatic steatosis, inflammation, and fibrosis, accompanied by impaired autophagy and fatty acid oxidation (FAO) in MCD diet-fed mice. Mechanistically, TXNIP directly interacted with and positively regulated p-PRKAA, leading to inactivation of MTOR (mechanistic target of rapamycin kinase) complex 1 (MTORC1) and nuclear translocation of TFEB (transcription factor EB), which in turn promoted autophagy. Inhibition of MTORC1 by rapamycin induced autophagy and increased the expression levels of FAO-related genes and concomitantly attenuated lipid accumulation in PA-treated txnip-knockout (KO) hepatocytes, which was further abolished by silencing of Atg7. Rapamycin treatment also attenuated MCD diet-induced steatosis, inflammation, and fibrosis with increased TFEB nuclear translocation and restored FAO in txnip-KO mice. Our findings suggest that elevated TXNIP ameliorates steatohepatitis by interacting with PRKAA and thereby inducing autophagy and FAO. Targeting TXNIP may be a potential therapeutic approach for NASH.
Abbreviations: ACOX1: acyl-Coenzyme A oxidase 1, palmitoyl; ACSL1: acyl-CoA synthetase long-chain family member 1; ACTA2/α-SMA: actin, alpha 2, smooth muscle, aorta; ACTB: actin beta; ADGRE1/F4/80: adhesion G protein-coupled receptor E1; AMPK: AMP-activated protein kinase; ATG: autophagy-related; BafA1: bafilomycin A1; COL1A1/Col1α1: collagen, type I, alpha 1; CPT1A: carnitine palmitoyltransferase 1a, liver; CQ: chloroquine; DGAT1: diacylglycerol O-acyltransferase 1; DGAT2: diacylglycerol O-acyltransferase 2; ECI2/Peci: enoyl-Coenzyme A isomerase 2; EHHADH: enoyl-Coenzyme A, hydratase/3-hydroxyacyl Coenzyme A dehydrogenase; FAO: fatty acid oxidation; FASN: fatty acid synthase; FFA: free fatty acids; GFP: green fluorescent protein; GK/GYK: glycerol kinase; GOT1/AST: glutamic-oxaloacetic transaminase 1, soluble; GPAM: glycerol-3-phosphate acyltransferase, mitochondrial; GPT/ALT: glutamic pyruvic transaminase, soluble; H&E: hematoxylin and eosin; IL1B/IL-1β: interleukin 1 beta; IL6: interleukin 6; IOD: integral optical density; KO: knockout; Leu: leupeptin; LPIN1: lipin 1; MAP1LC3B/LC3B: microtubule-associated protein 1 light chain 3 beta; MCD: methionine choline-deficient; MMP9: matrix metallopeptidase 9; mRNA: messenger RNA; MTORC1: mechanistic target of rapamycin kinase complex 1; NAFLD: nonalcoholic fatty liver diseases; NASH: nonalcoholic steatohepatitis; PA: palmitic acid; PPARA/PPARα: peroxisome proliferator activated receptor alpha; PPARG/PPARγ: peroxisome proliferator activated receptor gamma; qRT-PCR: quantitative real-time PCR; RPS6KB1/p70S6K1: ribosomal protein S6 kinase, polypeptide 1; RPTOR: regulatory associated protein of MTOR complex 1; SCD1: stearoyl-Coenzyme A desaturase 1; SEM: standard error of the mean; siRNA: small interfering RNA; SQSTM1/p62: sequestosome 1; TFEB: transcription factor EB; TG: triglyceride; TGFB/TGF-β: transforming growth factor, beta; TIMP1: tissue inhibitor of metalloproteinase 1; TNF/TNF-α: tumor necrosis factor; TXNIP/VDUP1: thioredoxin interacting protein; WT: wild-type
Introduction
Nonalcoholic fatty liver disease (NAFLD) is a chronic liver disease that is increasing in incidence worldwide [Citation1]. It is caused by ectopic fat accumulation in the liver, mainly owing to excessive fat uptake from foods, enhanced hepatic de novo lipid synthesis, and reduced fatty acid beta-oxidation [Citation2]. The clinicopathological spectrum of NAFLD ranges widely, from simple steatosis to nonalcoholic steatohepatitis (NASH), which consists of fatty liver with hepatic injury, inflammation, and fibrosis [Citation3,Citation4]. Whereas simple steatosis is reversible and relatively benign, NASH can progress to liver cirrhosis and cancer [Citation5]. However, the molecular pathogenesis of NASH remains largely elusive, and thus the treatment options for this disease remain limited.
Macroautophagy/autophagy is a genetically programmed, evolutionarily conserved catabolic process, which manifests as the degradation of cellular proteins and damaged organelles to promote cell survival and maintain cellular homeostasis [Citation6,Citation7]. Recent studies showed that autophagy plays a crucial role in the development of NASH. Autophagic flux was found to be impaired in livers of NAFLD and NASH patients and those of obese (ob/ob) mice and mice fed a high-fat diet (HFD) [Citation8–10]. Hepatocyte-specific atg7 (autophagy related 7)-knockout (KO) mice exhibit increased intracellular triglyceride (TG) accumulation when fed a HFD owing to impaired lipolysis and a subsequent reduction in fatty acid-oxidation (FAO) [Citation11]. In contrast, autophagy induction via liver-specific overexpression of Atg7 or treatment with pharmacological agents, such as rapamycin and carbamazepine, alleviated steatosis and injury in a mouse model of NASH [Citation12–14]. These findings demonstrate that therapeutic strategies aimed at increasing autophagic functions may provide an attractive approach for preventing NASH.
TXNIP/VDUP1 (thioredoxin interacting protein) is a stress-response gene that was originally identified in HL60 cells upregulated by 1,25-(OH)2D3 [Citation15]. Subsequent studies showed that TXNIP is a key modulator of the redox system that inhibits TXN (thioredoxin) to cause cellular oxidative stress and perturb the activities of TXN-related proteins, such as MAP3K5/ASK-1 (mitogen-activated protein kinase kinase kinase 5) [Citation16,Citation17]. TXNIP overexpression represses cellular glucose uptake, whereas Txnip knockdown increases glucose uptake in peripheral tissues [Citation18]. txnip-KO mice exhibit hypoglycemia through enhanced glucose uptake and are resistant to streptozotocin-induced diabetes owing to an increased β cell mass, indicating that β cells have a protective effect against TXNIP deficiency [Citation19–21]. In addition, txnip-KO mice develop hematuria, melena, hypoglycemia, and hypertriglyceridemia under fasting conditions, leading to death due to liver and renal failure, a state resembling Reye syndrome [Citation22].
It was recently shown that TXNIP is significantly upregulated in the livers of NAFLD patients and mediates lipogenesis and fatty acid re-esterification [Citation23,Citation24], implying that targeting TXNIP is a potential therapeutic approach for the treatment of NASH. However, the underlying mechanism through which TXNIP affects the pathogenesis of NASH has not been fully explored. In this study, we found that TXNIP expression was markedly increased in patients with NAFLD and mice fed a methionine choline-deficient (MCD) diet, as well as in hepatocytes treated with free fatty acids (FFAs). Using txnip-KO mice and primary hepatocytes, we demonstrated that FFAs stimulate the expression of TXNIP in hepatocytes and that upregulated TXNIP regulates NASH development through the induction of autophagy and PPARA/PPARα (peroxisome proliferator activated receptor alpha)-mediated FAO.
Results
TXNIP expression is upregulated in human NAFLD and MCD diet-fed mice
We first evaluated the clinical impact of TXNIP in NAFLD patients. Immunohistochemistry experiments revealed that TXNIP protein expression was markedly higher in the cytoplasm of steatotic hepatocytes from patients with NAFLD compared to those from healthy controls (). TXNIP expression was positively correlated with steatosis (r = 0.6420, P = 0.0099), hepatocellular ballooning (r = 0.6624, P = 0.0071), lobular inflammation (r = 0.5160, P = 0.0492), and the NAFLD activity score (NAS; r = 0.6894, P = 0.0045) (). Consistent with the findings in human samples, TXNIP protein was localized normally in hepatocytes from control mice but was significantly upregulated in the cytoplasm of steatotic hepatocytes from mice fed an MCD diet for 4 w (). Western blot analysis also showed that the hepatic levels of TXNIP were higher in mice fed an MCD diet compared with mice fed a control diet ().
Figure 1. TXNIP is upregulated in liver tissues of NAFLD patients and MCD diet-fed mice. (A) Representative images of immunohistochemical staining for TXNIP in liver sections from controls (n = 4) and NAFLD patients (n = 11). Scale bars: 100 μm and 50 μm, respectively. A semiquantitative analysis of the IOD of TXNIP-positive areas is shown to the right of the images. Ten fields (final magnification, × 400) were randomly selected for each sample, and the IOD of all positive staining in each image was measured. (B) Association of TXNIP expression with steatosis, hepatocellular ballooning, lobular inflammation, and NAFLD activity score. (C) Representative immunohistochemical images of TXNIP protein expression in mice fed a control or MCD diet for 4 w (n = 5–7 per group). Scale bars: 100 μm and 50 μm, respectively. A semiquantitative analysis of the IOD of TXNIP-positive areas is shown to the right of the images. Ten fields (final magnification, × 400) were randomly selected for each sample, and the IOD of all positive staining in each image was measured. (D) Hepatic expression of TXNIP in mice fed a control or MCD diet (n = 5–7 per group). (E) mRNA levels of Txnip after PA treatment. AML12 cells were treated with PA (upper: 0, 200, 400, or 800 μM of PA for 6 h; lower: 400 μM PA for 0, 3, 6, or 12 h) and then subjected to qRT-PCR. (F) Subcellular localization of TXNIP after PA treatment in AML12 cells. Cells were treated with 800 μM PA for 6 h. Scale bar: 25 μm. Values represent means ± SEM. *P < 0.05, **P < 0.01 versus control
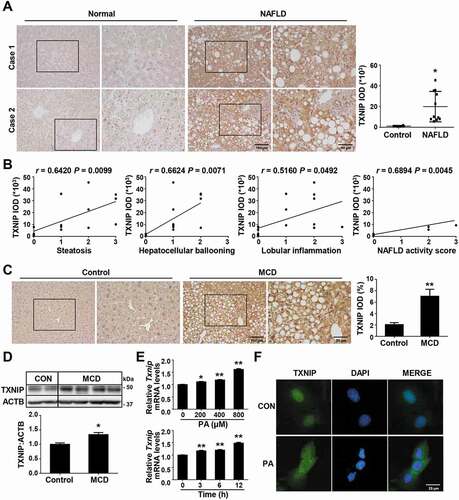
In NASH, FFAs are important mediators of lipotoxicity and contribute to the progression from simple steatosis to steatohepatitis [Citation25]. Patients with NASH exhibit increased FFA flux through the liver and elevated circulating FFA concentrations [Citation26]. In MCD diet-fed mice, serum FFA levels were also significantly elevated compared with controls, in association with increased TXNIP expression (data not shown). To determine whether FFAs upregulate TXNIP, we stimulated mouse hepatocytes with FFAs and measured TXNIP expression. The treatment of palmitic acid (PA), oleic acid (OA), or PA plus OA markedly upregulated Txnip mRNA expression in AML12 cells in a time- and concentration-dependent manner ( and S1). PA also induced the cytosolic translocation of TXNIP, which was predominantly localized in the nucleus under normal conditions (). Collectively, these data suggest that FFAs increase TXNIP expression in hepatocytes during the development of steatohepatitis.
TXNIP deficiency exacerbates MCD diet-induced hepatic steatosis, oxidative stress, inflammation, and fibrosis
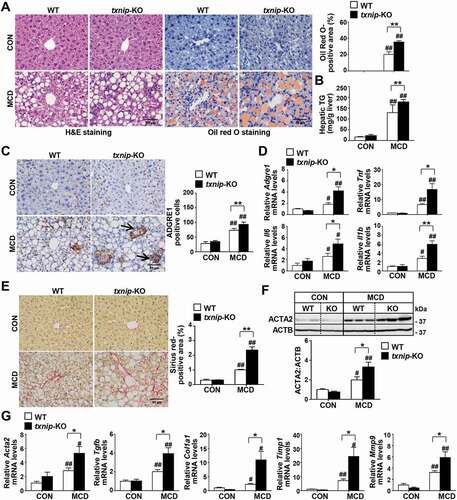
After confirming the upregulation of TXNIP in NAFLD patients and murine steatohepatitis, we explored the role of TXNIP in NASH pathogenesis. txnip-KO mice and their wild-type (WT) littermates were fed an MCD diet for 4 w. The body weights were similar between WT and txnip-KO mice after MCD diet feeding, but the absolute and relative liver weights were significantly higher in txnip-KO mice compared to WT mice (Fig. S2A and S2B). Serum GOT1/AST (glutamic-oxaloacetic transaminase 1) and GPT/ALT (glutamic pyruvic transaminase) levels were increased in MCD diet-fed txnip-KO mice (Fig. S2C). Liver histology and Oil Red O staining revealed that MCD diet-fed txnip-KO mice had a higher degree of steatosis than MCD diet-fed WT mice (). An analysis of hepatic lipid content confirmed that hepatic levels of TG were elevated in txnip-KO mice compared to WT mice after MCD diet feeding (). In addition, MCD diet-fed txnip-KO mice exhibited a higher malondialdehyde (MDA) level and lower activities of CAT (catalase) and SOD (superoxide dismutase) than MCD diet-fed WT mice (Fig. S2D). Immunohistochemical detection of the macrophage marker, ADGRE1/F4/80 (adhesion G protein-coupled receptor E1), revealed that macrophage infiltration was greater in MCD diet-fed txnip-KO mice compared to MCD diet-fed WT mice (). Quantitative real-time PCR (qRT-PCR) analyses also showed that the hepatic expression levels of the inflammatory genes, Adgre1, Tnf/Tnf-α (tumor necrosis factor), Il6 (interleukin 6), and Il1b/Il-1β (interleukin 1 beta), were markedly elevated in txnip-KO mice (). Furthermore, Sirius red staining revealed that MCD diet-induced liver fibrosis was more severe in txnip-KO mice than in WT mice (). The hepatic expression of ACTA2/α-SMA (actin, alpha 2, smooth muscle, aorta), a marker for hepatic stellate cell (HSC) activation, and the mRNA levels of Tgfb/Tgf-β (transforming growth factor, beta), Col1a1/Col1α1 (collagen, type I, alpha 1), Timp1 (tissue inhibitor of metalloproteinase 1), and Mmp9 (matrix metallopeptidase 9) were increased in MCD diet-fed txnip-KO mice compared to MCD diet-fed WT mice (). These results indicate that TXNIP deficiency leads to increased hepatic steatosis and exacerbates liver damage, inflammation, and fibrosis, thereby enhancing the progression to NASH.
Figure 2. TXNIP deficiency accelerates MCD diet-induced liver steatosis, inflammation, and fibrosis. WT and txnip-KO mice were fed an MCD diet for 4 w (n = 5–7 per group). (A) H&E and Oil Red O staining. Scale bar: 50 μm. Ten fields (final magnification, × 400) were randomly selected for each sample, and the positive staining in each image was measured. (B) Hepatic TG levels. (C) Immunohistochemical detection of ADGRE1 (arrow). Scale bar: 50 μm. Ten fields (final magnification, × 400) were randomly selected for each sample, and positive cells in each image were counted. (D) qRT-PCR detection of mRNA levels of Adgre1, Tnf, Il6, and Il1b. (E) Sirius red staining. Scale bar: 50 μm. Ten fields (final magnification, × 400) were randomly selected for each sample, and the positive area in each image was measured. (F) Western blot analysis for ACTA2. (G) qRT-PCR detection of mRNA levels of Acta2, Tgfb, Col1a1, Timp1, and Mmp9. Values represent means ± SEM. *P < 0.05, **P < 0.01 versus WT; #P < 0.05, ##P < 0.01 versus the same-genotype control
Elevated TXNIP expression is positively correlated with impaired autophagy in human NAFLD
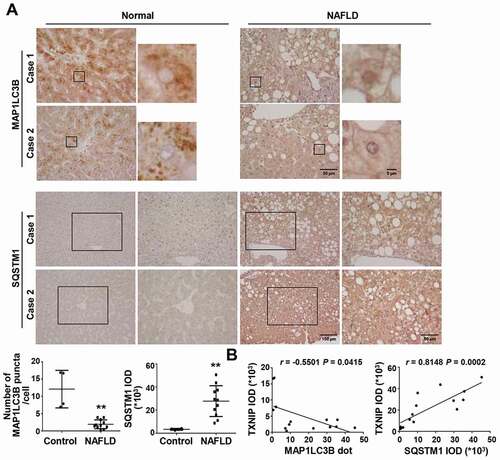
Decreased autophagic flux is associated with lipid accumulation and liver injury, and patients with NASH display impaired autophagy [Citation8,Citation11]. To elucidate the role of TXNIP in the autophagic response during NASH pathogenesis, we determined its correlation with autophagy in human samples by measuring the expression levels of the proteins, MAP1LC3B/LC3B (microtubule-associated protein 1 light chain 3 beta) and SQSTM1/p62 (sequestosome 1). Consistent with previous studies [Citation8], the number of MAP1LC3B puncta, a well-established marker of autophagy induction, was significantly lower in human NAFLD patients compared with normal controls, whereas the expression of SQSTM1, a protein known to be specifically degraded by autophagy, was increased (). We further examined the correlation between TXNIP and MAP1LC3B or SQSTM1 in NAFLD tissues. Intriguingly, TXNIP expression was negatively correlated with the number of MAP1LC3B puncta (r = −0.5501, P = 0.0415) and positively associated with SQSTM1 expression (r = 0.8148, P = 0.0002) in human subjects ().
Figure 3. NAFLD patients present impaired autophagy with increased TXNIP expression. (A) Representative images of immunohistochemical staining for MAP1LC3B and SQSTM1 in liver sections from controls (n = 4) and patients with NAFLD (n = 11). Scale bars: 100 μm, 50 μm, and 5 μm, respectively. The numbers of MAP1LC3B puncta and semiquantitative analysis of the IOD of SQSTM1-positive areas are shown below the image. Ten fields (final magnification, × 400) were randomly selected for each sample, and the positive staining in each image was measured. (B) Correlation between TXNIP and MAP1LC3B or SQSTM1 expression in human NAFLD patients. Values represent means ± SEM. *P < 0.05, **P < 0.01 versus control
TXNIP increases autophagy in hepatocytes
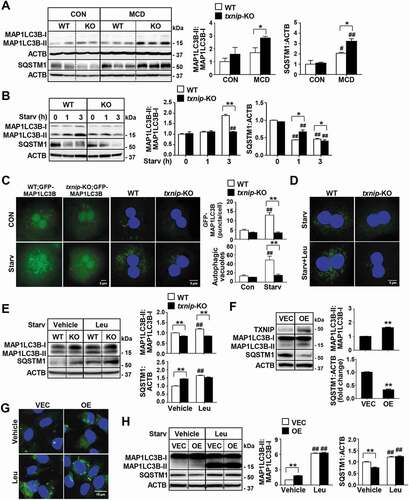
Given the positive correlation between upregulated TXNIP expression and defective autophagy in human NAFLD patients, we evaluated the contribution of TXNIP to autophagy in NASH pathogenesis. MCD diet feeding enhanced the conversion of MAP1LC3B-I to MAP1LC3B-II and increased the hepatic levels of SQSTM1 in WT mice. However, MCD diet-fed txnip-KO mice exhibited much higher MAP1LC3B-II generation and SQSTM1 expression than did MCD diet-fed WT mice (), suggesting that the clearance of autophagosomes is compromised and autophagic flux is impaired in txnip-KO mice. To further directly determine the role of TXNIP in autophagy, we constructed a classical autophagy activation model using serum starvation, as previously described [Citation27]. As shown in , amino acid starvation enhanced the conversion of MAP1LC3B-I to MAP1LC3B-II, increased green fluorescent protein (GFP)-MAP1LC3B puncta, reduced SQSTM1 expression, and elevated autophagic vacuole formation in WT hepatocytes. In contrast, txnip-KO hepatocytes exhibited no MAP1LC3B-II conversion, fewer GFP-MAP1LC3B puncta, much higher SQSTM1 expression, and fewer autophagic vacuoles than did WT hepatocytes at 1 or 3 h after starvation (). We also examined the effects of TXNIP on autophagy in vivo. Fasting increased MAP1LC3B-II conversion and reduced SQSTM1 expression in WT livers, but txnip-KO livers showed a decreased MAP1LC3B-II level and elevated SQSTM1 expression (Fig. S3A and S3B). To determine whether the decreased levels of MAP1LC3B-II in txnip-KO hepatocytes and mice resulted from defective autophagosome formation or increased autophagosome degradation, we used a lysosomal protease inhibitor (leupeptin; Leu) or autophagy flux inhibitors (chloroquine; CQ and bafilomycin A1; BafA1) [Citation28,Citation29]. Leu, CQ, or BafA1 treatments resulted in MAP1LC3B-II accumulation and increased numbers of autophagic vacuoles in fasted WT hepatocytes and livers. However, no elevation of the MAP1LC3B-II level or autophagic vacuole formation was noted in fasted txnip-KO hepatocytes or mice exposed to Leu, CQ, or BafA1 ( and S3C-E), demonstrating that autophagy induction is suppressed in txnip-KO hepatocytes and livers. In addition, the expression levels of the autophagy-related genes, Ulk1/Atg1a (unc-51 like autophagy activating kinase 1), Ulk2/Atg1b, Atg2a (autophagy related 2A), Atg3, Atg7, Gabarapl2/Atg8 (GABA type A receptor associated protein like 2), Atg12, and Atg13, were markedly suppressed in fasted txnip-KO mice relative to fasted WT mice (Fig. S3F). To further directly examine the effect of TXNIP on autophagy in hepatocytes, we established a stable TXNIP-overexpressing AML12 cell line. TXNIP overexpression led to elevated MAP1LC3B-II conversion and decreased SQSTM1 expression in AML12 cells (). Treatments with Leu or CQ increased MAP1LC3B-II accumulation and the numbers of autophagic vacuoles in TXNIP-overexpressing AML12 cells ( and S4). Together, these results suggest that increased expression of TXNIP contributes to MCD diet-induced NASH through the regulation of autophagy.
Figure 4. TXNIP deficiency causes defects in autophagy. (A) Western blot analysis of MAP1LC3B and SQSTM1 in livers of mice after 4 w of MCD diet feeding (n = 5–7 per group). (B) Immunoblot analysis of MAP1LC3B and SQSTM1 in hepatocytes after amino acid starvation. Immunoblots shown are representative of the results obtained from three independent experimental assays. (C) The formation of GFP-MAP1LC3B puncta and autophagic vacuoles. Primary hepatocytes were isolated from WT;Gfp-Map1lc3b and txnip-KO;Gfp-Map1lc3b mice. After 3 h of amino acid starvation, the numbers of puncta per hepatocyte were counted in 20 independent cells. Primary hepatocytes were also isolated from WT and txnip-KO mice. After 1 h of amino acid starvation, autophagic vacuoles were stained with green detection reagent and nuclei were stained with DAPI (blue). Scale bar: 5 μm. The numbers of autophagic vacuoles per hepatocyte were counted in 20 independent cells. (D) Autophagic vacuole formation in primary hepatocytes subjected to amino acid starvation for 1 h with or without Leu treatment. Autophagic vacuoles were stained with green detection reagent and nuclei were stained with DAPI (blue). Scale bar: 5 μm. (E) Immunoblot analysis of MAP1LC3B and SQSTM1 in hepatocytes subjected to amino acid starvation with or without Leu treatment. Immunoblots shown are representative of the results obtained from three independent experimental assays. (F) Immunoblot analysis of MAP1LC3B and SQSTM1 in AML12 control (vector control; VEC) or TXNIP-overexpressing (OE) cells. Immunoblots shown are representative of the results obtained from three independent assays. (G) Autophagic vacuole formation in AML12 cells subjected to 1 h of amino acid starvation with or without Leu treatment. Autophagic vacuoles were stained with green detection reagent and nuclei were stained with DAPI (blue). Scale bar: 15 μm. (H) Immunoblot analysis of MAP1LC3B and SQSTM1 in AML12 control (VEC) or TXNIP-overexpressing (OE) cells subjected to amino acid starvation with or without Leu treatment. Immunoblots shown are representative of the results obtained from three independent assays. Values represent means ± SEM. *P < 0.05, **P < 0.01 versus WT; #P < 0.05, ##P < 0.01 versus the same-genotype control
Suppression of beta-oxidation is accompanied by defective autophagy in txnip-KO mice
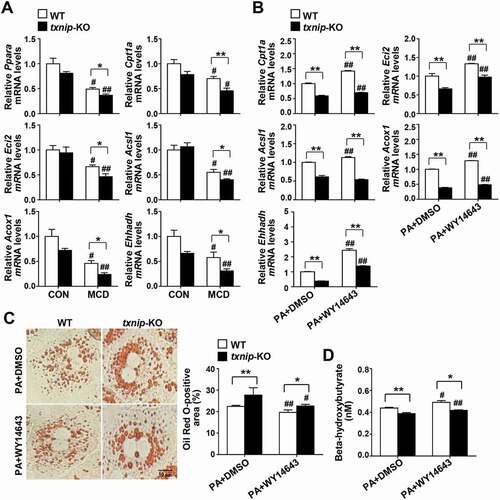
Recent evidence has shown that autophagy plays an important part in hepatocyte lipid metabolism, and that defective autophagy may contribute to the pathogenesis of NAFLD by decreasing FAO [Citation11]. Accordingly, we further evaluated the hepatic expression of genes involved in lipid metabolism and FAO. Despite the higher hepatic lipid accumulation observed in MCD diet-fed txnip-KO mice, there was no between-group difference in the mRNA expression levels of the lipogenic genes, Pparg (peroxisome proliferator activated receptor gamma), Fasn (fatty acid synthase), and Scd1 (stearoyl-Coenzyme A desaturase 1), or TG synthesis-related genes such as Dgat1 (diacyl-glycerol acyltransferase 1), Dgat2, Gpam (glycerol-3-phosphate acyltransferase, mitochondrial), Gk/Gyk (glycerol kinase), and Lpin1 (lipin 1) (Fig. S5). The expression levels of genes involved in FAO, including Ppara, Cpt1a (carnitine palmitoyltransferase 1a, liver), Eci2/Peci (enoyl-Coenzyme A isomerase 2), Acsl1 (acyl-CoA synthetase long-chain family member 1), Acox1 (acyl-Coenzyme A oxidase 1, palmitoyl), and Ehhadh (enoyl-Coenzyme A, hydratase/3-hydroxyacyl Coenzyme A dehydrogenase) were downregulated in both WT and txnip-KO mice after MCD diet feeding, but the decreases in expression were much greater in txnip-KO mice (). To directly determine the effects of TXNIP on PPARA-mediated beta-oxidation, WT and txnip-KO hepatocytes were treated with PA plus PPARA agonist (WY14643) or vehicle. WY14643 treatment increased expression of the PPARA target genes, Cpt1a, Eci2, Acsl1, Acox1, and Ehhadh, in both PA-treated WT and txnip-KO hepatocytes, but these increases were much smaller in txnip-KO hepatocytes (). WY14643 also inhibited PA-induced lipid accumulation and increased the levels of beta-hydroxybutyrate, a metabolic product of beta-oxidation in WT hepatocytes, but these effects were markedly diminished in txnip-KO hepatocytes (). These results indicate that TXNIP deficiency suppresses the expression of PPARA and PPARA target genes and decreases FAO, resulting in enhanced lipid deposition in txnip-KO hepatocytes.
Figure 5. TXNIP deficiency causes defects in PPARA-mediated FAO. (A) Hepatic expression of FAO-related genes in mice after 4 w of MCD diet feeding (n = 5–7 per group). (B) qRT-PCR detection of mRNA levels of FAO-related genes. Primary hepatocytes were isolated and incubated with PA (125 μM) plus the PPARA agonist, WY14643 (30 μM), or DMSO for 6 h. (C) Oil Red O staining in hepatocytes. Primary hepatocytes were treated with PA (125 μM) plus WY14643 (30 μM) or DMSO for 6 h. The positive staining per hepatocyte was measured in 20 independent cells. Scale bar: 10 μm. (D) Levels of beta-hydroxybutyrate in hepatocytes. Primary WT and txnip-KO hepatocytes were treated with PA (125 μM) plus WY14643 (30 μM) or DMSO for 6 h. Values represent means ± SEM. *P < 0.05, **P < 0.01 versus WT; #P < 0.05, ##P < 0.01 versus the same-genotype control
TXNIP regulates autophagy by interacting with p-PRKAA
To elucidate the molecular mechanisms through which TXNIP modulates autophagy, we searched for potential TXNIP-interacting proteins in the STRING database (Fig. S6A). We found that TXNIP has a potential functional connection with PRKAA (a catalytic subunit of AMP-activated protein kinase, AMPK), an energy sensor protein kinase that plays a key role in regulating cellular energy metabolism and autophagy (Fig. S6B). The prediction score for the TXNIP-PRKAA interaction was 0.657, which ranked the top 10 among the functional TXNIP-centric protein-interaction networks (Fig. S6C). Intriguingly, MCD diet feeding induced activation of PRKAA in WT mice, but txnip-KO mice exhibited much less PRKAA activation compared to WT mice (). Furthermore, txnip-KO hepatocytes or livers showed significantly decreased phosphorylation of PRKAA compared with WT hepatocytes or livers after serum starvation or fasting ( and S6D). In contrast, the overexpression of TXNIP in AML12 cells was associated with enhanced PRKAA phosphorylation and autophagy, and these effects were diminished by the silencing of Txnip (). The positive effect of TXNIP on p-PRKAA led us to further explore the molecular mechanisms connecting these two proteins. TXNIP was found to co-localize with p-PRKAA in hepatocytes, and this co-localization was increased following starvation (). We prepared HEK293 cells stably expressing Flag-TXNIP and performed co-immunoprecipitation (co-IP) assays. Our results revealed that there was a marked interaction between TXNIP and p-PRKAA ().
Figure 6. TXNIP induces autophagy related to the PRKAA pathway. (A) Western blot analysis of p-PRKAA and PRKAA in MCD diet-fed mice (n = 5–7 per group). (B) Immunoblotting of p-PRKAA and PRKAA in hepatocytes. Primary mouse hepatocytes from WT and txnip-KO mice were stimulated by amino acid starvation for the indicated durations. Immunoblots shown are representative of the results obtained from three independent experimental assays. (C) Western blot analysis of p-PRKAA, PRKAA, MAP1LC3B, and SQSTM1 in AML12 control (VEC) or TXNIP-overexpressing (OE) cells transfected with control (Ctrl) or Txnip siRNAs for 24 h. Immunoblots shown are representative of the results obtained from three independent assays. (D) Subcellular localization of TXNIP and p-PRKAA in AML12 cells subjected to amino acid starvation for 1 h. Scale bars: 50 μm and 10 μm. (E) Co-immunoprecipitation and immunoblot analysis of the interaction between TXNIP and p-PRKAA. HEK293 cells were transfected with Flag-TXNIP and lysates were immunoprecipitated with an anti-Flag monoclonal antibody. Co-immunoprecipitated p-PRKAA was detected with an anti-p-PRKAA antibody. (F) Western blot analysis of p-RPTOR, RPTOR, p-RPS6KB1, RPS6KB1, and nuclear TFEB in MCD diet-fed mice (n = 5–7 per group). (G) Immunoblot analysis of p-PRKAA, PRKAA, p-RPS6KB1, RPS6KB1, nuclear and cytosolic TFEB, and SQSTM1 in WT and txnip-KO hepatocytes treated with AICAR (500 µM) for 6 h and starved for 10 min. Immunoblots shown are representative of the results obtained from three independent experimental assays. Values represent means ± SEM. *P < 0.05, **P < 0.01 versus WT; #P < 0.05, ##P < 0.01 versus the same-genotype control
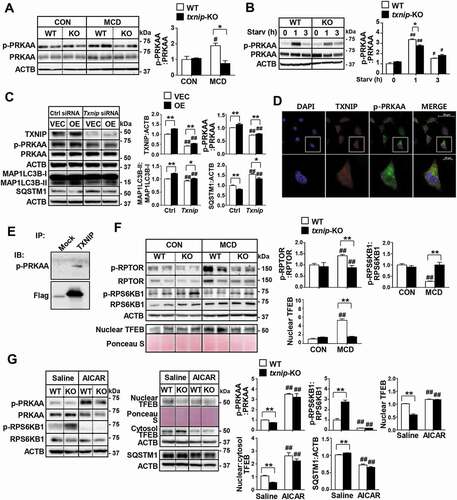
Activation of PRKAA contributes to inhibition of MTOR (mechanistic target of rapamycin kinase) complex 1 (MTORC1) activity and allows dephosphorylated TFEB (transcription factor EB) to enter the nucleus [Citation30]. The activated TFEB induces transcription of its numerous target genes, including those related to autophagy [Citation31]. As shown in , MCD diet feeding increased the phosphorylation of RPTOR (regulatory associated protein of MTOR complex 1), inhibited RPS6KB1/p70S6K1 (ribosomal protein S6 kinase, polypeptide 1) phosphorylation, a marker of MTORC1 activity, and induced nuclear translocation of TFEB in WT mice. However, txnip-KO mice exhibited markedly reduced activation of RPTOR, enhanced RPS6KB1 phosphorylation, and a decreased nuclear level of TFEB. In addition, the expression levels of Atg9a, Wipi1 (WD repeat domain, phosphoinositide interacting 1), Vps11 (VPS11 core subunit of CORVET and HOPS complexes), Vps18 (VPS18 core subunit of CORVET and HOPS complexes), and Uvrag (UV radiation resistance associated), well-known TFEB-target genes that are involved in autophagy, were significantly decreased in MCD diet-fed txnip-KO mice compared with MCD diet-fed WT mice (Fig. S6E). Similarly, while amino acid starvation or fasting increased RPTOR phosphorylation, enhanced the nuclear TFEB level, and inhibited RPS6KB1 phosphorylation in WT hepatocytes or livers, these phenomena were highly attenuated in txnip-KO hepatocytes or livers (Fig. S6F and S6G). This observation prompted us to investigate whether PRKAA-mediated regulation of MTORC1 and TFEB is responsible for the impaired autophagy seen in txnip-KO hepatocytes. We found that activation of PRKAA with AICAR decreased SQSTM1 expression, inhibited MTORC1, and decreased the nuclear translocation of TFEB in txnip-KO hepatocytes (). These data demonstrate that TXNIP interacts with p-PRKAA, leading to inactivation of MTORC1 and nuclear translocation of TFEB, which in turn may promote autophagy.
Induction of MTORC1-mediated autophagy ameliorates NASH in txnip-KO hepatocytes and livers
Given that loss of TXNIP resulted in impaired autophagy with MTORC1 activation, we investigated whether inhibition of MTORC1 can restore autophagy in txnip-KO hepatocytes. Western blot analyses showed that rapamycin treatment suppressed MTORC1 activity and enhanced amino acid starvation- or fasting-induced autophagy in both WT and txnip-KO hepatocytes and livers (Fig. S7A and S7B). In addition, it markedly inhibited PA-induced lipid accumulation in both WT and txnip-KO hepatocytes. Inhibition of autophagy by silencing of Atg7, an essential autophagy gene, increased lipid accumulation in both rapamycin-treated WT and txnip-KO hepatocytes (Fig. S7C), indicating that the ability of rapamycin to reduce lipid accumulation in txnip-KO hepatocytes is largely dependent on autophagy. Furthermore, rapamycin treatment increased the PA-induced upregulations of the mRNAs for Ppara and its target genes, Cpt1a, Eci2, Acsl1, Acox1, and Ehhadh, in both WT and txnip-KO hepatocytes (Fig. S7D), demonstrating that TXNIP may regulate FAO in hepatocytes via MTORC1-mediated autophagy.
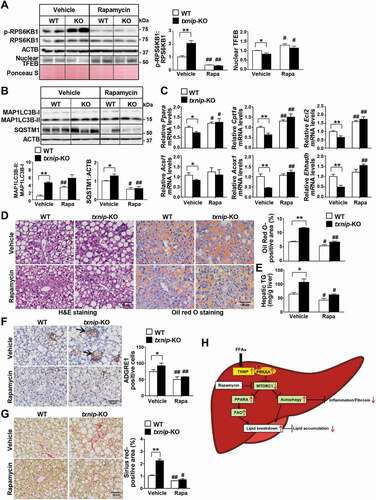
To further address the contributions of autophagy to the TXNIP deficiency-induced development of NASH in vivo, WT and txnip-KO mice were fed an MCD diet accompanied by simultaneous injection of rapamycin during the final week of the experimental period. The decreased nuclear level of TFEB in MCD diet-fed txnip-KO mice was partly recovered by rapamycin, along with decreased MTORC1 activity (). Consistent with our results of starvation, rapamycin treatment induced autophagy and elevated the expression of FAO-related genes in MCD diet-fed txnip-KO mice to levels comparable to those in MCD diet-fed WT mice (). Notably, rapamycin attenuated the MCD diet-induced increases in hepatic lipid accumulation and TG levels in txnip-KO mice (). It reduced macrophage infiltration and the hepatic mRNA levels of Adgre1, Tnf, Il6, and Il1b in MCD diet-fed txnip-KO mice to levels similar to those seen in WT mice ( and S7E). We found no difference in the extent of liver fibrosis after rapamycin treatment between MCD diet-fed WT and txnip-KO mice ( and S7F). Collectively, these results indicate that autophagy induction via MTORC1 inactivation attenuates fat accumulation, inflammation, and fibrosis in txnip-KO mice ().
Figure 7. Induction of autophagy by MTORC1 inactivation suppresses MCD diet-induced hepatic steatosis, inflammation, and fibrosis in txnip-KO livers. WT and txnip-KO mice were fed an MCD diet for 4 w, with rapamycin (5 mg/kg/d) applied during the final week (n = 5–7 per group). (A) Western blot analysis of p-RPS6KB1, RPS6KB1, and nuclear TFEB. (B) Immunoblotting of MAP1LC3B and SQSTM1. (C) Hepatic expression of FAO-related genes. (D) H&E and Oil Red O staining. Scale bar: 50 μm. Ten fields (final magnification, × 400) were randomly selected for each sample, and the positive area in each image was measured. (E) Hepatic TG levels. (F) Immunohistochemical detection of ADGRE1 (arrow). Scale bar: 50 μm. Ten fields (final magnification, × 400) were randomly selected for each sample, and positive cells in each image were counted. (G) Sirius red staining. Ten fields (final magnification, × 400) were randomly selected for each sample, and the positive area in each image was measured. Scale bar: 50 μm. (H) A proposed model of TXNIP-mediated autophagy and FAO in NASH pathogenesis. In NASH, an elevated FFA flux upregulates TXNIP expression in hepatocytes. TXNIP promotes PRKAA phosphorylation, MTORC1 inactivation, and TFEB nuclear translocation, leading to autophagy induction and FAO. This could contribute to MCD diet-induced steatosis, inflammation, and fibrosis. Values represent means ± SEM. *P < 0.05, **P < 0.01 versus WT; #P < 0.05, ##P < 0.01 versus the same genotype control
Discussion
Accumulating evidence suggests that impaired autophagy contributes to NASH development. However, the underlying mechanism responsible for regulating autophagy in NASH remains obscure, and effective therapeutic strategies for correcting autophagic defects are limited. In the current study, we provide evidence that TXNIP is upregulated in both human NAFLD patients and experimental models of NASH. Further investigations demonstrated that TXNIP serves a protective function to ameliorate NASH pathogenesis by promoting autophagy and FAO via interacting with p-PRKAA.
TXNIP has been shown to play a pivotal role in various liver diseases. In a previous study, we found that TXNIP expression is suppressed in human HCC tissues and further demonstrated that the loss of TXNIP greatly increases the susceptibility to diethylnitrosamine (DEN)-induced hepatocarcinogenesis in mice [Citation32]. In addition, the level of TXNIP in liver is downregulated after partial hepatectomy, and liver recovery is accelerated in txnip-KO mice compared with WT mice [Citation33–35]. Here, we found that TXNIP was present at low levels in normal liver tissues, but its expression was markedly increased in NAFLD tissues. Consistent with this enhanced expression in human NAFLD, TXNIP was upregulated in MCD diet-induced steatohepatitis mouse models. TXNIP induction coincided with increased levels of FFAs, and PA treatment triggered TXNIP upregulation in hepatocytes. To better define the role of TXNIP upregulation in the pathogenesis of NASH, we examined the consequences of TXNIP downregulation using txnip-KO mice or primary hepatocytes. TXNIP deletion promoted lipid accumulation in PA-exposed hepatocytes and accelerated the susceptibility of mice to MCD diet-induced steatohepatitis. These observations contrast with those of a previous study showing that TXNIP expression is significantly elevated in livers of NASH patients, but that inhibition of TXNIP ameliorates hepatic steatosis and inflammation in HFD-fed mice by suppressing hepatic lipogenesis [Citation23]. This discrepancy may be attributable to the diverse functionality of TXNIP in physiological and pathological processes. An unexpected finding of the present study was that, despite the exacerbated hepatic steatosis seen in txnip-KO mice, there was no difference in the expression levels of genes involved in hepatic lipogenesis or TG synthesis between WT and txnip-KO mice fed an MCD diet. This observation suggests the existence of lipid synthesis pathway-independent mechanisms in our models.
Previous studies have reported impaired autophagy flux in human liver samples with steatosis and NASH by showing an increase in MAP1LC3B-II and SQSTM1 expression [Citation8]. We demonstrated here for the first time that increased TXNIP expression is correlated with the elevated MAP1LC3B puncta and SQSTM1 expression in human NAFLD, providing clinical evidence for a positive relationship between TXNIP upregulation and impaired autophagy. However, the contribution of TXNIP to autophagy has been controversial. One study reported that inhibition of TXNIP improves autophagy and mitophagy in diabetic nephropathy [Citation35], whereas another showed that TXNIP is required for both basal and hypoxia-induced autophagy in mouse embryonic fibroblasts (MEFs) [Citation36]. In the current study, we utilized a classic autophagy activation model with nutritional starvation to evaluate the role of TXNIP in modulating autophagy. Our data indicate that deficiency of TXNIP markedly suppressed starvation-induced autophagy in murine primary hepatocytes and livers, suggesting that TXNIP might promote autophagy. These results were further corroborated by our observation that autophagy is enhanced TXNIP-overexpressing AML12 cells. Therefore, when the NAFLD/NASH is developed and hepatic autophagy flux is defect, TXNIP expression levels are elevated compensatively to promote autophagy and protect against hepatocyte damage. Collectively, TXNIP expression elevation in NAFLD patients and MCD diet-fed mice could be a compensatory or adaptive response, rather than a driver of impaired autophagy during the progression of NASH.
What is the underlying molecular mechanism responsible for mediating the effects of TXNIP on autophagy? We herein provide several lines of evidence suggesting that TXNIP regulates autophagy by interacting with p-PRKAA. First, co-IP analyses showed that TXNIP directly bound to p-PRKAA. Second, PRKAA phosphorylation was significantly suppressed in TXNIP-deficient hepatocytes and livers in response to starvation or MCD diet feeding along with impaired autophagy induction. In contrast, TXNIP overexpression led to an increase in PRKAA phosphorylation with enhanced autophagy, which was abolished by silencing of Txnip. Finally, ectopic PRKAA activation by AICAR in txnip-KO hepatocytes reversed the autophagy defect, suggesting that TXNIP mediates autophagy through p-PRKAA. However, the interaction between TXNIP and PRKAA could affect many downstream pathways other than autophagy, such as energy homeostasis. Wu et al. reported that TXNIP binds SLC2A1/GLUT1 (solute carrier family 2 [facilitated glucose transporter], member 1) to suppress glucose uptake. Under a low-energy status, activated PRKAA triggers the degradation of TXNIP via phosphorylation and stimulates glucose uptake by activating SLC2A1. The influx of glucose through SLC2A1 restores the ATP:ADP ratio in the short run and ultimately induces TXNIP protein production to suppress glucose uptake once energy homeostasis has been reestablished [Citation37]. Further research is needed to examine the diverse effects of TXNIP- PRKAA-mediated signaling on the pathogenesis of liver diseases.
Activated PRKAA inhibits MTORC1 activity, resulting in TFEB nuclear translocation [Citation30,Citation38]. TFEB binds specifically to a 10-bp (GTCACGTGAC) motif found in the promoter regions of many genes encoding for autophagy induction and lysosomal biogenesis [Citation31,Citation39]. A previous report showed that TXNIP regulates tubular autophagy and mitophagy in diabetic nephropathy through the MTORC1 signaling pathway [Citation35]. To gain further insight into the mechanistic link between TXNIP and autophagy, we investigated the effect of TXNIP on MTORC1 and TFEB. Our data revealed that TXNIP deficiency was associated with sustained MTORC1 activation and decreased TFEB nuclear translocation in livers in response to MCD diet feeding. Ectopic PRKAA activation led to MTORC1 inhibition and nuclear TFEB translocation in txnip-KO hepatocytes. Notably, inhibition of MTORC1 restored autophagy impairment and thereby reduced lipid accumulation in txnip-KO hepatocytes and livers, an effect that was abolished by knockdown of the essential autophagy-related gene, Atg7. Furthermore, MCD diet-induced hepatic steatosis was diminished in txnip-KO mice following rapamycin treatment. Collectively, these data demonstrate that TXNIP induces autophagy by directly binding to p-PRKAA and regulating MTORC1 and TFEB.
It has been reported that in the absence of autophagy, cells may be unable to process lipid droplets through acid lipases; this is proposed to result in lipid droplet accumulation and decreased FFA availability, leading to decreased mitochondrial beta-oxidation and ATP production [Citation40]. Pharmacologic or genetic inhibition of autophagy in hepatocytes has been shown to reduce the rates of beta-oxidation and cause marked lipid accumulation [Citation11]. In this study, we observed that inhibition of MTORC1 reversed the attenuated expression levels of PPARA and FAO-related genes along with autophagy induction, thereby reducing hepatic steatosis in txnip-KO hepatocytes and livers. Considering that the ability of rapamycin to reduce lipid deposition in txnip-KO hepatocytes is largely dependent on autophagy, it is possible that the observed effects on FAO were mediated through an autophagy-dependent mechanism. However, MTORC1 inhibits FAO by suppressing PPARA expression and function [Citation41]. In addition, TFEB directly controls PPARGC1A/PGC1A (PPARG coactivator 1 alpha), which regulates lipid metabolism and long-chain FAO via downstream PPARA [Citation42]. Future studies should seek to elucidate this potential mechanism.
The development of NAFLD begins with aberrant accumulation of TGs in the liver and, in some individuals, progresses to liver injury and fibrosis [Citation4]. Another important finding of this study is that txnip-KO mice exhibited exacerbated liver inflammation and fibrosis compared with WT mice after MCD diet feeding. By removing large misfolded molecules and dysfunctional organelles, autophagy plays an important role in the maintenance of cellular homeostasis [Citation43]. Notably, recent studies have shown that autophagy exerts a protective function against liver injury caused by a variety of challenges, including a MCD diet, lipopolysaccharide (LPS), TNF, acetaminophen (APAP), ischemia/reperfusion, and overload of fatty acids [Citation14,Citation43–45]. In contrast, genetic disruption of a variety of autophagy-related genes, including Atg5, Atg7, and Becn1/Beclin 1, has been shown to promote liver inflammation, fibrogenesis, and tumorigenesis [Citation6,Citation46,Citation47]. In the present study, we show that induction of autophagy by treatment with rapamycin reduced MCD diet-induced hepatic inflammation and fibrosis in txnip-KO mice, suggesting that TXNIP-mediated autophagy is a critical protective mechanism against MCD diet-induced liver injury as well as hepatic steatosis.
In conclusion, our results provide key evidence indicating that the FFA-induced upregulation of TXNIP in hepatocytes could prevent the pathogenesis of NASH by triggering the PRKAA pathway and consequent induction of autophagy and FAO. This study highlights TXNIP as a regulator of NASH pathogenesis and a potential target for the future development of promising therapeutic strategies.
Materials and methods
Human liver samples
Hepatic steatotic specimens were collected from patients with fatty livers who had undergone liver transplantation or biopsy (n = 11). Control liver samples were obtained from patients undergoing hepatic resection for intrahepatic bile duct stones (n = 4). All materials were used under a protocol approved by the Institutional Review Board of Chonnam National University Hospital (Daejoen, Republic of Korea) and all patients provided informed consent.
Animal experiments
WT and txnip-KO mice on a C57BL/6 background were used in this study [Citation48]. Mice expressing GFP-MAP1LC3B were obtained from N. Mizushima (Tokyo Medical and Dental University, Tokyo, Japan) and crossed to generate WT;Gfp-Map1lc3b and txnip-KO;Gfp-Map1lc3b mice. Animals were maintained on a standard rodent chow diet with a 12 h light/dark cycle.
Eight-week-old male mice were fed an MCD diet (MP Biomedicals, 02960439) for 4 w, with or without rapamycin (Sigma-Aldrich, 37094; 5 mg/kg/d) for the last week. Control animals were fed a normal chow diet. At the end of experiments, all animals were anesthetized and sacrificed after 2 h of fasting. In the fasting experiments, mice were fasted for 24 h to induce autophagy. For rapamycin treatment, 5 mg/kg/d of rapamycin or vehicle was administered to mice for 3 d prior to starvation. For Leu (Sigma-Aldrich, L2884) treatment, 30 mg/kg of Leu was administered intraperitoneally 1 h before euthanasia. Studies were conducted in accordance with the principles and procedures outlined in the National Institutes of Health (NIH) Guide for the Care and Use of Laboratory Animals and were approved by the Chungnam National University Animal Care and Use Committee.
Primary hepatocyte isolation and treatment
Hepatocytes were isolated from WT, txnip-KO, WT;Gfp-Map1lc3b, and txnip-KO;Gfp-Map1lc3b using the previously reported collagenase method [Citation49]. Cells were cultured in Dulbecco’s modified Eagle’s medium (DMEM; Welgene, LM001-11) supplemented with 10% inactive fetal bovine serum (FBS; Gibco, 16000–044) and 1% penicillin and streptomycin (Gibco, 15140–122) at 37°C in a humidified 5% CO2 atmosphere. In each experiment, hepatocytes isolated from three mice per each group were pooled together, suspended in a medium, and seeded onto triplicate for subsequent analysis. The hepatocytes were allowed to attach to the substrate and subjected to amino acid starvation for the indicated time periods using Grey’s Balanced Salt Solution (GBSS; Sigma-Aldrich, G9779) containing Leu (100 μM), CQ (1 mM; Sigma-Aldrich, c6628), BafA1 (100 nM; Sigma-Aldrich, B1793), rapamycin (5 μM), or AICAR (500 µM; Sigma-Aldrich, A9978). In some experiments, hepatocytes were treated with the PPARA agonist, WY-14643 (30 μM; Sigma-Aldrich, C7081), or Atg7 siRNA (Dharmacon) in combination with 125 μM PA (Sigma-Aldrich, P0500) for 6 h. The expression levels of Ppara and Ppara target genes were measured by qRT-PCR. An autophagy detection kit (Abcam, ab139484) was used according to the manufacturer’s protocol to detect autophagic vacuoles in hepatocytes.
Cell culture, transfection, and treatment
The murine hepatocyte cell line, AML12, was obtained from ATCC (CRT-2254). To establish stable cell lines overexpressing TXNIP, AML12 cells were transfected with control (Ctrl) or TXNIP-expressing constructs (GeneCopoeia, EX-Mm07552-M68 and EX-NEG-M68) using the Xfect transfection system (Clontech Laboratories, 631317) according to the manufacturer’s recommendations. Positive clones were selected with puromycin for 3 w and identified using qRT-PCR. Cells were cultured in DMEM supplemented with 10% inactive FBS, 1 X insulin-transferrin-selenium (Gibco, 41400–045), and 1% penicillin and streptomycin at 37°C in a humidified 5% CO2 atmosphere. The cells were incubated for the indicated durations in medium containing the indicated concentrations of PA and OA (Sigma-Aldrich, O3008). The cells were transfected with Ctrl or Txnip siRNA (Dharmacon) for 24 h using the Lipofectamine 2000 transfection reagent (Invitrogen, 11668–019) according to the manufacturer’s instructions. Cells were subjected to amino acid starvation for the indicated periods using GBSS containing Leu (100 μM) or CQ (1 mM). Immunofluorescence was performed using antibodies against TXNIP (MBL International, K0205-3) or p-PRKAA/AMPKA (Cell Signaling Technology, 2535). The cells were fixed in 4% paraformaldehyde (Biosesang, PC2031-100-00) permeabilized with 0.1% Triton X-100 (MP Biomedicals, 04807426) for 15 min, blocked with donkey serum (Sigma-Aldrich, D9663) for 1 h, incubated for 12 h at 4°C with primary antibodies, and then incubated with the appropriate secondary antibody. The secondary antibodies included Alexa Fluor 555-conjugated donkey anti-mouse antibody (Thermo Fisher Scientific, A-31570), Alexa Fluor 488-conjugated donkey anti-mouse antibody, (Thermo Fisher Scientific, R37114), and Alexa Fluor 488-conjugated donkey anti-rabbit antibody (Thermo Fisher Scientific, A-21206). Cell nuclei were dyed with DAPI (ImmunoBioscience, AR-6501-01). The cells were visualized using an Eclipse Ni-U microscope system (Nikon) and a super-resolution confocal laser scanning microscope (Carl Zeiss, LSM 880 with Airyscan).
Immunoprecipitation
HEK293 cells (ATCC, CRT-1573) were cultured in DMEM with 10% inactive FBS and 1% penicillin and streptomycin at 37°C in a humidified 5% CO2 atmosphere. The cells were transfected with Flag-TXNIP, and lysates were immunoprecipitated with an anti-Flag monoclonal antibody. Co-immunoprecipitated p-PRKAA was detected with an anti-p-PRKAA antibody.
Blood chemistry, serum non-esterified fatty acids (NEFAs), and hepatic lipid levels
Serum GOT1, GPT, cholesterol, and TG levels were determined using an IDEXX analyzer system (IDEXX Laboratories). Serum NEFAs were measured using a commercial kit (Fujifilm Wako Pure Chemical Corporation, 999–34691, 995–34791, 991–34891, 993–35191, 276–76491) according to the manufacturer’s protocol. Briefly, samples were mixed with acyl-CoA synthetase (ACS) and incubated for 5 min, after which acyl-CoA oxidase (ACOD) was added to each well and the plates were incubated for an additional 5 min. NEFAs in serum are converted to acyl-CoA and oxidized to yield a purple pigment. The concentration of NEFAs was determined by measuring absorbance at 550 nm. Hepatic TGs were determined by homogenizing frozen liver in 1 ml of 5% NP-40 (Invitrogen, FNN0021) in distilled water and then heating the mixture slowly to 95°C in a water bath for 5 min. Thereafter, the samples were cooled to room temperature. The heating was repeated once to ensure solubilization of all TGs. The mixture was centrifuged at 13,680 x g for 2 min, the supernatant was collected, and hepatic TGs were measured using a commercial TG kit (Cayman Chemical, 10010303) according to the manufacturer’s protocol.
Histology and Oil Red O staining
Formalin-fixed liver samples were paraffin embedded, sectioned (4 μm), and stained with H&E and Sirius red. Fat accumulation in the liver was analyzed by staining 7 μm thick frozen sections with Oil Red O (Sigma-Aldrich, O1516), counterstaining the sections with Mayer’s hematoxylin, and visualizing the sections under light microscopy. Immunohistochemistry was performed using antibodies against TXNIP, SQSTM1 (Abgent, AP2183B), MAP1LC3B (Sigma-Aldrich, L7543), or ADGRE1 (Abcam, ab6640). For each IHC staining, a PBS negative control was confirmed. Ten fields (final magnification, × 400) were randomly selected for each sample, and the integrated optical density (IOD) of all positive staining in each image was measured using MetaMorph 4.6 imaging software systems (Molecular Devices).
Western blotting
To obtain total proteins, tissues or cells were lysed in RIPA buffer (Cell Signaling Technology, 9806) supplemented with protease inhibitors (Roche, 5892970001) and phosphatase inhibitors (Roche, 4906837001). For nuclear and cytosolic protein extraction, tissues or cells were homogenized in lysis buffer containing 10 mM N-(2-hydroxyethyl) piperazine-N-2-ethanesulfonic acid (HEPES; Sigma-Aldrich, H0887), 10 mM MgCl2 (Sigma-Aldrich, M8266), 10 mM dithiothreitol (DTT; Sigma-Aldrich, 646563), 1 mM phenylmethylsulfonyl fluoride (Sigma-Aldrich, P7626), 10 μg aprotinin (Sigma-Aldrich, A1153), and 10 μg Leu. The samples were incubated for 30 min on ice and centrifuged at 1,200 × g for 5 min at 4°C. Each supernatant (cytosolic fraction) was removed and the remaining pellet was resuspended in resuspension buffer (10 mM HEPES, 10 mM MgCl2, 0.3 mM EDTA, 10% glycerol, 10 mM DTT, 1 mM phenylmethylsulfonyl fluoride, 10 μg aprotinin, and 10 μg Leu). After incubation, the samples were centrifuged at 25,000 × g for 30 min at 4°C and the supernatant was collected (nuclear fraction). Protein concentrations were determined using a BCA Protein Assay Kit (Thermo Fisher Scientific, 23225). Equal amounts of protein (10–50 μg) were separated by SDS-PAGE and transferred to a polyvinylidene difluoride membrane (Merck Millipore, IPVH00010). The membranes were blocked with 5% bovine serum albumin (BSA; Sigma-Aldrich, A2058) for 1 h at room temperature and the membranes were incubated with primary antibodies overnight at 4°C. The utilized primary antibodies included anti-SQSTM1, anti-p-PRKAA/AMPKA, anti-PRKAA/AMPKA (Cell Signaling Technology, 5831), anti-p-RPTOR (Cell Signaling Technology, 2083), anti-RPTOR (Cell Signaling Technology, 2280), anti-p-RPS6KB1 (Cell Signaling Technology, 9205), anti-RPS6KB1 (Cell Signaling Technology, 9202), anti-TXNIP, anti-MAP1LC3B, anti-ACTA2 (Abcam, ab5694), anti-TFEB (Bethyl Laboratories, A303-673A), and ACTB (actin beta; Sigma-Aldrich, A1978). Immunoreactive bands were visualized using alkaline phosphatase-conjugated anti-mouse or rabbit antibodies and an enhanced chemiluminescent (ECL) substrate (Thermo Fisher Scientific, 34096 and 34577). The bands were imaged using an ImageSaver6 LuminoGraph (ATTO) without saturation and analyzed with the CSAnalyzer 4 software (ATTO). The relative density was calculated as the ratio of the intensity of the gene of interest to that of ACTB, and all band detection was within the linear range.
qRT-PCR
Tissues were rapidly isolated and homogenized in TRIzol reagent (Invitrogen, 15596018), and total RNA was extracted according to the manufacturer’s protocol. The corresponding cDNA was synthesized using a ReverTra Ace® qPCR RT Kit & Master Mix (Toyobo, FSQ-101). Expression levels of genes were measured by qRT-PCR using the SYBR Green PCR Master Mix (Applied Biosystems, 4367659) and a StepOne Real-Time PCR System (Applied Biosystems). The primer pairs used for qRT-PCR are listed in Table S1.
Measurement of hepatic beta-hydroxybutyrate
Hepatic beta-hydroxybutyrate levels were assessed using a commercially available colorimetric kit (Biovision, K632-100) as described by the manufacturer. Briefly, 100 mg of liver was homogenized in 500 μl of assay buffer on ice. The sample was centrifuged at 4°C for 15 min at 9,500 x g, and the supernatant was collected, diluted 10-fold, and mixed with beta-hydroxybutyrate dehydrogenase, which generates a product that reacts with a colorimetric probe to produce an absorbance band at 450 nm.
Statistical analysis
Data are expressed as means ± standard error of the mean (SEM). Student’s t-test was used to compare values between two groups. Values obtained from three or more groups were compared using one-way analysis of variance (ANOVA) followed by Tukey’s post hoc test. A P-value < 0.05 was considered significant.
Supplemental Material
Download MS Word (2 MB)Disclosure statement
No potential conflict of interest was disclosed.
Supplementary material
Supplemental data for this article can be accessed here.
Additional information
Funding
References
- Loomba R, Sanyal AJ. The global NAFLD epidemic. Nat Rev Gastroenterol. 2013;10(11):686.
- Ponziani FR, Pecere S, Gasbarrini A, et al. Physiology and pathophysiology of liver lipid metabolism. Expert Rev Gastroenterol Hepatol. 2015;9(8):1055–1067.
- Cusi K. Role of obesity and lipotoxicity in the development of nonalcoholic steatohepatitis: pathophysiology and clinical implications. Gastroenterology. 2012;142(4):711–725. e6.
- Tiniakos DG, Vos MB, Brunt EM. Nonalcoholic fatty liver disease: pathology and pathogenesis. Annu Rev Pathol -Mech. 2010;5:145–171.
- Byrne CD, Targher G. NAFLD: a multisystem disease. J Hepatol. 2015;62(1):S47–S64.
- Takamura A, Komatsu M, Hara T, et al. Autophagy-deficient mice develop multiple liver tumors. Genes Dev. 2011 Apr 15;25(8):795–800.
- Yang Z, Klionsky DJ. Eaten alive: a history of macroautophagy. Nat Cell Biol. 2010;12(9):814.
- Gonzalez-Rodriguez A, Mayoral R, Agra N, et al. Impaired autophagic flux is associated with increased endoplasmic reticulum stress during the development of NAFLD. Cell Death Dis. 2014;5(4):e1179.
- Mei S, Ni H-M, Manley S, et al. Differential roles of unsaturated and saturated fatty acids on autophagy and apoptosis in hepatocytes. J Pharmacol Exp Ther. 2011;339(2):487–498.
- Zeng T-S, Liu F-M, Zhou J, et al. Depletion of Kupffer cells attenuates systemic insulin resistance, inflammation and improves liver autophagy in high-fat diet fed mice. Endocr J. 2015;62(7):615–626.
- Singh R, Kaushik S, Wang Y, et al. Autophagy regulates lipid metabolism. Nature. 2009;458(7242):1131.
- Harada M, Hanada S, Toivola DM, et al. Autophagy activation by rapamycin eliminates mouse Mallory‐Denk bodies and blocks their proteasome inhibitor‐mediated formation. Hepatology. 2008;47(6):2026–2035.
- Lin C-W, Zhang H, Li M, et al. Pharmacological promotion of autophagy alleviates steatosis and injury in alcoholic and non-alcoholic fatty liver conditions in mice. J Hepatol. 2013;58(5):993–999.
- Chen R, Wang Q, Song S, et al. Protective role of autophagy in methionine–choline deficient diet-induced advanced nonalcoholic steatohepatitis in mice. Eur J Pharmacol. 2016;770:126–133.
- Chen K-S, DeLuca HF. Isolation and characterization of a novel cDNA from HL-60 cells treated with 1, 25-dihydroxyvitamin D-3. BBA-Gene Struct Expression. 1994;1219(1):26–32.
- Junn E, Han SH, Im JY, et al. Vitamin D3 up-regulated protein 1 mediates oxidative stress via suppressing the thioredoxin function. J Immunol. 2000;164(12):6287–6295.
- Nishiyama A, Matsui M, Iwata S, et al. Identification of thioredoxin-binding protein-2/vitamin D3 up-regulated protein 1 as a negative regulator of thioredoxin function and expression. J Biol Chem. 1999;274(31):21645–21650.
- Parikh H, Carlsson E, Chutkow WA, et al. TXNIP regulates peripheral glucose metabolism in humans. PLoS Med. 2007;4(5):e158.
- Chutkow WA, Patwari P, Yoshioka J, et al. Thioredoxin-interacting protein (Txnip) is a critical regulator of hepatic glucose production. J Biol Chem. 2008;283(4):2397–2406.
- O’neill HM. AMPK and exercise: glucose uptake and insulin sensitivity. Diabetes Metab J. 2013;37(1):1–21.
- Chen J, Hui ST, Couto FM, et al. Thioredoxin-interacting protein deficiency induces Akt/Bcl-xL signaling and pancreatic beta-cell mass and protects against diabetes. Faseb J. 2008;22(10):3581–3594.
- Oka S-I, Liu W, Masutani H, et al. Impaired fatty acid utilization in thioredoxin binding protein-2 (TBP-2)-deficient mice: a unique animal model of Reye syndrome. Faseb J. 2006;20(1):121–123.
- Park M-J, Kim D-I, Lim S-K, et al. Thioredoxin-interacting protein mediates hepatic lipogenesis and inflammation via PRMT1 and PGC-1α regulation in vitro and in vivo. J Hepatol. 2014;61(5):1151–1157.
- Donnelly KL, Margosian MR, Sheth SS, et al. Increased lipogenesis and fatty acid reesterification contribute to hepatic triacylglycerol stores in hyperlipidemic Txnip−/− mice. J Nutr. 2004;134(6):1475–1480.
- Neuschwander‐Tetri BA. Hepatic lipotoxicity and the pathogenesis of nonalcoholic steatohepatitis: the central role of nontriglyceride fatty acid metabolites. Hepatology. 2010;52(2):774–788.
- Li M, Xu C, Shi J, et al. Fatty acids promote fatty liver disease via the dysregulation of 3-mercaptopyruvate sulfurtransferase/hydrogen sulfide pathway. Gut. 2018;67(12):2169–2180.
- Inokuchi-Shimizu S, Park EJ, Roh YS, et al. TAK1-mediated autophagy and fatty acid oxidation prevent hepatosteatosis and tumorigenesis. J Clin Invest. 2014;124(8):3566–3578.
- Kominami E, Hashida S, Khairallah E, et al. Sequestration of cytoplasmic enzymes in an autophagic vacuole-lysosomal system induced by injection of leupeptin. J Biol Chem. 1983;258(10):6093–6100.
- Mauthe M, Orhon I, Rocchi C, et al. Chloroquine inhibits autophagic flux by decreasing autophagosome-lysosome fusion. Autophagy. 2018;14:1435–1455.
- Herzig S, Shaw RJ. AMPK: guardian of metabolism and mitochondrial homeostasis. Nat Rev Mol Cell Biol. 2018;19(2):121.
- Settembre C, Di Malta C, Polito VA, et al. TFEB links autophagy to lysosomal biogenesis. Science. 2011;332(6036):1429–1433.
- Kwon H-J, Won Y-S, Suh H-W, et al. Vitamin D3 upregulated protein 1 suppresses TNF-α–induced NF-κB activation in hepatocarcinogenesis. J Immunol. 2010;185(7):3980–3989.
- Kwon H-J, Won Y-S, Yoon Y-D, et al. Vitamin D3 up-regulated protein 1 deficiency accelerates liver regeneration after partial hepatectomy in mice. J Hepatol. 2011;54(6):1168–1176.
- Kwon H-J, Hong S-K, Yoon W-K, et al. Vitamin D3 up-regulated protein 1 controls the priming phase of liver regeneration. J Vet Sci. 2013;14(3):257–262.
- Huang C, Zhang Y, Kelly DJ, et al. Thioredoxin interacting protein (TXNIP) regulates tubular autophagy and mitophagy in diabetic nephropathy through the mTOR signaling pathway. Sci Rep. 2016;6:29196.
- Qiao S, Dennis M, Song X, et al. A REDD1/TXNIP pro-oxidant complex regulates ATG4B activity to control stress-induced autophagy and sustain exercise capacity. Nat Commun. 2015;6:7014.
- Wu N, Zheng B, Shaywitz A, et al. AMPK-dependent degradation of TXNIP upon energy stress leads to enhanced glucose uptake via GLUT1. Mol Cell. 2013;49:1167–1175.
- Kim J, Kundu M, Viollet B, et al. AMPK and mTOR regulate autophagy through direct phosphorylation of Ulk1. Nat Cell Biol. 2011;13(2):132.
- Li Y, Ding W-X. A gene transcription program decides the differential regulation of autophagy by acute vs chronic ethanol?. Alcohol Clin Exp Res. 2016;40(1):47.
- Mao Y, Yu F, Wang J, et al. Autophagy: a new target for nonalcoholic fatty liver disease therapy. Hepat Med. 2016;8:27.
- Sengupta S, Peterson TR, Laplante M, et al. mTORC1 controls fasting-induced ketogenesis and its modulation by ageing. Nature. 2010;468(7327):1100.
- Settembre C, De Cegli R, Mansueto G, et al. TFEB controls cellular lipid metabolism through a starvation-induced autoregulatory loop. Nat Cell Biol. 2013;15(6):647.
- Ni HM, Bockus A, Boggess N, et al. Activation of autophagy protects against acetaminophen‐induced hepatotoxicity. Hepatology. 2012;55(1):222–232.
- Matsuda T, Yamaguchi Y, Matsumura F, et al. Immunosuppressants decrease neutrophil chemoattractant and attenuate ischemia/reperfusion injury of the liver in rats. J Trauma Acute Care Surg. 1998;44(3):475–484.
- Ezquerro S, Mendez-Gimenez L, Becerril S, et al. Acylated and desacyl ghrelin are associated with hepatic lipogenesis, beta-oxidation and autophagy: role in NAFLD amelioration after sleeve gastrectomy in obese rats. Sci Rep. 2016;6(1):1–12.
- Lodder J, Denaes T, Chobert MN, et al. Macrophage autophagy protects against liver fibrosis in mice. Autophagy. 2015;11(8):1280–1292.
- Komatsu M, Waguri S, Ueno T, et al. Impairment of starvation-induced and constitutive autophagy in Atg7-deficient mice. J Cell Biol. 2005;169(3):425–434.
- Lee KN, Kang H-S, Jeon J-H, et al. VDUP1 is required for the development of natural killer cells. Immunity. 2005;22(2):195–208.
- Sun R, Jaruga B, Kulkarni S, et al. IL-6 modulates hepatocyte proliferation via induction of HGF/p21cip1: regulation by SOCS3. Biochem Biophys Res Commun. 2005;338(4):1943–1949.