
ABSTRACT
Despite the promising therapeutic effects of combinatory antiretroviral therapy (cART), 20% to 30% of HIV/AIDS patients living with long term infection still exhibit related cognitive and motor disorders. Clinical studies in HIV-infected patients revealed evidence of basal ganglia dysfunction, tremors, fine motor movement deficits, gait, balance, and increased risk of falls. Among older HIV+ adults, the frequency of cases with SNCA/α-synuclein staining is higher than in older healthy persons and may predict an increased risk of developing a neurodegenerative disease. The accumulation of SNCA aggregates known as Lewy Bodies is widely described to be directly linked to motor dysfunction. These aggregates are naturally removed by Macroautophagy/autophagy, a cellular housekeeping mechanism, that can be disturbed by HIV-1. The molecular mechanisms involved in linking HIV-1 proteins and autophagy remain mostly unclear and necessitates further exploration. We showed that HIV-1 Vpr protein triggers the accumulation of SNCA in neurons after decreasing lysosomal acidification, deregulating lysosome positioning, and the expression levels of several proteins involved in lysosomal maturation. Viruses and retroviruses such as HIV-1 are known to manipulate autophagy in order to use it for their replication while blocking the degradative final step, which could destroy the virus itself. Our study highlights how the suppression of neuronal autophagy by HIV-1 Vpr is a mechanism leading to toxic protein aggregation and neurodegeneration.
Abbreviations: BLOC1: Biogenesis of Lysosome-related Organelles Complex 1; CART: combinatory antiretroviral therapy; CVB: coxsackievirus; DAPI: 4’,6-diamidino-2-phenylindole; DENV: dengue virus; GFP: green fluorescent protein; HCV: hepatitis C virus; HCMV: human cytomegalovirus; HIV: human immunodeficiency virus; Env: HIV-1 envelope glycoproteins; GAPDH: glyceraldehyde-3-phosphate dehydrogenase; VSV: Indiana vesiculovirus; LTR: Long Terminal Repeat; LAMP1: lysosomal associated membrane protein 1; MAP1LC3B/LC3B: microtubule associated protein 1 light chain 3 beta; MLBs: multilamellar bodies; RIPA: Radioimmunoprecipitation assay buffer; SDS-PAGE: sodium dodecyl sulfate-polyacrylamide gel electrophoresis; Tat: transactivator of TAR; TEM: transmission electron microscope; Vpr: Viral protein R
Introduction
Patients infected with HIV-1 have a longer life expectancy due to the efficiency of antiretroviral therapy (ART). Motor symptoms are less common with the advent of ART, but in the now-aging HIV population, an increased occurrence of extrapyramidal signs or Parkinsonian-like symptoms are observed [Citation1]. A significant number of HIV-infected individuals are showing an impairment in motor skills, characterized by a disturbance of gait and balance, postural stability, and fine motor movement such as poor hand agility [Citation2]. In the brain, HIV-1 targets regions rich in dopamine (DA), such as the basal ganglia, where the loss of substantia nigra neurons was observed in over 25% of AIDS cases [Citation3,Citation4]. Similar symptoms were also described in HIV-transgenic rats, where the rats presented deficits in psychomotor functioning and cognition [Citation5]. These rats also suffer from alterations in sensorimotor gating and behavior resulting from HIV-1 infection, including changes in dopamine (DA) function [Citation6,Citation7]. Further, an increase in SNCA/α-synuclein protein accumulation and neuronal loss in the substantia nigra region were described in a postmortem study of HIV-infected brains [Citation8].
The accumulation of SNCA aggregates is linked to motor dysfunction. All animal models expressing SNCA show a progressive aggregation of the protein in dopaminergic neurons of the substantia nigra pars compacta and their striatal terminals [Citation9,Citation10]. This is followed by a progressive reduction of striatal dopamine release, reduced striatal innervation, and substantial nigral dopaminergic nerve cell death. The effects of SNCA aggregates on animal models are alterations in gait impairment, tremors, and gross motor deficit. The early signs of impairment include wobbling and changes in posturing [Citation10].
SNCA and other toxic proteins are normally removed from the cells through the cellular housekeeping mechanism known as autophagy [Citation11]. They are sent along with damaged cell components and metabolic waste to the lysosome for recycling. The buildup of misfolded protein in neurons is a feature shared by most neurodegenerative diseases. For efficient cellular clearance, the concerted action of enzyme targeting, vesicular trafficking, and cargo delivery processes is crucial. A disturbance in any of these pathways is likely to conclude in protein aggregation.
HIV-1 finely regulates the autophagy pathway, encoding in its genome both pro-and anti-autophagy proteins, which can display a dual role in a cell type-dependent manner. HIV-1 induces autophagosome formation [Citation12] and uses the autophagosomal membrane as a scaffold for virion assembly [Citation13]. HIV-1 inhibits the late stage of autophagy from evading the digestion of virions within autolysosomes. However, the molecular mechanisms involved remain largely unclear and necessitates further exploration in the future.
The virion-associated HIV-1 viral protein R (Vpr) is a multi-potent viral protein involved in nuclear import of the viral pre-integration complex, inducing G2-phase arrest, and the regulation of HIV-LTR activation [Citation14–16]. Vpr circulates in the blood of ART-treated HIV-infected patients with undetectable viral load [Citation17]. We showed that Vpr causes the accumulation of SNCA and alters mitochondria axonal transport in neurons. Looking for the mechanisms involved, here, we showed that Vpr impairs the autophagy/lysosomal degradation pathway and affects several key processes necessary for the clearance of protein aggregation, damaged organelles, and metabolic waste.
Results
SNCA/α-synuclein accumulates in HIV-1 infected human and animal brain tissues, as well as in Vpr-treated cells
SNCA/α-synuclein oligomerization and aggregation are considered to have a role in the pathogenesis of neurodegenerative diseases. Under pathological conditions, SNCA aggregates to form neuronal inclusions in several neurodegenerative diseases. Numerous studies suggest that the oligomeric aggregates are the relevant toxic species for neurons.
In this work we are using SH-SY5Y cells, a human neuroblastoma line, which possesses many characteristics of dopaminergic neurons. Fully differentiated human SH-SY5Y neuroblastoma cells can develop Lewy-body-like pathology upon exposure to exogenous SNCA species. In contrast to most rodent-based Parkinson disease models, which display multiple diffuse SNCA aggregates throughout the cytoplasm, a single large nuclear inclusion that is immunopositive for SNCA can be rapidly obtained in SH-SY5Y [Citation18].
First, using immunohistochemistry, we examined the expression levels of SNCA protein in human brain tissue from HIV-negative and HIV-positive patients and in tissues of SIV-1 infected rhesus macaques. As displayed, in the presence of HIV-1, a stronger positive SNCA neuritic signal is observed as well as perinuclear inclusion ()) while a perikaryal expression of SNCA was observed in SIV compared to the SIV-negative macaques ()).
Figure 1. In the presence of HIV-1 Vpr, the neuronal cells accumulate SNCA/α-synuclein aggregates. (A) Using human brain tissues, we performed a fluorescent staining using anti-SNCA antibody. (B) The data are the means ± s.d. area distribution was calculated with imagej software. n = 3 independent experiments. (C) Using macaque brains tissues, we performed immunohistochemistry staining using anti-SNCA antibody. (D) The data are the means ± s.d. area distribution was calculated with ImageJ software. n = 2. (E) Protein extracts were prepared from SH-SY5Y cells treated with rVpr treated with 100 ng/ml Vpr every 4 days for 3 weeks. SDS-PAGE western blot was performed using anti-SNCA or -GAPDH antibodies. (F) Data are means ± SD of triplicate samples. n = 3 independent experiments. The relative protein level was determined from the band intensity using imageJ software and normalized relative to the GAPDH. (G) SH-SY5Y cells treated with 100 ng/ml Vpr every 4 days for 3 weeks, we performed an immunofluorescent staining using anti-SNCA antibody. endogenous level of SNCA increased in all Vpr samples compared to the mock. (H) GFP-SNCA aggregates in lysosomes (mCherry-LAMP1) of SH-SY5Y cells in presence of Vpr. the nuclei are stained in blue with DAPI
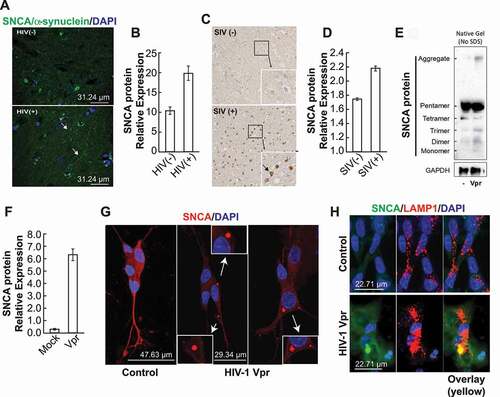
Next, using SH-SY5Y neuronal cells differentiated with retinoic acid then treated with rVpr for three weeks (rVpr was added every four days), we performed a western blot analysis using 20 μg of extracts and anti-SNCA or -GAPDH antibodies. As shown in ), Vpr promotes endogenous SNCA oligomerization and formation of large insoluble aggregates in SH-SY5Y cells as compared to their Mock-treated counterpart cells. Panels B, D, and F are the quantification of the results obtained in panels A, C, and E, respectively.
SH-SY5Y cells were also treated the same way for three weeks and then subjected to immunofluorescence. Lewy body-like perinuclear aggregates were observed in SH-SY5Y cells treated with Vpr ()), which confirms our hypothesis regarding Vpr’s ability to promote SNCA aggregation. Interestingly, SNCA (green) aggregates in the lysosomes (red) of SH-SY5Y cells in the presence of Vpr compared to the mock ()) as obtained by immunostaining assay.
Enlargement of autophagosomes and lysosomes in the presence of HIV-1 Vpr
Recently, a study in monocytic cell line-derived macrophages transiently expressing Vpr describes a pro-autophagic activity role for the viral protein [Citation19]. Previous studies showed increased expression of LC3B-II in HIV-1-infected primary CD4+ T cells compared to uninfected cells [Citation20]. Upon the induction of autophagy, the MAP1LC3B/LC3B (microtubule associated protein 1 light chain 3)-I form is lipidated to generate LC3B-II. The increase of the ratio of LC3B-II to LC3B-I by western blot indicates the induction of autophagy and autophagosome formation. Brains with encephalitis exhibit consistently LC3 puncta in neurons and the LC3-II:LC3-I ratio is significantly increased in the HIV-positive encephalitis brain. For the assessment of LC3-II autophagic flux, SH-SY5Y cells were treated with Vpr and/or chloroquine and maintained in culture for 6 h. Increased levels of LC3-II in the presence of lysosomal inhibitors such as chloroquine may be an indication of autophagic carrier flux, at the early stage of cargo reaching the lysosome. If a flux is occurring, the amount of LC3-II will be higher in the presence of the inhibitor. We observed by western blots the conversion of LC3B-I to LC3B-II ()) in SH-SY5Y cells treated with Vpr. Interestingly, Vpr increases the LC3B-I to LC3B-II conversion triggered by the chloroquine. Changes in the LC3-II protein conversion were measured based on GAPDH expression using imageJ software and presented as a histogram.
Figure 2. Enlarged autophagic vacuoles and lysosomes in presence of HIV-1 Vpr. (A) SH-SY5Y cells, after differentiation, were treated with Vpr 100 ng/ml and/or 10 μM chloroquine for 6 h and then harvested for the western blot analysis. the data are the means ± s.d. LC3 protein relative expression was calculated with imageJ software. n = 3 independent experiments and presented as histogram. (B) HIV-1 Vpr increases the LC3-positive vacuoles formation, marker of autophagosomes. SH-SY5Y cells were transfected with GFP-LC3 and then after differentiation, the cells were treated with Vpr 100 ng/ml for 6 h and/or 10 μM chloroquine. the data are the means ± s.d. area distribution was calculated with imageJ software. n = 3 independent experiments and presented as histogram using arbitrary units. (C) HIV-1 Vpr triggers lysosomal swelling and changes the lysosome positioning in SH-SY5Y cells stably expressing LAMP1-mCherry, after differentiation, and treated with Vpr 100 ng/ml. the areas of interest have been circled (dashed) for more clarity. (D) Lysosomes in presence of Vpr became extremely enlarged and round (see fig. S2). (E) Primary mouse neurons are stained with acridine orange that stains acidic compartments such as lysosomes in red. (F) SH-SY5Y cells treated 3 weeks with HIV-1 Vpr. layers of cells were analyzed by transmission electron microscopy (TEM) to visualize mitochondria and autophagy/lysosome pathway organelles. mitochondria are marked M, autophagosomes are marked AP, lysosomes are marked L and multilamellar bodies are marked MLB
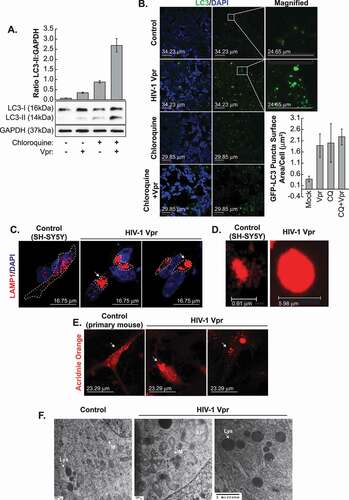
To further visualize how HIV-1 Vpr by itself can trigger the formation of autophagosomes, we monitored the formation of GFP-LC3 puncta in the presence of Vpr. In our SH-SY5Y cell model transfected with LC3-GFP, the treatment with 100 ng/ml of Vpr produces LC3 puncta, indicating autophagosome formation ()), the same way chloroquine does. Quantification of the mean area of LC3-positive puncta is presented as a histogram using arbitrary units. Additional controls to these experiments are available in supplemental data (Fig. S1), including an LC3ΔG. There is no discrepancy between CQ and/or Vpr+CQ quantity observed in panels A and B. This difference is due to the fact that in panel A, the western was performed using all cellular LC3-II protein, while in B, only measured lysosomal LC3-II.
To complement these data evaluating autophagosome levels, we next examined the impact of Vpr upon lysosomes, which fuse with autophagosomes to facilitate cargo degradation. We identified enlarged autolysosomes clustering around the nucleus in human SH-SY5Y cells ( and ) as well as in primary mouse neurons (panel E). A 3D reconstruction video of the lysosomes is available in Fig. S2. Similarly, the mouse primary neurons in ) were stained with acridine orange and treated with recombinant Vpr protein. After treatment, the lysosomes in the primary mouse neurons appear enlarged and clustered in the perinuclear area. These findings were confirmed by electron microscopy, which allows visualizing autophagosomes, appearing with double-membranes, and lysosomes. The examination by TEM of pyramidal neurons from the frontal cortex shows that in HIV encephalitis cases, the lysosomes were enlarged and contain abundant electron-dense material. The number of autophagosomes in neural bodies was increased [Citation21]. Compared to the control cells, the Vpr-treated cells present enlarged autophagosomes recognized by their double-membrane as well as enlarged lysosomes ()). The mitochondria are swollen and irregular and display vacuolization and a disruption of their cristae ()).
The lysosome dysfunction is directly linked to the presence of HIV-1 Vpr
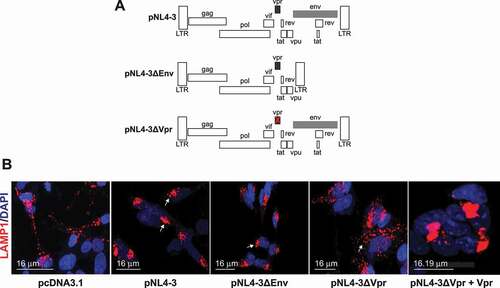
Next, we compared the effect of Vpr (ectopically added or released from infected cells to other released cells such as Tat, Nef, and gp120). Although cells of monocytic lineage are the primary source of HIV-1 in the brain, other cell types in the central nervous system, such as astrocytes, can harbor a persistent HIV-1 infection. Previous work showed that primary human astrocytes support HIV-1 replication with transfection of the infectious clone NL4-3 [Citation22]. In this study, we used a glial and neuronal cells co-culture model wherein U87-MG gliomas cells and SH-SY5Y neuroblastoma cells were seeded in a ratio of 1:20 and cultured in DMEM/F12.
The HIV-1 full genome pNL4-3 ()) and the genome lacking the Env gene pNL4-3ΔEnv showed perinuclear accumulation of enlarged, round lysosomes ()). However, when Vpr is deleted, pNL4-3ΔVpr, the dispersion of the lysosomes appears similar to the control ()). This can be reversed by the addition of Vpr (), pNL4-3ΔVpr+Vpr panel). Thus, we concluded that the Vpr protein is the HIV-1 protein responsible for the clustered enlarged lysosomes and its effect is specific regardless of how it was added (ectopically or released from pNL4-3). Note that pNL4-3 was cloned into pUC18 (PvuII site), however, in our transfection, we used pcDNA3.1 as the empty vector.
Figure 3. The lysosome dysfunction is directly linked to the presence of HIV-1 Vpr. (A) Schematic representation of the plasmids used, pNL4-3, pNL4-3ΔEnv, and pNL4-3ΔVpr. (B) HIV-1 Vpr changes the lysosome positioning and enlarges the lysosomes. SH-SY5Y cells stably expressing mCherry-LAMP1 were co-cultured with U87-MG cells transfected with 0.5 μg of pcDNA3.1, 1 μg of pNL4-3 pro, pNL4-3ΔEnv, pNL4-3ΔVpr and 1 μg of pNL4-3ΔVpr + 200 ng of CMV-Vpr plasmids and visualized after 48 h. note that pNL4-3 was cloned into pUC18 (PvuII site), however in our transfection, we used pcDNA3.1 as the empty vector
HIV-1 Vpr does not inhibit the autophagosome-lysosome fusion
Several RNA viruses, including coxsackieviruses (CVB3 and CVB4), VSV, poliovirus, dengue viruses (DENV2 and DENV3), hepatitis C virus (HCV), rotavirus, and influenza virus A, have been observed to induce autophagy, but inhibit autophagosome-lysosome fusion [Citation23]. Additionally, the lysosomal positioning takes part in the final steps of autophagy by governing autophagosome-lysosome fusion [Citation24]. We decided to monitor if HIV-1 Vpr affects the autophagosome-lysosome fusion. In non-autophagic conditions, LC3 and LAMP1 do not colocalize. However, when autophagy is activated, LC3 colocalizes with the lysosomal protein LAMP1. To observe directly the colocalization of autophagosomes and lysosomes, we co-transfected LAMP1-mCherry and LC3-GFP in SH-SY5Y neuronal cells. While no evidence of autophagy activation was identified in mock-treated control cells, HIV-1 Vpr treated cells show a fusion of autophagosomes and lysosomes ( examples are shown). Quantification of yellow puncta is now presented as a bar graph in panel B. This data was further validated using a 3D reconstruction of the autolysosome (see Fig. S3).
Figure 4. HIV-1 Vpr doesn’t inhibit the autophagosome-lysosome fusion. (A) SH-SY5Y cells are transfected with GFP-LC3B and LAMP1-mCherry, formaldehyde-fixed and dyed with DAPI after treatment with 100 ng/ml HIV-1 recombinant Vpr for 24 h (3 examples are displayed). (B) Number of colocalized puncta (yellow puncta) in 20 cells were counted. values are presented as the mean of three biological repeated (presented in A) ± s.d and considered statistically significant as obtained using anova test (***P < 0.001). (C) U87 MG cells are transfected with pcDNA3.1, pNL4-3, pNL4-3ΔEnv or pNL4-3ΔVpr and co-cultured with SH-SY5Y cells transfected with LC3B-GFP and LAMP1-mCherry. note that pNL4-3 was cloned into pUC18 (PvuII site), however in our transfection, we used pcDNA3.1 as the empty vector
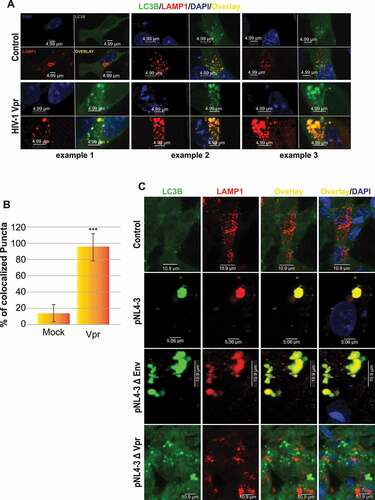
As Vpr lysosome dysfunction was linked to HIV-1 Vpr protein, we next sought to determine if this protein may also impact autophagosome-lysosome fusion. In SH-SY5Y cells co-cultured with U87-MG cells expressing the HIV-1 genome (pNL4-3) (second row) or the genome lacking the Env gene pNL4-3ΔEnv (Vpr is present) (third row), we observed efficient autophagosome-lysosome fusion despite the presence of enlarged vacuoles ()). The same is observed upon co-culture with U87 cells expressing the HIV-1 genome lacking the Vpr gene pNL4-3ΔVpr (fourth row), where the autophagic vacuole sizes were enlarged, compared to the Mock cells transfected only with pcDNA3.1 (first row).
SH-SY5Y cells show a lysosomal degradation impairment in the presence of Vpr
The degradation of cytoplasmic material through the autophagy pathway necessitates an acidic lysosomal environment. Lysosomal hydrolytic enzymes can break down various types of biomolecules, including lipids, carbohydrates, nucleic acids, and peptides. They are acidic proteases and reach their active form at a low pH. This low pH will also trigger the conformational changes in proteins, making them more susceptible to proteolytic degradation.
Tandem fluorescent-tagged LC3 (RFP-GFP-LC3) is a valuable assay for monitoring autophagic flux based on different pH stability of GFP and RFP fluorescent proteins. We used a construction with fluorescent proteins more pH-sensitive than RFP and GFP, pHLuorin-mKate2-LC3. pHLuorin is emitting pH-sensitive green fluorescence and mKate2 pH-insensitive red fluorescence to visualize by confocal microscope the late autophagic flux, the maturation step of mammalian autolysosomes. The LC3 puncta change their color depending on the pH, they appear yellow when both green and red colors are expressed, but, when autophagosomes fuse with lysosomes, the GFP color is quenched, and autolysosomes become red ()). After transfection with the tandem plasmid, the SH-SY5Y cells are differentiated into neurons and treated with Vpr or chloroquine. We observed the formation of enlarged yellow puncta after only 6 h of treatment the same way with Vpr and chloroquine ()). The yellow puncta are an indication that the pH of the lysosome may not be low enough to quench the yellow signal from the autophagosome. Note that CQ was used as a control and not for comparison with Vpr, especially since CQ inhibits autophagic flux by decreasing autophagosome-lysosome fusion [Citation25] while Vpr did not affect the fusion.
Figure 5. SH-SY5Y cells shows lysosomal impairment in presence of Vpr. (A) Model of pHluorin-mKate2-LC3 plasmid allowing a pH-sensitive monitoring of the maturation step of autophagosomes. (B) SH-SY5Y cells are transfected with pHLuorin-mKate2-LC3 and treated with Vpr 100 ng/ml for 24 h and/or 10 μM chloroquine. double-positive fluorescent puncta reflect autophagosomes (nonacidic compartments). the fluorescent puncta that are green-negative and red-positive reflect autolysosomes as acidic compartments, since pHluorin tends to decrease its fluorescence at an acidic pH. however, if the pH of the autolysosomes is increased, it is possible that autolysosomes are labeled with yellow signals (GFP+RFP+ puncta). (C) The numbers of red-positive and green-positive puncta and red-positive and green-negative puncta were quantified in more than 50 cells per experiment. representative average results from three independent experiments are shown as the means SD. (D) SH-SY5Y cells have been loaded with dextran beads conjugated to pH-insensitive rhodamine (red) and pH-sensitive fluorescein (green). after a wash, the ratio FITC/TRITC measured the variations in lysosomal pH in cells treated 24 h with Vpr 100 ng/ml. (E) SH-SY5Y cells treated 3 weeks with HIV-1 Vpr. layers of cells were analyzed by transmission electron microscopy (EM) to visualize mitochondria and autophagy/lysosome pathway organelles. mitochondria are marked M, autophagosomes are marked AP, lysosomes are marked L and multilamellar bodies are marked MLB. panel 1 is the control, panel 2 shows undigested aggregates in lysosomes, the white inclusions are usually lipids, panel 3 shows multilamellar bodies. lysosomal multilamellar bodies (MLBs) are the classical hallmarks of many lysosomal storage disorders
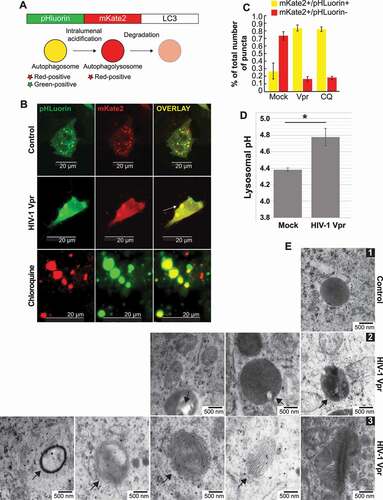
In parallel, we measured the lysosomal pH by dual-emission ratiometric pH measurement ()). SH-SY5Y were incubated with dual-labeled dextran (FITC/TRITC). Cellular fluorescein and TMR intensity ratio were quantified by flow cytometry. As anticipated, Vpr is increasing the lysosomal pH. The lack of acidification of these lysosomes disrupts the degradative capability of the lysosomes. pH differences, as small as 0.2 pH units, substantially alter the rate and pattern of protein degradation by acidic proteases in microglia [Citation26]. A modest alkalinization is able to induce pathological changes.
We further used transmission electron microscopy to examine the lysosome for signs of consequences of lysosomal alkalization ()). Undigested electron-dense material is noticeable in some lysosomes, as well as clear vacuoles that could be identified as undigested fat (Figure 5E2). We observe the presence of multilamellar bodies (MLBs) in Figure 5E3, which are the classical hallmarks of many lysosomal storage disorders (Figure 5E3). These observations are consistent with the disruption of neurons in neurodegenerative diseases.
The SNAPIN/BORCS3 protein is able to rescue the lysosomal positioning but not all the acidification impairment caused by HIV-1 Vpr
BORC is a complex that regulates lysosome positioning and lysosome movement, comprising eight subunits of which are shared with the BLOC-1 (Biogenesis of Lysosomal Organelles Complex 1), complex [Citation27]. Our proteomic assay showed that some proteins of these complexes are deregulated; the proteins upregulated are in red and downregulated in blue ()). Indeed, western blots confirmed the upregulation of BORCS5/Myrlysin and downregulation of SNAPIN/BORCS3 and BLOC1S1/BLOS1 )). Bands intensities were measured using ImageJ and presented as histograms.
Figure 6. The SNAPIN protein is involved in HIV-1 Vpr lysosome dysfunction. (A) Model representing the BORC/BLOC-1 proteins appearing repressed in the proteomic assay (in blue) and activated (in red). (B) SH-SY5Y cells, after differentiation, were treated with Vpr 100 ng/ml for 24 h and then the harvested for the western blot. the proteomic results from a previous experiment are indicated under the western blot, if they are available. data are means ± SD of triplicate samples. n = 3 independent experiments. the relative protein level was determined from the band intensity using imageJ software and normalized relative to the GAPDH. (C) Overexpression of SNAPIN rescues the lysosomal clustering induced by Vpr. SH-SY5Y stably expressing LAMP1-mCherry are transfected with an empty vector or a vector containing SNAPIN, then the cells are treated with Vpr (100 ng/ml). (D) SH-SY5Y cells are transfected with a pHluorin-mKate2-LC3 plasmid allowing a pH-sensitive monitoring of the maturation step of autophagosomes. the green and red signals are quantified by flow cytometer (panel 1) and normalized by the red signal (panel 2). the transfection with the SNAPIN plasmid can partially rescue the lysosomal acidic pH
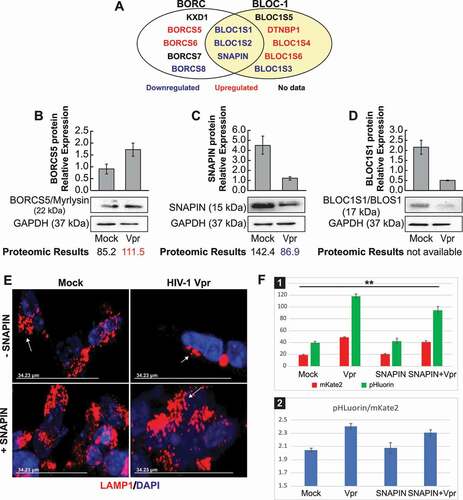
We next aimed to delineate how overexpression by transfection (Gift from J. Pu) of all the BORC and BLOC-1 plasmids impacts the phenotype of perinuclear positioning and lysosome enlargement triggered by the HIV-1 Vpr. Of all the plasmids tested, only the SNAPIN showed a reversal of the lysosomal phenotype ()). The reversal was not observed with the other members of the BLOC1/BORC complex as presented in Fig. S4.
We then decided to evaluate the effect of the SNAPIN, in presence of Vpr, on the lysosomal pH. We used a tandem construction with the previously described pHLuorin-mKate2-LC3 emitting pH-sensitive green fluorescence and pH-insensitive red fluorescence plasmid ()). Fluorescence microscopy allows single-cell analysis of autophagic flux when flow cytometry permits high-throughput analysis, therefore we used flux cytometry to quantify green and red signal in this experiment. The red signal is increasing in the presence of Vpr, which is explained by the presence of enlarged autolysosomes. The green signal is increased as well, which is the result of both autophagosome enlargement and the decrease of the quenching capabilities of the pH-sensitive pHluorin in autolysosomes when the acidification is decreased. The ratio is indicative that the quenching capabilities are decreased, at the same time that the pH is increased with HIV-1 Vpr. The overexpression of the SNAPIN rescued only mildly the loss of lysosomal acidification ()).
Discussion
Clinical studies suggest that aging HIV-1 patients are encountering motor dysfunction symptoms, such as bradykinetic, rigidity, postural, and gait abnormalities, as well as tremors [Citation28]. These symptoms corroborate other diseases with the accumulation of aggregated SNCA/α-synuclein in neurons of the basal ganglia. Such buildup can be linked to lysosomal dysfunction, causing disturbance of the autophagy-lysosome pathway. However, with HIV-1 subjects, the mechanisms involved remain unclear.
HIV-1 Vpr is blocking the late stage of autophagic degradation
In this study, we showed that HIV-1 Vpr protein impairs the autophagy/lysosomal degradation pathway. Treatment of neurons with Vpr led to swollen LC3-positive and LAMP1-positive structures, identified respectively. We cannot exclude the possibility that some of the LAMP1 positive organelles are late endosomes, as they are a later stage in the maturation to lysosomes, and therefore share many properties. In support of this hypothesis, we showed accumulation and conversion of LC3 in ), which confirms that the inhibitory effect of Vpr is not on early autophagic flux but the late stage of autophagy. Similar to HIV-1 [Citation29], Vpr increases autophagic flux. We also observed a difference in LC3-II levels in the presence and absence of chloroquine. This difference represents the amount of LC3 delivered to lysosomes for degradation (i.e., autophagic flux). This difference is greater in the presence of Vpr, indicating an increase in autophagic flux [Citation30]. The use of several techniques explains this variability. We detected endogenous LC3 by western blot ()) while visualized by microscope ()) or measured by flow cytometer ()), respectively. The quantity of LC3-II usually correlates with the amount of autophagic membrane labeled with LC3-II. However, not all LC3-II proteins localize to the autophagic membrane. Some population of LC3-II is ectopically produced in an autophagy-independent way [Citation31–36]. Western blot analysis quantifies all the cell LC3 independently of their intracellular localization but not imaging or flow cytometer.
Further, enlarged lysosomes suffered from membrane tensions and therefore are susceptible to rupture [Citation37]. Photodynamic treatments such as laser illumination have been described to cause lysosome rupture [Citation38]. Additionally, oxidative stress from hydrogen peroxide destabilizes lysosomal membranes. After degradation of iron-containing macromolecules, lysosomes become rich in redox-active iron. That causes a Fenton-type reaction to occur, resulting in lysosomal rupture [Citation39]. Lysosomes became enlarged and mechanically ruptured by laser and pressure in the presence of Vpr, and therefore will not be incorporated into the count.
The autophagy pathway intersects with the HIV-1 life cycle, acting as a double-edged sword in HIV-1 infection and regulating the autophagy pathway finely. Previous work showed that bafilomycin A1, which abrogates endosome-lysosome acidification, promotes HIV-1 replication [Citation40]. In general, early steps in autophagy contribute to HIV-1 replication. Indeed, HIV-1 infection induces autophagosome formation [Citation12], using the autophagosomal membrane as a scaffold for virion assembly [Citation13]. However, HIV-1 will inhibit the late stage of autophagy from evading the digestion of virions within autolysosomes and blocks lysosomal degradation in microglia [Citation41]. HIV-1 is encoding in its genome both pro-and anti-autophagy proteins that can display a dual role in a cell type-dependent manner. A previous study described that HIV-1 Nef protein inhibits the maturity of autophagy in macrophages by binding to BECN1 to prevent damage to the virus [Citation42]. HIV-1 Gag protein colocalizes with autophagosomes with abundant ATG8-family proteins [Citation43]. Another study showed that HIV-1 Tat protein alters neuronal autophagy by modulating autophagosome fusion to lysosome through its interaction with LAMP2A protein [Citation44].
We further described that the presence of HIV-1 Vpr in the neuronal cells also caused impaired lysosome acidification, which should reduce their degradative capabilities. Indeed, transmission electron microscope (TEM) analysis revealed the accumulation of undigested electron-dense material. These results have been validated by immunofluorescence, showing the accumulation of aggregated SNCA inside the lysosomes. We further demonstrated clusters of motionless lysosomes in a perinuclear area in Vpr-treated cells. As they move toward the proximal axon, the lysosomes become more acidic and acquire bidirectional movement, as a result of fusion with lysosomes moving anterogradely [Citation45]. The activity of lysosomes is dependent on their capacity to move throughout the cytoplasm, to locate and fuse with specific compartments to exchange substrates for further processing. The perinuclear positioning, with the fact that enlarged lysosomes are incapable of moving, might be one of the defects in the lysosomal acidification.
Depletion of the SNAPIN protein by HIV-1 Vpr leads to lysosomal impairment
We also demonstrated using proteomic assays followed by a western blot analysis that central proteins involved in the lysosome positioning are deregulated in Vpr-treated neurons. Among these is SNAPIN, a major player in the regulation of lysosomal acidification, lysosomal positioning, and trafficking in neurons.
SNAPIN is essential for efficient autophagic flux, as its silencing results in the accumulation of enlarged autolysosomes unable to properly degrade their cargos. Furthermore, these swollen lysosomes exhibit impaired acidification. SNAPIN is a mostly cytoplasmic protein originally identified in neurons and described to bind to SNAP25 (synaptosome associated protein 25), a protein of the SNARE complex, and to facilitate synaptic vesicle fusion and neurotransmitter release [Citation46–48]. Recent data showed that SNAPIN is critical for neuronal homeostasis through its role in the coordination of late endosome-to-lysosome trafficking, lysosome maturation, and autophagy [Citation49–51]. In the absence of SNAPIN, the cells develop large autophagic vacuoles, and the lysosomes are swollen, with reduced acidification and CTSD (cathepsin D) activation. However, there is no defect in lysosome-to-endosome fusion or of autophagosome-to-lysosome fusion. In macrophages, SNAPIN is critical for lysosome acidification and is essential for autophagosome maturation and digestion of the engulfed materials [Citation52]. SNAPIN is also described as a component of the BLOC-1 complex which is a ubiquitously expressed protein complex required for the biogenesis of specialized organelles of the endosomal-lysosomal system [Citation53]. There are only a few reporting of the involvement of SNAPIN with viral proteins. SNAPIN binds to the UL70 protein of human cytomegalovirus (HCMV) and affects its cellular localization, modulating the productive lytic infection and the viral DNA synthesis [Citation54]. It is suggested in this research that this SNAPIN interaction with UL70 could be an antiviral defense of the host.
The SNAPIN protein has the ability to couple lysosomes to dynein, specifically in hippocampal neurons [Citation46], as well as coupling lysosomes to kinesin 1 [Citation27]. HIV-1 uses microtubules and their associated proteins to complete key steps during infection. Dynein and kinesin motors influence HIV-1 trafficking, viral core uncoating, and nuclear import of the viral ribonucleoprotein. Dynein is the main motor driving retrograde transport of both autophagic vacuoles and late endosomes from distal axons to the soma [Citation55]. SNAPIN is attaching dynein to late endosomes, similar to a motor adaptor. Therefore, SNAPIN could play dual roles in anterograde and retrograde transport as a component of BORC, BLOC-1, or maybe as part of some other complex. If the SNAPIN is decreased in neurons, the cells will exhibit aberrant accumulation of immature lysosomes, and present impaired retrograde transport of late endosomes. It was previously described that decreasing SNAPIN levels or interrupting the SNAPIN-dynein interactions reduce BACE1 transport to lysosomes for degradation, and as a result, is enhancing APP processing [Citation56].
We hoped to restore the lysosomal pH with the overexpression of SNAPIN through a plasmid transfection, but only a small part of the pH was fixed. There are a few explanations for this observation. First, we did not identify the mechanism by which the SNAPIN is degraded by Vpr, besides the fact that the mechanism is a post-translational degradation, and the mRNA levels are not decreased. Interestingly, Shi et al. [Citation52] described that the SNAPIN might create a lysosomal proton leak. The proton flux necessary to preserve the lysosomal pH would leak through the already damaged lysosomal membrane. Finally, we tried to overexpress every member of the BORC and BLOC-1, some in combination with the SNAPIN, as they act in complex, but the overexpression of these BORC and BLOC-1 protein did not succeed at restoring a normal pH. Other proteins involved in the lysosomal pH might be affected by HIV-1, like ATPases, and still, have to be identified.
In macrophages, the silencing of SNAPIN demonstrates the typical signs of late-stage blockage of the autophagy that is the presence of multilamellar and multivesicular structures [Citation57]. Multilamellar bodies (MLBs) are the classical hallmarks of many lysosomal storage disorders [Citation58], including gangliosidosis [Citation59], Tay-Sachs [Citation60] and Niemann-Pick disease [Citation61]. MLBs are created as lysosomal structures and commonly appear as multiple intracellular concentric membrane structures composed of primarily undegraded cholesterol and phospholipids. Swelling, increased ROS production, alterations of mitochondrial membrane potential, mitochondrial vacuolation, and loss of cristae are observed upon SNCA overexpression [Citation62]. Here, we observed the same phenomenon in the presence of HIV-1 Vpr, as in previous work [Citation63]. Some of these events might be directly related to the Vpr-induced SNCA accumulation.
There is significant literature documenting that viral infections, especially chronic infections, present molecular hallmarks of neurodegeneration, such as deposits of protein aggregates, oxidative stress, and deficient autophagy. A growing body of experimental and epidemiological data points at viral infection as a possible risk factor to motor dysfunction. Aging is a recognized risk factor that may act in synergy with these mechanisms. Furthermore, it is largely accepted that chronic neuro-inflammation paves the way to neuro disorders. Inflammation in the brain is a clear hallmark of HIV-1 infection. Importantly, neuroinflammation and autophagy are intertwined processes, which can influence each other depending on numerous factors. In the brain, autophagy can influence inflammation and activation of the microglia [Citation64–66]. Pro-inflammatory molecules present in the brain during HIV encephalitis and neuroinflammation in general, such as TNFα and glutamate, can disrupt autophagy [Citation67]. Once started, the disruption of the autophagy will keep amplifying, when extra-cellular SNCA amplifies the release of inflammatory mediators, eventually leading to inflammation [Citation68].
Our results presented here, and future studies will help with the design of new drugs targeting the re-acidification of lysosomes. The restoration/enhancement of the lysosomal function represents a novel, precise, and promising therapeutic strategy for HIV patients suffering from gait problems.
Study limitations
During the review process, an issue regarding certain parts of our study remained unresolved. This includes autophagic flux differences that as discussed above are due to technical issues. Further, our studies remain incomplete if the mechanisms used by Vpr leading to SNAPIN deregulation are unexplored. One should determine whether Vpr is causing SNAPIN loss of function at transcriptional (promoter and miRNA studies) or translational (ubiquitination, contribution of additional players) levels. The SNAPIN function should also be confirmed in an animal model using nanoparticles to restore lysosomal pH and SNAPIN function. The absence of mechanistic pathways and an animal model presents an additional limitation in our study.
Materials and methods
Plasmids
LAMP1-mcherry (pLAMP1-mCherry was a gift from Amy Palmer (Addgene, 45,147) [Citation69]. LC3-gfp:pEGFP-LC3 (human) was a gift from Toren Finkel (Addgene, 24,920) [Citation70]. SNCA-GFP was a gift from Virginia M.-Y Lee (UPenn, Philadelphia). The SNAPIN and BORC/BLOC-1 plasmids were a gift from Jing Pu, PhD (NIH). phluorin-mkate3-LC3 FUGW-PK-hLC3 was a gift from Isei Tanida (Addgene, 61,460) [Citation71]. pcDNA Vpr expression plasmid containing the CMV promoter expressing Vpr was previously described [Citation72]. pNL4-3 and pNL4-3ΔEnv were obtained through the NIH AIDS Reagent Program [Citation73].
Note. During autophagosome formation, LC3 is conjugated to the lipid PE in autophagosome membranes. The mutant fluorescent LC3 (LC3ΔG) (Addgene, 6146; deposited by Isei Tanida) cannot be lipidated. Unlipidated LC3ΔG stays in the cytoplasm whereas lipidated LC3 is recruited to both inner and outer membranes of phagophores and remains associated with the autophagosome inner membrane.
Antibodies
SNCA/α-synuclein antibody (sc-7011) was purchased from Santa Cruz Biotechnology; Donkey anti-Rabbit IgG (H + L) Highly Cross-Adsorbed Secondary Antibody, Alexa Fluor 488 (Invitrogen, A-21,206) and Alexa Fluor 647 (Invitrogen, A-31,573). GAPDH (5174) and LC3B (38,685) antibodies were purchased from Cell Signaling Technology. BORCS5/Myrlysin (17,169-1-AP LOH12CR1), SNAPIN (10,055-1-AP) and BLOC1S1/BLOS1 (19,687-1-AP) antibodies were purchased from Proteintech.
Recombinant proteins
HIV-1 Vpr, produced in SF9 insect cells (BioBasic Canada Inc.).
Chemicals
DAPI (Sigma-Aldrich, D9542), Lipofectamine 3000 (Invitrogen, L3000001), Opti-MEM™ I Reduced Serum Medium (Gibco, 31,985,062), dextran, fluorescein and tetramethylrhodamine, 70,000 MW, Anionic (Invitrogen, D1951).
Human and animal tissues
Postmortem human brain material was procured in accordance with institutional guidelines governed by approved protocols. Tissue samples were procured from the UCLA NNAB biobank.
Two-year-old Indian rhesus macaques (Macaca mulatta) were purchased from the Caribbean Research Primate Center and individually housed in steel holding cages in two dedicated rooms within the AAALAC-approved animal facility at the University of Kansas Medical Center. The monkeys were exposed, daily, to 12 h light-dark cycles and given laboratory chow and water ad libitum along with daily snacks. All cages were equipped with environmental enrichments. The animals were tested for tuberculosis, herpes B virus, and simian retrovirus and found negative in all these tests. All animal protocols were approved by the Institutional Animal Care and Use Committee (IACUC) at the University of Kansas Medical Center.
Dewaxing and antigen retrieval
Slides are loaded into glass slide holders and dewaxed as follows: Twice in 100% xylene (Sigma-Aldrich, 534,056) for 5 min with 10 s agitation every 30 s, 100% ethanol with 5 min agitation, once in 90% ethanol with 5 min agitation, once with 70% ethanol with 5 min agitation and twice in H2O with 5 min agitation. The rack is transferred into 200 ml of pre-warmed (94–96°C) target retrieval solution (Vector Laboratories, H-3300) in a glass container in the water bath which is set at 95°C. Antigen retrieval is 30 min in the water bath, 20 min on the bench and 5 min in running water.
Immunofluorescence labeling
Slides are removed from the water and a drop of 100–200 μl of phosphate-buffered saline (PBS; Gibco, 70,011,044) is carefully added to prevent the section from drying out. An ImmEdge pen (Vector Laboratories, H-4000) is used to delimitate the antibody area. The slide is blocked with 200 μl of immunofluorescence buffer (IFF; PBS plus 1% bovine serum albumin [Sigma-Aldrich, A3059] and 2% fetal calf serum [Avantor Seradigm, Premium Grade Fetal Bovine Serum, 97,068–085], filtered through a 0.2 μm filter) before placing the slides in a moist chamber at room temperature. All the incubations are at room temperature with gentle mixing on a rocking platform, except where the primary antibody is applied overnight in which case the incubation is at 4°C without rocking. Primary antibody(s) are diluted in IFF and incubated overnight at 4°C, 3 × 5 min washes in PBS, 2 μg/ml secondary antibody diluted in IFF for 60 min, 3 × 5 min washes in PBS containing 1.43 μM 4ʹ,6-diamidino-2-phenylindole (DAPI; Invitrogen, D21490). The volumes used throughout are 100–200 μl depending on the size of the section. Slides are rinsed in PBS, mounted in Vectashield (Vector Laboratories, H-1000) and sealed with clear nail polish. Stained slides are stored at 4°C.
IHC macaques brains
For immunohistochemistry (IHC), slides of formalin-fixed, paraffin-embedded MM samples were incubated with antibodies, and signals were detected via peroxidase activity. IHC was performed with DAB (3,3ʹ-diaminobenzidine; Acros Organics, AC112090010) and counterstained with hematoxylin (Vector Laboratories, H-3401). SNCA/α-synuclein was localized using the sc-7011 antibody (Santa Cruz Biotechnology).
Immunofluorescence SH-SY5Y with SNCA and DAPI. Following 3 weeks of treatment with 100 ng/ml of recombinant HIV-1 Vpr every 4 days under retinoic acid differentiation, the medium was removed and cells were fixed in 4% formaldehyde (Sigma-Aldrich, 252,549) in PBS. SH-SY5Y cells (ATCC® CRL-2266™) were stained for SNCA/α-synuclein. Cells were permeabilized with 0.2% Triton X-100 (Sigma, T8787)/PBS for 5 min. Primary rabbit SNCA/α-synuclein (1:500; Santa Cruz Biotechnology, sc-7011) antibodies were diluted in 3% (w:v) bovine serum albumin (Sigma-Aldrich, A3059) in PBS and incubated at 4°C overnight. Donkey anti-Rabbit IgG (H + L) Highly Cross-Adsorbed Secondary Antibody, Alexa Fluor 647 (Invitrogen, A-31,573) were used at 1:1000 dilutions. Cells were mounted on glass slides and counterstained with 4′,6-diamidino-2-phenylindole dihydrochloride (DAPI; Invitrogen, D21490). The cells were observed using the 60x oil objective lens of the confocal microscope (Leica DMI 4000B, Leica Microsystems).
Western blot
Cells or tissue were harvested, sonicated and lysed in RIPA buffer (50 mM Tris-HCl, pH 7.5, 150 mM NaCl, 0.5% DOC (Thermo Fisher Scientific, 89,904), 1% NP40 (Thermo Fisher Scientific, 85,124), 0.1% SDS, protease inhibitor cocktails [Sigma-Aldrich, P8340]), before being centrifuged at 20,000 g for 10 min at 4°C. Supernatant was collected and protein concentration was measured and normalized using Pierce™ BCA Protein Assay Kit (Thermo Fisher scientific, 23,225). BSA was used as the standard. Proteins were separated in 10% sodium dodecyl sulfate-polyacrylamide gel electrophoresis (SDS-PAGE) and transferred to a nitrocellulose membrane (Bio-Rad, 1,620,112). Blots were blocked in skim milk and then incubated overnight with primary antibodies as indicated. Blots were then incubated with secondary antibodies (Invitrogen, 65–6120) conjugated with horseradish peroxidase for 1 h at room temperature. ECL Plus (Amersham GE Healthcare, 32,132) was used for detecting the bands. The immunoreactive bands were visualized with an iBright imaging system (ThermoFisher).
Transmission electron microscopy (TEM)
SH-SY5Y cells were seeded in 100 mm dishes. After three weeks of treatment with HIV-1 Vpr 100 ng/ml every four days, cells monolayers were washed with PBS, and scraped gently with a plastic cell scraper. Then the harvested cells were pelleted by centrifugation at 800 rpm for 10 min and fixed in 2.5% glutaraldehyde and 2% paraformaldehyde in cacodylate buffer (Electron Microscopy Sciences, 15,949). After being rinsed with cacodylate buffer, the samples were post-fixed in 2% osmium tetroxide (Sigma-Aldrich, 75,633) for 1 h. The samples were then rinsed with water and dehydrated in a graded series of alcohol (50, 75, and 100% alcohol). The samples were embedded in epoxy resin. Thin sections (70 nm) were cut, stained with uranyl acetate (Electron Microscopy Sciences, 22,400), and lead citrate (Electron Microscopy Sciences, 17,800), and observed by light microscopy. Samples were viewed in a FEI Tecnai 12 TEM operated at 100 kV and the images were recorded using an AMT digital camera.
Mass spectrometry analysis
Proteins were identified and quantified by global label free proteomics using modified in stage tip (iST) method and Thermo Scientific Elite mass spectrometer [Citation74]. The proteins were extracted by addition of 50 μl of 6 M guanidinium hydrochloride buffer and 414 μl of dilution buffer (25 mM Tris, 10% acetonitrile). The proteins were digested with Lys-C (Sigma-Aldrich, 11,420,429,001) for 4 h at 37°C and secondly extensive digestion was achieved by overnight incubation with trypsin [Citation65]. The incubated solution was centrifugated at 5,000 x g for 5 min. The supernatant consisting of peptides were acidified and loaded onto an activated in-house-made cation stage tip. The peptides were eluted into six fractions and desalted as previously described [Citation75,Citation76]. The de-salted tryptic peptide samples loaded onto an Acclaim PepMap 100 pre-column (75 μm x 2 cm, Thermo Scientific) and separated by Easy-Spray PepMap RSLC C18 column with an emitter (2 μm, 100 Å, 50 μm x 15 cm, Thermo Scientific) by an Easy nLC system with Easy Spray Source (Thermo Scientific). To elute the peptides, a mobile-phase gradient is run using increasing concentration of acetonitrile. Peptides were loaded in buffer A (0.1% [v:v] formic acid) and eluted with a nonlinear 145-min gradient as follows: 0–25% buffer B (0.1% [v:v] formic acid, 85% [v:v] acetonitrile) for 80 min, 25–40% B for 20 min, 40–60% B for 20 min and 60–100% B for 10 min. The column was then washed with 100% buffer B for 5 min, 50% buffer B for 5 min and re-equilibrated with buffer A for 4 min. The flow rate was maintained at 300 nl/min. Electron spray ionization was delivered at a spray voltage of −2000 V. MS/MS fragmentation was performed on the five most abundant ions in each spectrum using collision-induced dissociation with dynamic exclusion (excluded for 10 s after one spectrum), with automatic switching between MS and MS/MS modes. The complete system was entirely controlled by Xcalibur software. Mass spectra processing was performed using Mascot Distiller with Proteome Discoverer v2.4. The generated de-isotoped peak list was submitted to an in-house Mascot server 2.2.07 for searching against the Swiss-Prot database (Release 2013_01, version 56.6, 538,849 sequences) and Sequest database. Both Mascot and Sequest search parameters were set as follows: species, homo sapiens; enzyme, trypsin with maximal 2 missed cleavage; fixed modification, cysteine carboxymethylation; 10 ppm mass tolerance for precursor peptide ions; 0.2 Da tolerance for MS/MS fragment ions. All peptide matches were filtered using a Mascot ion score cutoff of 20 and Sequest score of > 2.
Stable cell lines establishment
SH-SY5Y cells (ATCC® CRL-2266™) were transfected with Lipofectamine 3000 (Invitrogen, L3000001) with linearized LAMP1-mCherry plasmid (Addgene, 45,147; deposited by Amy Palmer). Stable cell lines are established by treatment of the cells with G418 350 μg/ml (Santa Cruz Biotechnology, sc-29,065).
Primary mouse neurons
Primary hippocampal neurons cultures were prepared as described previously [Citation77] with minor modifications. Briefly, embryos were removed from mice at embryonic day 18 (Taconic, C57BL/6). The hippocampus was separated and rinsed in Hanks’ balanced salt solution (Sigma-Aldrich, 55,037 C) before it was digested in 0.125% trypsin (Corning, 25–053-CI). The digested hippocampus was triturated and dissociated into a single-cell suspension in culture medium (DMEM; Corning, 10090CV) containing 10% FBS (Avantor Seradigm Premium Grade Fetal Bovine Serum, 97,068–085). The cell suspension was centrifuged at 200 x g for 10 min, and the pellet was gently resuspended in culture medium. The cell suspension was passed through mesh 400 to remove the non-dispersed tissue, and the cells were seeded at a density of 1.5 × 10⁵ cells/ml into 4-chamber slides coated with poly-d-lysine (Sigma-Aldrich, P6403). Cultures were incubated in an incubator at 37°C in an atmosphere of 5% CO2 in the air. The medium was changed into Neurobasal (Gibco, 21,103,049) supplemented with 2% B27 (Gibco, 17–504-044) and 0.5 mm glutamine (Gibco, 35,050,079) the next day. Half of the medium was changed every 3 days.
Acridine orange staining
Acridine orange (Invitrogen, A1301) crosses into lysosomes and becomes protonated by the acidic environment. Lysosomes will appear red with excitation filter 550 (540–560) and > 610 nm emission. Live cells are incubated with acridine orange to a final concentration of 1 μg/mL for 15 min at 37°C, and immediately visualized by confocal microscopy visualized using the 60x oil objective lens of the Leica DMI 4000B confocal microscope. A heated 37°C temperature-controlling chamber filled with 5% CO2 surrounding the microscope stage is used to keep the cells alive.
Lysosomal pH
The measurement of lysosomal pH is based on the use of the ratiometric assay of pH-sensitive fluorescein fluorescence (FITC) to pH-insensitive rhodamine fluorescence (TRITC). In brief, cells are incubated overnight (∼16 h) with 2.5 mg/ml dextran particles (Invitrogen, D1951) in complete growth media and grown in 5% CO2. Cells are washed three times in complete media and chased for 4 h to allow the dextran to traffic to the lysosomes. Cells are identified based on forward and side scatter. FITC is measured in the FL1 channel (Excitation wavelength 488 nm; Emission 515–545 nm), TRITC is measured in the FL2 channel (yellow). The median fluorescence value is determined for at least 5000 cells. Standard curves are obtained by incubating cells in isotonic K+ solutions (143 mM KCl, 5 mM glucose, 1 mM MgCl2, 1 mM CaCl2, and 20 mM Hepes) buffered to a pH ranging from 4 to 6 in the presence of the proton ionophore nigericin.
Statistical analysis
Unless noted, data were expressed as mean ± standard deviation (SD) and represent the results of at least three independent experiments. Statistical significance was determined using the unpaired t-test for two-group experiments. P value lower than 0.05 were considered statistically significant and were indicated as follows: *P < 0.05; ** P < 0.01; *** P < 0.001.
Acknowledments
We would like to thank Drs. Ellen A Walker, Kelly Whelan and Marc Illies for the valuable comments. We are grateful to Drs. Amy Palmer, Toren Finkel, Virginia M. -Y. Lee, Jing Pu, Isei Tanida for sharing reagents either directly or through Addgene. The following reagent was obtained through the NIH AIDS Reagent Program, Division of AIDS, NIAID, NIH: HIV-1 pNL4-3 WT and mutants plasmids from Dr. Nathaniel Landau [66]. We also like to thank all the labs and PIs who kindly shared their reagents with us.
This work is supported by an NIH-NIA (R01-AG054411) awarded to BES. This work was also supported by previous NIH grants NS076402 and MH093331 awarded to BES.
Supplemental Material
Download Zip (115.7 MB)Disclosure statement
No potential conflict of interest was reported by the author(s).
Supplementary material
Supplemental data for this article can be accessed here.
Additional information
Funding
References
- Tisch S, Brew B. Parkinsonism in hiv-infected patients on highly active antiretroviral therapy. Neurology. 2009;73(5):401–403.
- DeVaughn S, Muller-Oehring EM, Markey B, et al. Aging with HIV-1 infection: motor functions, cognition, and attention-A comparison with parkinson’s disease. Neuropsychol Rev. 2015;25(4):424–438.
- Itoh K, Mehraein P, Weis S. Neuronal damage of the substantia nigra in HIV-1 infected brains. Acta Neuropathol. 2000;99(4):376–384.
- Kumar AM, Fernandez JB, Singer EJ, et al. Human immunodeficiency virus type 1 in the central nervous system leads to decreased dopamine in different regions of postmortem human brains. J Neurovirol. 2009;15(3):257–274.
- Vigorito M, Connaghan KP, Chang SL. The HIV-1 transgenic rat model of neuroHIV. Brain Behav Immun. 2015;48:336–349.
- Moran LM, Aksenov MY, Booze RM, et al. Adolescent HIV-1 transgenic rats: evidence for dopaminergic alterations in behavior and neurochemistry revealed by methamphetamine challenge. Curr HIV Res. 2012;10(5):415–424.
- Moran LM, Booze RM, Webb KM, et al. Neurobehavioral alterations in HIV-1 transgenic rats: evidence for dopaminergic dysfunction. Exp Neurol. 2013;239:139–147.
- Khanlou N, Moore DJ, Chana G, et al. Increased frequency of alpha-synuclein in the substantia nigra in human immunodeficiency virus infection. J Neurovirol. 2009;15(2):131–138.
- Eslamboli A, Romero-Ramos M, Burger C, et al. Long-term consequences of human alpha-synuclein overexpression in the primate ventral midbrain. Brain. 2007;130(3):799–815.
- Recasens A, Ulusoy A, Kahle PJ, et al. In vivo models of alpha-synuclein transmission and propagation. Cell Tissue Res. 2018;373(1):183–193.
- Webb JL, Ravikumar B, Atkins J, et al. Alpha-Synuclein is degraded by both autophagy and the proteasome. J Biol Chem. 2003;278(27):25009–25013.
- Wang X, Gao Y, Tan J, et al. HIV-1 and HIV-2 infections induce autophagy in Jurkat and CD4+ T cells. Cell Signal. 2012;24(7):1414–1419.
- Killian MS. Dual role of autophagy in HIV-1 replication and pathogenesis. AIDS Res Ther. 2012;9(1):16.
- Gonzalez ME. The HIV-1 Vpr protein: a multifaceted target for therapeutic intervention. Int J Mol Sci. 2017;18(1):126.
- James T, Nonnemacher MR, Wigdahl B, et al. Defining the roles for Vpr in HIV-1-associated neuropathogenesis. J Neurovirol. 2016;22(4):403–415.
- Guenzel CA, Herate C, Benichou S. HIV-1 Vpr-a still “enigmatic multitasker”. Front Microbiol . 2014;5:127.
- Agarwal N, Iyer D, Patel SG, et al. HIV-1 Vpr induces adipose dysfunction in vivo through reciprocal effects on PPAR/GR co-regulation. Sci Transl Med. 2013;5(213):213ra164.
- Taylor-Whiteley TR, Le Maitre CL, Duce JA, et al. Recapitulating Parkinson’s disease pathology in a three-dimensional human neural cell culture model. Dis Model Mech. 2019;12(4):dmm038042.
- Zhou HY, Zheng YH, He Y, et al. The role of autophagy in THP-1 macrophages resistance to HIV- vpr-induced apoptosis. Exp Cell Res. 2017;351(1):68–73..
- Laforge M, Limou S, Harper F, et al. DRAM triggers lysosomal membrane permeabilization and cell death in CD4(+) T cells infected with HIV. PLoS Pathog. 2013;9(5):e1003328.
- Zhou D, Masliah E, Spector SA. Autophagy is increased in postmortem brains of persons with HIV-1-associated encephalitis. J Infect Dis. 2011;203(11):1647–1657.
- Tornatore C, Meyers K, Atwood W, et al. Temporal patterns of human immunodeficiency virus type 1 transcripts in human fetal astrocytes. J Virol. 1994;68(1):93–102.
- Tang SW, Ducroux A, Jeang KT, et al. Impact of cellular autophagy on viruses: insights from hepatitis B virus and human retroviruses. J Biomed Sci. 2012;19(1):92.
- Nakamura S, Yoshimori T. New insights into autophagosome-lysosome fusion. J Cell Sci. 2017;130(7):1209–1216.
- Mauthe M, Orhon I, Rocchi C, et al. Chloroquine inhibits autophagic flux by decreasing autophagosome-lysosome fusion. Autophagy. 2018;14(8):1435–1455.
- Jiang L, Salao K, Li H, et al. Intracellular chloride channel protein CLIC1 regulates macrophage function through modulation of phagosomal acidification. J Cell Sci. 2012;125(22):5479–5488.
- Pu J, Schindler C, Jia R, et al. BORC, a multisubunit complex that regulates lysosome positioning. Dev Cell. 2015;33(2):176–188.
- Berner K, Morris L, Baumeister J, et al. Objective impairments of gait and balance in adults living with HIV-1 infection: a systematic review and meta-analysis of observational studies. BMC Musculoskelet Disord. 2017;18(1):325.
- Wang X, Gao Y, Tan J, et al. HIV-1 and HIV-2 infections induce autophagy in Jurkat and CD4+ T cells. Cell Signal. 2012;24(7):1414–1419.
- Klionsky DJ, Abdelmohsen K, Abe A, et al. Guidelines for the use and interpretation of assays for monitoring autophagy (3rd edition). Autophagy. 2016;12:1–222.
- Hara T, Takamura A, Kishi C, et al. FIP200, a ULK-interacting protein, is required for autophagosome formation in mammalian cells. J Cell Biol. 2008;181(3):497–510.
- Matsunaga K, Saitoh T, Tabata K, et al. Two Beclin 1-binding proteins, Atg14L and Rubicon, reciprocally regulate autophagy at different stages. Nature Cell Biol. 2009;11(4):385–396.
- Matsui Y, Takagi H, Qu X, et al. Distinct roles of autophagy in the heart during ischemia and reperfusion: roles of AMP-activated protein kinase and Beclin 1 in mediating autophagy. Circ Res. 2007;100(6):914–922.
- Hosokawa N, Hara T, Kaizuka T, et al. Nutrient-dependent mTORC1 association with the ULK1-Atg13-FIP200 complex required for autophagy. Mol Biol Cell. 2009;20(7):1981–1991.
- Itakura E, Kishi C, Inoue K, et al. Beclin 1 forms two distinct phosphatidylinositol 3-kinase complexes with mammalian Atg14 and UVRAG. Mol Biol Cell. 2008;19(12):5360–5372.
- Zeng X. Functional specificity of the mammalian Beclin-Vps34 PI 3-kinase complex in macroautophagy versus endocytosis and lysosomal enzyme trafficking. J Cell Sci. 2006;119(2):259–270.
- Ono K, Kim SO, Han J. Susceptibility of lysosomes to rupture is a determinant for plasma membrane disruption in tumor necrosis factor alpha-induced cell death. Mol Cell Biol. 2003;23(2):665–676.
- Zhu TF, Szostak JW. Exploding vesicles. J Syst Chem. 2011;2(1):4.
- Kurz T, Terman A, Gustafsson B, et al. Lysosomes and oxidative stress in aging and apoptosis. Biochim Biophys Acta. 2008;1780(11):1291–1303.
- Campbell GR, Bruckman RS, Herns SD, et al. Induction of autophagy by PI3K/MTOR and PI3K/MTOR/BRD4 inhibitors suppresses HIV-1 replication. J Biol Chem. 2018;293(16):5808–5820.
- El-Hage N, Rodriguez M, Dever SM, et al. HIV-1 and morphine regulation of autophagy in microglia: limited interactions in the context of HIV-1 infection and opioid abuse. J Virol. 2015;89:1024–1035.
- Campbell GR, Rawat P, Bruckman RS, et al. Human immunodeficiency virus type 1 nef inhibits autophagy through transcription factor EB sequestration. PLoS Pathog. 2015;11(6):e1005018.
- Kyei GB, Dinkins C, Davis AS, et al. Autophagy pathway intersects with HIV-1 biosynthesis and regulates viral yields in macrophages. J Cell Biol. 2009;186(2):255–268.
- Fields J, Dumaop W, Eleuteri S, et al. HIV-1 Tat alters neuronal autophagy by modulating autophagosome fusion to the lysosome: implications for HIV-associated neurocognitive disorders. J Neurosci. 2015;35(5):1921–1938.
- Maday S, Wallace KE, Holzbaur EL. Autophagosomes initiate distally and mature during transport toward the cell soma in primary neurons. J Cell Biol. 2012;196(4):407–417.
- Buxton P, Zhang XM, Walsh B, et al. Identification and characterization of SNAPIN as a ubiquitously expressed SNARE-binding protein that interacts with SNAP23 in non-neuronal cells. Biochem J. 2003;375(2):433–440.
- Chheda MG, Ashery U, Thakur P, et al. Phosphorylation of SNAPIN by PKA modulates its interaction with the SNARE complex. Nat Cell Biol. 2001;3(4):331–338.
- Ruder C, Reimer T, Delgado-Martinez I, et al. EBAG9 adds a new layer of control on large dense-core vesicle exocytosis via interaction with SNAPIN. Mol Biol Cell. 2005;16(3):1245–1257.
- Cai Q, Lu L, Tian JH, et al. SNAPIN-regulated late endosomal transport is critical for efficient autophagy-lysosomal function in neurons. Neuron. 2010;68(1):73–86.
- Di Giovanni J, Sheng ZH. Regulation of synaptic activity by SNAPIN-mediated endolysosomal transport and sorting. Embo J. 2015;34(15):2059–2077.
- Cheng XT, Zhou B, Lin MY, et al. Axonal autophagosomes recruit dynein for retrograde transport through fusion with late endosomes. J Cell Biol. 2015;209(3):377–386.
- Shi B, Huang QQ, Birkett R, et al. SNAPIN is critical for lysosomal acidification and autophagosome maturation in macrophages. Autophagy. 2017;13(2):285–301.
- Starcevic M, Dell’Angelica EC. Identification of SNAPIN and three novel proteins (BLOS1, BLOS2, and BLOS3/reduced pigmentation) as subunits of biogenesis of lysosome-related organelles complex-1 (BLOC-1). J Biol Chem. 2004;279(27):28393–28401.
- Shen A, Lei J, Yang E, et al. Human cytomegalovirus primase UL70 specifically interacts with cellular factor SNAPIN. J Virol. 2011;85(22):11732–11741.
- Katsumata K, Nishiyama J, Inoue T, et al. Dynein- and activity-dependent retrograde transport of autophagosomes in neuronal axons. Autophagy. 2010;6(3):378–385.
- Ye X, Cai Q. SNAPIN-mediated BACE1 retrograde transport is essential for its degradation in lysosomes and regulation of APP processing in neurons. Cell Rep. 2014;6(1):24–31.
- Hariri M, Millane G, Guimond MP, et al. Biogenesis of multilamellar bodies via autophagy. Mol Biol Cell. 2000;11(1):255–268.
- Gieselmann V. Lysosomal storage diseases. Biochim Biophys Acta. 1995;1270(2–3):103–136.
- Hayakawa T, Makino A, Murate M, et al. pH-dependent formation of membranous cytoplasmic body-like structure of ganglioside G(M1)/bis(monoacylglycero)phosphate mixed membranes. Biophys J. 2007;92(1):L13–6.
- Platt FM, Neises GR, Reinkensmeier G, et al. Prevention of lysosomal storage in Tay-Sachs mice treated with N-butyldeoxynojirimycin. Science. 1997;276(5311):428–431.
- Blanchette-Mackie EJ. Intracellular cholesterol trafficking: role of the NPC1 protein. Biochim Biophys Acta. 2000;1486(1):171–183.
- Shen J, Du T, Wang X, et al. alpha-Synuclein amino terminus regulates mitochondrial membrane permeability. Brain Res. 2014;1591:14–26.
- Wang Y, Santerre M, Tempera I, et al. HIV-1 Vpr disrupts mitochondria axonal transport and accelerates neuronal aging. Neuropharmacology. 2017;117:364–375.
- Lee JW, Nam H, Kim LE, et al. TLR4 (toll-like receptor 4) activation suppresses autophagy through inhibition of FOXO3 and impairs phagocytic capacity of microglia. Autophagy. 2019;15(5):753–770.
- Bussi C, Peralta Ramos JM, Arroyo DS, et al. Autophagy down regulates pro-inflammatory mediators in BV2 microglial cells and rescues both LPS and alpha-synuclein induced neuronal cell death. Sci Rep. 2017;7(1):43153.
- He Y, She H, Zhang T, et al. p38 MAPK inhibits autophagy and promotes microglial inflammatory responses by phosphorylating ULK1. J Cell Biol. 2018;217(1):315–328.
- Alirezaei M, Kiosses WB, Flynn CT, et al. Disruption of neuronal autophagy by infected microglia results in neurodegeneration. PLoS One. 2008;3(8):e2906.
- Muller S, Brun S, Rene F, et al. Autophagy in neuroinflammatory diseases. Autoimmun Rev. 2017;16(8):856–874.
- Van Engelenburg SB, Palmer AE. Imaging type-III secretion reveals dynamics and spatial segregation of Salmonella effectors. Nat Methods. 2010;7(4):325–330.
- Lee IH, Cao L, Mostoslavsky R, et al. A role for the NAD-dependent deacetylase Sirt1 in the regulation of autophagy. Proc Natl Acad Sci USA. 2008;105(9):3374–3379.
- Tanida I, Ueno T, Uchiyama Y. A super-ecliptic, pHluorin-mKate2, tandem fluorescent protein-tagged human LC3 for the monitoring of mammalian autophagy. PLoS One. 2014;9(10):e110600.
- Mahalingam S, Khan SA, Jabbar MA, et al. Identification of residues in the N-terminal acidic domain of HIV-1 Vpr essential for virion incorporation. Virology. 1995;207(1):297–302.
- Connor RI, Chen BK, Choe S, et al. Vpr is required for efficient replication of human immunodeficiency virus type-1 in mononuclear phagocytes. Virology. 1995;206(2):935–944.
- Cheung JY, Merali S, Wang J, et al. The central role of protein kinase C epsilon in cyanide cardiotoxicity and its treatment. Toxicol Sci. 2019;171(1):247–257.
- Barrero CA, Perez-Leal O, Aksoy M, et al. Histone 3.3 participates in a self-sustaining cascade of apoptosis that contributes to the progression of chronic obstructive pulmonary disease. Am J Respir Crit Care Med. 2013;188(6):673–683.
- Boden G, Homko C, Barrero CA, et al. Excessive caloric intake acutely causes oxidative stress, GLUT4 carbonylation, and insulin resistance in healthy men. Sci Transl Med. 2015;7(304):304re7.
- Seibenhener ML, Wooten MW. Isolation and culture of hippocampal neurons from prenatal mice. J Vis Exp. 2012;65:3634.