
 ?Mathematical formulae have been encoded as MathML and are displayed in this HTML version using MathJax in order to improve their display. Uncheck the box to turn MathJax off. This feature requires Javascript. Click on a formula to zoom.
ABSTRACT
Relatively quiescent tissues like salivary glands (SGs) respond to stimuli such as injury to expand, replace and regenerate. Resident stem/progenitor cells are key in this process because, upon activation, they possess the ability to self-renew. Macroautophagy/autophagy contributes to and regulates differentiation in adult tissues, but an important question is whether this pathway promotes stem cell self-renewal in tissues. We took advantage of a 3D organoid system that allows assessing the self-renewal of mouse SGs stem cells (SGSCs). We found that autophagy in dormant SGSCs has slower flux than self-renewing SGSCs. Importantly, autophagy enhancement upon SGSCs activation is a self-renewal feature in 3D organoid cultures and SGs regenerating in vivo. Accordingly, autophagy ablation in SGSCs inhibits self-renewal whereas pharmacological stimulation promotes self-renewal of mouse and human SGSCs. Thus, autophagy is a key pathway for self-renewal activation in low proliferative adult tissues, and its pharmacological manipulation has the potential to promote tissue regeneration.
Introduction
Stem cells are by definition cells that have the unique capacity of endless self-renewal and differentiation into mature cells, which results in the regeneration of specific cell types and tissues, in both embryos and adults [Citation1]. This ability of self-renewal is a key property for tissue maintenance in adults. Self-renewal of stem cells occurs by an asymmetric cell division into one stem cell and one progenitor cell, which allows to permanently conserve a stem cell pool within a tissue while leading to differentiation of mature tissue-specific and long-lived lineages. There is a delicate balance between self-renewal and differentiation, which is regulated by cell-intrinsic transcriptional programs and extracellular signals from the stem cell surroundings [Citation2]. In adult tissues, stem cells are localized in a specific and often hypoxic microenvironment, usually referred to as stem cell niche, in which they either maintain their quiescent state and preserve their self-renewal capacity or orchestrate tissue reprogramming through cell-cell interactions and extracellular signals. Most tissues with low or no proliferative steady-state properties, such as liver or skeletal muscle, respond to environmental changes, e.g., tissue damage, upon which their stem cells become activated to expand, replace and therefore regenerate the tissue. The change from this quiescent, “dormant” state (naïve, low -activity stem cells) to an “activated” state (primed, proliferating stem cells) for regeneration, is accompanied by a change in both metabolism and gene expression [Citation3,Citation4].
Macroautophagy, hereafter called autophagy, is an evolutionarily conserved, tightly-regulated lysosomal degradative pathway that through the turnover of obsolete and/or damaged proteins and organelles, is crucial to maintain cell homeostasis in steady-state conditions but also in response to various stresses [Citation5]. Autophagy is also playing a central role in cell development and differentiation, through still largely unclear mechanisms [Citation6]. Several studies have initially focused on the role of autophagy in development taking advantage of conditional knockout mice lacking genes essential for autophagy, the so-called Atg (autophagy-related) genes. Those investigations have shown that in most organs there are no aberrant developmental problems in chronic autophagy deficient models [Citation7], indicating that tissue maintenance upon intrinsic and environmental stresses, may be the primary role of autophagy. Thus, there has been a research focus and investigations on the physiological role of autophagy on tissue-specific stem cell types such as hematopoietic (HSCs), neuronal (NSCs), mesenchymal (MSCs), cancer (CSCs) stem cells and induced pluripotent stem cells (iPSCs), have revealed that this process contributes to stem cell reprogramming and tissue differentiation [Citation6,Citation8]. The uniqueness of these adult stem cell populations is their multipotency, which is indicated by their ability to self-renew for expansion upon activation and requires strict maintenance of their homeostasis at steady state. The relationship between tissue self-renewal and autophagy has been investigated so far in vitro in muscle stem cells [Citation9], neural stem cells (NSCs) [Citation10], embryonic stem cells (ESCs) [Citation11] and hematopoietic stem cells (HSCs) [Citation12,Citation13], mostly in the context of either the stemness property maintenance or aging cells and their metabolism. In vitro studies, however, may have reached conclusions that do not entirely apply in vivo, as they lack the cell-cell and cell-matrix interactions that are essential for the establishment of tissue-specific microenvironments and stem cell responses [Citation14,Citation15]. The missing factors might be the presence of other differentiated cell types, signaling molecules, extracellular matrix (ECM) interactions, 3D tissue arrangement and mechanical forces. 3D organoid cultures provide several of these factors, including the 3D arrangement, necessary rigidity, tension and identified soluble niche components [Citation16]. As a result, they represent a well-controlled tool allowing relatively easy experimental manipulation [Citation16].
The recent development of new culturing technologies in 3D organoid systems permits to overcome the limitations of the existing in vitro systems and to study the role of autophagy in tissue maintenance and self-renewal in the more physiologically-relevant context of tissue self-organization. Tissue self-renewal has been defined as the process by which an organ replaces its lost cells [Citation17] and salivary glands (SGs) are one of the organs capable of rapid regeneration. Despite their slow turnover, studies on damaged adult SGs have highlighted their regeneration potential. For example, acinar cells appear to be replaceable following injury that causes a loss of SGs function [Citation18–20]. Radiation is the main cause of SGs dysfunction as radiotherapy is currently the most effective treatment of patients with head-and-neck cancer. Exposure of healthy SGs to radiation, however, results in a severe progressive loss of SG acinar unit function leading to irreversible hyposalivation and development of xerostomia, which manifests with dry mouth, tooth decay, oral infection and impaired taste and speech [Citation21]. In this context, stem cell transplantation therapy is considered one of the most promising regenerative strategies along with gene therapy, to permanently restore SGs function [Citation22–24]. Salivary glands stem cells (SGSCs) have been identified and characterized using different expression markers, and the long-term ex vivo expansion of SGSCs-derived SGs organoids has also been established for both mouse and patient samples [Citation25–27].
We decided to exploit SGSCs and SGs organoids to develop a system to study the role of autophagy in stem cell maintenance in the context of a tissue, with also the ultimate goal to promote self-renewal of SGs for therapeutic applications. In particular, we have investigated how basal autophagy contributes to the maintenance of SGSCs utilizing a 3D culture system and reveal that dormant SGSCs have a slower basal autophagic flux than the progenitor cells. Autophagy activation in SGSCs is then essential for their self-renewal to generate progenitor cells, and this process can be enhanced pharmacologically. Furthermore, we show that autophagy is also induced in SGSCs in animals upon injury to regenerate the damaged tissue. Altogether, our results uncover a crucial function of autophagy in tissue self-renewal and highlight its therapeutic potential for efficient regeneration upon damage.
Results
Autophagy is essential for continuous SGSCs self-renewal
To study the role of autophagy in the self-renewal of SGs cells, we took advantage of a well-established 3D organoid model of SGSCs [Citation28,Citation29]. Briefly, SGs isolated from mice were mechanically and enzymatically dissociated and cultured to yield organoids that can be passaged as single cells in Matrigel® (). In this 3D organoid system, only single SGSCs seeded in Matrigel® at day 0, will be able to form primary organoids, approximately in 7 days (). Long-term self-renewal potential of SGSCs can then be assessed by isolating single cells from secondary organoids, which are subsequently cultured in Matrigel® and incubated with self-renewal medium for tertiary sphere formation (). This procedure was repeated every 7 days, when the organoids are dissociated into single cells and plated again for the next passage. The self-renewal efficiency of SGSCs at each passage was assessed by determining the organoid forming efficiency (OFE), which represents the percentage of organoids formed from 100 plated cells.
Figure 1. Autophagy is essential for SGSCs self-renewal. (A) Schematic representation of 3D culturing of murine SGSCs for self-renewal analysis. (B) Organoids from SGSCs transfected with either scrambled siRNAs (scramble) or siRNAs targeting Atg13 (siAtg13) for 48 h after 7 days in Matrigel®. The percentage of organoid-forming efficiency (OFE) was determined at the end of passage 1 in MM medium as described in Material and Methods. Bars represent the means of 3 independent experiments ± SD. The asterisk annotates a significant difference of p < 0.05. (C) Brightfield microscope images of organoids from SGSCs transfected as in panel B. (D) OFE of autophagy competent (Atg5+/+, Atg5+/-) and atg5−/- 3D cultures over 5 passages (p1 to p5). Each data point represents the measurement of one sample and means ±SD are indicated. Asterisks annotate significant differences of p < 0.05. (E) Brightfield microscope images of primary organoids from SGSCs derived from Atg5+/- and atg5−/- embryos at stage E18.5, at the end of passage 1 (p1) and 4 (p4) in the MM medium. (F) Cumulative population doublings of Atg5+/+, Atg5+/- and atg5−/- SGSCs over the 5 passages shown in (D). Asterisks annotate significant differences of p < 0.05. (G) Cell survival rates of Atg5+/+, Atg5+/- and atg5−/- SGSCs were determined at the end of 5 passages (p0 to p5) using ANNEXIN V/PI staining and FACS sorting as described in Materials and Methods, and normalized to the cell survival rate of heterozygous Atg5+/+ SGSCs. Bars represent the means of 3 independent experiments ±SD. The n.s. abbreviations highlight that there are no significant differences.
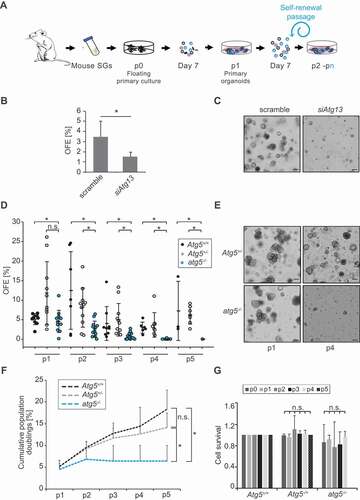
As a first approach to ascertain an eventual role of autophagy in SGSCs self-renewal, we inhibited autophagy in primary SG cells using two common lysosomal inhibitors, bafilomycin A1 (Baf) and chloroquine (CQ), which block the latest steps of autophagy [Citation30]. Single cells derived from primary organoids were incubated separately with these two compounds for 5 h. As expected, these treatments led to the accumulation of the autophagy marker protein MAP1LC3/LC3 (microtubule-associated protein 1 light chain 3)-II and the autophagy substrate SQSTM1/p62 (sequestosome 1), which was visualized by either fluorescence microscopy and western blots (Figures S1A and S1B). Subsequently, organoids were dissociated and cultured into secondary organoids in presence of Baf or CQ. SGSCs exposed to these drugs lost their ability to form secondary organoids, suggesting that inhibition of autophagy may negatively affect SGSCs self-renewal (Figures S1C and S1D). An identical result was also observed when primary SG cells were treated with wortmannin (data not shown), a compound blocking the early steps of autophagosome biogenesis [Citation30]. As Baf and CQ also inhibit other cellular processes relying on lysosomal functions and could cause SGSCs death that would appear as an inability to self-renew, we decided to specifically ablate autophagy by knocking down Atg13, a gene regulating the initiation of autophagy [Citation31]. To this aim, cells isolated from SGs were kept in culture for 48 h in presence of scramble or Atg13-targeting siRNAs, before culturing them in Matrigel® to induce organoid formation. Treatment of cells with siRNA targeting Atg13, which resulted in an inhibition of the autophagic flux as expected (Figure S2A), led to a significant reduction of the levels of this protein in the cell population (Figure S2B). Importantly, ATG13-depleted cells displayed a significant and pronounced reduction of their OFE, indicating that autophagy has an important role in the maintenance of the SGSCs to generate into a new lineage, which is critical for self-renewal ().
Next, we turned to a knockout model to confirm and study the role of autophagy in SGSCs self-renewal over several passages. Since most of the Atg gene knockout mice do not survive the post-birth starvation period [Citation7], we used SGs isolated from atg5−/- embryos at stage E18.5. At this stage, SGs are already post-terminally differentiated into secretory cell types [Citation32]. Freshly isolated embryonic SGs were cultured in Matrigel® for 7 days and treated with or without Baf for 5 h to monitor autophagic flux by assessing the difference in the levels of LC3-II [Citation30]. As expected [Citation7], Atg5+/+ and Atg5+/- organoids showed a functional autophagic flux while the ones derived from atg5−/- embryonic SGs displayed a complete autophagy block, i.e., no LC3-II was formed and SQSTM1 was accumulated also in the absence of Baf (Figures S3A and S3B) [Citation30]. Both autophagy competent genotypes, i.e., Atg5+/+ and Atg5-/+, had identical self-renewal efficiency as well (). Consistently with the result obtained with lysosomal inhibitors and ATG13 knockdown, SGSCs derived from atg5−/- mice showed a significantly lower self-renewal potential, as well as less and smaller primary organoids, were formed compared to autophagy-competent Atg5+/+ and Atg5+/- cells upon the initial dissociation and culture (,). We followed autophagy competent and incompetent organoids over 5 passages and observed that SGSCs from atg5−/- were completely exhausted by passage 4, while autophagy-capable SGSCs maintained their self-renewal capacity over time (). Cumulative population doublings over 5 passages highlighted that atg5−/- cells, in contrast to autophagy-competent cells, stop expanding after passage 2 in Matrigel® (). The inability of atg5−/- SGSCs to self-renew was also observed in a WRY medium that robustly stimulates WNT signaling (data not shown), and thus promotes an increase in organoid formation in vitro [Citation27]. Importantly, ANXA5/ANNEXINV and propidium iodide staining for dead cells showed that the inability of atg5−/- SGSCs to produce secondary organoids was not due to cell death as their viability, starting from isolation, i.e., p0, and until exhaustion at passage 4, did not change significantly and was similar to that of Atg5+/-and Atg5+/+ SGSCs (). In contrast, it appears that atg5−/- SGSCs lose their cell division capacity since atg5−/- cells start to accumulate at the S phase through the passages while autophagy competent cells’ distribution in G0/G1, S and G2/M phases remain identical (Figure S3C).
Altogether, these data show that functional autophagy is essential for SGSCs maintenance and self-renewal, prior to extrinsic cell differentiation signals.
Autophagy induction increases SGSCs self-renewal in vitro
To directly prove that autophagy induction promotes SGSCs self-renewal, we decided to enhance the flux of this pathway in SGSCs with the expectation of increasing self-renewal efficiency. To this aim, we took advantage of the Tat-beclin 1 (Tat-BECN1) peptide, which specifically stimulates basal autophagy activity and has been successfully applied to multiple tissues [Citation33]. Tat-BECN1 was added to the single cells during isolation from SGs and kept in the medium during the entire self-renewal assay (). Tat-BECN1 indeed induced the autophagic flux in SGSCs (Figures S4A and S4B). In agreement with our hypothesis, enhancement of basal autophagy stimulated SGSCs self-renewal efficiency over several passages (). Importantly, the organoids formed in presence of Tat-BECN1 showed no morphological alterations in comparison to the control treated cells (), and differentiated structure formation efficiency upon differentiation of SGSCs-derived organoids exposed to Tat-BECN1 was not altered (). These observations highlight the Tat-BECN1 peptide specifically promotes SGSCs self-renewal without affecting differentiation programs. The enhancement in SGSCs self-renewal throughout passages was only maintained when SGSCs were constantly kept in presence of Tat-BECN1 and not when this peptide was applied only during their isolation from SGs (,). In this latter experimental setup, we observed a transient increase in SGSCs self-renewal at passage 2 in the presence of Tat-BECN1, which was not sustained in the subsequent passages during which the peptide was removed, revealing that the increase in SGSCs self-renewal efficiency depends on a sustained autophagic flux and it is not due to a permanent change in SGSCs during their initial isolation from SGs. To prove that this enhancement in SGSCs self-renewal was not caused by an off-target effect of Tat-BECN1, we cultured atg5−/- embryos derived SGSCs in presence of this peptide and observed that autophagy deficient cells did not show any improvement of OFE in contrast to the autophagy-competent genotypes ().
Figure 2. Autophagy induction increases SGSCs self-renewal in vitro. (A) Schematic representation of the experimental setup over 3 passages for the 3D culturing of SGSCs for self-renewal analysis in the continuous presence of Tat-BECN1 in the MM medium. The blue arrow highlights when Tat-BECN1 was present. (B) OFE of SGSCs treated or not with 50 nM Tat-BECN1 following the experimental setup shown in (A). Bars represent the means of 3 independent experiments ±SD. Asterisks annotate significant differences of p < 0.05, while the n.s. abbreviation highlights that there is no significant difference. (C) Brightfield microscope images of organoids from SGSCs treated or not with 50 nM Tat-BECN1, after 7 days in Matrigel® at the end of passage 1 (p1) and 3 (p3). (D) Percentage of differentiated structures after differentiation of SGSCs derived organoids treated or not with 50 nM Tat-BECN1. Bars represent the means of 3 experiments ±SD. The n.s. abbreviation highlights that there is no significant difference. (E) Schematic representation of the experimental setup over 3 passages for the 3D culturing of SGSCs for self-renewal analysis with exposure to Tat-BECN1 treatment only during the initial isolation of single cells from SGs. The blue arrow highlights when Tat-BECN1 was present. (F) OFE of SGSCs treated or not with 50 nM Tat-BECN1 following the experimental setup shown in (E). Bars represent the means of 3 independent experiments ±SD. The asterisk annotates a significant difference of p < 0.05, while the n.s. abbreviation highlights that there is no significant difference. (G) OFE at passage 1 of Atg5+/+, Atg5+/- and atg5−/- SGSCs treated or not with 50 nM Tat-BECN1 following the experimental setup shown in (E). Bars represent the means of 3 independent experiments ± SD. Asterisks annotate significant differences of p < 0.05, while the n.s. abbreviation highlights that there is no significant difference.
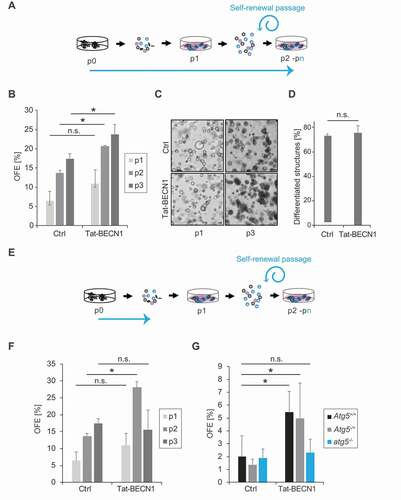
Although murine SGSCs can practically self-renew endlessly in the current 3D culture system, their human counterparts can do it for a limited number of passages, typically 4–5 [Citation25]. Therefore, we decided to explore whether autophagy induction by Tat-BECN1 could improve the self-renewal efficiency of human SGSCs as well. The preliminary observation suggests that autophagy stimulation induces OFE efficiency at least in two human samples that we could have access to (Figures S4C and S4D).
Taken together, these results led us to conclude that autophagy stimulation promotes SGSCs self-renewal in mice and human cells.
Autophagy is induced upon SGSCs activation
In adult SG, SGSCs are localized to the SG ducts and they are in a dormant state in the absence of injury. Extracellular stress activates them for self-renewal and differentiation via the production of progenitor cells [Citation27,Citation34]. In contrast, SGSCs are constantly activated in our 3D cultures because they are triggered to proliferate by the enriched medium employed for the self-renewal analysis in Matrigel® (). As a result, it is not possible to distinguish in our 3D culture system whether basal autophagy activity is necessary to maintain dormant SGSCs or whether this pathway is critical for SGSCs self-renewal upon their activation.
Figure 3. Autophagy is induced upon SGSCs activation. (A) Schematic representation of the duct region of adult SGs and localization of dormant SGSCs and progenitor cells, which are activated in the 3D culture system by the medium embedding the Matrigel®. (B) Representative FACS profiles of SG cells sorted into 2 subpopulations based on the expression levels of the cell surface marker proteins ITGB1 and CD24. SGSCs are ITGB1hi/hi-and CD24hi/hi, while progenitor cells are ITGB1medium/hi and CD24medium/hi. (C) Cells isolated as in (A) were treated or not with 100 nM Baf for 5 h, lysed and proteins examined by western blot using antibodies against SQSTM1 and LC3. ACTIN was used as the loading control. (D) The autophagy flux index in each sample of the experiment shown in (C) was determined by dividing the amount of LC3-II in Baf-treated cells with that in cells not exposed to Baf. Protein levels were normalized to ACTIN, which was used as the loading control. Bars represent the means of 3 independent experiments ±SD and relative to the values of the mixed cell population. Asterisks annotate significant differences of p < 0.05. (E) The OFE of the samples examined in (C) and (D) was determined for 4 passages and the data points represent the means of 3 independent experiments ±SD. Asterisks annotate significant differences of p < 0.05 (F) The quantification of the autophagy flux in the mixed, SGSCs progenitor and SGSCs populations analyzed in (C) and S5, was carried out over 3 passages in 3D cell culture. Bars represent the means of 3 independent experiments ±SD and they are relative to the value measured in each cell population before 3D cell culture, i.e., at p0. Asterisks annotate significant differences of p < 0.05, while the n.s. abbreviation highlights that there is no significant difference.
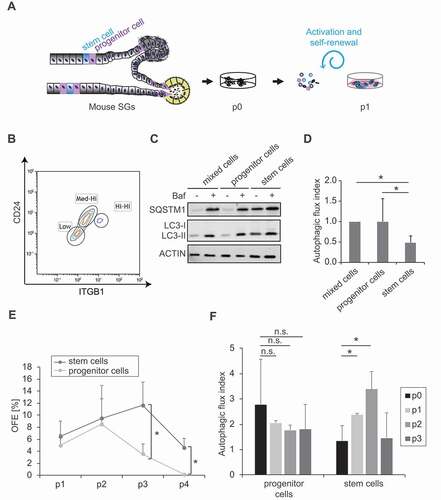
To distinguish between these two possibilities, we opted to assess the basal autophagic flux in freshly isolated SGSCs, i.e., at passage 0 () and to determine whether their basal autophagic flux is lower or higher than in the rest of the tissue. Thus, we isolated SGs ductal-compartment-derived cell populations from the heterogeneous cell composition of SGs by FACS as previously described [Citation26]. More specifically, SGSCs- (cell surface markers ITGB1hi and CD24hi) and SGSCs-derived progenitor- (ITGB1medium/hi and CD24medium/hi) enriched populations were sorted (). Subsequently, we measured the autophagic flux in these two cell populations by western blot while they were cultured in the enriched medium for only 5 h in the absence or the presence of Baf. This experiment revealed that the freshly isolated, SGSCs-enriched population has significantly lower autophagic flux in comparison to the SGSCs progenitor cell-enriched population, which displayed a higher autophagic flux, as observed by the LC3-II accumulation in the presence or the absence of Baf (,). Moreover, SQSTM1 turnover appeared to be reduced in the SGSCs-enriched population, consistently with the notion of a slow autophagic flux (). Finally, and as expected, the SGSCs-enriched population had increased self-renewal efficiency over several passages, while the SGSCs progenitor-enriched population lost its ability to self-renew over 3 passages (). Importantly, the SGSCs-enriched cell population started to show an enhanced autophagic flux upon activation by expansion in the 3D culture, showing that activation of dormant SGSCs isolated animal tissues is accompanied by an induction of autophagy activity ( and S5).
Altogether, these results show that SGSCs derived from the SGs ductal compartments have reduced basal autophagic flux and activation of this flux during expansion correlates with an induction of self-renewal. This observation provides a possible explanation for the relevance of autophagy in SGSCs self-renewal ().
Autophagy is induced in regenerating SGs
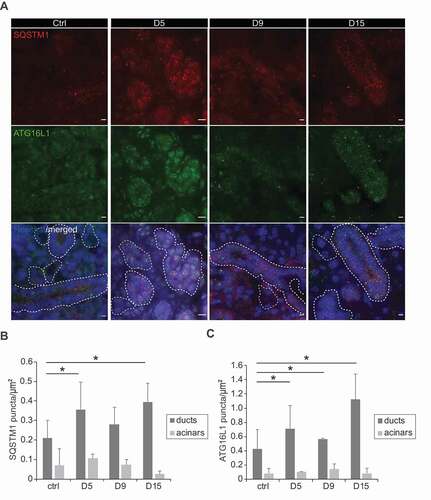
The results obtained with the 3D culture experiments supported the notion that the basal autophagic flux is slower in dormant SGSCs within SGs, and it is induced upon stimulating proliferation for self-renewal. To address the question whether autophagy is an intrinsic response during SGs regeneration in vivo, we took advantage of an in vivo injury mouse model for SGs that we recently developed. Briefly, a suture was placed below the sublingual SGs to induce a local injury, which also separates the SGs into a cranial hemisphere and a caudal part that are easily recognizable (). While the caudal part degenerates, the cranial hemisphere undergoes regeneration over a period of 15 days, to reform the complete SGs ( and S6). In our experimental setup, animals were sacrificed and SGs examined before the ligation and after 5, 9 and 15 days after ligation, to follow the dynamic process of regeneration. All the mice were also pulsed with 2 bromodeoxyuridine (BrdU) 24 h and 6 h before their sacrifice, to detect proliferating cells through incorporation of this fluorescent nucleotide in newly synthesized DNA. In particular, BrdU labeling is highly suggestive of regeneration and identifies the SGs regions where this process is active. We observed a significant and pronounced increase in the number of cells presenting BrdU-stained nuclei in both acinar and ductal regions of the SGs tissues 5 and 9 days after ligation (,), which showed that SGs were indeed undergoing a process of regeneration as expected. The decrease in BrdU staining 15 days post-ligation, in contrast, revealed that this process was close to termination at that time point (,). In the same tissues, we also examined the distribution of LC3, SQSTM1 and ATG16L1 (autophagy related 16 like 1), another autophagy marker protein [Citation30], by immunofluorescence. Interestingly, we observed that LC3 puncta formation was significantly increased throughout the SGs starting from the 9th day of regeneration in the ducts, while it remained unchanged in the acinar compartments over the 15 days (,). The same results were also obtained with both SQSTM1 and ATG16L1 labeling (). That is, while the number of puncta formed by these two autophagy marker proteins increases in duct regions of the regenerating SGs, their number remained low and constant in the differentiated, acinar compartments ().
Figure 4. Autophagy is induced in regenerating tissues. (A) Schematic representation of the ligation of mouse SG and the subsequent regeneration process over 15 days. (B) Control SGs, or regenerating SGs at days 5 (d5), 9 (d9) and 15 (d15) post-ligation, were excised from sacrificed animals and processed for immunohistochemistry. Subsequently, 5 µm thick sections were labeled with anti-LC3 and BrdU antibodies. Z-stacks of images separated by 0.2 µm were collected, deconvolved and analyzed as described in Material and Methods. Representative single focal planes are shown. Nuclei are stained with Hoechst. SGs duct regions are delimited by white dash-lines. Scale bars: 10 μm. (C) Quantification of BrdU positive nuclei in either duct regions or acinar cell areas (mm2) in the experiment shown in (B). (D) Quantification of the LC3 puncta number in either duct regions or acinar cell areas (µm2), in the experiment shown in (B). Bars represent the mean numbers ±SD counted at least in 5 randomly selected sections per SGs. Three different control and ligated SGs were analyzed. Asterisks annotate significant differences of p < 0.05.
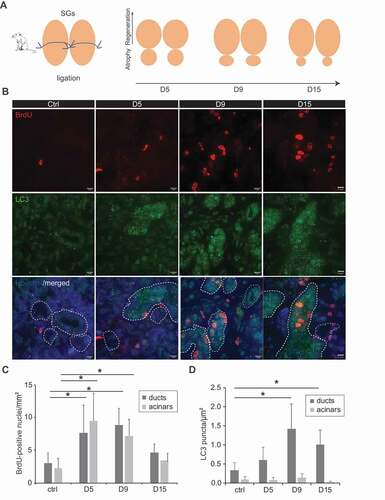
Figure 5. SG ligation-induced tissue regeneration increases autophagy activity. (A) The immunocytochemistry preparations described in Figure 4B were also cut in 5-µm thick sections and label with anti-ATG16L1 and anti-SQSTM1 antibodies. Z-stacks of images separated by 0.2 µm were collected, deconvolved and analyzed as described in Material and Methods. A representative single Z-projection is shown. Nuclei are stained with Hoechst. Ducts are delimitated by white dash-lines. Scale bars: 10 μm. (B,C) Quantification of either SQSTM1 (B) or ATG16L1 (C) puncta number in either duct regions or acinar cell areas (µm2), in the experiment shown in Figure 5A. Bars represent the mean numbers ±SD counted at least in 5 randomly selected sections per SGs. Three different control and ligated SGs were analyzed. Asterisks annotate significant differences of p < 0.05.
To prove that the autophagic flux is indeed induced during SGs regeneration, we repeated the SGs ligation experiment and evaluated the levels of LC3 and SQSTM1 in the presence or the absence of hydroxychloroquine (HCQ) (). As expected, the autophagic flux was low at steady state levels in the ductal region (, first column), in agreement with our observations in SGSCs (). In contrast, ligation triggered the autophagic flux in the same tissue upon ligation, from day 5, and throughout the regeneration process. We also observed that the number of LC3 puncta per μm2 in the acinar regions of SGs treated by HCQ was significantly higher than in non-treated SGs, showing that the basal autophagy flux of the acinar region is enhanced as observed in progenitor enriched SG cells (). The autophagic flux in acinar regions, however, did not increase significantly upon regeneration triggered by ligation ().
Figure 6. Autophagy flux is increased in ducts upon ligation-induced SGs regeneration. (A) Schematic representation of the ligation of mouse SGs and the subsequent regeneration process over 15 days upon HCQ treatment as described in material and methods. (B) Control SGs (no ligation, HCQ-untreated or no ligation, HCQ-treated), or regenerating SGs (ligation, HCQ-untreated or ligation, HCQ-treated) were excised from animals sacrificed at 0 (D0), 5 (D5), 9 (D9) and 15 (d15) days post-ligation, and processed for LC3 and SQSTM1 puncta analysis as in Figure 4B. Subsequently, the average number of LC3 or SQSTM1 puncta per µm2 was determined in either the duct or acinar cell regions of SGs from animals treated or untreated with HCQ. The autophagic flux index for each condition (day post-ligation, with or without ligation) was then calculated but dividing the number of puncta in the sample treated with HCQ by the number of puncta in the same sample not treated with HCQ. Finally, the autophagic flux index in the ligated SGs was expressed relative to that of the non-ligated SGs. Columns represent the mean numbers ± SD of at least 3 randomly selected sections per SGs. Three different control mice and 3 different ligated mice were analyzed at each time point. Asterisks annotate significant differences of p < 0.05.
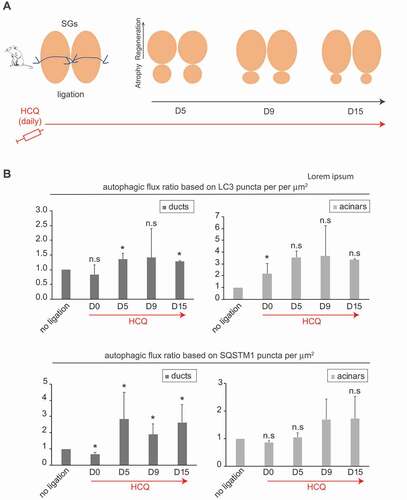
Altogether, these results show that autophagy is induced during SGs regeneration. It is important to note that the increase in the number of LC3 puncta remained throughout the regeneration of the SG tissue until day 15, suggesting that autophagy stimulation is not an immediate stress response in the entire SGs upon tissue damage in our model, but a specific program for a regenerative process that takes place in the ductal region, where stem cells reside (). Together with our previous observations that SGSCs fail to self-renew in the absence of functional autophagy (, and ), these data support the notion that autophagy plays a crucial role during the regeneration process of SGs from dormant SGSCs.
Discussion
Stem cells must have the ability to maintain their self-renewal capacity by dividing without differentiating into particular cell lineages via their progeny, to keep their regenerative potential throughout the lifetime of an organism. Autophagy has been shown to be involved in the maintenance and/or differentiation of various stem cells in vitro [Citation6,Citation8], but these models lack the morphological and functional organization of a tissue microenvironment. This is particularly important as autophagy activity is locally regulated by the metabolic and oxygenation status, as well as auto- and exocrine factors of the microenvironment [Citation8,Citation35,Citation36]. Our 3D self-renewal model for SGs allows to specifically study this process in a physiologically representative context of a specific tissue. Thus, with our study we have revealed an important role for autophagy in stem cells self-renewal and regeneration within a tissue.
The hematopoietic system is the first tissue to be shown to have a self-renewal ability and that they do this at an extremely high rate to daily replace a large fraction of the circulating blood cells [Citation37]. The experimental systems that allow investigating stemness maintenance and the regenerative capacity of the different HSCs subtypes that generate the various blood cell lineages have led to the finding that autophagy plays a key role in suppression of oxidative phosphorylation (OXPHOS)-driven metabolism [Citation12,Citation38,Citation39]. Specifically, autophagy inhibition leads to an active metabolism in HSCs and a loss of quiescence. A recent study has revealed that the 3D culture of MSCs increases cell viability in comparison to the 2D culture, and this is due to a decrease in ROS production that is mediated by autophagy [Citation40]. Using a murine colitis model, the authors also showed that autophagy induction could be critical to improve MSCs transplantation-based therapies [Citation40]. In tissue with a slower stem cell self-renewal rate such as the nervous system, dormant NSCs display a slower autophagic flux and proteasome activities, in contrast with their activated counterpart [Citation10]. These notions agree with our findings that show that in SGs, which is also a slowly-regenerating tissue, resident stem cells have a low basal autophagy activity than the progenitor cells (). To the best of our knowledge, our study is the first one showing that upon injury, the autophagic flux is increased, specifically in ductal compartments, concomitantly with the regeneration process of the SGs in vivo (). Moreover, the data obtained using pharmacological modulation of autophagy with Tat-BECN1 suggest that autophagy stimulation could be sufficient to activate stem cell proliferation, in particular that of SGSCs (). This would indicate that the turnover of one or more factors by autophagy could dictate or have an important contribution in the reprogramming necessary to trigger stem cell self-renewal. This hypothesis needs to be further investigated to reach a firm conclusion, as it still cannot be excluded that autophagy induction is a downstream event required for the execution of the stem cell self-renewal rather than having a regulatory function.
One of our most striking findings is that basal autophagy is significantly different between stem and progenitor cells in vivo and that SGSCs’ basal autophagic flux is significantly increased upon induction of proliferation in both 3D organoid cultures and animals’ SGs upon injury (, and S5). As reported recently, SGs progenitor cells take an important role in tissue regeneration upon genotoxic damage [Citation34]. Together with our findings that the progenitor cell population behaves significantly different than SGSCs and also that autophagy is induced primarily in the ductal regions where progenitor and stem cells are in close contact [Citation26] upon injury ( and S5), the interaction between these cells can be key for an efficient regeneration process. The question of if and how the progenitor and stem cell populations interact to keep a balance between self-renewal and differentiation into acinar cells for a functional recovery needs to be investigated, in particular because autophagy induction remains local within the ducts during regeneration. These observations assign an important role to basal autophagy in dormant stem cells during tissue homeostasis and cellular reprogramming, which is independent of extracellular stresses.
For the maintenance of resident stem cell functions, the stem cell niche plays an important role in regulating stem cell behavior both during homeostasis and regeneration upon injury. This niche includes cell-to-cell interactions between stem cells and progenitor as and biochemical and biophysical properties of the tissue structure involving the secreted factors, metabolic requirements such as hypoxia, etc [Citation14,Citation41]. Further studies are required to understand the interactions and communication between stem cell and the progenitor cell populations within SGs, and the functional role of autophagy within their niche upon tissue injury. Mitophagy can have a central role during cell differentiation by regulating the metabolic switch from glycolysis to OXPHOS, due to an increase in energy and metabolite demand during cellular remodeling [Citation42,Citation43]. In the SGs, however, we did not observe a significant difference in mitochondrial mass between dormant SGSCs and the progenitor cells (data not shown). Therefore, we can speculate that activation of autophagy to simulate SGSCs self-renewal does not involve mitochondrial clearance, but further studies are required to determine whether autophagy induction upon SGSCs activation encompasses a selective type of autophagy, mitophagy or another one.
Interestingly, the self-renewal mechanism of skeletal MSCs is regulated by the Notch signaling pathway [Citation44]. A mechanism depending on the SOX2 transcription factor seems to be important for SGs regeneration [Citation34]. In cardiomyocytes as well as other tissues, the Hippo/YAP signaling pathway appears to be an important regulator of regeneration and plasticity [Citation45–47]. All these signaling cascades have been previously reported to be regulated by autophagy [Citation47–49]. As a result, one could imagine that the main role of basal autophagy in SGSCs is to regulate these signaling pathways by selectively degrade one or more of their components. Future studies will need to examine whether autophagy regulates specific signaling pathways for SGSCs self-renewal and tissue regeneration in vivo.
Upon radiation treatment for head and neck cancer, the off-target effects of this therapy lead to the damage of saliva producing SGs cells, which in turn results in a lifetime of hyposalivation and co-morbidities. Various systemic diseases such as Sjorgen’s syndrome, graft-versus-host disease, HIV infection, may result in irreversible SGs hypofunction and xerostomia as well [Citation50]. Reacquisition of SGs function in these patients principally depends on the regeneration by SGs ductal compartment resident SGSCs as well as by transplantation of autologous adult SGSCs [Citation18,Citation34]. Previously, Morgan-Bathke and colleagues studied the contribution of autophagy in the development of SGs using atg5f/f;Aqp5-Cre mice model, which results in animals with autophagy-deficient acinar cells [Citation51]. SGs of these mice have normal morphology but acinar cells fail to recover after a 5 Gy dose of head-neck irradiation in the absence of autophagy [Citation52]. Interestingly, IGF1 treatment prior to radiation decreased tissue and function loss, and this beneficial effect depends on autophagy induction, which appears to principally take places in the ducts [Citation52]. These results are consistent with our model that autophagy stimulation in SGSCs concentrating at the ducts is crucial for SGs regeneration. Weng and colleagues have previously shown that mouse duct cells can generate acinar cells upon loss of part of the SGs by radiation [Citation18]. Moreover, we observed in rat and human models that ablation using radiation of the caudal part of parotid SGs, induces regeneration involving the ductal regions in the cranial part of the gland [Citation53]. Our in vivo regeneration model, which also ablates the caudal part of SG by suture, supports this finding and adds that the autophagic flux is increased in ductal regions during regeneration after severe injury. However, future studies are needed to translate our results in a clinical setting of patients being treated for head-neck cancer through radiation. Tissue-resident stem cells cultured in the laboratory, as they are capable of self-renewal and differentiate into adult tissues, represent an important approach aiming at future autologous cell transplantation therapies to avoid potential immune reaction [Citation1]. Thus, fundamental knowledge on the role of autophagy in stem cell self-renewal capacity may offer new perspectives on fine-tuning approaches for regenerative medicine. Here, we show that autophagy induction using Tat-BECN1 contributes to an increase in efficiency of mouse and possibly human SGSCs self-renewal through autophagy induction, which may present an important target for therapy. Future studies are required to validate the therapeutic potential of Tat-BECN1 peptide in SGSCs but also other tissue-resident stem cells, as well as other currently available autophagy enhancers such as trehalose, spermidine or resveratrol [Citation54,Citation55].
Our study highlights that autophagy is a key regulatory pathway for SGs self-renewal and more in general for slowly self-renewing tissues. Our 3D culture model offers the unique experimental setup to dissect the precise role of autophagy in this process and decipher both its precise physiological relevance in self-renewal and the regulatory connections. This knowledge could be relevant to develop efficient stem cell therapies that are based on autophagy modulation.
Material and methods
SGs isolation from mice and culture
C57BL/6 mice were purchased from Envigo and housed in environmentally controlled rooms, conventional conditions and fed ad libitum in the Animal Facility of the University Medical Center Groningen. All experiments were performed according to approved institutional animal care and use committee (IACUC) protocols of the University of Groningen (under IVD protocol number 184,824–01-001). C57BL/6 mice were purchased from Envigo and housed in environmentally controlled rooms, conventional conditions and fed ad libitum in the Animal Facility of the University Medical Center Groningen and the CIB animal facility. Atg5+/- mice [Citation56] were kindly provided by Prof. Noboru Mizushima (Department of Biochemistry and Molecular Biology, Graduate School and Faculty of Medicine, The University of Tokyo). All experiments were performed according to approved institutional animal care and use committee (IACUC) protocols of the University of Groningen (under IVD protocol number 184824–01-001) and the Comunidad de Madrid under the approved protocol (PROEX227/16). Both male and female animals were used in this study. Mice were reared in a barrier‐controlled facility (20°C; 12‐h light/dark cycle) with ad libitum access to food and water. For the maintenance of the colony and obtaining the embryos for the experiments, heterozygous females (Atg5+/-) have been crossed with heterozygous males (Atg5+/-), in this way, we guaranteed the obtaining of both atg5−/- embryos and Atg5+/+ as its direct controls. Animals were crossed and the morning on which the vaginal plug was detected was designated embryonic day (E) 0.5. Animals were euthanized by cervical dislocation and embryos removed by cesarean section. The embryos were staged and then placed in a Petri dish in 1× phosphate‐buffered saline (PBS; ThermoFisher Scientific, 70011044).
Adult submandibular SGs were isolated from 6- to 8-weeks old female C57BL/6 mice, as previously described [Citation25]. The collected SGs were subjected to mechanical disruption using a gentleMACS dissociator (Miltenyi Biotec), followed by enzymatic digestion in Hanks’ Balanced Salt Solution (HBSS; ThermoFisher Scientific, 14175–129) containing 1% BSA (ThermoFisher Scientific, 15260037), 0.63 mg/m collagenase II (ThermoFisher Scientific, 17101–015), 0.5 mg/ml hyaluronidase (Sigma Aldrich, H3506) and 50 mM CaCl2 at 37°C for 30 min. After the digestion, the samples were subjected to centrifugation at 400 g for 5 min and washed with HBSS containing 1% BSA, before a second digestion using the same conditions as above. For a primary culture, the two submandibular SGs from a single mouse were digested in a 2-ml volume. The digested material was filtered through a 100-µm cell strainer (BD Biosciences) and then re-suspended in the minimal medium (MM): 1x Dulbecco’s modified Eagle’s:F12 medium (11320–074) containing Pen/Strep antibiotics (ThermoFisher Scientific, 15140122), 1x Glutamax (ThermoFisher Scientific, 35050061), 20 ng/ml EGF (epidermal growth factor; Sigma Aldrich, E9644), 20 ng/ml FGF2 (fibroblast growth factor 2; Preprotech-Bioconnect, 100–1813), 1x N-2 Supplement (Gibco, 17502–048), 10 mg/ml insulin (Sigma Aldrich, I6634-100 mg) and 1 mM dexamethasone (Sigma Aldrich, d4902-25 mg) [Citation27], and plated at a density of 400,000 cells per well in a 12-well plate (Sigma Aldrich, CLS3513-50EA). The primary culture was maintained for 3 days at 37°C in a 5% CO2 incubator before proceeding to the self-renewal assay.
For the embryonic SGs isolation, the sacrificed embryos (E18.5) were kept in HBSS containing 1% BSA at 4°C before dissection of the SGs on ice. From each embryo, one of the SGs was placed in a 6-well plate with 1 ml of HBSS containing 1% BSA, while the other was directly immersed in 4% formaldehyde (Merck, 1.04003.100) in PBS to proceed with the embedding for histochemistry experiments. The isolated SGs in the 6-well plates were subjected to mechanical digestion through numerous successive aspirations by pipetting during the enzymatic digestion in the solution described above, at 37°C for 5 min. After this treatment, samples were subjected to centrifugation at 400 g for 5 min and washed with HBSS containing 1% BSA. Samples were finally resuspended in the 75 µl of appropriate media, MM or WRY (MM supplemented with 10% R-spondin conditioned media (a kind gift from Hans Clevers, Hubrecht Institute, Utrecht, the Netherlands) and 50% Wnt3a conditioned media (a kind gift from Hans Clevers, Hubrecht Institute, Utrecht, the Netherlands) and mixed with 150 µl of Matrigel® (VWR, 356235), before splitting them in 3 aliquots of 75 µl, each one of them placed in a different well of a 12-well plate. These primary cultures were maintained at 37°C in a 5% CO2 incubator for 7 days, before dispersing them in single cells for the self-renewal assay.
Human SGs
Human nonmalignant submandibular SGs tissues were obtained from donors after informed consent and Institutional Review Board (IRB) approval, during an elective head and neck dissection procedure for the removal of squamous cell carcinoma from the oral cavity. Surgical removals were performed at the University Medical Center Groningen and the Medical Center Leeuwarden. For the isolation of human SGSCs; the biopsies collected in the operating room were transferred to the lab in a 50 mL falcon tube containing HBSS 1% BSA on ice. The biopsy was weighted in a sterile petri dish and using a sterile disposable scalpel minced into small pieces. To obtain optimal digestion 20 mg of tissue was processed per 1 mL of enzymatic digestion buffer (see above) volume, with a maximum of 100 mg of tissue per tube. The human biopsies were then processed in the same manner as the mouse tissue.
Self-renewal assay
Three days old primary SGs cultures were treated with 1 ml of 0.05% trypsin-EDTA (ThermoFisher Scientific, 25300–096) at 37°C for 10–15 min, to generate single cell suspensions and counted to be adjusted to a concentration of 2 × 10⁵ cells/ml per well. Then, 25 µl of each cell suspension was combined with 50 µl of Matrigel® on ice before to be deposited at the center of a well in a 12-well culture plate. After solidification at 37°C for 30 min, the gels were covered with medium, either MM or WRY. Seven days after seeding, the Matrigel® was dissolved by incubation with 1 mg/ml of Dispase (Invitrogen, 17105–041) at 37°C for 45–60 min. Organoids released from the gels were either counted or processed into single cell suspensions by treating them with 0.05% trypsin-EDTA at 37°C for 5–10 min. The cell suspensions are quantified for the concentration of 2 × 10⁵ cells/ml per well and the seeding procedure in Matrigel® was repeated. This cycle was repeated up to five times, i.e., 5 passages.
At each passage, the self-renewal capacity was determined as established previously [Citation26]. Briefly, the number of organoids was quantified with a brightfield microscope in each well and the percentage of organoid formation efficiency (OFE) and population doubling was calculated in the following way:
Mouse submandibular SGs ligation
The in vivo injury mouse model for SGs is being described and validated in detail in a manuscript that is in preparation. Briefly, C57BL6 mice were anesthetize with isoflurane before making a small incision in the neck to access the submandibular SGs. Each submandibular SGs was ligated with the use of a non-dissolvable wire, just below the sublingual gland. Suturing of the SGs leads to the appearance of a caudal and a cranial region over time, which can be clearly distinguished morphologically or using the hematoxylin and eosin (H&E) staining, which colors the nuclei and the cytoplasm in histological preparations. The caudal region of the suture results from the loosing of the acinar structures and tissue atrophy, while the cranial region corresponds to the part of the SGs that is regenerating, which also present intact acinar and ductal structures. Five, 9 or 15 days later, the animals were re-anaesthetized and sacrificed by cervical dislocation. The suture was removed, and submandibular SGs were harvested and fixed in 4% formaldehyde overnight at room temperature. Sections were used for immunofluorescence (as described below). Control mice with matching sex and age were subjected to a mock ligation surgery that included isoflurane anesthesia, exposure of the submandibular gland and suture of the incision. To estimate the autophagic flux upon SGs ligation, the experiment was also repeated in animals treated or not with HCQ as follow. HCQ (50 mg/kg) or a saline solution (for the control mice) was administered daily by intraperitoneal injections until sacrifice of the animals 5, 9 or 15 days SGs post-ligation. The sacrifice of the animals and the post-sacrifice treatment of the tissues were done as mentioned above.
To assess cell proliferation in the ligated submandibular SGs as well as in the control SGs, mice were subjected to two intraperitoneal bromodeoxyuridine (BrdU, Sigma Aldrich, B5002-1 G) injections. BrdU was dissolved in physiologic solution at a concentration of 50 mg/Kg of body weight and injected respectively 24 h and 6 h prior sacrifice. Following BrdU labeling, immunofluorescence and quantification was performed as described below.
Antibodies and other reagents
Primary antibodies for western blot were against LC3 (Novus Biologicals, NB600), SQSTM1 (Abcam, ab56416), ATG13 (Sigma Aldrich, SAB4200100) and ACTIN (EMD Millipore, MAB1501). Primary antibodies used for immunofluorescence and immunocytochemistry were against LC3 (MBL, PM036), SQSTM1 (Progen, GP62-C), ATG16L1 (Abgent, AP1817b), AQP5 (Alomone labs, AQP5-005) and BrdU (Bio-Rad, MCA2483GA). Fluorescently-labeled antibodies for FACS sorting were against PECAM1/CD31 (PECAM1/CD31-PE; eBioscience, 12–0311-82), PTPRC/CD45 (PTPRC/CD45-PE, Biolegend, 103106), LY76/TER119 (LY76/TER119-PE/Cy7; Biolegend, 116222), CD24 (CD24-Pacific Blue, Biolegend, 101820) and ITGB1/CD29 (ITGB1/CD29-FITC, BD Biosciences, 555005). The following secondary antibodies from ThermoFisher Scientific were used for the visualization of the primary antibodies: Alexa Fluor 488-conjugated goat anti-mouse (A-11001), Alexa Fluor 568-conjugated goat anti-mouse (A-11031) or goat anti-rabbit (A-11011), Alexa Fluor 647-conjugated goat anti-mouse (A-21235), and Alexa Fluor 568 conjugated goat anti-Guinea pig (A-11075).
Hoechst 33342 was from Sigma Aldrich (B2261), Chloroquine (C6628) was from Sigma Aldrich and bafilomycin A1 was from BioAustralis (BIA-B1012). Tat-beclin 1 was from Selleck Chemicals (S8595), while propidium iodide was from Sigma Aldrich (P4170).
siRNA transfection of SGSCs
Mouse SGs derived-cells were transfected with 20 pmol of silencing RNAs (siRNAs) against ATG13 (ON-TARGET plus D-053540) and scrambled (D-001810-01-05), all from Dharmacon. Briefly, single cells were seeded at a density of 1 to 1.5 × 10⁵ in a 12-well plate containing MM medium and the transfection was done using Lipofectamine RNAiMAX (ThermoFisher Scientific, 3778150). Five h post-transfection, the medium was replaced with MM medium and cells were incubated at 37°C in 5% CO2 for an additional 24 h. Then, a second round of transfection was performed as above and 24 h post-transfection, cells were counted, resuspended in MM medium at a density of 0.8 × 10⁶ cells/ml and seeded in Matrigel®. Cells were harvested 48 h after the first transfection to check the knockdown efficiency of ATG13 by western blot. Moreover, organoids and cells were counted to establish the OFE% at the end of the passage.
Stainings for immunofluorescence and immunohistochemistry analyses
For immunofluorescence staining, cells or organoids were blocked with a solution composed of 0.2% powdered milk (Nutricia, 8712400763004), 2% fetal calf serum (Greiner Bio-One, 758093), 0.1 M glycine, 1% BSA and 0.01% Triton X-100 (Sigma-Aldrich, 93443), for 30 min at room temperature. Subsequently, they were incubated with the primary antibody in 0.1% BSA in PBS for 1 h at room temperature, washed once with PBS and incubated with the secondary antibody diluted 1:200 in 0.1% BSA in PBS for 30 min at room temperature. The preparation was finally washed with PBS and mounted with ProLong® Gold Antifade Mountant with DAPI (ThermoFisher Scientific, P36931).
For immunohistological staining of tissues, entire SGs were fixed in 4% formaldehyde at room temperature for 24 h and embedded in paraffin wax (VWR, VWRK2079-A). Briefly, SGs were dehydrated using a solution with increasing amounts of ethanol before to be embedded in paraffin and processed into 5-µm sections. The sections were then dewaxed, boiled for 8 min in pre-heated 10 mM citric acid retrieval buffer (pH 6.0) containing either 0.05% Tween 20 (Sigma-Aldrich, 93773–250G) and washed with 1X PBS. Samples were then incubated with 100 mM glycine at room temperature for 15 min, washed once with PBS and blocked with serum of the used secondary antibody diluted 1:200 in 0.04% Triton X-100 in PBS for permeabilization. Subsequently, samples were incubated with the primary antibody diluted in 0.1% Tween 20 in PBS overnight at 4°C, washed once with PBS and incubated for 1 h at room temperature with the secondary antibody in 0.1% Tween 20 in PBS containing 1:100 Hoechst. Preparations were finally mounted with 80% glycerol in PBS and imaged. For BrdU staining, an additional denaturation step was applied after the permeabilization step with 0.04% Triton X-100 in PBS, by incubating the sections in 2.5 M HCl for 20 min as well as a quenching step for the endogenous peroxide activity prior to the staining with the secondary antibody with 0.5% H2O2 for 30 min.
Image acquisition and analysis
Immunohistochemical and immunofluorescence preparations were examined by fluorescence microscopy. Fluorescent signals were collected with a DeltaVision Elite fluorescence microscope (Applied Precision Ltd.) equipped with a CoolSNAP HQ camera (Photometrics). Images were generated by collecting a stack of 20–30 pictures with focal planes 0.20 µm apart using either 60x or 100x objectives, and successive deconvolution using the SoftWoRx software (Applied Precision Ltd.). The quantification of LC3, SQSTM1 or ATG16L1 puncta and BrdU positive nuclei was carried out using the ICY software, while image processing was done using the ImageJ/Fiji software.
Flow cytometry sorting and analyses
For FACS-based cell sorting, after isolation and digestion (see above), SGs were dissociated in 0.05% trypsin-EDTA at 37°C for 10 min and concentrated by passage through a 35 µm strainer. The resulting cell pellets were subsequently incubated with fluorescent-conjugated antibodies (i.e., PECAM1-PE, PTPRC-PE, LY76, ITGB1-FITC and CD24-PB) in 0.2% BSA in PBS for 15 min at room temperature, washed with 0.02% BSA in PBS and centrifuged at 0.4 g for 5 min. Cell pellets were then resuspended in a solution of 1 mg/ml of propidium iodide (Sigma-Aldrich, P4170), 10 mM MgSO4 and 50 µg/ml of RNase A (Invitrogen, 8003088), 0.2% BSA in PBS. The PECAM1-PE, PTPRC-PE and LY76 were gated to eliminate blood cells from SGs-derived cells, while propidium iodide staining was used to discard dead cells. ITGB1-FITC- and CD24-PB-positive cells were gated to sort them for further analysis [Citation27]. FACS-based sorting was carried out using a MoFlo XDP Cell Sorter (Beckman Coulter).
SGSCs differentiation into organoids
Matrigel® was diluted 1:1 with ice-cold medium on ice, poured in 96-well plates and incubated at 37°C for 30 min to coat them. Single cell-derived organoids from the self-renewal assay were collected and quantified to prepare organoid suspensions, which were in a ratio of 25 µl of media containing 20–30 organoids and 50 µl of Matrigel® per well on ice. 75 µl of the mix was seeded on each well coated with Matrigel® and then incubated at 37°C for 30 min before adding of 150 µl of MM media supplemented with 50 ng/ml of HGF (Peprotech, 100–39) and 1 µM DAPT (Sigma Aldrich, D5942). The organoids were cultured at 37°C in 5% CO2 for 2 weeks after which the organoids are counted by brightfield microscopy and identified according to their branched morphology [Citation25].
Cell death analysis
After isolation of SGs or culture of SGSCs into organoids, single cells were obtained by dissociation in 0.05% trypsin-EDTA at 37°C for 10 min, before to be washed with 1% BSA in PBS and concentrated by passage through a 35-µm strainer and centrifugation at 0.4 g for 5 min. The resulting samples were labeled using the FITC Dead Cell Apoptosis Kit (ThermoFisher Scientific, V13242), which contains FITC-conjugated ANXA5/annexin V and propidium iodide to label apoptotic or dead cells, following the manufacturer instructions. Labeled cells were then sorted and examined with a FACS-LSR-II machine (BD Biosciences). The mean fluorescence intensity for 10,000 cells per each condition (determined in forward scatter, FSC, and size scatter, SSC, channels) was determined using the Kaluza Analysis software.
Cell division analysis
Single cells from either isolated SGs or organoids were obtained by dissociation in 0.05% trypsin-EDTA at 37°C for 10 min before to be washed with 1% BSA in PBS and concentrated by passage through a 35 µm strainer and centrifugation at 0.4 g for 5 min. The resulting samples were fixed in cold 70% ethanol for 30 min, treated with 100 µg/ml ribonuclease (Sigma Aldrich) to ensure that only the DNA is labeled by 50 µg/ml propidium iodide before DNA content quantitation using flow cytometry. Labeled cells were then analyzed with the FACS-LSR-II machine. Both the mean fluorescence intensity for 10,000 cells of each sample (determined in the forward scatter, FSC, and the size scatter, SSC, channels) and the cell count for PI intensity according to cell division phases were determined using the Kaluza Analysis software (Beckman Coulter).
Western blot analyses
Samples from self-renewal assays were dissolved from Matrigel® by incubation in 1 mg/ml of Dispase (Sigma Aldrich) at 37°C for 30 min. The dissolved organoids were then collected in ice-cold 0.2% BSA in PBS and centrifuged at 0.4 g for 5 min at 4°C. Supernatants were discarded and the pellets were frozen at −80°C. Pellets were subsequently resuspended in 50 μl of Laemmli buffer (4% sodium dodecyl sulfate, 20% glycerol, 10% β-mercaptoethanol, 0.002% bromophenol blue, 0.125 M Tris-HCl, pH 6.8) and boiled at 100°C for 10 min. Equal protein amounts were separated by SDS-PAGE and after western blot, proteins were detected using specific antibodies and the Odyssey Imaging System (LI-COR Biosciences). Densitometric values were determined and quantified on western blots at non-saturating exposures using the ImageJ/Fiji software and normalized against the ACTIN loading control.
Statistical analyses
Data are presented as the mean ± standard deviation (SD) of at least three independent experiments (i.e., biological replicates). Differences between samples and conditions were analyzed using the Student’s t-test. Statistical significance was set at *p< 0.05.
Supplemental Material
Download PDF (10.4 MB)Disclosure statement
No potential conflict of interest was reported by the author(s).
Supplementary material
Supplemental data for this article can be accessed here.
Additional information
Funding
References
- Clevers H, Cells STEM. What is an adult stem cell? Science. 2015;350:1319–1320.
- Morrison SJ, Spradling AC. Stem cells and niches: mechanisms that promote stem cell maintenance throughout life. Cell. 2008;132:598–611.
- Zhou W, Choi M, Margineantu D, et al. HIF1alpha induced switch from bivalent to exclusively glycolytic metabolism during ESC-to-EpiSC/hESC transition. EMBO J. 2012;31:2103–2116.
- Kubli DA, Sussman MA. Eat, breathe, ROS: controlling stem cell fate through metabolism. Expert Rev Cardiovasc Ther. 2017;15:345–356.
- Boya P, Reggiori F, Codogno P. Emerging regulation and functions of autophagy. Nat Cell Biol. 2013;15:713–720.
- Rodolfo C, Di Bartolomeo S, Cecconi F. Autophagy in stem and progenitor cells. Cell Mol Life Sci. 2016;73:475–496.
- Kuma A, Komatsu M, Mizushima N. Autophagy-monitoring and autophagy-deficient mice. Autophagy. 2017;13:1619–1628.
- Boya P, Codogno P, Rodriguez-Muela N. Autophagy in stem cells: repair, remodelling and metabolic reprogramming. Development. 2018;145:dev146506.
- Garcia-Prat L, Martinez-Vicente M, Perdiguero E, et al. Autophagy maintains stemness by preventing senescence. Nature. 2016;529:37–42.
- Leeman DS, Hebestreit K, Ruetz T, et al. Lysosome activation clears aggregates and enhances quiescent neural stem cell activation during aging. Science. 2018;359:1277–1283.
- Liu P, Liu K, Gu H, et al. High autophagic flux guards ESC identity through coordinating autophagy machinery gene program by FOXO1. Cell Death Differ. 2017;24:1672–1680.
- Ho TT, Warr MR, Adelman ER, et al. Autophagy maintains the metabolism and function of young and old stem cells. Nature. 2017;543:205–210.
- Salemi S, Yousefi S, Constantinescu MA, et al. Autophagy is required for self-renewal and differentiation of adult human stem cells. Cell Res. 2012;22:432–435.
- Donnelly H, Salmeron-Sanchez M, Dalby MJ. Designing stem cell niches for differentiation and self-renewal. J R Soc Interface. 2018;15:20180388.
- Yin X, Mead BE, Safaee H, et al. Engineering stem cell organoids. Cell Stem Cell. 2016;18:25–38.
- Murrow LM, Weber RJ, Gartner ZJ. Dissecting the stem cell niche with organoid models: an engineering-based approach. Development. 2017;144:998–1007.
- Clevers H, Watt FM. Defining adult stem cells by function, not by phenotype. Annu Rev Biochem. 2018;87:1015–1027.
- Weng PL, Aure MH, Maruyama T, et al. Limited regeneration of adult salivary glands after severe injury involves cellular plasticity. Cell Rep. 2018;24:1464–1470.
- Luitje ME, Israel AK, Cummings MA, et al. Long-term maintenance of acinar cells in human submandibular glands after radiation therapy. Int J Radiat Oncol Biol Phys. 2021;109:1028–1039.
- Aure MH, Konieczny SF, Ovitt CE. Salivary gland homeostasis is maintained through acinar cell self-duplication. Dev Cell. 2015;33:231–237.
- Vissink A, Mitchell JB, Baum BJ, et al. Clinical management of salivary gland hypofunction and xerostomia in head-and-neck cancer patients: successes and barriers. Int J Radiat Oncol Biol Phys. 2010;78:983–991.
- Lombaert I, Movahednia MM, Adine C, et al. Concise review: salivary gland regeneration: therapeutic approaches from stem cells to tissue organoids. Stem Cells. 2017;35:97–105.
- Pringle S, Van Os R, Coppes RP. Concise review: adult salivary gland stem cells and a potential therapy for xerostomia. Stem Cells. 2013;31:613–619.
- Jensen SB, Vissink A, Limesand KH, et al. Salivary gland hypofunction and xerostomia in head and neck radiation patients. J Natl Cancer Inst Monogr. 2019;2019:lgz016.
- Pringle S, Maimets M, Van Der Zwaag M, et al. Human salivary gland stem cells functionally restore radiation damaged salivary glands. Stem Cells. 2016;34:640–652.
- Nanduri LS, Maimets M, Pringle SA, et al. Regeneration of irradiated salivary glands with stem cell marker expressing cells. Radiother Oncol. 2011;99:367–372.
- Maimets M, Rocchi C, Bron R, et al. Long-term in vitro expansion of salivary gland stem cells driven by wnt signals. Stem Cell Reports. 2016;6:150–162.
- Feng J, Van Der Zwaag M, Stokman MA, et al. Isolation and characterization of human salivary gland cells for stem cell transplantation to reduce radiation-induced hyposalivation. Radiother Oncol. 2009;92:466–471.
- Pringle S, Nanduri LS, Van Der Zwaag M, et al. Isolation of mouse salivary gland stem cells. J Vis Exp. 2011;8:2484.
- Klionsky DJ, Abdelmohsen K, Abe A, et al. Guidelines for the use and interpretation of assays for monitoring autophagy (3rd edition). Autophagy. 2016;12:1–222.
- Yang Z, Klionsky DJ. Mammalian autophagy: core molecular machinery and signaling regulation. Curr Opin Cell Biol. 2010;22:124–131.
- Emmerson E, Knox SM. Salivary gland stem cells: a review of development, regeneration and cancer. Genesis. 2018;56:e23211.
- Shoji-Kawata S, Sumpter R, Leveno M, et al. Identification of a candidate therapeutic autophagy-inducing peptide. Nature. 2013;494:201–206.
- May AJ, Cruz-Pacheco N, Emmerson E, et al. Diverse progenitor cells preserve salivary gland ductal architecture after radiation-induced damage. Development. 2018;145:dev166363.
- Kulkarni RS, Bajaj MS, Kale VP. Induction and detection of autophagy in aged hematopoietic stem cells by exposing them to microvesicles secreted by HSC-supportive mesenchymal stromal cells. Methods Mol Biol. 2019;1854:21–34.
- Kulkarni A, Dong A, Kulkarni VV, et al. Differential regulation of autophagy during metabolic stress in astrocytes and neurons. Autophagy. 2019;16:1651–1667.
- Kohli L, Passegue E. Surviving change: the metabolic journey of hematopoietic stem cells. Trends Cell Biol. 2014;24:479–487.
- Nguyen-mccarty M, Klein PS. Autophagy is a signature of a signaling network that maintains hematopoietic stem cells. PLoS One. 2017;12:e0177054.
- Jung HE, Shim YR, Oh JE, et al. The autophagy protein Atg5 plays a crucial role in the maintenance and reconstitution ability of hematopoietic stem cells. Immune Netw. 2019;19:e12.
- Regmi S, Raut PK, Pathak S, et al. Enhanced viability and function of mesenchymal stromal cell spheroids is mediated via autophagy induction. Autophagy. 2020;7. in press.
- Pennings S, Liu KJ, Qian H. The stem cell niche: interactions between stem cells and their environment. Stem Cells Int. 2018;2018:4879379.
- Esteban-Martinez L, Boya P. BNIP3L/NIX-dependent mitophagy regulates cell differentiation via metabolic reprogramming. Autophagy. 2018;14:915–917.
- Esteban-Martinez L, Sierra-Filardi E, McGreal RS, et al. Programmed mitophagy is essential for the glycolytic switch during cell differentiation. EMBO J. 2017;36:1688–1706.
- Gopinath SD, Webb AE, Brunet A, et al. FOXO3 promotes quiescence in adult muscle stem cells during the process of self-renewal. Stem Cell Reports. 2014;2:414–426.
- Cai WF, Wang L, Liu GS, et al. Manipulating the Hippo-Yap signal cascade in stem cells for heart regeneration. Ann Palliat Med. 2016;5:125–134.
- Moya IM, Halder G. Hippo-YAP/TAZ signalling in organ regeneration and regenerative medicine. Nat Rev Mol Cell Biol. 2019;20:211–226.
- Totaro A, Zhuang Q, Panciera T, et al. Cell phenotypic plasticity requires autophagic flux driven by YAP/TAZ mechanotransduction. Proc Natl Acad Sci U S A. 2019;116:17848–17857.
- Wu X, Fleming A, Ricketts T, et al. Autophagy regulates Notch degradation and modulates stem cell development and neurogenesis. Nat Commun. 2016;7:10533.
- Wang S, Xia P, Ye B, et al. Transient activation of autophagy via Sox2-mediated suppression of mTOR is an important early step in reprogramming to pluripotency. Cell Stem Cell. 2013;13:617–625.
- Von Bultzingslowen I, Sollecito TP, Fox PC, et al. Salivary dysfunction associated with systemic diseases: systematic review and clinical management recommendations. Oral Surg Oral Med Oral Pathol Oral Radiol Endod. 2007 Mar;103(Suppl):S57 e1–15.
- Morgan-Bathke M, Lin HH, Chibly AM, et al. Deletion of ATG5 shows a role of autophagy in salivary homeostatic control. J Dent Res. 2013;92:911–917.
- Morgan-Bathke M, Hill GA, Harris ZI, et al. Autophagy correlates with maintenance of salivary gland function following radiation. Sci Rep. 2014;4:5206.
- Van Luijk P, Pringle S, Deasy JO, et al. Sparing the region of the salivary gland containing stem cells preserves saliva production after radiotherapy for head and neck cancer. Sci Transl Med. 2015;7:305ra147.
- Thellung S, Corsaro A, Nizzari M, et al. Autophagy activator drugs: a new opportunity in neuroprotection from misfolded protein toxicity. Int J Mol Sci. 2019 Feb 19;20:901.
- Towers CG, Thorburn A. Therapeutic targeting of autophagy. EBioMedicine. 2016;14:15–23.
- Kuma A, Hatano M, Matsui M, et al. The role of autophagy during the early neonatal starvation period. Nature. 2004;432:1032–1036.