
ABSTRACT
S-adenosyl-l-homocysteine (SAH), an amino acid derivative, is a key intermediate metabolite in methionine metabolism, which is normally considered as a harmful by-product and hydrolyzed quickly once formed. AHCY (adenosylhomocysteinase) converts SAH into homocysteine and adenosine. There are two other members in the AHCY family, AHCYL1 (adenosylhomocysteinase like 1) and AHCYL2 (adenosylhomocysteinase like 2). Here we define AHCYL1 function as a SAH sensor to inhibit macroautophagy/autophagy through PIK3C3. The C terminus of AHCYL1 interacts with SAH specifically and the interaction with SAH promotes the binding of the N terminus to the catalytic domain of PIK3C3, resulting in inhibition of PIK3C3. More importantly, this observation was further validated in vivo, indicating that SAH functions as a signaling molecule. Our study uncovers a new axis of SAH-AHCYL1-PIK3C3, which senses the intracellular level of SAH to inhibit autophagy in an MTORC1-independent manner.
Abbreviations: ADOX: adenosine dialdehyde; AHCY: adenosylhomocysteinase; AHCYL1: adenosylhomocysteinase like 1; cLEU: cycloleucine; PIK3C3: phosphatidylinositol 3-kinase catalytic subunit type 3; PtdIns3P: phosphatidylinositol-3-phosphate; SAH: S-adenosyl-l-homocysteine; SAM: S-adenosyl-l-methionine.
Introduction
S-adenosyl-l-homocysteine (SAH) is formed by the demethylation of S-adenosyl-l-methionine (SAM). As the major methyl donor in cells, SAM is involved in numerous methyl group transfer reactions to various substrates such as nucleic acids, proteins, lipids and secondary metabolites [Citation1]. Because the structures of SAH and SAM are very similar, SAH is a strong feedback inhibitor of SAM-dependent methyltransferases [Citation2]. Currently, besides metabolic intermediate, no other function of SAH is reported. There is only one enzyme catalyzing the hydrolysis of SAH, AHCY (adenosylhomocysteinase), which converts SAH into homocysteine and adenosine [Citation3]. In the following reactions, homocysteine can be remethylated to methionine by methionine synthase with vitamin B12 or by betaine-homocysteine methyltransferase with glycine betaine, as part of the methionine cycle. Adenosine dialdehyde (ADOX), an inhibitor of AHCY, is widely used as an indirect inhibitor of methyltransferase reactions, due to the accumulated SAH by AHCY inhibition [Citation4]. Besides AHCY, there are two other members in the AHCY family, AHCYL1 (adenosylhomocysteinase like 1) and AHCYL2 (adenosylhomocysteinase like 2) [Citation5]. Both contain an unstructured N terminus and an AHCY-like domain. The AHCY-like domain of AHCYL1 and AHCYL2 is highly conserved with AHCY, sharing over 50% of identical amino acids, but shows no activity to hydrolyze SAH [Citation6].
The nutrients surrounding cells provide metabolites for the energy production and biomass formation to support all the biological processes of cells. In cells, sensing and coordinating utilization of nutrients are the keys to maintain the metabolic homeostasis. Both AMPK and MTORC1 are well-established nutrient sensors that sense glucose and amino acids [Citation7,Citation8]. The two pathways adjust metabolic and non-metabolic processes, including energy production, protein synthesis and autophagic processes to maintain cell survival under nutrient starvation. Besides common nutrients for cells, various cellular intermediate metabolites sensing has drawn increasing attention. For instance, the discovery of the oncometabolite 2-hydroxyglutarate (2-HG), production of mutant IDH1 (isocitrate dehydrogenase (NADP(+)) 1) or IDH2, has proved that the alterations of cellular α-ketoglutarate (α-KG) to 2-HG change the methylation status of genome-wide histone and DNA [Citation9].
Recent research discovered that MTOR senses SAM to signal methionine sufficiency through BMT2/SAMTOR [Citation10]. The data showed that SAM depletion inhibits MTOR signaling, as measured by the decreased phosphorylation of RPS6KB1/p70S6K and EIF4EBP1/4E-BP1, indicating inhibition of mRNA translation [Citation11]. Autophagy is another downstream event of MTOR, which recycles cellular components and directly supports cells under nutrient deprivation conditions [Citation12]. With sufficient nutrient, high MTOR activity phosphorylates ULK1 at Ser757 to prevent ULK1 activation [Citation13]. Following MTOR inhibition, the activated ULK1 phosphorylates BECN1 at Ser14 and ATG14 at Ser29 to enhance the activity of PIK3C3 lipid kinase [Citation14,Citation15]. PIK3C3 is the only class III phosphatidylinositol (PtdIns) 3-kinase in all eukaryotic cells, producing PtdIns-3-phosphate (PtdIns3P) by phosphorylating PtdIns [Citation16,Citation17]. The synthesis of PtdIns3P is required for promoting autophagy in all organisms [Citation18]. Therefore, we postulated that decreased SAM in cells promotes autophagy through the MTOR-ULK1-PIK3C3 pathway and wondered whether SAH regulates autophagy through the same pathway. To explore the effect of SAH on autophagy and the underlying mechanism, we initiate this study and uncover that AHCYL1 functions as a sensor of SAH, and the SAH-AHCYL1-PIK3C3 axis inhibits autophagy in an MTORC1-independent manner. This study heralds that SAH may regulate many cellular processes through different binding partners of AHCYL1 and AHCYL2, elucidating the critical role of metabolite sensing.
Results
SAH inhibits autophagy in an MTORC1-independent manner
Both SAM and SAH are not cell membrane permeable, so it is difficult to manipulate cellular levels of SAM or SAH directly through addition of SAM or SAH in the culture media [Citation19]. To explore the effect of SAM and SAH on autophagy, we employed the human bone osteosarcoma cell line U-2 OS cells, which is widely used for autophagy research, and manipulated levels of SAM and SAH indirectly with cycloleucine (cLEU), an inhibitor of MAT/S-adenosylmethionine synthetase (methionine adenosyltransferase), or ADOX () [Citation4,Citation20–23]. In term of the ADOX treatment, longer treatment of ADOX results in inhibiting global methylation in cells, which may affect autophagy in other indirect manners. Thus, we designed the experiment with ADOX treatment for a shorter time as 6 h but not 24 h. As expected, cLEU decreased SAM and ADOX increased SAH level (). The cLEU treatment led to the decrease of intracellular SAM level, around 50%, consistent with previous report [Citation24]. ADOX increased SAH level more than ten folds (from less than 1 μM to over 10 μM), suggesting that the hydrolysis of SAH by AHCY is very active to maintain low SAH level under normal condition. ADOX also increased SAM level, even when combined with cLEU treatment, due to the inhibition of SAM-dependent methyltransferases by accumulated SAH (). SAM depletion by cLEU inhibited MTORC1, indicated by decreased phosphorylation of ULK1, RPS6KB1, and EIF4EBP1 as reported, along with increased LC3-II and decreased LC3-I () [Citation10]. Accumulated SAH by ADOX associated with increased LC3-I and decreased LC3-II, which was opposite with autophagy activation by SAM depletion, but did not change levels of p-ULK1 (). The decreased LC3-II may result from inhibition of autophagy initiation or accelerated degradation. Chloroquine (CQ) was also used to monitor the autophagy flux. In the CQ group, ADOX treatment also led to increased LC3-I and decreased LC3-II with or without cLEU, suggesting autophagy inhibition by SAH. The accumulated SAH inhibits global methylation in cells, which disturbs many processes. It is reported that inhibition of AHCY induces cycle arrest and DNA damage [Citation25]. We observed the growth inhibition when treating U-2 OS cells with ADOX for a longer time (Fig. S1A). The combined treatment of cLEU and ADOX resulted in increased SAM and SAH levels, but the p-ULK1 was still low, indicating that the increased SAM by accumulated SAH at 6 h did not last for enough time to activate MTORC1 and elevate p-ULK1. Such data was consistent with the effects we observed at 6 h, which were mainly from SAH but not SAM ().
Figure 1. SAH inhibits autophagy in an MTORC1-independent manner. (A) A schematic map of methionine cycle. (B) ADOX increases SAH and SAM levels while cycloleucine decreases SAM levels. U-2 OS cells were treated as indicated and cellular SAM and SAH levels were analyzed by HPLC. (C) ADOX decreases LC3-II and increases LC3-I. U-2 OS cells were treated and total cell lysates were blotted as indicated. ACTB was used as loading control to quantify changes in both LC3-I and LC3-II levels. (D-F) ADOX increases LC3-I and decreases LC3-II with or without Torin 1 and CQ treatment in U-2 OS (D), MEF (E) and WI-38 (F) cells. (G) and (H) KD-AHCY decreases LC3 puncta. In general, cells were treated with 50 μM ADOX for 6 h; 0.2 μM Torin 1 for 6 h; 20 mM of cycloleucine for 24 h; 50 μM CQ for 6 h, followed by western blot analysis. Bars and error bars represent mean values and SDs, respectively. The Two-way ANOVA was used for B and the unpaired two-tailed t-test was used for H. ns represents no significance, defined as P > 0.05. N = 3 in B. N = 5 in H.
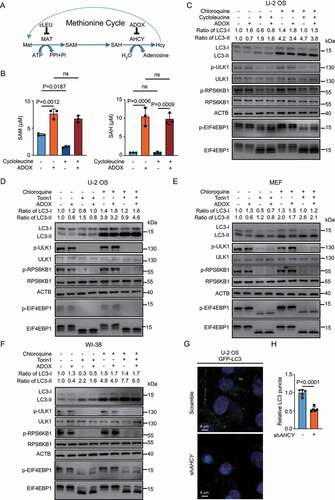
To avoid such complication and further confirm how SAH affects autophagy and whether it is regulated by MTORC1, we treated U-2 OS cells with ADOX and Torin 1, a classic MTOR inhibitor in the following assays [Citation26]. When treating U-2 OS cells with Torin 1 and CQ for different time points, the changes of LC3-II and SQSTM1/p62 were correlated with the duration (Fig. S1B). The differences of LC3-II or SQSTM1 between Torin 1 + CQ treatment and CQ treatment stand for the accelerated degradation induced by autophagy activation. At 6 h, the differences were much less, comparing with 12 h and 24 h, showing that the accelerated degradation was not fully activated. The data indicated that during the first 6 h, Torin 1 treatment mainly activates autophagy initiation, including lipidation of LC3 and colocalization of SQSTM1 and LC3. The data also suggested that the autophagy inhibition by SAH would involve in the early step of autophagosome formation.
Based on the optimized treatment time for ADOX, the treatments of Torin 1 and CQ were limited to 6 h. ADOX antagonized autophagy activation by MTOR inhibition, without alerting p-ULK1 (). When combined with CQ treatment, ADOX still decreased LC3-II, confirming that the decreased LC3-II by ADOX resulted from inhibition of autophagy initiation, but not accelerated degradation of LC3-II. Notably, the qPCR of LC3 showed that ADOX did not alert the mRNA of LC3, supporting that ADOX increased LC3-I by inhibition of LC3-II formation (Fig. S1C). The similar results were found in other cell lines, including MEF (mouse embryonic fibroblast) and WI-38 (normal human fetal lung fibroblast) (, , S1D and S1E). When treating cells with rapamycin, another inhibitor for MTOR, the similar results were observed (Fig. S1F, S1G and S1H).
To further confirm the effect of SAH on autophagy, inducible shAHCY U-2 OS cell pools were generated. Knocking down AHCY significantly shifted LC3-II to LC3-I (Fig. S2A), and increased the intracellular SAM and SAH as well (Fig. S2B), leading to less GFP-LC3 puncta (, ). Collectively, SAH inhibits autophagy in an MTORC1-independent manner.
AHCYL1 senses SAH and mediates autophagy inhibition by SAH
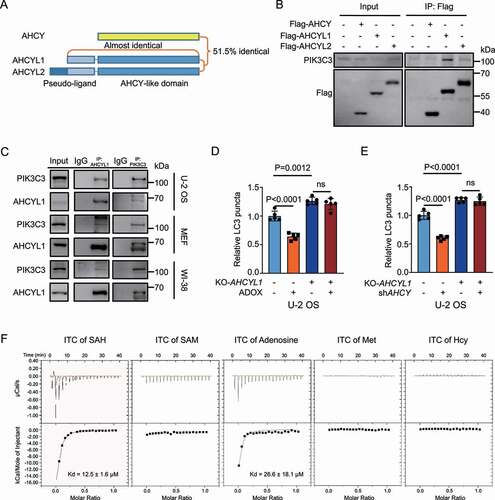
SAH prevents the formation of LC3-II from LC3-I, without alerting p-ULK1, suggesting that SAH inhibits autophagosome initiation and targets downstream of ULK1. We found that no direct linkage between SAH and autophagy has been reported. Then we hypothesized that a SAH sensor, would sense SAH to inhibit autophagy. As we know, both AHCYL1 and AHCYL2 contain an unstructured N terminus and a highly conserved AHCY-like domain, providing the structure for potential candidates of SAH sensor () [Citation5]. Through literature reading, PIK3C3 was listed as an interaction partner of AHCYL1 in a mass spectrometry analysis [Citation27]. Firstly, we confirmed the interaction between AHCYL1 and PIK3C3 (). Interestingly, the interaction between AHCY and PIK3C3 was undetectable, however, both AHCYL1 and AHCYL2 interacted with PIK3C3. Notably, the interaction between AHCYL1 and PIK3C3 was much stronger than AHCYL2. More importantly, the endogenous interaction between AHCYL1 and PIK3C3 was confirmed by forward and reverse directions in U-2 OS, MEF and WI-38 cells (). Thus, we hypothesized that AHCYL1 and PIK3C3 complex functions as a bridge from SAH to autophagy. Then, we generated KO-AHCYL1 cells (Fig. S3A) and found that KO-AHCYL1 significantly enhanced autophagy and abolished the autophagy inhibition by ADOX (, S3B, and S3C). A similar result was observed when combining KO-AHCYL1 and KD-AHCY (, S3D, and S3E). Predictably, the AHCY-like domain at the C terminus of AHCYL1 may interact with SAH or analogs of SAH. The isothermal titration calorimetry (ITC) assay shows that AHCYL1 interacted with SAH (Kd = 12.5 ± 1.6 μM), which was around the physical concentration of SAH (). Comparing with SAH, the affinities of SAM and adenosine were very weak, and methionine (Met) and homocysteine (Hcy) were completely negative in binding (). Collectively, the results demonstrated that AHCYL1 specifically interacts with SAH.
Figure 2. AHCYL1 senses SAH and mediates autophagy inhibition by SAH. (A) A schematic map of AHCY, AHCYL1 and AHCYL2. (B) Exogenous AHCYL1 readily binds with endogenous PIK3C3. Flag-AHCY, Flag-AHCYL1 and Flag-AHCYL2 were expressed in 293 T cells for Co-IP analysis. (C) Endogenous AHCYL1 interacts with endogenous PIK3C3 in U-2 OS, MEF and WI-38 Cells. (D) and (E) AHCYL1 is required for autophagy inhibition by SAH accumulation. In U-2 OS cells, KO-AHCYL1 increased LC3 puncta. ADOX decreased LC3 puncta and KO-AHCYL1 abolished the effect by ADOX. KD-AHCY showed similar results. (F) Demonstration of interactions between AHCYL1 and SAH, SAM, adenosine, Met, or Hcy by ITC. Bars and error bars represent mean values and SDs, respectively. The Two-way ANOVA was used for D and E. ns represents no significance, defined as P > 0.05. N = 5 in D and E.
SAH promotes AHCYL1 to bind PIK3C3
Next, we were curious whether SAH-AHCYL1 regulates autophagy through PIK3C3. To this end, we knocked down PIK3C3 (Fig. S4A) and found KD-PIK3C3 significantly suppressed KO-AHCYL1-induced autophagy, indicating that AHCYL1 is upstream of PIK3C3 (, S4B and S4C). The accumulated SAH suppresses autophagy, then we hypothesized that the interaction between AHCYL1 and PIK3C3 is regulated by SAH. We used co-immunoprecipitation (Co-IP) assays to detect the interaction between over-expressed Flag-AHCYL1 and endogenous PIK3C3 with different levels of SAH. The metabolites were added into the cell lysate for Flag IP, and SAH enhanced the interaction between AHCYL1 and PIK3C3 in a dose-dependent manner while SAM slightly increased the interaction (). The results fit the Kd of SAH measured by ITC. According to the SAH binding sites in AHCY, we predicted T155, Q157, N178 and D229 of AHCYL1 are important binding sites for SAH, T155 and Q157 for the adenosine, and N178 and D229 for the homocysteine tail respectively ()[Citation28]. The molecular docking obtained by AutoDock predicted that the adenosine of SAH interacts with T155 and Q157 ()[Citation29]. Indeed, the T155A Q157A mutant but not the N178A D229A mutant abolished the enhanced interaction by SAH (). The results were also consistent with the weak affinities of AHCYL1 for SAM and adenosine, and the negative binding for homocysteine and methionine.
Figure 3. SAH promotes the interaction between the N terminus of AHCYL1 and PIK3C3. (A) KD-PIK3C3 abolishes the enhanced autophagy by KO-AHCYL1 in U-2 OS. (B) SAH enhances the interaction between AHCYL1 and PIK3C3 in a dose-dependent manner. Flag-AHCYL1 was expressed in 293 T cells. Metabolites were added into the harvested cell lysate, followed by Co-IP for western blot analysis as indicated. (C) Alignment between AHCY and AHCYL1 predicts binding sites for SAH. (D) Molecular docking shows T155 and Q157 of the AHCY-like domain at the C terminus of AHCYL1 bind with the adenosine of SAH, based on 3MTG (RSCB protein data bank, https://www.rcsb.org/). (E) The T155A Q157A mutant abolishes the enhanced interaction of AHCYL1 and PIK3C3 by SAH. AHCYL1N178A D229A and AHCYL1T155A Q157A were transfected into 293 T cells, SAH were added into the harvested cell lysate, followed by Co-IP for western blot analysis as indicated. (F) SAH enhances the endogenous interaction between AHCYL1 and PIK3C3. U-2 OS cells were treated with ADOX to accumulate intracellular SAH, then cross-linked before lysis, followed by for western blot analysis as indicated. (G) The N terminus of AHCYL1 binds PIK3C3. The truncated constructs of Flag-AHCYL1 were expressed into 293 T cells, followed by Co-IP for western blot analysis as indicated. Bars and error bars represent mean values and SDs, respectively. The Two-way ANOVA was used for A. ns represents no significance, defined as P > 0.05. N = 5 in A.
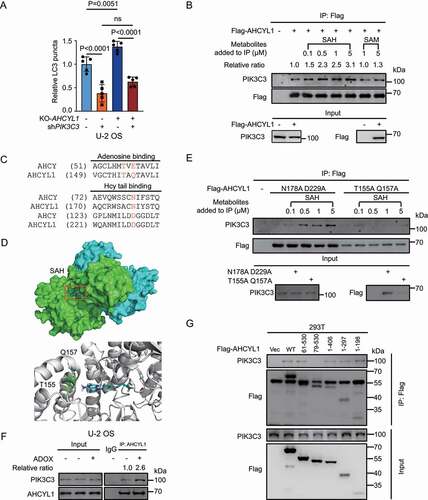
Then we explored whether SAH enhances the interaction between AHCYL1 and PIK3C3 in vivo. As the process of cell lysing dilutes all the intracellular metabolites, the endogenous interaction between AHCYL1 and PIK3C3 in treated U-2 OS cells were fixed by cross-linker before lysis. The results showed that the accumulated SAH by either ADOX or shAHCY enhanced the interaction between AHCYL1 and PIK3C3 in U-2 OS cells ( and S4D). Through truncated constructs of AHCYL1, we found that the N terminus of AHCYL1 interacted with PIK3C3 (). Together, SAH binds the AHCY-like domain at the C terminus of AHCYL1 and promotes the N terminus of AHCYL1 to interact with PIK3C3 in a dose-dependent manner.
SAH inhibits PIK3C3 through AHCYL1
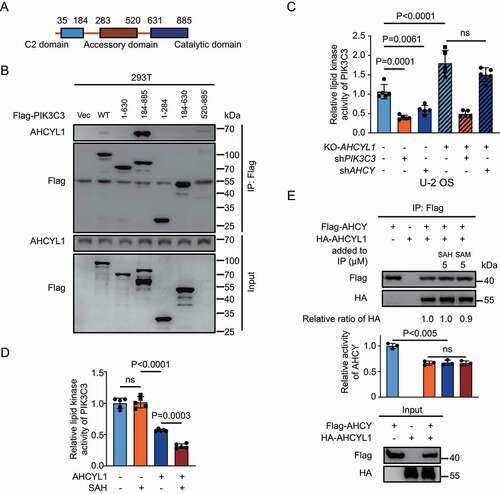
PIK3C3 contains 3 domains, C2 domain, accessory domain and catalytic domain (). AHCYL1 interacted with the catalytic domain of PIK3C3, suggesting the binding of AHCYL1 inhibits lipid kinase activity of PIK3C3 (). Using GFP-FYVE to monitor the levels of PtdIns3P, KD-AHCY inhibited the production of PtdIns3P and KO-AHCYL1 abolished such inhibition (, and Fig. S4E). The in vitro lipid kinase assay also showed that AHCYL1 inhibited the activity of PIK3C3, and adding SAH further inhibited the activity, but SAH alone did not alter the activity (). AHCY only functions as a homotetramer [Citation4]. Due to the similarity between AHCY and AHCY-like domain of AHCYL1/2, AHCY and AHCYL1/2 can form heterotetramer. AHCY-like domain shows no activity to hydrolyze SAH, and AHCYL1 can suppress the activity of AHCY through heteromultimerization [Citation30]. The N terminus of AHCYL1 does not involve in the formation of heterotetramer and SAH is the substrate of AHCY. It would be interesting to test whether SAH regulates the interaction between AHCY and AHCYL1 or the activity of AHCY through AHCYL1. To this end, we performed Co-IP of AHCY and AHCYL1 and found that binding with AHCYL1 inhibited activity of AHCY as reported (). But neither SAH or SAM regulated the interaction between AHCY and AHCYL1 or the activity of AHCY. Taken together, AHCYL1 mediates inhibition of PIK3C3 by SAH.
Figure 4. SAH inhibits PIK3C3 through AHCYL1. (A) A schematic map of PIK3C3 structure. (B) The catalytic domain of PIK3C3 binds AHCYL1. The different truncated constructs of Flag-PIK3C3 were expressed in 293 T cells, followed by Co-IP for western blot analysis as indicated. (C) SAH inhibits lipid kinase activity of PIK3C3 through AHCYL1. The PtdIns3P levels were quantified by FYVE puncta in U-2 OS. KO-AHCYL1 increased PtdIns3P levels and KD-PIK3C3 abolished the increase by KO-AHCYL1. KD-AHCY decreased PtdIns3P levels and KO-AHCYL1 abolished the decrease by KD-AHCY. (D) SAH enhances PIK3C3 inhibition by AHCYL1 by in vitro lipid kinase assay. Flag-PIK3C3 and Flag-AHCYL1 were individually expressed into 293 T cells, followed by Flag IP and elution, the purified Flag-PIK3C3 was mixed with Flag-AHCYL1 and SAH as indicated. The lipid kinase activity of PIK3C3 was measured by ADP-Glo™ Kinase Assay kit. The denatured proteins were used as control. (E) SAH has no effect on the interaction between AHCYL1 and AHCY. Flag-AHCY and HA-AHCYL1 were expressed into 293 T cells. SAH and SAM were added into cell lysate for Flag IP. The activity of IPed AHCY was measured by HPLC. Bars and error bars represent mean values and SDs, respectively. The Two-way ANOVA was used for C, D, and E. ns represents no significance, defined as P > 0.05. N = 5 in C and D. N = 3 in E.
AHCYL1 is required for the autophagy inhibition by SAH in zebrafish
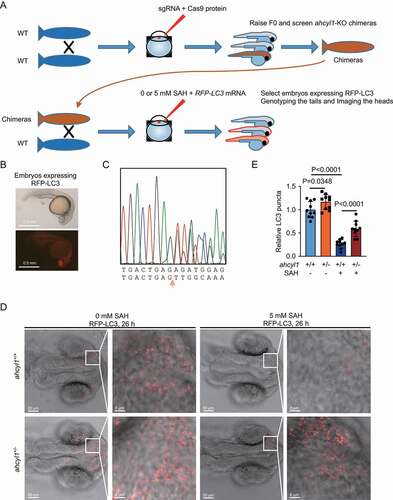
To prove the SAH-AHCYL1-autophagy axis in vivo, we used Cas9 to generate ahcyl1-KO zebrafish. Three sgRNAs targeting exon2 of ahcyl1 were designed and tested in vitro assay (Fig. S5A and S5B). After the injection of premixed sgRNAs and Cas9 enzyme, the F0 were raised and screened for chimeras of ahcyl1-KO zebrafishes ( and S5C). It is reported that KD-ahcyl1 by morpholino antisense oligonucleotides injection in zebrafish embryos results in severely deformed embryos depending the mount of morpholino used [Citation31]. In our assays, no abnormal morphologies were observed. The identified chimeras were raised and crossed to wild-type zebrafish. The fertilized eggs were collected and injected with 0 or 5 mM SAH and RFP-LC3 mRNA at one-cell stage. For the injection of 5 mM SAH, based on the injection volume, the final concentration of injected SAH was about 5 μM. Twenty-six h after fertilization, the embryos expressing RFP-LC3 were fixed (). For each embryo, the tail was used for genotyping and the head was analyzed ( and S5D). We measured the RFP-LC3 puncta in the brain areas of embryos, as ahcyl1 mainly expressed in diencephalon at this time [Citation32]. The results showed less LC3 puncta when injected with SAH ( upper panel, and 5E). When one allele of ahcyl1 was knocked out, a mild increase of LC3 puncta was observed and the decrease of LC3 puncta by SAH was significantly weakened ( lower panel, and 5E). These results demonstrated that AHCYL1 senses the increased SAH to inhibit autophagy in zebrafish.
Figure 5. AHCYL1 is required for the autophagy inhibition by SAH in zebrafish. (A) A flowchart for the generation of ahcyl1-KO zebrafish using the CRISPR/Cas9 system to analyze autophagy with or without SAH. (B) An example of 26 h zebrafish embryos expressing RFP-LC3. The fertilized eggs from the cross of wild-type and chimeras were injected with RFP-LC3 mRNA and 0/5 mM SAH at one cell stage. Twenty-six h later, the embryos expressing RFP-LC3 were selected and fixed for analysis. (C) An example of ahcyl1-KO heterozygotes. A deletion of 71 bp. The fixed embryos were dissected into tails and heads. The tails were used for DNA extraction and sequencing. The heads were analyzed for the RFP-LC3. (D) and (E) ahcyl1 is required for the decrease of LC3 puncta by SAH. RFP-LC3 puncta in the brain areas of embryos were analyzed. Injection of SAH decreased LC3 puncta in ahcyl1+/+ zebrafish and the decrease was less in ahcyl1± zebrafish. Bars and error bars represent mean values and SDs, respectively. The Two-way ANOVA was used for E. ns represents no significance, defined as P > 0.05. N = 10 in E.
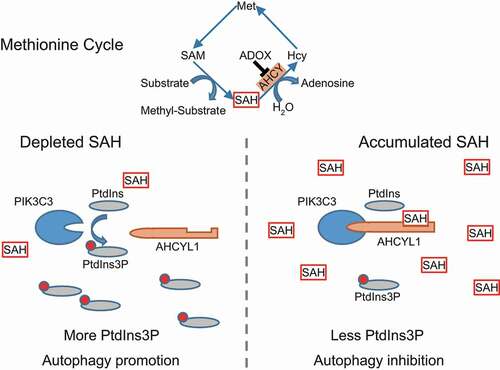
In summary, AHCYL1 senses the intracellular SAH to control autophagy (). SAH enhances the interaction between AHCYL1 and PIK3C3, which is mediated by the N terminus of AHCYL1 and the catalytic domain of PIK3C3, leading to inhibition its activity. When cells are in the presence of SAH, the enhanced interaction suppresses the production of PtdIns3P, which blocks the autophagy initiation. When in the absence of SAH, the decreased interaction releases PIK3C3 to produce PtdIns3P, eventually promotes autophagy.
Figure 6. Working model. AHCYL1 senses the intracellular SAH to control autophagy. SAH enhances the interaction between AHCYL1 and PIK3C3, which is mediated by the N terminus of AHCYL1 and the catalytic domain of PIK3C3, leading to inhibition of PIK3C3 activity. When cells are in presence of SAH, the enhanced interaction suppresses the production of PtdIns3P, which blocks the autophagy initiation. When in the absence of SAH, the decreased interaction releases PIK3C3 to produce PtdIns3P, eventually promotes autophagy.
Discussion
It is always considered that SAH should be hydrolyzed quickly once formed as a strong feedback inhibitor of methyl-transfer reaction [Citation33–36]. However, there is only one enzyme, AHCY, to remove SAH and produce intermediates for the recycle of methionine. AHCY deficiency is a rare congenital disorder and could be lethal depending on the remaining activity of mutant AHCY [Citation37,Citation38]. The homozygote of Ahcy-KO leads to embryonic lethality in mice [Citation39]. The discovery of SAM sensor, BMT2, which senses SAM to inhibit MTOR pathway, raised our interest about whether SAH functions in other biological processes, especially in autophagy [Citation10].
Here we have uncovered that the AHCYL1 senses intracellular SAH to inhibit autophagy. Thus, this study reveals a novel signaling function of SAH, rather than harmful by-product of methylation reaction. Unexpectly, unlike SAM, SAH inhibits autophagy in an MTORC1-independent manner. To define how SAH inhibits autophagy, we have revealed a new axis of SAH-AHCYL1-PIK3C3. As accumulated SAH induces DNA damage and cell cycle arrest, the treatment of ADOX is limited to 6 h and the inhibition of autophagy is not as significant as knocking-down of key component of autophagy, like ATG5 [Citation25]. It suggests that PIK3C3 or autophagy is not the only target of SAH-AHCYL1. Besides PIK3C3, many interaction partners of AHCYL1 have been reported [Citation27,Citation30,Citation40–42]. It is reasonable to hypothesis that SAH may regulate other interaction partners. In the AHCY-like family, AHCYL1 and AHCYL2 share the same AHCY-like domain which senses SAH, we speculate that SAH could regulate the functions of any other protein interacting with the unstructured N terminus of AHCYL1 and AHCYL2. The physiological role of SAH is not only an intermediate metabolite, but also a signal molecule.
Both SAM and SAH are not cell membrane permeable, which makes the direct adding of SAM or SAH in the culture media improper [Citation19]. This is a limitation factor for us to mimic physiological conditions. In our study, the accumulated SAH was induced by either inhibition or knockdown of AHCY. In Drosophila, the suppression of dAhcyL1/dAhcyL2 enhances activity of Ahcy to down-regulate SAH, which is correlated with extension of health span and life span [Citation43]. The induction of autophagy mediates life span extension [Citation44]. It is possible that the axis of SAH-AHCYL1-PIK3C3 is involved in life span extension through autophagy regulation. The methionine deprivation decreases cellular SAM and SAH, and inhibition of AHCY accumulates SAH [Citation10]. Both conditions are not suitable to treat cells for the long term. The connection between downregulation of SAH and life span in fruit fly needs further investigation.
In summary, we uncover a new axis of SAH-AHCYL1-PIK3C3, which senses the intracellular level of SAH to inhibit autophagy in an MTORC1-independent manner.
Materials and methods
Plasmids
For the expression of the full-length and truncated AHCYL1 and PIK3C3 proteins, the ORF cDNAs were cloned into the pRK7-N-Flag vector. AHCYL1 mutants were generated using the AccuPrime Pfx DNA Polymerase (Invitrogen, 12344024) according to the manufacturer’s protocol. The inducible shRNAs used in current work were: AHCY shRNA1: CCTCTCCTCCCTAAGAGCTA, AHCY shRNA2: TGCCATTGTGTGTAACATTG, AHCY shRNA3: AGCTAATGGCACCAACTTTG, PIK3C3 shRNA1: CCACGAGAGATCAGTTAAATA, PIK3C3 shRNA2: CGAAGGTATTCTAATCTGATT, PIK3C3 shRNA3: GCTGCACAACAGACATTTGTA, cloned into pTRIPZ. To knock-out AHCYL1, the gRNAs: AHCYL1 sg1: CAGGAGTTGCAGTGTTCGCTTGG, AHCYL1 sg2: CAACAAACTCACCGCTGTCTGGG, AHCYL1 sg3: CAAAGATCTTCGGCCAGTTTTGG, were cloned into plentiCRISPRv2.
Antibodies and chemical reagents
Anti-AHCYL1 (94248), anti-EIF4EBP1/4E-BP1 (9644), anti-phospho-EIF4EBP1/4E-BP1 (Thr37/46; 2855), anti-RPS6KB1/p70 S6 kinase (9202), anti-phospho-RPS6KB1/p70 S6 kinase (Thr389; 9206), anti-ULK1 (8054) and anti-phospho-ULK1 (Ser757; 14202) were purchased from Cell Signaling Technology. Anti-SQSTM1/p62 (18420-1-AP), anti-LC3 (14600-1-AP), anti-ACTB/beta actin (60008-1-Ig), and anti-AHCY (10757-2-AP) were purchased from Proteintech. Anti-PIK3C3 (ab227861) was purchased from Abcam. Anti-FLAG (M2) beads (A2220) were purchased from Sigma. Anti-Flag (GNI4110-FG) was purchased from the GNI Group.
Chemical activators/inhibitors used in this study include: adenosine dialdehyde (ADOX, AHCY inhibitor; Selleck, S8608), cycloleucine (cLEU, MAT inhibitor; Alfa Aesar, B22179), and Torin 1 (MTORC1-MTORC2 inhibitor; Selleck, S2827), chloroquine (CQ; Sigma, C6628).
Metabolites used in this study include: S-adenosyl-l-homocysteine (SAH; Sigma, A9384), S-adenosyl-l-methionine (SAM; Sangon, A506555), L-homocysteine (Hcy; Sigma, 69453), adenosine (Sangon, A600016), and L-methionine (Met; Sigma, M5308).
Cell culture, transfection and inhibitor treatment
U-2 OS (American Type Culture Collection, HTB-96), 293 T (American Type Culture Collection, CRL-3216) and MEF (isolated from 9.5 day embryos and self-immortalized) cells were cultured in DMEM supplemented with 10% fetal bovine serum (FBS; Biological Industries, 04–001-1A) and 1% Pen-Strep. WI-38 (American Type Culture Collection, CCL-75) cells were cultured in MEM supplemented with 10% fetal bovine serum and 1% Pen-Strep. Cell transfection was performed using polyethylenimine (PEI; Polysciences, 23966).
For the inhibitor treatment experiments in general, cells were treated with 50 μM ADOX for 6 h; 0.2 μM Torin 1 for 6 h; 20 mM of cycloleucine for 24 h; 50 μM CQ for 6 h.
For the analysis of LC3, the total cell lysates were prepared with 1X SDS gel-loading buffer (50 mM Tris-HCl, pH 6.8, 10% glycerol, 4% β-mercaptoethanol, 2% SDS, 0.0005% bromophenol blue).
Co-immunoprecipitation
Forty-eight h after transfection, the cells were harvested for protein interaction analysis. The cells were lysed with the lysis buffer (50 mM Tris-HCl, pH 7.5, 150 mM NaCl, 0.5% NP-40 (Solarbio, N8030), protease inhibitors PMSF (1 mM; Ameresco, 0754), aprotinin (1 mg/L; Sigma, A6103), leupeptin (1 mg/L; Sigma, L2884), and pepstatin (1 mg/L; Sigma, P5318), phosphatase inhibitors Na3VO4 (1 mM; Sangon, A600869) and NaF (10 mM; Sangon, A500850)). The cell lysates were incubated with the appropriate antibody (1–2 μg) for 2 h at 4°C. Protein G beads (Sigma, 11243233001) were then added for another 2 h incubation at 4°C. For the Flag immunoprecipitation, the cell lysates were incubated with the anti-Flag beads for 4 h at 4°C. The beads were washed 3 times with lysis buffer and then boiled in SDS gel-loading buffer.
Cells treated with ADOX or KD-AHCY were cross-linked with 1% paraformaldehyde (PFA) at room temperature for 1 h. The crosslinking reaction was stopped by 100 mM glycine at room temperature for an additional 1 h. Then the cells were lysed for interaction analysis.
AHCYL1 recombinant protein expression and purification
The AHCYL1 CDS was subcloned into pET28a vector (Novagen, 69864) with a His affinity tag fused to the N terminus. The pET28a-His-AHCYL1 was transformed into BL21 (DE3). The expression of His-AHCYL1 was induced by 200 μM IPTG overnight at 16°C. The His-AHCYL1 was purified by Nickel Affinity Gel (Sigma, P6611).
Isothermal Titration Calorimetry (ITC)
To obtain a direct binding affinity between AHCYL1 protein and various metabolites, including SAH, SAM, adenosine, Hcy and Met, metabolites were titrated with AHCYL1 using MicroCal iTC 200 calorimeter (MicroCal, Northampton, MA, USA). His-AHCYL1 (200 μM, 400 μL) in sodium phosphate buffer (300 mM NaCl, 20 mM Na2HPO4, pH 7.4) was loaded in the ITC cell at 25°C. SAH, SAM, Hcy, Adenosine, or MET (1 mM, 200 μL) in the same buffer at 25°C was titrated (10 μL each time) into the cell through a syringe, except for the first injection (2 μL). Heat generation was recorded. The binding enthalpy (ΔH) and association constant Ka were obtained by fitting the titration curves to a one-site binding model using the MicroCal Origin 7.0 software.
Liquid chromatography–mass spectrometry analysis
One million cells were collected after treatment in 1 mL of −80°C 80% methanol. Samples were vigorously vortexed and frozen, then thawed on ice. The freeze–thaw cycle was repeated three times. Samples were centrifuged at 13,000 g for 15 min to pellet cell debris, lipids and proteins. The supernatant was used for HPLC analysis of SAM and SAH.
Fluorescence imaging
Cells expressing GFP-LC3 or GFP-2xFYVE were plated onto glass coverslips and cultured for 2 days. The fixation was carried out with 4% paraformaldehyde for 15 min, following 3 times of wash with cold PBS. The fixed cells were then incubated with 4,6-diamidino-2-phenylindole dihydrochloride (DAPI) for 30 min. Cells were washed three times with PBS before imaging. Images were acquired using Leica SP5 Confocal Laser Scanning Microscope and analyzed with ImageJ.
Generation of ahcyl1-KO zebrafish and fluorescence imaging of LC3 puncta in embryos
Three gRNAs were designed to knockout ahcyl1 in zebrafish, ahcyl1 sg1: gtccgtagatgactgagagatgg, ahcyl1 sg2: gattcagtttgccaaccaggagg, and ahcyl1 sg3: gcaagttccctacaaaaacagg. The gRNAs were in vitro transcribed using the TranscriptAid T7 High Yield Transcription Kit (ThermoFisher, K0441) according to the manufacturer’s protocol. The three gRNAs were injected into zebrafish embryos at the one-cell stage with EnGen Spy Cas9 NLS (New England Biolabs, M0646). The chimeras of zebrafishes (F0) carrying the ahcyl1-KO allele were identified through sequencing. The RFP-LC3 mRNA was in vitro transcribed using the mMESSAGE mMACHINE SP6 Transcription Kit (ThermoFisher, AM1340) according to the manufacturer’s protocol. The embryos generated by F0 zebrafishes were injected with a mixture of RFP-LC3 mRNA and 0 or 5 mM SAH. 26 h after fertilization, the embryos were fixed by 8% paraformaldehyde with DAPI overnight. Then the embryos were gradually moved to 80% glycerol for imaging and stored at −20°C. For each embryo, the tail was used for genotyping and the head was used for imaging LC3 puncta. Images were acquired using Leica SP5 Confocal Laser Scanning Microscope and analyzed with ImageJ.
The ahcyl1 of zebrafish is mainly expressed in diencephalon at 26 h post-fertilization, according to the Zebrafish Information Network (https://zfin.org/). Only the LC3 puncta in the diencephalon area were quantified by ImageJ Analyze Particles function.
The in vitro lipid kinase assay of PIK3C3
The Flag-PIK3C3 and Flag-AHCYL1 are transfected and expressed in 293 T cells separately. After the Flag-Immunoprecipitation, the Flag-PIK3C3 and Flag-AHCYL1 are eluted by Flag peptide solution (200 μg/mL). The in vitro lipid kinase assay of PIK3C3 are performed with ADP-Glo™ Kinase Assay with Lipid Kinase Substrates (Promega, V1781) according to the manufacturer’s protocol. The denatured Flag-PIK3C3 by boiling is the negative control. The denatured Flag-AHCYL1 by boiling is the control for the Flag-AHCYL1.
Statistics and reproducibility
In brief, the quantifications of western blots and fluorescence images were performed through ImageJ (NIH). Data are presented as mean ± SD. The unpaired two-tailed t-test and the Two-way ANOVA were used as indicated. The statistical significance was defined as P < 0.05. Each experiment was repeated independently with similar results.
Supplemental Material
Download MS Word (5.6 MB)Acknowledgments
We thank members of the Lei Laboratory for discussion throughout this study. We thank Shao-Yang Sun of the zebrafish facility (Fudan University Shanghai Medical College) for the zebrafish maintenance. This work was supported by National Key R&D Program of China (2020YFA0803402 and 2019YFA0801703 to Q.-Y.L.), the Natural Science Foundation of China (Nos. 81790250/81790253 and 91959202 to Q.-Y.L.; No. 81802744 to W.H.), Innovation Program of Shanghai Municipal Education Commission (No. N173606 to Q.-Y.L.), China Postdoctoral Science Foundation (No. 2018M640334 to W.H., No. 2018M632011 to N.L.).
Disclosure statement
No potential conflict of interest was reported by the author(s).
Supplementary material
Supplemental data for this article can be accessed here.
Additional information
Funding
References
- Ducker GS, Rabinowitz JD. One-carbon metabolism in health and disease. Cell Metab. 2017;25:27–42.
- Ueland PM. Pharmacological and biochemical aspects of S-adenosylhomocysteine and S-adenosylhomocysteine hydrolase. Pharmacol Rev. 1982;34:223–253.
- Baric I, Fumic K, Glenn B, et al. S-adenosylhomocysteine hydrolase deficiency in a human: a genetic disorder of methionine metabolism. Proc Natl Acad Sci. 2004;101:4234–4239.
- Turner MA, Yang X, Yin D, et al. Structure and function of S-adenosylhomocysteine hydrolase. Cell Biochem Biophys. 2000;33:101–125.
- Kawaai K, Ando H, Satoh N, et al. Splicing variation of long-IRBIT determines the target selectivity of IRBIT family proteins. Proc Natl Acad Sci U S A. 2017;114:3921–3926.
- Dekker JW, Budhia S, Angel NZ, et al. Identification of an S-adenosylhomocysteine hydrolase-like transcript induced during dendritic cell differentiation. Immunogenetics. 2002;53:993–1001.
- Garcia D, Shaw RJ. AMPK: mechanisms of cellular energy sensing and restoration of metabolic balance. Mol Cell. 2017;66:789–800.
- González A, Hall MN. Nutrient sensing and TOR signaling in yeast and mammals. EMBO J. 2017;36:397–408.
- Xu W, Yang H, Liu Y, et al. Oncometabolite 2-hydroxyglutarate is a competitive inhibitor of α-ketoglutarate-dependent dioxygenases. Cancer Cell. 2011;19:17–30.
- Gu X, Orozco JM, Saxton RA, et al. SAMTOR is an S-adenosylmethionine sensor for the mTORC1 pathway. Science. 2017;358:813–818.
- Gingras A-C. Regulation of translation initiation by FRAP/mTOR. Genes Dev. 2001;15:807–826.
- Jung CH, Ro S-H, Cao J, et al. mTOR regulation of autophagy. FEBS Lett. 2010;584:1287–1295.
- Kim J, Kundu M, Viollet B, et al. AMPK and mTOR regulate autophagy through direct phosphorylation of Ulk1. Nat Cell Biol. 2011;13:132–141.
- Russell RC, Tian Y, Yuan H, et al. ULK1 induces autophagy by phosphorylating Beclin-1 and activating VPS34 lipid kinase. Nat Cell Biol. 2013;15:741–750.
- Park J-M, Jung CH, Seo M, et al. The ULK1 complex mediates MTORC1 signaling to the autophagy initiation machinery via binding and phosphorylating ATG14. Autophagy. 2016;12:547–564.
- Volinia S, Dhand R, Vanhaesebroeck B, et al. A human phosphatidylinositol 3-kinase complex related to the yeast Vps34p-Vps15p protein sorting system. EMBO J. 1995;14:3339–3348.
- Dikic I, Elazar Z. Mechanism and medical implications of mammalian autophagy. Nat Rev Mol Cell Biol. 2018;19:349–364.
- Backer JM. The regulation and function of class III PI3Ks: novel roles for Vps34. Biochem J. 2008;410:1–17.
- Hoffman DR, Marion DW, Cornatzer WE, et al. S-adenosylmethionine and S-adenosylhomocystein metabolism in isolated rat liver. Effects of L-methionine, L-homocystein, and adenosine. J Biol Chem. 1980;255:10822–10827.
- Mariño G, Pietrocola F, Eisenberg T, et al. Regulation of autophagy by cytosolic acetyl-coenzyme A. Mol Cell. 2014;53:710–725.
- Khaminets A, Heinrich T, Mari M, et al. Regulation of endoplasmic reticulum turnover by selective autophagy. Nature. 2015;522:354–358.
- Coulter AW, Lombardini JB, Sufrin JR, et al. Structural and conformational analogues of L-methionine as inhibitors of the enzymatic synthesis of S-adenosyl-l-methionine. 3. Carbocyclic and heterocyclic amino acids. Mol Pharmacol. 1974;10:319–334.
- Lavrador K, Guillerm D, Guillerm G. A new series of cyclic amino acids as inhibitors of S-adenosyl L-methionine synthetase. Bioorg Med Chem Lett. 1998;8:1629–1634.
- Jani TS, Gobejishvili L, Hote PT, et al. Inhibition of methionine adenosyltransferase II induces FasL expression, Fas-DISC formation and caspase-8-dependent apoptotic death in T leukemic cells. Cell Res. 2009;19:358–369.
- Belužić L, Grbeša I, Belužić R, et al. Knock-down of AHCY and depletion of adenosine induces DNA damage and cell cycle arrest. Sci Rep [Internet]. 2018 [cited 2020 Dec 21];8. Available from: https://www.ncbi.nlm.nih.gov/pmc/articles/PMC6143609/
- Thoreen CC, Kang SA, Chang JW, et al. An ATP-competitive mammalian target of rapamycin inhibitor reveals rapamycin-resistant functions of mTORC1. J Biol Chem. 2009;284:8023–8032.
- Arnaoutov A, Dasso M. Enzyme regulation. IRBIT is a novel regulator of ribonucleotide reductase in higher eukaryotes. Science. 2014;345:1512–1515.
- Hu Y, Yang X, Yin DH, et al. Computational characterization of substrate binding and catalysis in S-adenosylhomocysteine hydrolase. Biochemistry. 2001;40:15143–15152.
- Trott O, Olson AJ. AutoDock Vina: improving the speed and accuracy of docking with a new scoring function, efficient optimization, and multithreading. J Comput Chem. 2009. DOI:https://doi.org/10.1002/jcc.21334
- Devogelaere B, Sammels E, De Smedt H. The IRBIT domain adds new functions to the AHCY family. BioEssays. 2008;30:642–652.
- Cooper BJ, Key B, Carter A, et al. Suppression and overexpression of adenosylhomocysteine hydrolase-like protein 1 (AHCYL1) influences zebrafish embryo development A POSSIBLE ROLE FOR AHCYL1 IN INOSITOL PHOSPHOLIPID SIGNALING. J Biol Chem. 2006;281:22471–22484.
- Thisse B, Pflumio S, Fürthauer M, et al. Expression of the zebrafish genome during embryogenesis (NIH R01 RR15402)(http://zfin.org). ZFIN Direct Data Submiss [Internet]. 2001 [cited 2020 Nov 6]. Available from: http://zfin.org/ZDB-PUB–010810–1
- Finkelstein JD. Methionine metabolism in mammals. J Nutr Biochem. 1990;1:228–237.
- Grillo MA, Colombatto S. S-adenosylmethionine and its products. Amino Acids. 2008;34:187–193.
- Ulrey CL, Liu L, Andrews LG, et al. The impact of metabolism on DNA methylation. Hum Mol Genet. 2005;14:R139–R147.
- Yi P, Melnyk S, Pogribna M, et al. Increase in plasma homocysteine associated with parallel increases in plasma S -adenosylhomocysteine and lymphocyte DNA hypomethylation. J Biol Chem. 2000;275:29318–29323.
- Grubbs R, Vugrek O, Deisch J, et al. S-adenosylhomocysteine hydrolase deficiency: two siblings with fetal hydrops and fatal outcomes. J Inherit Metab Dis. 2010;33:705–713.
- Vugrek O, Belužić R, Nakić N, et al. S-adenosylhomocysteine hydrolase (AHCY) deficiency: two novel mutations with lethal outcome. Hum Mutat. 2009;30:E555–E565.
- Miller MW, Duhl DM, Winkes BM, et al. The mouse lethal nonagouti (a(x)) mutation deletes the S-adenosylhomocysteine hydrolase (Ahcy) gene. EMBO J. 1994;13:1806–1816.
- Ando H, Mizutani A, Matsu-ura T, et al. IRBIT, a novel inositol 1,4,5-trisphosphate (IP3) receptor-binding protein, is released from the IP3 receptor upon IP3 binding to the receptor. J Biol Chem. 2003;278:10602–10612.
- Ando H, Kawaai K, Mikoshiba K. IRBIT: a regulator of ion channels and ion transporters. Biochim Biophys Acta BBA - Mol Cell Res. 2014;1843:2195–2204.
- Shirakabe K, Priori G, Yamada H, et al. IRBIT, an inositol 1,4,5-trisphosphate receptor-binding protein, specifically binds to and activates pancreas-type Na+/HCO3- cotransporter 1 (pNBC1). Proc Natl Acad Sci U S A. 2006;103:9542–9547.
- Parkhitko AA, Binari R, Zhang N, et al. Tissue-specific down-regulation of S-adenosyl-homocysteine via suppression of dAhcyL1/dAhcyL2 extends health span and life span in Drosophila. Genes Dev. 2016;30:1409–1422.
- Madeo F, Zimmermann A, Maiuri MC, et al. Essential role for autophagy in life span extension. J Clin Invest. 2015;125:85–93.