
ABSTRACT
Macroautophagy/autophagy is emerging as a major pathway that regulates both aging and stem cell function. Previous studies have demonstrated a positive correlation of autophagy with longevity; however, these studies did not directly address the consequence of altered autophagy in stem cells during aging. In this study, we used Becn1F121A/F121A knockin mice (designated as Becn1 KI mice) with the F121A allele in the autophagy gene Becn1 to investigate the consequences of enhanced autophagy in postnatal neural stem cells (NSCs) during aging. We found that increased autophagy protected NSCs from exhaustion and promoted neurogenesis in old (≥18-months-old) mice compared with age-matched wild-type (WT) mice, although it did not affect NSCs in young (3-months-old) mice. After pharmacologically-induced elimination of proliferative cells in the subventricular zone (SVZ), there was enhanced re-activation of quiescent NSCs in old Becn1 KI mice as compared to those in WT mice, with more efficient exit from quiescent status to generate proliferative cells and neuroblasts. Moreover, there was also improved maintenance and increased neuronal differentiation of NSCs isolated from the SVZ of old Becn1 KI mice in in vitro assays. Lastly, the increased neurogenesis in Becn1 KI mice was associated with better olfactory function in aged animals. Together, our results suggest a protective role of increased autophagy in aging NSCs, which may help the development of novel strategies to treat age-related neurodegeneration.
Abbreviations: ATG: autophagy related; Baf A1: bafilomycin A1; Becn1: beclin 1; BrdU: bromodeoxyuridine/5-bromo-2ʹ-deoxyuridine; DCX: doublecortin; GFAP: glial fibrillary acidic protein; GFP: green fluorescent protein; H&E: hematoxylin and eosin; HSCs: hematopoietic stem cells; KI: knockin; MAP1LC3B/LC3: microtubule associated protein 1 light chain 3 beta; mo: month; NSCs: neural stem cells; OB: olfactory bulb; RB1CC1: RB1-inducible coiled-coil 1; ROS: reactive oxygen species; SOX2: SRY (sex determining region Y)-box 2; SGZ: subgranular zone; SVZ: subventricular zone; TMZ: temozolomide; WT: wild type.
Introduction
Adult stem cells are responsible for the lifelong generation, maintenance, and repair of tissue and organ systems [Citation1], and therefore are useful models both to study cellular aging and to understand cellular and molecular mechanisms of tissue and organismal aging. Stem cell aging has been proposed to be one of the drivers of organismal aging and a decline in tissue function with age often correlates with a decline in stem cell function [Citation2,Citation3]. Strikingly, age-related biological alterations in the brain are associated with a progressive decline in adult neurogenesis (generation of new neurons) of neural stem cells (NSCs) and correlate with functional impairments [Citation4,Citation5]. Moreover, abnormalities in neurogenesis have been reported in neurodegenerative disorders for which aging is a major risk factor for disease development/progression such as Alzheimer (AD), Parkinson (PD), and Huntington (HD) diseases. Therefore, clarifying the mechanisms of stem cell aging will be critical for understanding the aging process and for developing novel strategies to ameliorate age-associated phenotypes and to treat age-related diseases, especially neurodegeneration.
Autophagy is a highly conserved cellular process for degradation of bulk cytoplasmic materials for maintenance of cellular homeostasis and in response to starvation. Autophagy dysfunction is implicated in a variety of diseases such as cancers, autoimmune diseases and neurodegenerative diseases [Citation6]. The role of autophagy in stem cell aging has emerged as a major interest in both the autophagy and aging fields. Loss-of-function studies using yeasts, worms, flies and mice as models have suggested an essential role for the autophagy machinery in healthy longevity [Citation7–18], and studies using tissue-specific deletion of core autophagy genes have illustrated various mechanisms by which autophagy helps to alleviate different age-related deterioration in mouse tissues [Citation19,Citation20]. Moreover, physiological inducers (e.g. caloric restriction) as well as pharmacological inducers (e.g. spermidine) of autophagy have been shown to increase lifespan in yeasts, worms, and mice [Citation21]. Elucidation of the hallmarks of aging identified autophagy impairment and stem cell exhaustion as major processes involved in the decline of the regenerative potential capacity linked to the accumulation of age-associated damages. For example, it has been reported that autophagy could protect old or injured stem cells through the prevention of senescence [Citation22,Citation23]. Our previous studies indicated that abolishing autophagy in rb1cc1/fip200 (RB1-inducible coiled-coil 1)-null NSCs caused defects in their self-renewal and neurogenesis as early as postnatal day 28 [Citation24]. Recent studies have also suggested changes in autophagy levels in aged stem cells such as hematopoietic stem cells (HSCs) [Citation25]. In aging NSCs, transcriptional factor FOXO3 plays a critical role to maintain autophagy activity to eliminate protein aggregates [Citation26]. It has been shown that increased lysosomal activity could activate aged quiescent NSCs to restore their functions [Citation27]. However, whether increasing autophagy levels in old stem cells can delay or even reverse aging phenotype(s) through stem cell maintenance or functions has not yet been examined [Citation28–30].
BECN1 is a core component of the class III phosphatidylinositol-3-kinase (PtdIns3K) complex, and is key for the initiation of autophagosome biogenesis [Citation31–33]. Under nutrient-rich conditions, BECN1 is bound and inhibited by BCL2. In the presence of stresses, BCL2 is phosphorylated and released from BECN1, which activates autophagy [Citation32]. Therefore, BCL2 association with BECN1 serves as a physiological regulatory mechanism of the function of BECN1 in autophagy. Recently, we generated targeted mutant mice with a mutation in the Becn1 gene (designated as Becn1 KI mice) that encodes a mutation in the BECN1 protein (Phe121Ala) that decreases BECN1 binding to its negative regulator BCL2, and we showed that, compared to control littermates, Becn1 KI mice exhibited increased lifespan and healthspan in association with increased autophagy activity in multiple organs [Citation34]. Therefore, Becn1 KI mice provide a novel tool to investigate the functions of enhanced autophagy in stem cell aging.
In this study, we demonstrated increased autophagy activity in NSCs as previously observed for other tissues in Becn1 KI mice, and more importantly, this elevated autophagy was associated with protection of old NSCs from aging-related decline in self-renewal and maintenance as well as neurogenesis, although it did not affect the maintenance and functions of NSCs in young mice. We further showed that increased autophagy stimulated reactivation of NSCs to preserve their pool and promote neurogenesis. The increased neurogenesis helped to maintain olfactory function of Becn1 KI mice during aging. These animal studies provide significant insights into the role and mechanisms of autophagy in the regulation of NSC maintenance and neurogenesis during aging. Moreover, our results may contribute to the future development of novel strategies to ameliorate symptoms in neurodegenerative diseases during aging and improve human healthspan based on the modulation of autophagy.
Results
Becn1 KI mice exhibit reduced decline of autophagy activity in aged NSCs
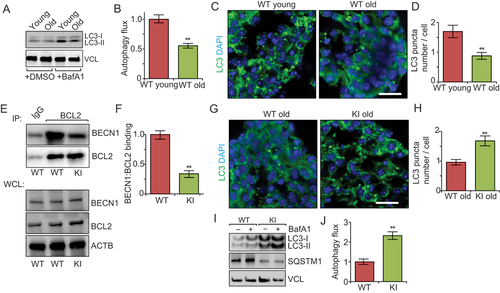
Previous studies showed that autophagy activity decreased in the rodent brain during aging [Citation35]; however, whether this decrease also occurs in postnatal NSCs has not yet been investigated. We therefore first isolated SVZ cells from young (1 mo) and old (18 mo) wild-type (WT) mice for neurospheric culture, and lysates from neurospheres were then used for western blot to compare autophagy activities in young and old NSCs. Similar to previous observations in neurons [Citation36], we found reduced levels of MAP1LC3B/LC3 (microtubule-associated protein 1 light chain 3 beta)-II in neurospheres from old mice after bafilomycin A1 (Baf A1) treatment (), suggesting decreased autophagy flux in aged NSCs. Furthermore, immunostaining for LC3 showed fewer LC3 puncta in neurospheres from old mice (), consistent with the reduced autophagosome formation. We next generated neurospheres from SVZ cells of 3-months-old Becn1 KI and WT mice. Co-immunoprecipitation analysis showed that in Becn1 KI mice, there was much less interaction between BECN1 and BCL2 in KI neurosphere than in WT neurosphere (), suggesting that the F121A mutation decreased BCL2 binding to BECN1. The BECN1 protein expression level in Becn1 KI neurosphere was comparable to that in WT neurosphere (). We also compared LC3 puncta in neurospheres from SVZ cells of 18-months-old Becn1 KI and WT mice with green fluorescent protein conjugated LC3 (GFP-LC3). Similar to previous findings showing higher level of autophagy in a number of tissues, including muscle, liver, heart, and kidney of Becn1 KI mice relative to littermate controls [Citation34], we found increased autophagy activity in NSCs from aged Becn1 KI mice compared to WT mice (). We also found higher autophagy flux and lower SQSTM1/p62 amounts in cultured neurospheres from aged Becn1 KI mice compared to WT mice after Baf A1 treatment (). These results suggest that Becn1 KI partially reversed the decline of autophagy in NSCs in older mice.
Figure 1. Becn1F121A knockin mutation reverses decreased autophagy in neurospheres from older mice. (A) Lysates from DMSO and Baf A1 treated neurosphere from old and young WT mice in normal media probed by immunoblot. n = 3 independent experiments. (B) Mean ± SE of change of autophagy flux (calculated as LC3-II/VCL with Baf A1 divided by LC3-II/VCL without Baf A1) of neurospheres from old WT young mice and old mice. The autophagy flux of WT cells is set as 1 for each experiment. (C) Immunofluorescence for LC3 and DAPI in primary neurospheres from young and old WT mice. (D) Mean ± SE of number of LC3 puncta per cell of primary neurospheres from young and old WT mice were shown. n = 5 independent experiments. (E) Co-immunoprecipitation of BECN1 by BCL2 in neurospheres from WT and KI mice. (F) Mean ± SE of BECN1:BCL2 ratio in the IP samples from 3 independent experiments were shown. (G) Immunofluorescence for LC3 and DAPI in isolated primary neurospheres from old WT and old KI mice. (H) Mean ± SE of number of LC3 puncta per cell of primary neurospheres from old WT and old KI mice. n = 5 independent experiments. (I) Lysates from DMSO – and Baf A1-treated neurospheres of old WT mice and old KI mice probed by immunoblot. (J) Mean ± SE of change of autophagy flux of neurospheres from old WT mice and old KI mice. n = 4 independent experiments. Bar: 10 μm. **: p < 0.01. Student’s t test was used for statistical analysis.
Increased autophagy protects the NSC pool in aged Becn1 KI mice
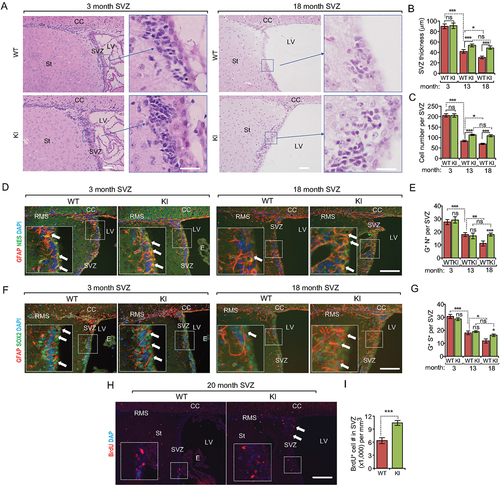
To test whether enhanced autophagy in Becn1 KI mice can protect NSCs from decreased self-renewal and/or neurogenesis during aging, we examined NSCs in WT mice and Becn1 KI mice at 3 mo, 13 mo, and ~18 mo. Hematoxylin and eosin (H&E) staining did not show any difference in the SVZ thickness as well as SVZ cellularity between WT mice and KI mice at 3 mo (). However, we found thicker and more cells in SVZ of KI mice than those in WT mice at both 13 mo and 18 mo (), suggesting more friendly niches for NSCs in KI mice. Next, we quantified the SVZ NSC number using GFAP (glial fibrillary acidic protein), NES (nestin) and GFAP, SOX2 (sex determining region Y-box 2) as markers. We found gradually decreased NSC numbers in both WT and Becn1 KI mice during aging (). No differences were observed in NSC numbers between WT and Becn1 KI mice at 3 mo and 13 mo. However, we found 35% more NSCs in Becn1 KI mice compared to WT mice at 18 mo (). We next performed a long-term bromodeoxyuridine/5-bromo-2ʹ-deoxyuridine (BrdU) retention experiment in 20 – to 22-months-old mice to further assess the increased NSC pool in aged Becn1 KI mice. Consistent with the results using markers, significantly more BrdU+ cells were found in the SVZ of Becn1 KI mice relative to WT mice (). Interestingly, when we examined the subgranular zone (SGZ) of dentate gyrus (DG) in hippocampus, we did not find any difference of DG area (Fig. S1A and S1B) or NSC numbers (Fig. S1C and S1D) between WT and Becn1 KI mice at 3 mo, 13 mo, and 18 mo. These data suggested a regional-specific function of enhanced autophagy to protect NSCs in the SVZ during aging.
Figure 2. Increased autophagy partially rescues the decline of NSC pool during aging in Becn1 Kl mice. (A) H&E staining of SVZ in 3-months-old and 18-months-old WT and Kl mice. The boxed area is shown in detail on the right side. (B and C) Mean ± SE of SVZ thickness (B) and cell number (C) of WT and Kl mice at 3 mo, 13 mo, and 18 mo. n = 5 animals. (D) Immunofluorescence for GFAP, NES, and DAPI in SVZ of 3-months-old and 18-months-old WT and Kl mice. The boxed area is shown in detail as inset. (E) Mean ± SE of the number of GFAP+ NES+ cells per SVZ section of WT and Kl mice at 3 mo, 13 mo, and 18 mo. n = 5 animals. (F) Immunofluorescence for GFAP, SOX2, and DAPI in SVZ of 3-months-old and 18-months-old WT and Kl mice. The boxed area is shown in detail as inset. (G) Mean ± SE of the number of GFAP+ SOX2+ cells per SVZ section of WT and Kl mice at 3 mo, 13 mo, and 18 mo. n = 5 animals. (H) Immunofluorescence for long-term retentioned BrdU and DAPI in SVZ of 3-months-old and 18-months-old WT and Kl mice. The boxed area is shown in detail as inset. Arrows indicated additional BrdU+ cells in KI mice. (I) Mean ± SE of the number of BrdU+ cells per 1 mm3 SVZ section of WT and Kl mice at 18 mo were shown. n = 5 animals. CC; corpus callosum; E: ependymal; LV: lateral ventricle; RMS: rostral migratory stream; St: striatum; SVZ: subventricular zone. Bar: 100 μm and 50 μm for enlarged panels in A. *: p < 0.05, **: p < 0.01, ***: p < 0.001. ns: no significance. Student’s t test and Two-way Anova were used for statistical analysis.
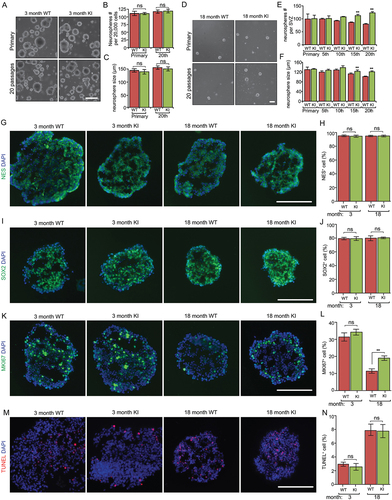
We also prepared SVZ cells from 3-months-old and 18 – to 19-months-old Becn1 KI and WT mice and examined them by serial passage neurosphere formation assays. No differences were found in the number and size of both primary and 20th passaged neurospheres from these two mice at 3-months-old (). We also did not notice any difference in primary neurospheric culture (i.e., 1st passage) from both WT and KI mice at 18 – to 19-months-old (). However, at both the 15th and 20th passages, there were significantly more and larger neurospheres from aged Becn1 KI mice relative to aged WT mice (). We then sectioned the neurospheres of 20th passage from different ages and stained with various markers. As expected, most cells in neurospheres of all samples were NES+ () and SOX2+ (), confirming their NSC or progenitor characters in vitro. MKI67 (a proliferative marker in nuclei) staining () revealed fewer proliferative cells in neurospheres from old mice than in those from young mice. Notably, the proliferation in old Becn1 KI neurospheres was significantly higher than that in old WT NSCs (). We also observed a higher percentage of terminal deoxynucleotidyl transferase dUTP nick end labeling (TUNEL+) cells in neurospheres from old mice while there was no difference of apoptotic cells in neurospheres between WT and KI mice (). Together, these in vivo and in vitro results suggest a protective function of enhanced autophagy to preserve SVZ NSC pool and their self-renewal ability during aging.
Figure 3. Increased autophagy promotes the growth of neurospheres isolated from old Becn1 Kl mice. (A) Phase contrast images of primary and 20th passaged neurospheres from WT and Kl mice at 3 mo. (B and C) Mean ± SE of the number and size of neurospheres with different passage from WT and Kl mice at 3 mo. Experiments are from 5 animals per group. (D) Phase contrast images of primary and 20th passaged neurospheres from WT and Kl mice at 18 mo. (E and F) Mean ± SE of the number and size of neurospheres with different passage from WT and Kl mice at 18 mo. Experiments are from 5 animals per group. (G, I, K, M) Immunofluorescence for NES (G), SOX2 (I), MKI67 (K), TUNEL (M), and DAPI in sectioned neurospheres at 15th – 20th passages of 3-months-old and 18-months-old WT and Kl mice. (H, J, L, N) Mean ± SE of the percentage of NES+ (H), SOX2+ (J), MKI67+ (L), TUNEL+ (N) cells in neurospheres at 15th – 20th passages of 3-months-old and 18-months-old WT and Kl mice. For each condition, > 2,000 cells from 5 independent experiments were counted. Bar: 100 μm. **: p < 0.01. ns: no significance. Two-way Anova was used for statistical analysis.
Increased autophagy promotes neurogenesis in aged Becn1 KI mice
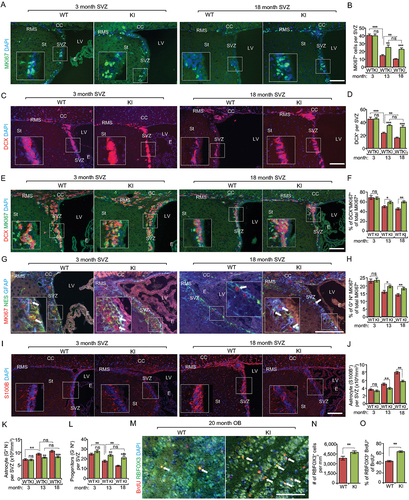
We next stained the SVZ of Becn1 KI and WT mice with various markers to study the role of increased autophagy in NSC differentiation in vivo. MKI67 staining showed comparable proliferation at 3 mo but there were more MKI67+ cells in Becn1 KI than in WT mice at 13 mo and 18 mo (). Staining using the neuroblast (immature neuron) marker DCX (doublecortin) showed that both Becn1 KI and WT mice at 13 mo and 18 mo had decreased neurogenesis compared to mice at 3 mo (). However, the decline was partially reversed in Becn1 KI mice at 13 mo and 18 mo. The double staining of DCX and MKI67 indicated that there were more proliferative neuroblasts in SVZ of Becn1 KI mice at both 13 mo and 18 mo (). The staining of NSC markers of GFAP and NES with MKI67 also showed a higher percentage of proliferative NSCs in SVZ of Becn1 KI mice at both 13 mo and 18 mo (). Consistent with a higher level of neurogenesis, fewer astrocytes (S100B/S100β+ or GFAP+ NES−) () and more progenitors (GFAP – NES+) () were found in the SVZ of old Becn1 KI mice than in old WT mice. We further examined neurogenesis steps from NSCs to neurons in the aged mice by determining the fractions of neurons with BrdU label retention in the olfactory bulb (OB). We found significantly more RBFOX3/NeuN+ cells as well as RBFOX3 and BrdU double-positive cells in the OB of Becn1 KI mice than in WT mice at 20 mo (). We also examined the neurogenesis and proliferation of NSCs in DG, however, we did not observe any difference between WT mice and KI mice at all examined time points (Fig. S1E-H). Moreover, no differences were found for oligodendrocyte differentiation by OLIG2 (oligodendrocyte transcription factor 2) and MBP (myelin basic protein) staining, or apoptosis by TUNEL staining in both SVZ and SGZ between Becn1 KI and WT mice at all time points examined (Fig. S2A-D and data not shown). We also performed an in vitro differentiation assay [Citation24] from primary neurosphere and found a significantly increased percentage of TUBB3/TUJ1+ neuronal cells from Becn1 KI mice but no difference in the differentiation of GFAP+ astrocytic or OLIG2+ oligodendrocytic glial cells between WT and Becn1 KI mice (Fig. S3A). Nevertheless, the 20th passage of KI neurospheres showed not only increased TUBB3+ neuronal cells but also lower percentage of GFAP+ astrocyte after in vitro differentiation (Fig. S3B). We did not find difference in the percentage of OLIG2+ cells in the 20th passage of old WT and KI neurospheres (Fig. S3B). Together, these results suggest that higher levels of autophagy prevent the decline of neurogenesis specifically in aged Becn1 KI mice relative to WT mice.
Figure 4. Increased autophagy partially restores the decline of proliferative neurogenesis in the SVZ during aging in Becn1 KI mice. (A) Immunofluorescence for MKI67 and DAPI in SVZ of Becn1 KI and WT mice at 3-months-old and 18-months-old. The boxed area is shown in detail as inset. (B) Mean ± SE of number of MKI67+ cells in SVZ of Becn1 KI and WT mice at 3 mo, 13 mo, and 18 mo. n = 5 animals. (C) Immunofluorescence for DCX and DAPI in SVZ of Becn1 KI and WT mice at 3-months-old and 18-months-old. The boxed area is shown in detail as inset. (D) Mean ± SE of number of DCX+ cells in SVZ of Becn1 KI and WT mice at 3 mo, 13 mo, and 18 mo. n = 5 animals. (E) Immunofluorescence for DCX, MKI67, and DAPI in SVZ of Becn1 KI and WT mice at 3-months-old and 18-months-old. The boxed area is shown in detail as inset. (F) Mean ± SE of percentage of MKI67+ DCX+ cells of total MKI67+ cells in SVZ of Becn1 KI and WT mice at 3 mo, 13 mo, and 18 mo. n = 5 animals. (G) Immunofluorescence for GFAP, NES, MKI67, and DAPI in SVZ of Becn1 KI and WT mice at 3-months-old and 18-months-old. The boxed area is shown in detail as inset. (H) Mean ± SE of percentage of GFAP+ NES+ MKI67+ cells of total MKI67+ cells in SVZ of Becn1 KI and WT mice at 3 mo, 13 mo, and 18 mo. n = 5 animals. (I) Immunofluorescence for S100B and DAPI in SVZ of Becn1 KI and WT mice at 3-months-old and 18-months-old. The boxed area is shown in detail as inset. (J) Mean ± SE of number of S100B+ cells per 1 mm3 SVZ section of KI and WT mice at 3 mo, 13 mo, and 18 mo. n = 5 animals. (K) Mean ± SE of of number GFAP+ NES – astrocyte per 1 mm3 SVZ section of KI and WT mice at 3 mo, 13 mo, and 18 mo. n = 5 animals. (L) Mean ± SE of of number GFAP – NES+ progenitor cells in SVZ of Becn1 KI and WT mice at 3 mo, 13 mo, and 18 mo. n = 5 animals. (M) Immunofluorescence for long term retentioned BrdU, RBFOX3, and DAPI in olfactory bulb of 18-months-old WT and Kl mice. Arrows indicate RBFOX3+ BrdU+ cells. (N) Mean ± SE of number of RBFOX3+ cells per mm2 in the olfactory bulb of Becn1 KI and WT mice at 18 mo. n = 5 animals. (O) Mean ± SE of percentage of RBFOX3+ BrdU+ cells of total BrdU+ cells in the olfactory bulb of Becn1 KI and WT mice at 18 mo. n = 5 animals. CC; corpus callosum; E: ependymal; LV: lateral ventricle; RMS: rostral migratory stream; St: striatum; SVZ: subventricular zone. Bar: 200 μm. *: p < 0.05, **: p < 0.01, ***: p < 0.001. ns: no significance. Student’s t test and Two-way Anova was used for statistical analysis.
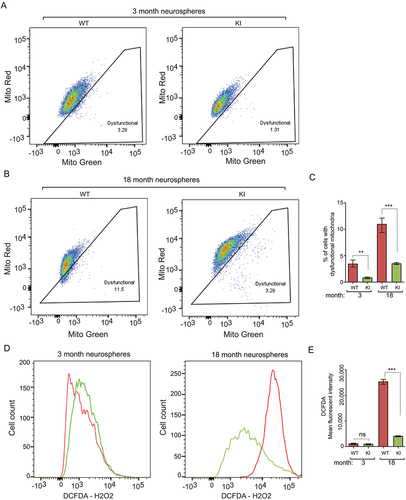
Increased autophagy eliminates dysfunctional mitochondria and reduces reactive oxygen species (ROS) in aged Becn1 KI NSCs
As autophagy is required for mitochondria clearance in NSCs [Citation24], we labeled mitochondria in dissociated neurosphere cells with MitoTracker Green and MitoTracker Red, followed by FACS. We gated for cells with increased dysfunctional mitochondria (those with a low ratio of functional to total mitochondria) as described previously [Citation37,Citation38]. We observed higher percentage of dysfunctional mitochondria in young WT NSC/progenitors than that in young KI NSC/progenitors at 20th passage (). With aging, NSC/progenitors from neurospheres of old WT mice showed significantly increased number of dysfunctional mitochondria compared with those from old Becn1 KI mice (). These results demonstrated that enhanced autophagy efficiently prevented the accumulation of dysfunctional mitochondria in NSC/progenitors, especially in aged animals. Next, we examined the reactive oxygen species (ROS) levels in dissociated neurosphere cells by DCFDA staining to indicate H2O2, followed by FACS analysis. No differences in the levels of H2O2 of dissociated neurosphere cells from 3-months-old WT and KI mice were observed (). However, we found that the H2O2 aberrantly increased in old WT NSC/progenitors but not in old KI NSC/progenitors (). These results were consistent with our previous studies demonstrating a critical contribution of increased ROS from damaged mitochondria to the reduction of rb1cc1-null NSCs [Citation24,Citation37]. These results suggested that enhanced autophagy could reserve NSC maintenance and differentiation of old mice through the elimination of defective mitochondria and ROS.
Figure 5. Increased autophagy reduces dysfunctional mitochondria and ROS in NSCs of old Becn1 KI mice. (A and B) Dysfunctional mitochondria in dissociated neurosphere cells from 3-months-old (A) and 18-months-old (B) WT and KI mice were evaluated by the percentage of cells with decreased ratios of MitoTracker Red to MitoTracker Green. (C) Mean ± SE of percentage of dysfunctional mitochondria of total mitochondria in dissociated neurospheres from Becn1 KI and WT mice at 3 mo and 18 mo. (n = 3 mice each). (D) FACS of DCFDA in dissociated neurosphere cells of 3-months-old (left panel) and 18-months-old (right panel) WT mice and KI mice. (E) Mean ± SE of mean fluorescent intensity of DCFDA in dissociated neurospheres from Becn1 KI and WT mice at 3 mo and 18 mo. (n = 3 mice each). **: p < 0.01, ***: p < 0.001. ns: no significance. Student’s t test and One-way Anova were used for statistical analysis.
Increased autophagy promotes reactivation of quiescent NSCs and their neurogenesis in aged Becn1 KI mice
It is possible that enhanced autophagy facilitates the reactivation of aged NSCs from quiescence to reduce the decline in NSC pool and neurogenesis during aging. To test this possibility, we performed NSC reactivation experiments by injecting temozolomide (TMZ) to eliminate proliferative NSCs, transient amplification cells, and proliferative neuroblasts, followed by examination of recovery of various cellular populations, as described previously [Citation39]. At 14 d after TMZ treatment, we found more proliferative cells in the SVZ by MKI67 staining in Becn1 KI mice compared to WT mice (). Consistent with the increase in DCX+ SVZ cells in aged KI mice (see ), we also observed improved recovery of DCX+ cells in the SVZ of aged Becn1 KI mice relative to that in WT mice (). We also found more DCX+ MKI67+ cells in Becn1 KI mice compared to WT mice (), accounting for the increased neuroblast recovery in Becn1 KI mice. TMZ did not affect the maintenance of GFAP+ NES+ NSCs in SVZ of WT and KI mice (). However, when we analyzed the proliferation of NSCs, we found there were more proliferative NSCs (GFAP+ NES+ MKI67+) in the SVZ of Becn1 KI mice (), suggesting activation of quiescent NSCs into proliferative status in Becn1 KI mice. Together, these results indicate that increased autophagy may promote quiescent NSCs to reenter the cell cycle and to differentiate into neurons in aged Becn1 KI mice.
Figure 6. Increased autophagy promotes cell cycle reentry from quiescent NSCs during aging in Becn1 KI mice. (A, C, E, and G) Immunofluorescence for MKI67 (A), DCX (C), DCX and MKI67 (E), GFAP and NES (G), and DAPI in SVZ of 22-months-old Becn1 KI and WT mice 14 d after vehicle or TMZ treatment. The boxed area is shown in detail as inset. (B, D, F, H, and I) Mean ± SE of the number of MKI67+ cells (B), number of DCX+ cells (D), percentage of MKI67+ DCX+ cells of total MKI67+ cells (F), number of GFAP+ NES+ cells (H), and percentage of GFAP+ NES+ MKI67+cells of total GFAP+ NES+ cells (I) in SVZ of 22-months-old Becn1 KI and WT mice 14 d after vehicle or TMZ treatment. n = 4–5 WT mice and KI mice. Arrows indicate GFAP+ NES+ cells in inset. (J) Female Becn1 KI mice (24 mice), but not male Becn1 KI mice (14 mice), at 18–22 months of age performed better than corresponding WT mice in a buried food test (24 female WT mice and 14 male WT mice). CC; corpus callosum; LV: lateral ventricle; RMS: rostral migratory stream; St: striatum; SVZ: subventricular zone. Bar: 100 μm. *: p < 0.05, **: p < 0.01, ***: p < 0.001. Student’s t test and Wilcoxon matched-pairs signed rank test were used for statistical analysis.
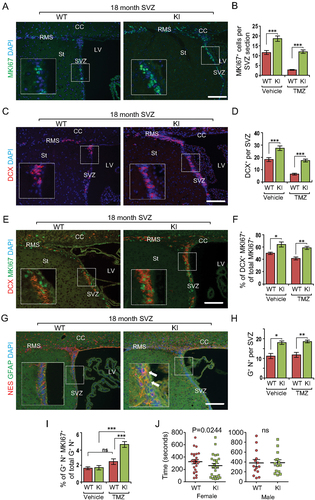
Increased autophagy preserves olfactory functions in aged Becn1 KI mice
NSCs from the SVZ are anatomically linked to the OB through the rostral migratory stream (RMS), and their neurogenesis and migration to the OB is responsible for the replenishment of lost neurons in the OB, which are important for food searching, mating, learning, and other important functions in rodents [Citation40]. Thus, we speculated that the increased neurogenesis may generate more neurons in the OB for better olfactory function in old Becn1 KI mice. Indeed, more newly generated RBFOX3+ BrdU+ neurons were found in the OB of Becn1 KI mice relative to that in WT mice (see ). To test whether the increased new neuron generation leads to enhanced olfactory function, we used the buried pellet test to evaluate general olfaction [Citation41]. We found that old female Becn1 KI mice showed reduced latency to find the buried pellet compared to littermate-matched WT mice, although no such difference was found in male mice (). These results suggest that increased autophagy in NSCs could improve olfactory functions in Becn1 KI mice during aging.
Discussion
A hallmark of aging is stem cell exhaustion with the consequent decline in tissue regenerative potential [Citation42]. As in other cells, accumulation of various cellular damage by minor stresses from normal cellular metabolism [Citation2,Citation28] as well as declines of mechanisms for sensing and controlling intracellular damage such as autophagy contribute to stem cell aging [Citation29]. As many stem cells including NSCs are long-lived and persist throughout the life of an organism, autophagy and other quality control mechanisms to maintain cellular homeostasis are likely even more crucial for these cells. Using the recently established Becn1 KI mice that increase basal levels of autophagy and promote mammalian healthspan and lifespan [Citation34], we demonstrate here that reversing the autophagy decrease in NSCs protected them from aging-associated decline of self-renewal and maintenance. Higher autophagy activity in aged NSCs also enhanced their reactivation from quiescence and increased their neurogenesis activity and olfactory functions. Besides providing the first genetic evidence by using a gain-of-function mutation for autophagy to prevent decline of somatic stem cell maintenance during aging, these results also suggest that improved maintenance and functions of NSCs and perhaps other tissue stem cells might contribute to the increased health span and lifespan of Becn1 KI mice.
We have shown previously that deletion of another autophagy gene, Rb1cc1, in postnatal NSCs caused the degenerative phenotypes of stem cell exhaustion and defective neurogenesis in young mice [Citation24]. Interestingly, however, increased autophagy only helped to sustain NSC pool and neurogenesis in older, but not young, Becn1 KI mice. These results are consistent with our findings that blocking autophagy per se upon deletion of Atg5 (autophagy related 5) or Atg16l1 did not affect NSC maintenance and function, and that loss of non-canonical autophagy function of Rb1cc1 (either alone or in combination with autophagy blockade) was responsible for inducing defective NSC self-renewal and neurogenesis in young mice [Citation37]. Another, and non-mutually exclusive, possibility is that autophagy may play a preferential role in aged NSCs only due to accumulating intracellular damage during aging. However, we cannot rule out the possibility that the better preserved NSC pool and functions are due to non-autophagy effects in old Becn1 KI mice. Future studies examining conditional KO of other autophagy genes (e.g. Atg5 and Atg16l1) in older NSCs will help to clarify these potential possibilities.
Self-renewal is important to maintain the population of tissue-specific stem cells throughout life to generate differentiated progeny. Consistent with our findings in NSCs, Ho et al. have recently shown that autophagy is necessary for preservation and quiescence of old hematopoietic stem cells (HSCs) [Citation25]. It was found that approximately 30% of aged HSCs exhibited high autophagy levels, maintaining a low metabolic state and strong long-term regeneration potential similar to young HSCs. In contrast, the remaining population of aged HSCs with decreased autophagy exhibited accumulation of mitochondria, diminishment of the regenerative potential, and decrease in self-renewal. Similar to aged HSCs, conditional KO of several autophagy genes such as Rb1cc1, Atg7 or Atg12 also caused defective self-renewal of HSCs in young mice [Citation25,Citation43,Citation44]. In addition to NSCs and HSCs, other studies have suggested a role for autophagy in maintaining stemness in bone marrow-derived mesenchymal stem cells [Citation45]. Moreover, loss of autophagy in aged muscle stem cells (satellite cells) led to defective mitophagy and accumulation of ROS, all features of senescence that reduce their regenerative potential in mice [Citation23]. Given the complexity of various adult stem cells and potential different mechanisms involved in their regulation, it would be interesting to use Becn1 KI mice with increased autophagy in different tissues to clarify the role of autophagy in maintenance of different stem cells during aging, and whether similar mechanisms (e.g. defective mitochondria, accumulated toxic protein aggregates, and increased ROS) are involved in the regulation of various tissue stem cells by autophagy during aging. In this regard, Pyo et al. have shown that overexpression of ATG5 increased autophagy in multiple tissues, which also exhibited anti-aging features including increased mean lifespan, an improved resistance to age-related obesity, and enhanced insulin sensitivity compared with the WT mice [Citation46]. Similar studies using these mice for various tissue stem cells in comparison to Becn1 KI mice will also be interesting to evaluate potential differential roles in different stem cells.
Besides maintenance of self-renewal, several previous studies have suggested a role for autophagy in the regulation of differentiation of adult stem cells. Loss of autophagy caused aberrant glia differentiation in NSCs [Citation24] and augmented myeloid-to-lymphoid ratio in HSCs [Citation43,Citation44]. Consistent with these previous studies, we also found that increased autophagy in older NSCs promoted their neurogenesis relative to control mice. However, it is unclear at present whether or not the increased neurogenesis is simply a consequence of increased NSC pool in aged Becn1 KI mice or whether or not autophagy regulated NSC self-renewal and neurogenesis through the same mechanism or by different downstream pathways as our previous findings in rb1cc1 conditional KO in young mice [Citation24]. In either scenario, our mechanistic studies using TMZ suggested that higher autophagy activity increased the activation of quiescent NSCs to reenter the cell cycle and to differentiate into neurons in aged Becn1 KI mice. Interestingly, it is reported that increased proteolysis in lysosomes activated old quiescent NSCs [Citation27]. One of the functions of increased levels of autophagy in NSCs might be to supply degradable substrates to the lysosome to activate quiescent NSCs. In this study, we found that higher autophagy could eliminate dysfunctional mitochondria (mitophagy) [Citation47] to reduce aberrant ROS accumulation in old NSCs (), which might be associated with increased maintenance and functions of aged NSCs in KI mice. It is also possible that increased autophagy in old NSCs could prevent senescence [Citation23] or prompt degradation of lipids (lipophagy) to supply free fatty acids for membrane construction [Citation48] to accelerate neurogenesis.
Consistent with observations using multiple strategies in vivo, we found that the increased autophagy activity in NSCs from old Becn1 KI mice exhibited increased maintenance and neurogenesis in vitro, suggesting that autophagy regulates old NSCs through cell-autonomous mechanisms. However, we cannot completely exclude the possibility that non-cell-autonomous functions of the NSC niche may also contribute to the increased maintenance and function of aged NSCs given the increased autophagy in many tissues and cells in Becn1 KI mice [Citation34]. Recently, it was reported that T cell infiltration in the aged SVZ due to increased chemokines led to impaired neurogenesis in old mice [Citation49], suggesting that aberrant immune regulatory functions in the SVZ may account for the diminished NSC pool in aged animals. We previously reported that Rb1cc1 ablation dysregulated chemokine expression in NSCs to recruit microglia into the SVZ to suppress NSC neurogenesis in mice [Citation50]. Because of reduced autophagy in aged WT NSCs, we examined the microglia in SVZ of WT and Becn1 KI mice at 3 mo and 18 mo. We found no difference in the number of microglia in SVZ between WT mice and Becn1 KI mice at both time points (Fig. S4A and S4B). Nevertheless, we observed fewer reactivated microglia (round and amoeboid) in SVZ of Becn1 KI mice at 18 mo (Fig. S4C), suggesting a possible non-cell-autonomous function of enhanced autophagy to protect aged NSCs through restricting microglia activation. Therefore, it will be interesting to examine whether increased autophagy can promote NSC maintenance and neurogenesis by suppressing aberrant chemokine expression and microglia activation in aged NSC niches.
It is also interesting to notice that we only observed female Becn1 KI mice, but not male KI mice, improved their behavior performance in odor functions (). It has been reported that females tend to exhibit enhanced sensitivity to odors, as well as better discrimination and identification abilities than males, in rodents and humans [Citation51,Citation52]. The biological basis of these differences could be partly related to differences in sex hormones. Since the female mice older than 18 months (equivalent to women at 60 years old) experienced estrogen reduction, it is possible that enhanced autophagy in NSCs of older female KI mice (20 – to 22-months-old) could prevent the decline of olfactory functions by adding more new neurons to OB. It is also possible that old KI female had less reduction in the level of sex hormones. In contrast to the female mice, enhanced neurogenesis in old male KI mice might not be sufficient to improve their behavior performance because of the inferior odor abilities in male mice and the old male’s insensitivity to sex hormone change. In addition, although we observed more NSCs and neurogenesis in SVZ of old Becn1 KI mice, we did not find such a protective function for NSCs in DG as WT NSCs and KI NSCs declined similarly during aging (Fig. S1). This discrepancy might be attributed to the intrinsic difference between SVZ and SGZ neurogenesis in specific aspects, mainly in the niche organization, vascular structure, neuronal subtype differentiation, and migration of newborn neurons [Citation53]. Currently, we do not know the mechanisms for the regional difference between SVZ and DG in KI mice and it will be interesting to test in our future research.
In summary, our study provides evidence that greater levels of autophagy produce longer-lasting biological preservation and better functions at all levels in aged SVZ NSCs. This positive correlation between increased autophagy and improved NSC pool and functions in older mice raises the interesting possibility that autophagic modulation could be a novel therapy against aging and age-related degenerative diseases. In the future, it will be of great interest to use pharmacological restoration of autophagy to boost stem cell activity for regenerative medicine and anti-aging treatment.
Materials and Methods
Animals
Becn1F121A/F121A knock-in mice were described previously [Citation34]. Age and littermate-matched control and mutant mice were used for analysis to minimize the impact of modifier genes. Mice were housed and handled according to local, state, and federal regulations. All experimental procedures were carried out according to the guidelines of Institutional Animal Care and Use Committee at University of Cincinnati and at University of Texas Southwestern Medical Center. Mouse genotyping for the Becn1F121A allele was performed by PCR analysis of tail DNA, as described previously [Citation34,Citation54].
Neurosphere formation assay and in vitro differentiation
Neurospheres were cultured in neurobasal medium supplemented with B27 (Invitrogen, 17504044), 10 ng/ml FGF2/bFGF (fibroblast growth factor 2; Invitrogen, RP-8626) and 20 ng/ml EGF (epidermal growth factor; Invitrogen, A42556) in Ultra-Low Attachment dishes (Corning, CLS3471), essentially as described in our previous reports [Citation24]. Neurospheres with diameter larger than 50 μm were counted 7–9 d after culturing. For their passage, primary neurospheres were collected by centrifugation at 400 g for 5 min, and then incubated in 0.25% trypsin (Gibco, 25200056) at 37°C for 10 min with ~50 times pipetting. After addition of trypsin inhibitor supplemented with DNase I (Worthington, LS006344) to stop digestion, dispersed cells were collected by centrifugation at 400 g for 10 min, counted, and then cultured for the secondary neurospheres formation and quantified as described previously [Citation24,Citation37]. In some experiments, the dispersed cells from neurospheres were cultured for differentiation in neurobasal medium supplemented with B27, 10 ng/ml FGF2 and 5% (v:v) FBS (Invitrogen, A4766801) in 48-well plates coated with 150 μg/ml poly-D-lysine (Invitrogen, A3890401) and 20 μg/ml laminin (Invitrogen, 23017015) for another 7 or 14 d. Differentiated cells were fixed in 4% (w:v) freshly made, pre-chilled PBS (Invitrogen, 10010023)-buffered paraformaldehyde (PFA) for 30 min and then washed twice in cold PBS for 10 min. These cells were stained with TUBB3/β-III tubulin, GFAP or OLIG2 and DAPI (Invitrogen, D1306) for lineage analysis.
Antibodies and reagents
Primary antibodies used were mouse anti-ACTB/beta-actin (Sigma, A5441), rhodamine conjugated anti-BrdU (BD Pharmingen, 560210), anti-GFAP (Cell Signaling Technology, 3670), anti-NES/nestin (Rat-401; DSHB, AB2235915), anti-VCL/vinculin (Sigma, V4505), anti-RBFOX3/NeuN (Millipore, MAB377); rabbit anti-MKI67/Ki67 (Spring Bioscience, M3064), anti-GFAP (DAKO, Z033429-2), anti-RB1CC1 (Cell Signaling Technology, 12436), anti-TUBB3/β-III tubulin (Cell Signaling Technology, 5568), anti-LC3 (Cell Signaling Technology, 2775), anti-AIF1/IBA1 (WAKO, 019–19741), anti-SOX2 (Millipore, AB5603); rat anti-MKI67/Ki67 (BioLegend, 151213), anti-MBP (Millipore, MAB386); guinea pig anti-DCX (Millipore, AB2253). Secondary antibodies were goat anti-rabbit IgG-FITC (111–095-003), goat anti-rabbit IgG-Texas red (111–586-046), goat anti-mouse IgG-FITC (115–095-003), goat anti-mouse IgG-Texas Red (115–295-003), goat anti-mouse IgM-rhodamine (115–025-020), donkey anti-guinea pig IgG-Texas Red (706–586-148), goat anti-mouse IgG-HRP (115–035-003), and goat anti-rabbit IgG-HRP (111–035-144) all from Jackson Immunology.
Histology and immunofluorescence (IF)
Mice were euthanized using CO2, and brain was harvested during necropsy. Fixation was carried out for 16 h at 4°C using 4% (w:v) freshly made, pre-chilled PFA. The brain tissues were all sagittally separated into two hemispheres through midline and one hemisphere was embedded in paraffin, sectioned at 5 μm. Slides from histologically comparable positions (triangular lateral ventricle with intact RMS) were stained with hematoxylin and eosin (H&E) for routine histological examination or left unstained for immunofluorescence (IF). H&E-stained sections were examined under a BX41 light microscope (Olympus America, Inc., Center Valley, PA), and images were captured with an Olympus digital camera (model DP70) using DP Controller software (Version 1.2.1.10 8). For IF, unstained tissues were first deparaffinized in 3 washes of xylene (3 min each) and then were rehydrated in graded ethanol solutions (100, 95, 70, 50, and 30%). After heat-activated antigen retrieval (Retriever 2000, PickCell Laboratories B.V., Amsterdam, Holland) according to the manufacturer’s specifications, sections were treated with Protein Block Serum Free (DAKO Corp, X0909) at room temperature for 10 min. Slices were then incubated with the primary antibodies at 4°C for 16 h in a humidified chamber, washed in PBS for 3 times (5 min each) and incubated with the 1:200 secondary antibodies for 1 h at room temperature. After incubation with secondary antibodies and washed in PBS for 3 times (5 min each), nuclei were stained with DAPI and mounted with Vectashield mounting medium (Vector Laboratories, H-1000-10). IF images of anatomically comparable sections from WT and KI brains were examined under a BX41 light microscope (Olympus) equipped with a 20 × 0.5 NA UPlanFl air objective lens, and images were captured at room temperature with a digital camera (model DP70; Olympus) using DP Controller software (Version 1.2.1.10 8). Lengths, areas and the number of cells were quantified using the Cell counter plugin from ImageJ software package (NIH). For each staining, at least 4 sections per animal will be used for image acquiring and quantification. To quantify GFAP+ NES – cells and S100B+ cells in SVZ, we added up all GFAP+ NES – cells and S100B+ cells in 12 consecutive brain sections for each animal and normalized the cell number with the combined SVZ volume (mm3).
BrdU incorporation assay and TUNEL assay
BrdU (Sigma, B5002) was administrated intra-peritoneally (I.P.) at 100 μg/gram for 3 times with 2-h intervals. Mice were euthanized 3 weeks later (long term retention), and tissues were processed as described above. For BrdU detection, the samples were treated with 2 M HCl at room temperature for 20 min to denature the nucleotides and then neutralized with 0.1 M sodium borate at room temperature for another 20 min. After 3 washes in PBS (5 min each), slides were incubated with mouse anti-BrdU antibody and secondary antibodies as described in IF staining. Nuclei were stained with DAPI and mounted with Vectashield mounting medium (Vector Laboratories, H-1000-10). For IF and detection of BrdU in the same tissue, IF was carried out first and samples were post-fixed with 4% PFA at room temperature for 20 min before nucleotide denaturing with HCl. Histological examination and digital photography were carried out as described above. For quantification of BrdU+ cells in SVZ, we added up all BrdU+ cells in 12 consecutive brain sections for each animal and normalized the BrdU+ cell number with the combined SVZ volume (mm3).
Apoptotic cells were detected by the TUNEL method according to the protocol provided by the manufacture within the In Situ Cell Death Detection Kit-TMR Red (Roche, 12156792910).
Temozolomide treatment
Temozolomide (TMZ; Cayman, 14163) was prepared at 10 mg/ml by adding 100 mg to 2.5 ml dimethyl sulfoxide (DMSO, Fisher BioReagents, BP231-100), heating to 37°C for 1 h with vortexing several times, which dissolved most of the TMZ. PBS was heated to boiling, allowed to cool for 2–3 min, then 7.5 ml added to the TMZ-DMSO, vortexed, and then cooled on ice. TMZ was administered by IP injection at 100 mg/kg once/day for 3 d. Mice were weighed each day to determine the amount to inject. Mice were euthanized 14 d after the last TMZ injection for tissue collection.
Fluorescence-activated cell sorting (FACS)
Dissociated cells from neurospheres were stained with MitoTracker Green (Invitrogen, M7514) and MitoTracker Red (Invitrogen, M7512) at 20 nM for 15 min at 37°C, or with 2′-7′ – dichlorofluorescein diacetate (DCFDA, Sigma, D6883) at 5 µM for 15 min at 37°C, according to manufacturer’s instructions. Cells were resuspended in 2 µg/ml DAPI to distinguish live from dead cells. Flow cytometry was performed on a FACSVantage SE-dual laser, three-line flow cytometer or an FACSCanto (BD Biosciences). Dysfunctional mitochondria was gated with decreased ratio of respiring mitochondria to total mitochondrial mass (MitoTracker Red or MitoTracker Green) in dissociated NSCs as previously described.
Protein extraction, co-IP, SDS-PAGE and western blotting
Cells were used for protein extraction by homogenization in modified radioimmune precipitation assay buffer (50 mm Tris-HCl [Fisher BioReagents, BP24271], pH 7.4, 1% Triton X-100 [ACROS Organics, AC215680010], 0.2% sodium deoxycholate [Sigma, D6750], 0.2% SDS [Sigma, 436143], 1 mm sodium EDTA [Millipore, 324503]) supplemented with protease inhibitors (5 μg/ml leupeptin [Thermo Fisher Scientific, 78435], 5 μg/ml aprotinin [Sigma, A3886-1VL], and 1 mm phenylmethylsulfonyl fluoride [Sigma, 10837091001]). After removing cell debris by centrifugation at 15,000 g for 10 min at 4°C, protein concentration was determined using Bio-Rad protein assay reagent (Bio-Rad, 5000001). Lysate was subjected to immunoprecipitation with anti-BCL2 monoclonal antibody-conjugated agarose beads (Santa Cruz Biotechnology, 7382 AC). The lysates and immune-precipitated agarose beads were boiled for 5 min in 1× SDS sample buffer (50 mm Tris-HCl, pH 6.8, 12.5% glycerol [Fisher BioReagents, BP229-1], 1% SDS, 0.01% bromophenol blue [Fisher BioReagents, BP114-25]) containing 5% β-mercaptoethanol (Fisher BioReagents, BP176-100). They were then analyzed by SDS-PAGE followed by western blotting using various antibodies, as described previously [Citation24,Citation37].
Buried food pellet test
The buried food pellet test was employed except a mouse chow pellet was used instead of an exogenously scented pellet. Becn1 KI and WT mice from 18–22 months were placed on a food-restricted protocol (starvation of food for 24 h) starting one day before testing and during the experimental period. A single mouse was placed at random in a test cage (45 cm × 24 cm × 20 cm) to recover a 1-g food pellet (Research Diets, D11112201). The food pellet was buried approximately 0.5 cm below the surface of a 3-cm deep layer of mouse bedding material. Latency to find the food pellet was defined as the time between when the mouse was placed in the cage and when the mouse uncovered the food pellet and grasped it in its forepaws and/or teeth. Animals were allowed to consume the pellet they found and were then returned to their home cage.
Statistical analysis
Lengths, areas and the number of cells from comparable sections were quantified using the Image J software package. Statistical significance was evaluated by two-way ANOVA, Wilcoxon matched-pairs signed rank test, student’s t-test, with p < 0.05 as indicative of statistical significance using Graph Pad Prism (Version 5.0). The number of animals used for quantification was indicated in the figure legends.
Disclosure of potential conflicts of interest
No potential conflict of interest was reported by the author(s).
Supplemental Material
Download Zip (3.8 MB)Acknowledgments
We thank Dr. Xin Tang and Mr. Harsh Patel in Dr. Wang’s lab and other people from Dr. Jun-Lin Guan’s lab for careful reading of the manuscript and helpful suggestions.
Supplementary material
Supplemental data for this article can be accessed here.
Additional information
Funding
Related Research Data
References
- Ermolaeva M, Neri F, Ori A, et al. Cellular and epigenetic drivers of stem cell ageing. Nat Rev Mol Cell Biol. 2018;19(9):594–610.
- Keyes BE, Fuchs E. Stem cells: aging and transcriptional fingerprints. J Cell Biol. 2018;217(1):79–92.
- Ahmed AS, Sheng MH, Wasnik S, et al. Effect of aging on stem cells. World J Exp Med. 2017;7(1):1–10.
- Bouab M, Paliouras GN, Aumont A, et al. Aging of the subventricular zone neural stem cell niche: evidence for quiescence-associated changes between early and mid-adulthood. Neuroscience. 2011;173:135–149.
- Conover JC, Shook BA. Aging of the subventricular zone neural stem cell niche. Aging Dis. 2011;2(1):49–63.
- Rubinsztein DC, Marino G, Kroemer G. Autophagy and aging. Cell. 2011;146(5):682–695.
- Nakamura S, Yoshimori T. Autophagy and Longevity. Mol Cells. 2018;41(1):65–72.
- Jia K, Levine B. Autophagy and longevity: lessons from C. elegans. Adv Exp Med Biol. 2010;694:47–60.
- Hansen M, Rubinsztein DC, Walker DW. Autophagy as a promoter of longevity: insights from model organisms. Nat Rev Mol Cell Biol. 2018;19(9):579–593.
- Wong SQ, Kumar AV, Mills J, et al. Autophagy in aging and longevity. Hum Genet. 2020;139(3):277–290.
- Galluzzi L, Bravo-San Pedro JM, Kroemer G. [Autophagy, fitness and longevity]. Med Sci (Paris). 2017;33(3):246–251.
- Pattison CJ, Korolchuk VI. Autophagy: ‘Self-Eating’ Your Way to Longevity. Subcell Biochem. 2018;90:25–47.
- Woodall BP, Gustafsson AB. Autophagy-A key pathway for cardiac health and longevity. Acta Physiol (Oxf). 2018;223(4):e13074.
- Madeo F, Tavernarakis N, Kroemer G. Can autophagy promote longevity? Nat Cell Biol. 2010;12(9):842–846.
- Eisenberg T, Knauer H, Schauer A, et al. Induction of autophagy by spermidine promotes longevity. Nat Cell Biol. 2009;11(11):1305–1314.
- Byrne J, Wilhelm T, Richly H. Inhibition of neuronal autophagy mediates longevity. Aging (Albany NY). 2017;9(9):1953–1954.
- Sampaio-Marques B, Burhans WC, Ludovico P. Longevity pathways and maintenance of the proteome: the role of autophagy and mitophagy during yeast ageing. Microb Cell. 2014;1(4):118–127.
- Toth ML, Sigmond T, Borsos É, et al. Longevity pathways converge on autophagy genes to regulate life span in Caenorhabditis elegans. Autophagy. 2008;4(3):330–338.
- Jiao J, Demontis F. Skeletal muscle autophagy and its role in sarcopenia and organismal aging. Curr Opin Pharmacol. 2017;34:1–6.
- Yan Y, Finkel T. Autophagy as a regulator of cardiovascular redox homeostasis. Free Radic Biol Med. 2017;109:108–113.
- Madeo F, Zimmermann A, Maiuri MC, et al. Essential role for autophagy in life span extension. J Clin Invest. 2015;125(1):85–93.
- Zhu L, Dong C, Sun C, et al. Rejuvenation of MPTP-induced human neural precursor cell senescence by activating autophagy. Biochem Biophys Res Commun. 2015;464(2):526–533.
- Garcia-Prat L, Martínez-Vicente M, Perdiguero E, et al. Autophagy maintains stemness by preventing senescence. Nature. 2016;529(7584):37–42.
- Wang C, Liang CC, Bian ZC, et al. FIP200 is required for maintenance and differentiation of postnatal neural stem cells. Nat Neurosci. 2013;16(5):532–542.
- Ho TT, Warr MR, Adelman ER, et al. Autophagy maintains the metabolism and function of young and old stem cells. Nature. 2017;543(7644):205–210.
- Audesse AJ, Dhakal S, Hassell L-A, et al. FOXO3 directly regulates an autophagy network to functionally regulate proteostasis in adult neural stem cells. PLoS Genet. 2019;15(4):e1008097.
- Leeman DS, Hebestreit K, Ruetz T, et al. Lysosome activation clears aggregates and enhances quiescent neural stem cell activation during aging. Science. 2018;359(6381):1277–1283.
- Oh J, Lee YD, Wagers AJ. Stem cell aging: mechanisms, regulators and therapeutic opportunities. Nat Med. 2014;20(8):870–880.
- Revuelta M, Matheu A. Autophagy in stem cell aging. Aging Cell. 2017;16(5):912–915.
- Cutler RR, Kokovay E. Rejuvenating subventricular zone neurogenesis in the aging brain. Curr Opin Pharmacol. 2019;50:1–8.
- Qu X, Yu J, Bhagat G, et al. Promotion of tumorigenesis by heterozygous disruption of the beclin 1 autophagy gene. J Clin Invest. 2003;112(12):1809–1820.
- Pattingre S, Tassa A, Qu X, et al. Bcl-2 antiapoptotic proteins inhibit Beclin 1-dependent autophagy. Cell. 2005;122(6):927–939.
- Kang R, Zeh HJ, Lotze MT, et al. The Beclin 1 network regulates autophagy and apoptosis. Cell Death Differ. 2011;18(4):571–580.
- Fernandez AF, Sebti S, Wei Y, et al. Disruption of the beclin 1-BCL2 autophagy regulatory complex promotes longevity in mice. Nature. 2018;558(7708):136–140.
- Shibata M, Lu T, Furuya T, et al. Regulation of intracellular accumulation of mutant Huntingtin by Beclin 1. J Biol Chem. 2006;281(20):14474–14485.
- Stavoe AK, Gopal PP, Gubas A, et al. Expression of WIPI2B counteracts age-related decline in autophagosome biogenesis in neurons. eLife. 2019;8.
- Wang C, Chen S, Yeo S, et al. Elevated p62/SQSTM1 determines the fate of autophagy-deficient neural stem cells by increasing superoxide. J Cell Biol. 2016;212(5):545–560.
- Wen J, Yeo S, Wang C, et al. Autophagy inhibition re-sensitizes pulse stimulation-selected paclitaxel-resistant triple negative breast cancer cells to chemotherapy-induced apoptosis. Breast Cancer Res Treat. 2015;149(3):619–629.
- Mich JK, Signer RA, Nakada D, et al. Prospective identification of functionally distinct stem cells and neurosphere-initiating cells in adult mouse forebrain. eLife. 2014;3:e02669.
- Lepousez G, Valley MT, Lledo PM. The impact of adult neurogenesis on olfactory bulb circuits and computations. Annu Rev Physiol. 2013;75:339–363.
- Yang M, Crawley JN. Simple behavioral assessment of mouse olfaction. Curr Protoc Neurosci. 2009;48(1). DOI:https://doi.org/10.1002/0471142301.ns0824s48
- Lopez-Otin C, Blasco MA, Partridge L, et al. The hallmarks of aging. Cell. 2013;153(6):1194–1217.
- Liu F, Lee JY, Wei H, et al. FIP200 is required for the cell-autonomous maintenance of fetal hematopoietic stem cells. Blood. 2010;116(23):4806–4814.
- Mortensen M, Soilleux EJ, Djordjevic G, et al. The autophagy protein Atg7 is essential for hematopoietic stem cell maintenance. J Exp Med. 2011;208(3):455–467.
- Ma Y, Qi M, An Y, et al. Autophagy controls mesenchymal stem cell properties and senescence during bone aging. Aging Cell. 2018;17(1):1.
- Pyo JO, Yoo S-M, Ahn -H-H, et al. Overexpression of Atg5 in mice activates autophagy and extends lifespan. Nat Commun. 2013;4:2300.
- Schaffner I, Minakaki G, Khan MA, et al. FoxO function is essential for maintenance of autophagic flux and neuronal morphogenesis in adult neurogenesis. Neuron. 2018;99(6):1188–1203 e1186.
- Knobloch M, Braun SMG, Zurkirchen L, et al. Metabolic control of adult neural stem cell activity by Fasn-dependent lipogenesis. Nature. 2013;493(7431):226–230.
- Dulken BW, Buckley MT, Navarro Negredo P, et al. Single-cell analysis reveals T cell infiltration in old neurogenic niches. Nature. 2019;571(7764):205–210.
- Wang C, Yeo S, Haas MA, et al. Autophagy gene FIP200 in neural progenitors non-cell autonomously controls differentiation by regulating microglia. J Cell Biol. 2017;216(8):2581–2596.
- Doty RL, Cameron EL. Sex differences and reproductive hormone influences on human odor perception. Physiol Behav. 2009;97(2):213–228.
- Kass MD, Czarnecki LA, Moberly AH, et al. Differences in peripheral sensory input to the olfactory bulb between male and female mice. Sci Rep. 2017;7:45851.
- Ming GL, Song H. Adult neurogenesis in the mammalian brain: significant answers and significant questions. Neuron. 2011;70(4):687–702.
- Rocchi A, Yamamoto S, Ting T, et al. A Becn1 mutation mediates hyperactive autophagic sequestration of amyloid oligomers and improved cognition in Alzheimer’s disease. PLoS Genet. 2017;13(8):e1006962.