
ABSTRACT
The phagophore expands into autophagosomes in close proximity to endoplasmic reticulum (ER) exit sites (ERESs). Here, we propose that a single-pass ER transmembrane protein, SHISA5/SCOTIN, acts as an autophagy suppressor under basal condition by blocking the contact between the phagophore and ERES. HeLa cells lacking SHISA5 displayed higher levels of macroautophagy/autophagy. The enhanced autophagy in SHISA5 KO cells requires class III phosphatidylinositol 3-kinase complex I (PtdIns3K-C1) activity and functional assembly of ERES, but not ULK1 activity. A proximity ligation assay (PLA) of SEC16A (Sec16 homolog A, endoplasmic reticulum export factor)-WIPI2 (WD repeat domain, phosphoinositide interacting 2) and SEC31A (Sec31 homolog A, COPII coat complex component)-MAP1LC3B/LC3B (microtubule-associated protein 1 light chain 3 beta) demonstrated that contact between the ERES and phagophore increased in SHISA5 KO cells, and the cytosolic domain of SHISA5 was sufficient to rescue this phenotype. Close proximity between ERES and phagophore in SHISA5 KO cells was also visualized by performing an ultrastructure correlative image analysis of SEC31A associated with LC3-positive membranes. Furthermore, we observed that SHISA5 was located near ERES under basal conditions, but displaced away from ERES under autophagy-inducing conditions. These data suggest that SHISA5 functions to block spontaneous contact between ERES and phagophore, and the blockage effect of SHISA5 should be relieved for the proper induction of autophagy.
Abbreviations
ATG2: autophagy related 2; BECN1: beclin 1; COPII: coat protein II; DMSO: dimethyl sulfoxide; EBSS: Earle’s balanced salt solution; EGFP: enhanced green fluorescent protein; ER: endoplasmic reticulum; ERES: ER exit site(s); GFP: green fluorescent protein; H89: H-89 dihydrochloride hydrate; LAMP1: lysosomal-associated membrane protein 1; MAP1LC3/LC3: microtubule-associated protein 1 light chain 3; MTORC1: mechanistic target of rapamycin kinase complex 1; NS5A: nonstructural protein 5A; PIK3C3/VPS34: phosphatidylinositol 3-kinase catalytic subunit type 3; PLA: proximity ligation assay; PtdIns3P: phosphatidylionositol-3-phosphate; RB1CC1/FIP200: RB1 inducible coiled-coil 1; RFP: red fluorescent protein; RPS6KB1/S6K: ribosomal protein S6 kinase B1; SBP: streptavidin binding protein; SEC16A: SEC16 homolog A, endoplasmic reticulum export factor; SEC31A: SEC31 homolog A, COPII coat complex component; siRNA: small interfering RNA; Str: streptavidin; ULK1: unc-51-like autophagy activating kinase 1; VSVG: vesicular stomatitis virus glycoprotein; WIPI2: WD repeat domain, phosphoinositide interacting 2; WT: wild type
Introduction
Macroautophagy/autophagy is an evolutionarily conserved catabolic pathway that functions to degrade cytoplasmic substrates. Cytoplasmic cargoes trapped within double-membrane organelles, called autophagosomes are transported to and degraded in lysosomes in mammalian cells or vacuoles in yeast [Citation1]. Autophagy is a constitutive process that maintains normal cellular homeostasis, but its induction is also massively increased in response to stimulation with stressors, such as nutrient or energy starvation, damaged organelles, or microorganism invasion [Citation2]. As either excessive or insufficient induction of autophagy can be detrimental, each step of autophagosome biogenesis, from nucleation of the phagophore, to expansion and maturation of the membrane, and fusion with lysosomes, is tightly controlled [Citation3,Citation4].
Autophagy begins with de novo synthesis of the phagophore, a short, flat, cup-shaped double-membrane structure. Upon the induction of autophagy, nucleation of the phagophore occurs, and the phagophore expands, forming a spherical double-membrane structure called the autophagosome [Citation1]. Membrane sources for the phospholipids used for elongation of the phagophore are thought to include the endoplasmic reticulum (ER), Golgi complex, mitochondria, and plasma membranes [Citation5–10]. Although the mechanism of phospholipid transports to the growing phagophore is unclear, distinct models have been proposed that lipids are supplied via vesicular addition [Citation8,Citation11] or direct transfer from the membrane compartments in close proximity [Citation12–15].
The autophagosome formation site in yeast, the so-called phagophore assembly site, is localized at the contact between the vacuolar membrane and ER [Citation16–18]. In contrast, the phagophore in mammals was observed to be closely associated with specialized subdomains of the ER [Citation19,Citation20]. ER exit sites (ERESs) are sites of coat protein II (COPII) assembly for the trafficking of secretory cargoes from the ER and a subdomain of the ER proximal to nascent autophagosomes in both yeast and mammalian cells. Pioneering screens in yeast suggested the participation of ERESs in autophagy, as subgroups of COPII assembly components – such as Sec16, Sec23, and Sec24 – are required for autophagosome formation [Citation21]. ERES marker proteins are colocalized with a cluster of ULK1 (unc-51-like autophagy activating kinase 1) complexes, the first protein complex to be recruited to the ER membrane to initiate autophagy [Citation22]. Atg8 (autophagy-related protein 8)/LC3-positive autophagosomal membranes were also reported to localize in close proximity to ERES in both yeast and mammals [Citation19,Citation23]. The open edge of the expanding phagophore was observed by electron microscopy and cryo-soft-X-ray microscopy to connect with the ER membrane, referred to as ER-phagophore contact [Citation6,Citation7,Citation24,Citation25].
ER-phagophore contact is established by tethering proteins in ER membranes and the phagophore [Citation26–29]. The ER transmembrane proteins VAPA and VAPB interact with the ULK1 complex, forming the ER-phagophore contact and contributing to progression of the phagophore into a mature autophagosome [Citation27]. The autophagy-related protein ATG2 also functions to tether the expanding phagophore to the ER [Citation28,Citation29]. The N-terminal region of ATG2 associates with the ER membrane, while the C-terminal amphipathic helix domain of ATG2, along with WIPI (WD repeat domain, phosphoinositide interacting) proteins, is tethered to the phagophore. ER-phagophore contact was observed until the detachment of the phagophore from the ER for the completion of autophagosome formation [Citation30,Citation31].
ER-phagophore contact produces an anchor point for assembly of the autophagy machinery. The interaction between COPII proteins and the Atg1 complex (ULK1 complex in mammals) strengthens the scaffold for the initial assembly of factors required for autophagosome biogenesis [Citation19,Citation32,Citation33]. A small punctum consisting of ULK1 that later clusters in the larger spherical autophagy machinery, emerges from the tubulovesicular membranes of the ER, where ATG9 vesicles align [Citation22]. In addition to ATG9, ATG2 and WIPI2 are enriched at the edge of the expanding phagophore anchored to the ER membrane [Citation19,Citation23]. Because ATG2 possesses lipid-transfer activity, it was also proposed that phospholipids are directly transferred from the ER to the growing phagophore at the contact [Citation13,Citation14,Citation34]. A recent study demonstrated spatially restricted phospholipid synthesis at physical contact between the ER and phagophore [Citation12]. Since COPII vesicles that originate from the ERES are known to mediate lipid transport for expansion of the phagophore, both vesicular and nonvesicular transfer of phospholipids may occur at contact sites between ERESs and the phagophore [Citation32,Citation35].
Although autophagy is transiently induced in response to stress, basal autophagy occurs at a constitutive level under normal growing conditions. Therefore, to maintain normal cellular homeostasis, the induction of unwanted autophagy should be properly suppressed. While there has been considerable research on how the association of ATGs with the membrane is achieved upon autophagy induction, relatively little is known about how constitutive autophagy is controlled. Here, we propose steps at the contact site between the ERES and phagophore that act as an efficient way to restrain constitutive autophagy under basal conditions. We show that SHISA5, a single-pass ER transmembrane protein, is a novel negative regulator of constitutive autophagy. SHISA5 specifically blocks contact between the ERES and phagophore under normal cellular conditions but not under conditions of stress-induced autophagy.
Results
Enhanced autophagosome formation was observed in SHISA5-depleted cells
We previously reported that overexpressed SHISA5, a single-pass ER transmembrane protein, is specifically associated with the nonstructural 5A (NS5A) protein of hepatitis C virus (HCV) in infected Huh7 human hepatocarcinoma cells. SHISA5 was found to bring NS5A into the autolysosomal compartment and aid in its degradation in an autophagy-dependent manner. In these cells, however, silencing endogenous SHISA5 does not significantly alter autophagic flux [Citation36]. In contrast, SHISA5 knockdown in other cell lines (HEK293 human embryonic kidney cells and HeLa human cervical carcinoma cells) resulted in enhanced autophagy, as demonstrated by increased processing of cytosolic MAP1LC3/LC3 (microtubule-associated protein 1 light chain 3)-I to autophagosomal LC3-II ().
Figure 1. SHISA5-depletion enhanced autophagy. (A) Left panel: western blot analysis of LC3 levels in HeLa, A549, U2OS, and HEK293 cells treated with control or SHISA5 siRNAs. Right panel: quantifications of LC3-II levels normalized to housekeeping protein level. The level of LC3-II in control siRNA transfected cells is set to 1.00. (B) TEM images of WT cells and SHISA5 KO HeLa cells. The boxed areas showing SHISA5 KO cells are magnified (boxes i, ii, and iii). White arrowheads point to autolysosomes or lysosomes. Black arrowheads indicate autophagosomal membrane. Black arrow indicates amphisomes. Quantifications of the electron-dense structures in the cells are shown in the right panel. The error bars indicate SD (n = 15 for WT and 19 for SHISA5 KO cells). See Figure S1B for the source images used for representative images. (C) Autophagosomal structures juxtaposed with ER. Black arrowheads indicate where ER and the autophagosomal membranes closely reside. See Figure S1C for the source images used for representative images. Scale bar: 1 μm. (D) WT and SHISA5 KO HeLa cells were transfected with empty vector or SHISA5-DsRed plasmid (cyan) for 48 h. Representative immunofluorescence images showing LC3B (green) and LAMP1 (red) staining. (E) Quantification of the LC3+ particles (left panel), LAMP1− LC3+ particles (middle panel), and LAMP1+ LC3+ particles (right panel) in the images performed using ImageJ. The error bars indicate SEMs (n = 16–23). Scale bar: 10 μm.
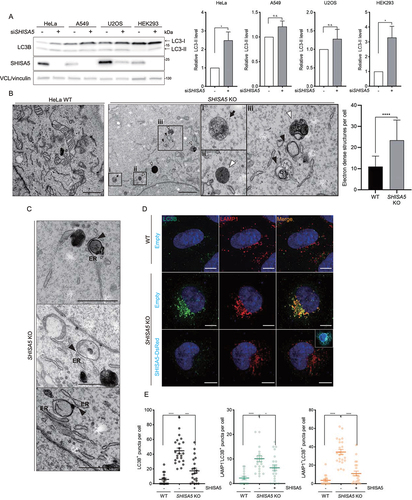
To address the potential involvement of SHISA5 in autophagy, we therefore disrupted the genomic loci of endogenous SHISA5 using the CRISPR-Cas9 system in HeLa cells (Fig. S1A) and examined the formation of autophagosomes in more detail. Under the transmission electron microscope (TEM), significantly more electron-dense single-membrane structures, which were assumed to be autolysosomes or lysosomes, were observed in SHISA5 knockout (KO) HeLa cells (). Amphisomes were also easily observed in SHISA5 KO cells. In addition, TEM revealed that double membraned vesicles, identified as autophagosomal structures, were increased in SHISA5 KO cells. Of note, these autophagosomal structures were observed proximal to the ER (). Immunofluorescence assays using anti-LC3B and anti-LAMP1 (lysosomal-associated membrane protein 1) antibodies confirmed that autophagic structures accumulated in SHISA5 KO cells (). To validate that the observed phenotype was the direct outcome of SHISA5 deficiency, autophagy in SHISA5 KO cells reconstituted with SHISA5-DsRed was tested. Upon SHISA5 expression plasmid transfection, the numbers of the LC3+ particles (autophagosomal structures including autolysosomes, autophagosomes, and phagophore), LAMP1− LC3+ particles (autophagosomal membranes including the phagophore and autophagosomes), and LAMP1+ LC3+ particles (autolysosomes) were significantly lower than those in cells transfected with the control plasmid ().
Basal autophagy increased in SHISA5-depleted cells
Next, we tested whether SHISA5 also functions during stress-induced autophagy. For this experiment, both WT and SHISA5 KO HeLa cells were cultured with Earle’s balanced salt solution (EBSS) deprived of amino acids, and the number of LC3B-positive puncta and colocalization of LC3B and LAMP1 were measured (). Upon starvation, autophagy was well induced, as the number of LC3B-positive puncta increased, along with the colocalization of LC3B with LAMP1, in WT cells. Unlike under nutrient-rich culture conditions, however, further induction of autophagy was not observed in starved SHISA5 KO cells. Instead, the number of LC3B-positive autophagosomes detected in starved SHISA5 KO cells was similar to that in starved WT cells. Moreover, reconstitution with SHISA5-DsRed in SHISA5 KO cells was not effective in altering the extent of starvation-induced autophagy ().
Figure 2. SHISA5-depletion enhanced autophagy only under basal conditions. (A) Representative immunofluorescence images of LC3B (green) and LAMP1 (red) in WT and SHISA5 KO HeLa cells. Cells were transfected with empty vector or SHISA5-DsRed plasmid (cyan). Then cells were incubated in complete medium (NT) or EBSS 2 h. (B) The numbers of LC3 puncta in each cell were quantified. (C) The colocalization of LC3B and LAMP1 was calculated by determining the Pearson’s correlation coefficient using ImageJ (n = 10–16). (D) Representative immunofluorescence images of LC3B (green) in WT and SHISA5 KO HeLa cells. Cells were transfected with empty vector or SHISA5-DsRed plasmid (cyan). Then cells were treated with DMSO (NT) or 100 nM of Torin 1 for 2 h. (E) The numbers of LC3B puncta per cells were quantified. (F) WT and SHISA5 KO HeLa cells were untreated with DMSO or Baf A1 (100 nM) for 4 h before cell lysis. Western blot analysis for LC3B and TUBA1B/α-tubulin is shown in the upper panel. Quantification of LC3-II levels normalized to TUBA1B level is shown in the lower panel. (G) Left panel: confocal images of WT HeLa cells and SHISA5 KO cells stably expressing mRFP-GFP-LC3B. Cells were incubated in complete medium (NT) or EBSS for 2 h. See Figure S2B for the images before merge. Right panel: the number of red and yellow puncta per cell was determined using ImageJ plugins and plotted. The error bars indicate SEMs. Scale bar: 10 μm.
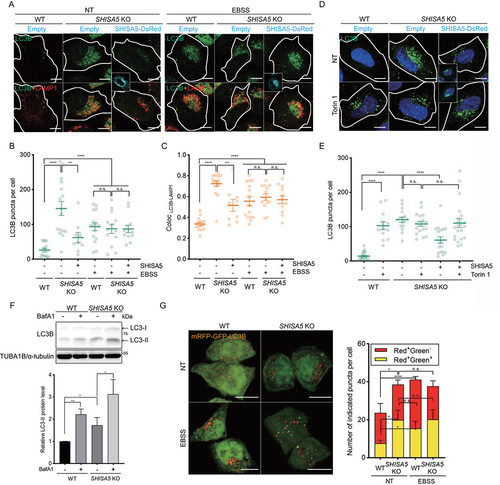
Under nutrient-rich culture conditions, the constitutive induction of basal autophagy is suppressed by MTOR (mechanistic target of rapamycin kinase) complex 1 (MTORC1), the master regulator of cellular metabolism [Citation37,Citation38]. The active form of MTORC1 phosphorylates ULK1 at residue S757, which prevents the assembly of downstream complexes, including class III phosphatidylinositol 3-kinase complex I (PtdIns3K-C1). The treatment of cells with Torin 1, an inhibitor of MTOR, therefore relieves the inhibitory effect of MTORC1 on ULK1 and has an effect on autophagy induction similar to the effect of starvation [Citation37]. As expected, Torin 1 treatment strongly induced the formation of LC3B-positive puncta in WT HeLa cells ()). In contrast, Torin 1 treatment in SHISA5 KO cells was noneffective as a further increase in LC3B-positive puncta was not observed. Moreover, overexpression of SHISA5-DsRed was ineffective in Torin 1-treated SHISA5 KO cells, similar to the results under starvation-induced autophagy conditions. Overall, the activity of SHISA5 was nullified under conditions of autophagy induction.
We checked whether the increased autophagic structures observed in SHISA5 KO cells were derived from excessive autophagosome formation or from the blockade of autolysosome turnover. Bafilomycin A1 (Baf A1) was used to distinguish between these possibilities, as it inhibits the latter stages of autophagy – fusion between autophagosomes and lysosomes – by inhibiting the vacuolar-type H+-translocating ATPase [Citation39]. The accumulation of LC3-II in WT HeLa cells increased as a result of Baf A1 treatment, reflecting the amounts of autophagic flux under basal conditions. When treated with Baf A1, accumulation of LC3-II still observed in SHISA5 KO cells (), suggesting that the enhanced LC3-II in SHISA5 KO cells likely stemmed from the activation of autophagic flux rather than the blockade of autophagic flux. Separately, we generated tandem monomeric red fluorescent protein (mRFP)-green fluorescent protein (GFP)-LC3 protein-expressing HeLa and SHISA5 KO stable cells [Citation40,Citation41] and monitored the fusion of autophagosomes to lysosomes (). Under nutrient-rich basal conditions, both immature autophagosomes, shown as yellow puncta (RFP+ GFP+), and acidified autolysosomes, shown as red puncta (RFP+ GFP−), were significantly increased in SHISA5 KO cells, again suggesting that SHISA5 acts during the early stage of autophagosome formation. Of note, the fold induction of yellow fraction in the SHISA5 KO cells under basal conditions was similar to that observed in EBSS-incubated WT cells. Similar data were obtained using SHISA5 siRNA in mRFP-GFP-LC3 protein-expressing HeLa cells, too (Fig. S2A). These data all together suggest that SHISA5 functions to suppress the formation of autophagic structures under basal conditions.
SHISA5 blocked basal autophagy in a PtdIns3K-C1-dependent manner
To investigate how basal autophagy was enhanced in SHISA5 KO cells, we considered the cascades that activate autophagy induction and attempted to identify steps in which SHISA5 intervenes. MTORC1 promotes cell growth and suppresses autophagy via the well-characterized MTORC1 substrates RPS6KB1/S6K (ribosomal protein S6 kinase B1) and ULK1, respectively. Starvation inhibits MTORC1, thereby downregulating inhibitory phosphorylation of the ULK1 complex. Multiple copies of the ULK1 complex are assembled at the ER membrane and phosphorylate BECN1, resulting in the recruitment of phosphatidylinositol 3-phosphate (PtdIns3P)-binding proteins and lipidation of LC3/GABARAPs on the nascent phagophore. During expansion of the phagophore, the ATG2-WIPI complex, which shows lipid-transfer activity, functions as a tether between the two membranes (). As a first step, whether SHISA5 acts during MTORC1 inactivation was tested. To this end, the levels of phosphorylated ULK1 (S757) and RPS6KB1 (T389), which increased upon MTORC1 inactivation, were examined (). In SHISA5 KO cells, however, the levels of phosphorylated ULK1 (S757) and RPS6KB1 (T389) were comparable to those in WT cells, implying that SHISA5 deficiency does not inactivate MTOR. Next, we asked whether SHISA5 functions during ULK1 activation by examining the requirement of ULK1 activity for the induction of basal autophagy in SHISA5 KO cells. The ULK1 complex consists of RB1CC1/FIP200 (RB1 inducible coiled-coil 1), ATG13, ATG101, and the kinase ULK1 [Citation42]. Among these components, RB1CC1 was previously demonstrated to act as an essential scaffold protein for assembly of the complex, and its genetic ablation abrogated the canonical autophagy pathway [Citation43]. We silenced RB1CC1 expression and monitored LC3-positive puncta formation in WT and SHISA5 KO cells. Although RB1CC1 was not present, significantly increased numbers of accumulated LC3B-positive puncta were still observed in SHISA5 KO cells (). To corroborate this observation, we also used SBI-0206965, a selective inhibitor of the kinase ULK1, at 50 μM, the highest dose at which it could inhibit the phosphorylation of ULK1 substrates when ULK1 was overexpressed [Citation44]. Although ULK1 activity was inhibited, the number of accumulated LC3 puncta was comparable to that in SHISA5 KO cells (). Silencing of both of the Ulk1 and Atg13 genes also failed to reduce the number of LC3 puncta in SHISA5 KO cells (Fig. S3B–D). Collectively, these data suggest that the activity of the ULK1 complex was not required for the enhancement of basal autophagy in SHISA5 KO cells.
Figure 3. The loss of SHISA5 enhanced basal autophagy in a PtdIns3K-C1-dependent manner. (A) Schematic diagram depicting the genetic hierarchy of the early stage in autophagosome biogenesis at ER membrane. (B) Immunoblot analysis of phospho-ULK1 S757 (MTORC1 phosphorylation site), ULK1, phospho-RPS6KB1 T389 (MTORC1 phosphorylation site), RPS6KB1, LC3B, and TUBA1B in WT and SHISA5 KO HeLa cell lysates. Quantifications of band intensity from three independent experiments are noted. (C) Upper-left panel: representative immunofluorescence images of LC3B (green) in WT and SHISA5 KO HeLa cells. Cells were transfected with control or RB1CC1 siRNA and then incubated in complete medium (NT) or EBSS for 2 h. Lower-left panel: RB1CC1 knockdown efficiency was confirmed by western blot. Right panel: the number of LC3B puncta per cell was quantified (n = 15–22). (D) Right panel: representative immunofluorescence images of LC3B (green) in WT and SHISA5 KO HeLa cells. Cells were treated with DMSO or 50 μM of SBI-0206965 for 2 h in either complete medium (NT) or EBSS. Left panel: the LC3B puncta per cell were quantified (n = 13–27). (E) Upper-left panel: representative immunofluorescence images of WT and SHISA5 KO HeLa cells stained for LC3B (green) following transfection with control or PIK3C3 siRNA. Upper-right panel: the LC3B puncta per cell were quantified (n = 31–35). Lower panel: PIK3C3 knockdown efficiency was confirmed by western blot. (F) Left panel: representative immunofluorescence images of WT and SHISA5 KO HeLa cells stained for LC3B (green) following DMSO or SAR405 (1 μM) treatment for 2 h. Right panel: the LC3B puncta per cell were quantified (n = 15–21). All scale bars: 10 μm.
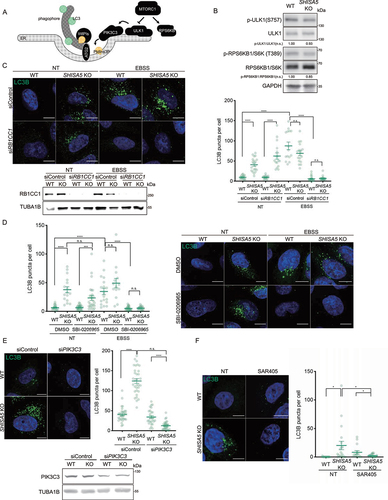
When the activity of PtdIns3K-C1 was perturbed, however, dramatic results were observed. The PtdIns3P-generating PtdIns3K-C1 is a downstream complex activated and recruited by the activated ULK1 complex. When PIK3C3, the active catalytic subunit of the PtdIns3K-C1, was silenced, LC3-positive puncta disappeared in SHISA5 KO cells ( and Fig. S3E). Silencing of the other components of PtdIns3K-C1, BECN1, also reduced the number of LC3-positive puncta in SHISA5 KO cells (Fig. S3E, F). Pharmacological inhibition of PtdIns3K-C1 activity using SAR405, a PIK3C3-specific inhibitor, and wortmannin, an inhibitor of PtdIns3K enzymatic activity, had an effect similar to that of PIK3C3 silencing ( and Fig. S3G), indicating that SHISA5 intervened in autophagy induction at steps in which PtdIns3K-C1 activity is required.
Our data suggest that SHISA5 depletion correlates with the enhanced activity of PIK3C3, the main producer of cellular PtdIns3P. Therefore, to test whether the autophagic PtdIns3P level was indeed increased in SHISA5-deficient cells, we generated EGFP-2xFYVE expressing HeLa WT and SHISA5 KO cells and microscopically probed PtdIns3P. As expected, the number of FYVE puncta increased in the EBSS-starved WT cells (Fig. S3H), and the FYVE puncta were observed near the ER membrane and colocalized with LC3 particles (Fig. S3I). In SHISA5-deficient cells, increased number of FYVE puncta was clearly observed under basal culture conditions, and the number of puncta was comparable to that observed in starvation-induced WT cells (Fig. S3H). Similar to EBSS-treated WT cells, FYVE puncta colocalized with LC3B near the ER membrane in SHISA5 KO cells, too (Fig. S3I). These data indicate that autophagic pools of PtdIns3P were increased in SHISA5-deficient cells under basal conditions.
SHISA5 blocked contact between the ER and phagophore under basal conditions
Our data thus far demonstrated that SHISA5-depletion increased the basal level of autophagy via a mechanism independent of MTORC1-ULK1 but dependent on PtdIns3K-C1 activity. As enhanced autophagy in the SHISA5 KO cells could be rescued by supplementation with SHISA5-DsRed, we postulated that SHISA5 normally functions to repress the spontaneous induction of basal autophagy. Given that SHISA5 is located at the ER membrane, where PtdIns3K complex assembles for phagophore, we hypothesized that SHISA5 interferes with contact between ER and phagophore. Our early observation of TEM analysis of SHISA5 KO cells strengthened the idea, as we frequently observed that the autophagosomal structures were closely associated with the ER in SHISA5 KO cells (). Therefore, to prove this idea, we utilized the proximity ligation assay (PLA) and the proximity between the phagophore and ER membrane was measured. To mark phagophore and ERES membrane separately, we used antibodies against WIPI2 or LC3B and SEC16A or SEC31A, respectively. Although direct interaction between WIPI2 or LC3B and SEC16A or SEC31A proteins has not been reported, we reasoned if two membranes of phagophore and ERES are close enough, we could observe ligation signal between WIPI2 or LC3B and SEC16A or SEC31A. As positive controls, HeLa cells were treated with Torin 1 for 5 minutes and the ligation signal between SEC16A and WIPI2 antibodies was measured ( and Fig. S4A). Upon Torin1 treatment, we were able to observe significant increase of ligation signal in the WT cells (). Next, we measured the ligation signal in SHISA5 KO cells under basal conditions or after treatment with Torin 1. Without Torin 1 treatment, ligation signal between SEC16A and WIPI2 was eminent in the SHISA5 KO cells, suggesting that the distance between the ER and phagophore was close in basal SHISA5 KO cells. When SHISA5 KO cells were treated with Torin 1, further enhancement of the ligation signal not detected ().
Figure 4. SHISA5 blocked ER-phagophore contact. (A) Representative images of proximity ligation assay (PLA) between SEC16A and WIPI2 in WT and SHISA5 KO HeLa cells. Cells were treated with DMSO (NT) or Torin 1 (100 nM, 5 min). As negative controls, the use of only one primary antibody (either anti-SEC16A or anti-WIPI2 antibody alone) resulted in no signal. To well visualize the PLA signal, the color lookup tables are inverted without changing the pixel value. See Figure S4B for the representative images of PLA before inverting the image display. Right panel: the number of PLA signal in each cells was quantified by the BlobFinder (n = 48–62). (B) Left panel: representative images of proximity ligation assay (PLA) between SEC16A and WIPI2 in WT and SHISA5 KO HeLa cells. Cells were transfected for 48 h with either empty vector or SHISA5-DsRed plasmid (red). Right panel: the number of PLA signal in each cells was quantified using ImageJ plugins. Data are shown as bars with dots and represent the mean± SEM (n = 15–21). See Figure S4C for the representative images of PLA before inversion. (C) Immunoblot analysis of WT and SHISA5 KO HeLa cell lysates for SEC16A, SEC31A, WIPI2, LC3B, GAPDH, and TUBA1B. Quantification of band intensity from three independent experiments is noted. (D) Left panels: representative images of proximity ligation assay (PLA) between SEC31A and LC3B in WT and SHISA5 KO HeLa cells. Cells were transfected with control siRNA or siATG2A plus siATG2B. As negative controls, the use of only one primary antibody (either with anti-SEC31A or anti-LC3B antibody alone) resulted in no signal. Right panel: the number of PLA signal in each cells was quantified by BlobFinder. Data are shown as bars with dots and represent the mean± SEM (n = 125–156). See Figure S4D for the representative images of PLA before inverting the image display. All scale bars: 10 μm. (E) CLEM of SHISA5 KO cells co-transfected with EYFP-SEC31A (green) and mcherry-LC3B (red). Upper panels show low-magnification images with a boxed region of interest (ROI). Scale bar: 5 μm. Lower panels show enlarged ROI with arrowheads indicating close association of SEC31A and LC3B. Black arrowhead marks the contact between SEC31A and LC3B-positive structures that are electron dense. White arrowhead marks the contact between SEC31A and LC3B-positive autophagic membrane. The ER membranes (green) and LC3B-positive membranes (red) are roughly traced and show in the lower rightmost panel. Scale bar: 500 nm.
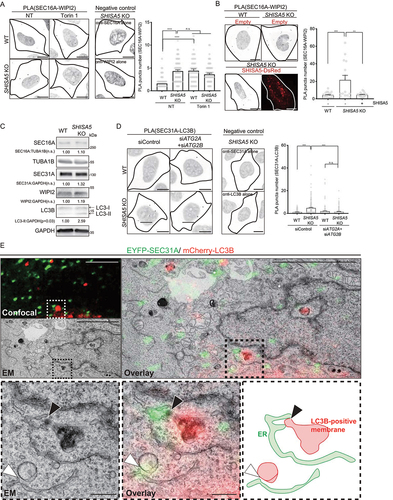
To confirm whether SHISA5 indeed controls contact between the ER and phagophore, SHISA5 KO cells were reconstituted with SHISA5-DsRed (). Upon transfection, the enhanced ligation signal of the SEC16A and WIPI2 in SHISA5 KO cells dramatically decreased back to the level observed in WT cells under basal conditions, confirming that the presence of SHISA5 itself was sufficient to prevent spontaneous contact between the phagophore and ER membrane. To exclude the possibility that the enhanced ligation signal was due to increased protein levels, the total cellular protein levels of SEC16A, SEC31A, and WIPI2 were examined in WT and SHISA5 KO cells (). Under normal, nutrient-rich culture conditions, WT and SHISA5 KO cells expressed similar levels of the SEC16A, SEC31A, and WIPI2 proteins, confirming that the observed enhanced ligation signal indicated enhanced contact between the ER and phagophore.
During the initial processes of autophagosome formation, PtdIns3K-C1 nucleation at the ER membrane occurs, which generates PtdIns3P, an essential membrane component for autophagosome formation. Localized PtdIns3P then recruits the PtdIns3P-binding proteins WIPI2 and their interacting partner, ATG2, to the ER subdomain [Citation28,Citation45,Citation46]. The assembled ATG2-WIPI2 complex elongates the phagophore and is associated with other autophagic machinery on the ER membrane [Citation2,Citation29,Citation47]. Therefore, we next addressed whether the contact between the ER and phagophore observed in the SHISA5 KO cells depended on ATG2 (). To that end, both ATG2A and ATG2B were silenced in either WT or SHISA5 KO cells and ligation of the ER and phagophore was tested. Similar to the result of SEC16A and WIPI2 ligation, the ligation signal of SEC31A and LC3B in SHISA5 KO cells was dramatically enhanced. When ATG2A and ATG2B was silenced, the enhanced ER-phagophore contact in SHISA5 KO cells was not observed, confirming that the enhanced contact observed in SHISA5 KO cells was ATG2-dependent (). When ATG2A and ATG2B was silenced, SHISA5 KO cells no longer exhibited high levels of basal autophagy, too (Fig. S4E). These data indicate that ATG2 activity was needed to enhance basal autophagy in SHISA5-depleted cells. In addition to its known tethering function at the contact between the ER and phagophore, the reported roles of ATG2 also include the closure of LC3-positive autophagosomes [Citation46,Citation48]. Notably, we found that ATG2A and ATG2B silencing induced a slight increase in the number of LC3 puncta in WT HeLa cells (Fig. S4E), and the number of immature autophagosomes was reported to increase upon the loss of ATG2 function [Citation46,Citation49]. Although our data suggest that ATG2 was required for basal autophagy in SHISA5 KO cells, it does not indicate which ATG2-specific activity was needed.
To determine whether functional ERESs are indeed essential to establish contact between the ER and phagophore, we treated SHISA5 KO cells with an inhibitor of protein kinase A, H89. H89 blocks SAR1 activation, thereby blocking functional COPII vesicle assembly [Citation8,Citation22,Citation50]. Treatment of the cells with H89 significantly decreased the number of ERES puncta, as reported (Fig. S4G) [Citation51]. Under these conditions, we stained WT and SHISA5 KO cells for LC3B and measured autophagosome formation. When the cells were treated with H89, the number of LC3-positive autophagosomes within the SHISA5 KO cells was significantly decreased, confirming that functional ERES assembly was required to exert enhanced basal autophagy in the SHISA5 KO cells (Fig. S4H). This indicates that the functional ERES was needed for enhanced autophagy in SHISA5-deficient cells; however, it did not determine whether ERES provides COPII vesicles to the phagophore, serves as a physical scaffolding platform for autophagosome formation, or both.
We separately performed correlative light and electron microscopy (CLEM) analysis of SHISA5 KO cells co-transfected with EYFP-SEC31A and mCherry-LC3B, to monitor the ultrastructure of the ERES-phagophore contact observed in SHISA5-deficient cells (). Detailed analysis using CLEM images revealed that SEC31A-positive subdomain of tubular ER was closely positioned with LC3-positive membranous structures. The LC3B-positive double-membrane vesicles, likely autophagosomes, were observed proximal to ERES, which was stained with SEC31A (labeled with white arrowhead). A more advanced form of electron dense membranous structure, likely autolysosomes, was also found very close to where SEC31A stained in SHISA5-deficient cells (labeled with black arrowhead). Taken together, these results suggest that the phagophore and ERES indeed positioned very closely in SHISA5 KO cells.
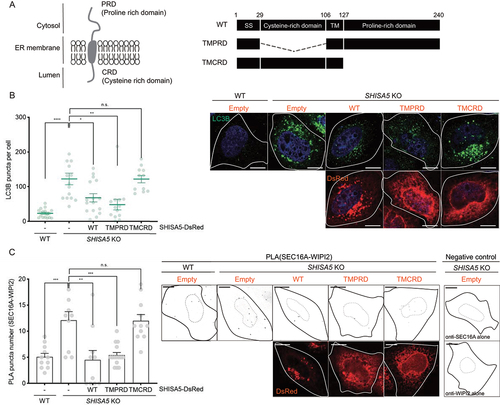
The proline-rich domain (PRD) of SHISA5 was needed to control ERES-phagophore contact
SHISA5, a single-pass transmembrane ER protein with no enzymatic activity, possesses a cytosolic proline-rich domain (PRD) and lumenal cysteine-rich domain (CRD) (). In an earlier report using HCV, we observed that the PRD of SHISA5 physically associates with HCV NS5A for recruitment to autolysosomes [Citation36]. In contrast, the CRD of SHISA5 has been reported to function during p53-mediated cell apoptosis [Citation52]. To determine the domain required for the regulation of basal autophagy, we tested LC3-positive autophagosome formation in SHISA5 KO cells reconstituted with mutant forms of SHISA5 (). Similar to overexpression of full-length SHISA5, overexpression of TMPRD SHISA5 was sufficient to repress the enhanced basal autophagy in SHISA5 KO cells. In contrast, TMCRD SHISA5 was not able to block basal autophagy. Next, we tested the proximity between the ERES and phagophore in the reconstituted SHISA5 KO cells. In agreement with the LC3B puncta result, TMPRD SHISA5 efficiently blocked contact between the ERES and phagophore, as did full-length SHISA5 (). Together, these data suggest that PRD region of SHISA5 was essential for constitutive autophagy under normal, nutrient-rich culture conditions, by blocking contact between the ERES and phagophore.
Figure 5. The cytosolic PRD of SHISA5 was required for the inhibitory role of SHISA5 at the contact. (A) Left panel: schematic diagram of the orientation of SHISA5 within the ER membrane. Right panel: domain structures of SHISA5 mutants used for analysis. (B, C) WT and SHISA5 KO HeLa cells were transfected with control empty, SHISA5-DsRed, TMPRD-SHISA5-DsRed, or TMCRD-SHISA5-DsRed plasmid (red) for 48 h. (B) LC3B puncta were immunostained and shown in the right panel. The numbers of LC3B puncta in each cell was quantified and shown in the left panel (n = 11–17). (C) Right: representative images of PLA between SEC16A and WIPI2 are shown, along with negative controls incubated with antibody against either SEC16A or WIPI2 alone. Left: the PLA signals in the indicated samples were quantified using ImageJ plugins (n = 10–15). See Figure S5A for the representative images of PLA before inverting the image display. (B) and (C) are derived from three and two independent experiments, respectively. The error bars indicate SEMs. All scale bars: 10 μm.
SHISA5 was displaced away from ERES during autophagy-inducing conditions
Finally, we examined the localization of SHISA5 in relation to ERES before and after autophagy induction. For this experiment, we constructed Str-Ii_SHISA5-SBP-EGFP plasmid (). It encodes an Str-Ii protein, streptavidin (Str) fused to an isoform of the human invariant chain of the major histocompatibility complex (Ii; a type II protein), and a SHISA5 fused to the streptavidin-binding peptide (SBP) and EGFP. Through streptavidin and SBP interaction, SHISA5 was retained in the ER, where a Str-Ii protein stably located [Citation53]. To monitor the SHISA5 localization, Str-Ii_SHISA5-SBP-EGFP plasmid was transfected to SHISA5 KO cells and its location was monitored by following the GFP signals. Co-staining of SEC61B confirmed it is well-retained in the tubular network of ER (). Upon transfection of Str-Ii_SHISA5-SBP-EGFP, the enhanced autophagy in SHISA5 KO cells decreased back to the level observed in WT cells, confirming that ER retained SHISA5 is indeed functional in blocking basal autophagy (Fig. S6B). Cells were then co-stained with SEC31A and SEC16A to mark ERES and localization of SHISA5 in relation to ERES was examined. Under basal culture condition, co-localized SEC31A and SEC16A puncta were observed along the tubular structure of SHISA5 (). Quite interestingly, when cells were treated with EBSS, SHISA5 seems to assemble into dot-like structures, which is devoid of either SEC31A or SEC16A (). As a result, the disengagement of SEC31A or SEC16A puncta away from SHISA5 was observed in EBSS-treated conditions. Quantification of correlation coefficients of SEC31A-SHISA5 and SEC16A-SHISA5 confirmed that SHISA5 moves away from where ERES exists, when EBSS treated (). To address whether it is an artificial behavior of ER retained proteins, we tested Str-Ii_VSVG-SBP-EGFP plasmid, which encodes VSVG instead of SHISA5. VSVG was retained in the tubular ER (Fig. S6A), and co-localized with SEC31A and SEC16A puncta along the ER tubular structure (Fig. S6C). However, EBSS treatment did not alter the localization patterns or engagement of VSVG protein with ERES (Fig. S6D and E), indicating that SHISA5 was specifically regulated by EBSS treatment.
Figure 6. Localization of SHISA5 altered in relation to ERES upon autophagy-inducing conditions. (A) A schematic illustration for how Str-Ii_SHISA5-SBP-EGFP protein is retained in ER membrane. (B) Representative immunofluorescence image of SHISA5 KO cells expressing Str-Ii_SHISA5-SBP-EGFP (green), immunostained with SEC61B (red). (C–E) Representative immunofluorescence images of SHISA5 KO cells expressing Str-Ii_SHISA5-SBP-EGFP (gray). Green and red marks ERES staining with anti-SEC31A and anti-SEC16A antibody, respectively. Cells were incubated in complete medium (C) or EBSS (D) for 1 h. Manders’ correlation coefficients were quantified using the ImageJ plugin Colocalization threshold and plotted in (E) (n = 16–21). The error bars indicate SEMs. (F, G) Representative immunofluorescence images of WIPI2 (gray) and SEC61B (red) in SHISA5 KO cells. Cells were transfected with Str-Ii_SHISA5-SBP-EGFP (green). Cells were incubated in complete medium (F) or EBSS (G) for 1 h. (H) Schematic illustration for the role of endogenous SHISA5 function in relation to ERES-phagophore contact under basal or autophagy-inducing conditions.
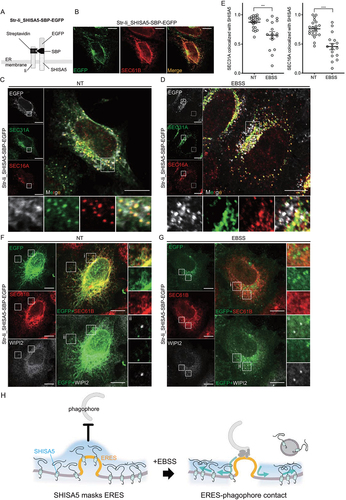
We next assessed the relative localization of the phagophore to SHISA5 by staining cells with WIPI2. In the Str-Ii_SHISA5-SBP-EGFP transfected basal SHISA5 KO cells, WIPI2-positive puncta barely detected, as expected. Upon EBSS treatment, visible WIPI2-positive puncta appeared near ER membrane, of which do not colocalize with where SHISA5 dots found ()). Based on these observations, we conclude that SHISA5 functioned to mask ERES under basal conditions and were relieved upon induction signal of autophagy ().
Discussion
Here, we report the suppressive role of the ER protein SHISA5 in the spontaneous induction of basal autophagy. Under nutrient-rich culture conditions, SHISA5 deficiency alone was sufficient to induce autophagy, as evidenced by enhanced contact between the phagophore and ER and the formation of LC3-positive autophagosomal structures. It seems SHISA5 deficiency relieved suppressive barrier against constitutive autophagy in nutrient-rich cellular environments.
Based on the observations of SHISA5 KO cells, we propose that SHISA5 functions at early steps of autophagy, when contact between the phagophore and a specialized subdomain of the ER, the ERES, occurs. Without SHISA5, the distance between the ERES and phagophore decreases, followed by the enhanced formation of LC3-positive autophagosomal membrane, the control of which depends on the activity of functional PtdIns3K-C1 and ERES. As most of the autophagy phenotypes observed in SHISA5 KO cells were rescued by reconstitution with SHISA5-DsRed, we concluded that SHISA5 acts to block unwanted contact between the ERES and phagophore to maintain cellular homeostasis under basal conditions. We also propose that the relative localization of SHISA5 in relation to ERES alters upon autophagy-inducing conditions, enabling the initiation of autophagosome formation ().
In this report, we demonstrate that constitutive engagement of the ER and phagophore occurs, and this engagement required PtdIns3K-C1 activity, but not ULK1 activity, under SHISA5-deficient conditions. These data led us to hypothesize the presence of a regulatory step that controls the proximity between the ER and phagophore, in addition to the activation of PtdIns3K-C1 assembly on the ER membrane. To prove the feasibility of the model, two assumptions need to be further tested. First, an explanation of how SHISA5 is removed upon autophagy induction in this model is required. Second, the upstream factors that activate PtdIns3K-C1 under nutrient-rich culture conditions in this model are needed to be identified.
Most of the observed phenotypes of SHISA5 deficiency resembled those of autophagy induced by either starvation or Torin 1 treatment, indicating that SHISA5 deficiency mimics starvation-induced conditions. This also indicates that the blockade effect of SHISA5 should be relieved upon starvation or under other autophagy-inducing conditions, allowing the proper initiation of autophagosome formation. We do not yet know what factors control this regulation or how this regulation occurs. As we previously reported, SHISA5 is a substrate of autolysosomal proteolysis that is eventually removed from the site of action during the autophagy process [Citation36]. However, to allow contact between the phagophore and ER upon stimulation, immediate changes in SHISA5 upon stimulation (either post-translational modification or exclusion from the ER) seem to be needed. One such modification may be palmitoylation, a reversible process in which a 16-carbon saturated fatty acid is linked to cysteine residues of target proteins. In general, lipidation functions to control the spatiotemporal organization of proteins and their trafficking between intracellular compartments [Citation54]. More specifically, the palmitoylation of membrane-associated proteins alters membrane curvature and thereby contributes to membrane fusion and vesicle assembly. Palmitoylation has also been reported to function during autophagy. For example, LAMTOR1 and MTORC1 are dynamically palmitoylated upon autophagy induction, which targets them to specific membranes and/or membrane subdomains [Citation55]. The palmitoylation of MCOLN3/TRPML3 upon nutrient starvation is required for its proper function during autophagosome formation [Citation56]. Based on our model, SHISA5 on the ER membrane leave the membrane upon autophagy induction, which might require changes in membrane curvature. It will be interesting to further investigate whether SHISA5 can be palmitoylated and whether the modification of SHISA5 is indeed functional during autophagy.
When PtdIns3K-C1 activity was perturbed by pharmacological inhibitor treatment or PIK3C3 silencing, SHISA5 KO cells no longer exhibited enhanced autophagy, indicating that the basal activity of PtdIns3K-C1 in SHISA5 KO cells was high. SHISA5 deficiency might cause an intracellular environment that favors PtdIns3K-C1 activity. PtdIns3K-C1 is a multiprotein complex composed of the lipid kinase PIK3C3, the protein kinase PIK3R4/VPS15, and several other regulatory proteins with scaffolding activity [Citation57]. The inactive state of PtdIns3K is known to be maintained by inhibitory contact between PIK3C3 and PIK3R4 [Citation58]. PtdIns3K activity is also promoted by a few physicochemical parameters of the membranous platform, such as increased phosphatidylserine, loosely packed lipids, and high membrane curvature [Citation59]. Therefore, it will be interesting to see whether the presence of SHISA5 alters such physicochemical parameters, preventing the formation of an ideal platform for PtdIns3K activation. As the production of PtdIns3P is an essential process for the initiation and expansion of autophagosome assembly, PtdIns3K-C1 activity is finely controlled in various ways, including MTOR-ULK1 activation during starvation-induced autophagy induction. Here, we addressed PtdIns3K-C1 activation independent of ULK1 activity. In support of our interpretation, several reports have demonstrated that PtdIns3K-C1 activation, presumably bypassing the ULK1 complex, can induce autophagy. For example, enhanced cyclic adenosine monophosphate levels by prostaglandin treatment and enhanced ER stress by thapsigargin treatment can induce autophagic signals in an MTOR- and AMP-activated protein kinase (AMPK)-independent but PtdIns3K activity-dependent manner [Citation60–62]. Studies using RB1CC1 and mutant forms of ATG16L1 without an interaction domain revealed that ammonia also induces autophagy independent of the ULK1 complex [Citation63]. Furthermore, deacetylation of PIK3C3 was found to increase PtdIns3K-C1 kinase activity without affecting ULK1 complex activity [Citation64]. Due to the lack of sufficient information, we cannot determine whether SHISA5 directly blocked PtdIns3K-C1 activation or SHISA5 deficiency indirectly relieved the inactive state of PtdIns3K-C1 under the experimental conditions we used. Nonetheless, it will be of great interest to further investigate the molecular mechanism by which SHISA5 regulates PtdIns3K-C1 activity and its relevance to contact regulation between the phagophore and ER during autophagy induction.
To conclude, we present ways to control constitutive autophagy during the steps of membrane contact between the ER and phagophore. Elevated constitutive autophagy has been implicated in many types of cancer, suggesting that uncontrolled autophagy can be beneficial for the growth of established cancers. Further in-depth investigations of the role of SHISA5 in regulating constitutive autophagy and cancer will be needed to develop new strategies against cancer, especially autophagy-addicted cancer.
Materials and methods
Cell culture and transfection
HeLa (ATCC, CCL-2), A549 (ATCC, CCL-185), HEK293 (ATCC, CRL-1573), and U2OS (ATCC, HTB-96) cells were grown Dulbecco’s modified Eagle’s medium (DMEM; Lonza, BE12-604F) supplemented with 10% fetal bovine serum (FBS; Welgene, S001-01) and routinely checked for mycoplasma contamination with a mycoplasma PCR detection kit (iNTRON, 25239). For amino acid starvation, cells were grown in EBSS (Sigma-Aldrich, E2888) for the indicated durations. Lipofectamine 3000 (Invitrogen, L3000015) and polyethyleneimine (PEI; Polysciences, 23966-100) were used for transient transfection of short interfering RNA (siRNA) and plasmid DNA, respectively, according to the manufacturer’s recommendations. After 48 h of transfection, cells were harvested or fixed for further analysis. The following siRNA sequences were used: siATG2A and siATG2B(1); siATG2A, 5ʹ-GCAUUCCCAGUUGUUGGAGUUCCUA-3ʹ and siATG2B, 5ʹ-AGGUCUCUCUUGUCUGGCAUCUUUA-3ʹ; siBECN1(1), 5ʹ- CCACUCUGUGAGGAAUGCACAGAUA-3ʹ; siBECN1(2), 5ʹ- GCUGCCGUUAUACUGUUCU-3ʹ; siPIK3C3(1), 5ʹ-CCCAUGAGAUGUACUUGAACGUAAU-3ʹ; siPIK3C3 (2), 5ʹ- GGCAUUGCUUGGAGAUAAU-3ʹ; siULK1(1), 5ʹ- UCACUGACCUGCUCCUU-3ʹ; siULK1(2), 5ʹ- GUGGCCCUGUACGACUUCCAGGAAA-3ʹ; siATG13(1), 5ʹ- CCAUGUGUGUGGAGAUUUCACUUAA-3ʹ; siATG13(2), 5ʹ- GCAUUCAUGUCUACCAGGCAAUUUG-3ʹ; siRB1CC1(1), 5ʹ-GGAGAUUUGGUACUCAUCAUCA-3ʹ; siRB1CC1(2), 5ʹ-GGAGUGGGCUGGUGCUUUAUU-3ʹ; siSHISA5(1), 5ʹ-GUACCUGUGAUGACCAAUA −3ʹ; and siSHISA5(2), 5-GAGCUGUCUUAGCUCAAAU-3ʹ; siATG2A and siATG2B(2); ATG2A siRNA (Dharmacon, ON-TARGETplus Human ATG2A siRNA, L-026591-02-0010) and ATG2B siRNA (Dharmacon, ON-TARGETplus Human ATG2B siRNA, L-016822-02-0010).
Immunofluorescence microscopy and quantification method
Cells were cultured on round cover glasses in 12-well culture dishes and washed with PBS, followed by fixation with either cold methanol (Samchun Pure Chemical, M0588) or 4% paraformaldehyde (Thermo Fisher Scientific, A11313). The cells were then permeabilized by incubation with 0.2% Triton X-100 (Thermo Fisher Scientific, BP151-500) for 15 min and blocked with 3% goat serum (Vector Laboratories, S-1000-20) in PBS (Thermo Fisher Scientific, 21600010). The cells were incubated with primary antibodies overnight at 4°C, and then secondary antibodies conjugated to either Alexa Fluor 488, 568, 647 (Invitrogen, A21206, A21202, A10042, A10037, A31573, and A31571) were incubated in 1% BSA (Biosesang, A1025), 0.1% Triton X-100 in PBS for 1 h at room temperature. Then, a DAPI solution (Invitrogen, R37606) was used to visualize nuclei. Cover glasses were mounted on glass slides using Aqua Mount (Thermo Fisher Scientific, TA-125-AM) and analyzed with a FLUOVIEW FV3000 confocal microscope (Olympus). Single cells were defined by differential interference contrast (DIC) images to determine the region of interest (ROI), and colocalization in the ROI was quantified using the ImageJ plugin, colocalization threshold. LC3+ particles, LAMP1− LC3+ particles, and LAMP1+ LC3+ particles within ROI were determined using ComDet v.0.5.4.
PLA and quantification
A PLA was performed in a humid chamber with a kit according to the manufacturer’s instructions (Sigma-Aldrich, DUO92101). The samples were incubated with anti-LC3B (rabbit polyclonal; Cell Signaling Technology, 2775S) and anti-SEC31A (mouse monoclonal; Santa Cruz Biotechnology, sc-376587) or anti-WIPI2 (mouse monoclonal; Bio-Rad, MCA5780) and anti-SEC16A (rabbit polyclonal; Bethyl Laboratories, A300-648A) antibodies for overnight at 4°C, and the control samples were incubated with single antibodies alone. After washing, the cells were incubated with anti-rabbit PLA PLUS and anti-mouse PLA MINUS probes (Duolink; Sigma-Aldrich, DUO92002 and DUO92004) for 1 h at 37°C in a humidified chamber. Following ligation of the hybridized complementary probes (30 min at 37°C), rolling circle amplification with fluorescently labeled nucleotides was allowed to proceed for 2 h at 37°C. Fluorescent spots were visualized, and images were collected using a FLUOVIEW FV3000 confocal microscope (Olympus). BlobFinder was utilized to automatically detect and count fluorescent signals for samples treated with reagents and siRNA transfected samples [Citation65], and plasmid transfected cells were analyzed using Analyze Particles plugin in ImageJ.
Immunoblotting
For western blot analysis, cells were lysed in lysis buffer (25 mM Tris pH 7.5, 150 mM NaCl, 1% Triton X-100, 0.1% SDS, and 0.5% deoxycholate [Thermo Fisher Scientific, BP349-100] with 1 mg/ml of phenylmethylsulfonyl fluoride [Sigma-Aldrich, P7626], 1 mM of dithiothreitol [Sigma-Aldrich, DTT-RO], 5 μg/ml of aprotinin [Sigma-Aldrich, A6279], 2 μg/ml of pepstatin [Sigma-Aldrich, P4265], 5 μg/ml of leupeptin [Sigma-Aldrich, L2884], and 1 mM of benzamidine [Sigma-Aldrich, 12072]). Sodium fluoride (25 mM; Sigma-Aldrich, S7920), beta-glycerol phosphate (25 mM; Sigma-Aldrich, 35675), and sodium orthovanadate (5 mM; Sigma-Aldrich, S6508) were added additionally to detect phosphorylated forms of proteins. Proteins in the total cell lysate were quantified using the Bradford method (Bio-Rad, BR5000006) and separated on SDS-polyacrylamide gels at various percentages (7–12%). The proteins were transferred to a nitrocellulose membranes (Bio-Rad, 162-0115) and analyzed with the indicated antibodies. Finally, the membranes were incubated with horseradish peroxidase (HRP)-conjugated secondary antibodies (Thermo Fisher Scientific, 31430 and 31460), and an LAS4000 luminescent image analyzer (Fujifilm Life Science) was used to visualize immunoreactive signals. The signals were acquired using Supersignal West Femto Maximum Sensitivity Substrate (Thermo Fisher Scientific, 34096).
Antibodies and reagents
Torin 1 (4247) was obtained from Tocris. SBI-0206965 (29089) was obtained from Cell Signaling Technology. SAR405 was obtained from Cayman Chemicals (16979). Wortmannin (PHZ1301) and H89 (B1427) were purchased from Life Technologies and Sigma-Aldrich, respectively. The following primary antibodies were used: anti-WIPI2 (Bio-Rad, MCA5780GA), anti-ATG2A (MBL, PD041), anti-LC3B (Cell Signaling Technology, 2775S), anti-RPS6KB1 (Cell Signaling Technology, 9202S), anti-phospho-RPS6KB1 (T389) (Cell Signaling Technology, 9205S), anti-ULK1 (Cell Signaling Technology, 8054T), phospho-ULK1(S757) (Cell Signaling Technology, 6888T), anti-ATG13 (Cell Signaling Technology, 13468T), anti-GAPDH (Santa Cruz Biotechnology, sc-47724), anti-SHISA5 (Santa Cruz Biotechnology, sc-390725), anti-VCL/vinculin (Santa Cruz Biotechnology, sc-55465), anti-SEC31A (Santa Cruz Biotechnology, sc-376587), anti-BECN1 (Santa Cruz Biotechnology, sc-48341), anti-CANX/calnexin (Santa Cruz Biotechnology, sc-46669), anti-TUBA1B/α-tubulin (Proteintech, 66031-1-Ig), anti-PIK3C3 (Proteintech, 12452-1-AP), anti-RB1CC1 (Proteintech, 17250-1-AP), anti-LAMP1 (Abcam, ab25630), anti-ATG2B (Proteintech, 25155-1-AP), anti-SEC61B (Atlas antibodies, HPA049407), and anti-SEC16A (Bethyl Laboratories, A300-648A).
Electron microscopy
Cells were grown in 35-mm glass-bottomed culture dishes (NEST Biotechnology, 801001) to 50–60% confluency. The cells were then fixed with 2 ml of a fixative solution containing 2% paraformaldehyde (EM-grade; Electron Microscopy Sciences, 19210) and 2.5% glutaraldehyde (Electron Microscopy Sciences, 16210) diluted in 0.1 M cacodylate solution (pH7.0; Merck, C0250). After washing, then post-fixed in 2% osmium tetroxide (OsO4; Electron Microscopy Sciences, 19208) containing 1.5% potassium ferrocyanide (Merck, 60279) for 1 h at 4°C. The fixed cells were dehydrated by incubation in an ethanol series (50, 60, 70, 80, 90, and 100%) for 10 min at each concentration and mounted in Embed-812 embedding medium (Electron Microscopy Sciences, 14120). Then, 60-nm sections were cut horizontally in the plane of the block by ultramicrotome (Leica Microsystems, Germany, UC7) and mounted on copper slot grids with a specimen support film (Ted Pella Inc., 01805). Then, the sections were double stained with 2% uranyl acetate (Electron Microscopy Sciences, 15200) for 10 min and lead citrate (Electron Microscopy Sciences, 17800) for 5 min. The sections were then observed using a Tecnai G2 transmission electron microscope at 120 kV (Thermo Fisher Scientific, Waltham, MA, USA).
Correlative light and electron microscopy (CLEM)
CLEM was performed as previously described [Citation66]. The cells were grown in 35 mm glass grid-bottomed culture dishes (MatTek, P35G-1.5-14-CGRD) to 30–40% confluency. Then cells were transfected with mCherry-hLC3B-pcDNA3.1 (Addgene, 40827; a gift from David Rubinsztein) and pEYFP-SEC31A (Addgene, 66613; a gift from David Stephens) using Lipofectamine 2000 (Thermo Fisher Scientific, 11668019). Next day, live-cell images were acquired with a confocal light microscope (Ti-RCP, Nikon, Japan) at 37°C in a temperature and CO2 controlled chamber. Cells were fixed with 2.5% glutaraldehyde (Electron Microscopy Sciences, 16210) and 2% paraformaldehyde (Electron Microscopy Sciences, 19210) in 0.1 M cacodylate solution (pH 7.0; Merck, C0250) for 1 h at 4°C. After being washed, the cells were dehydrated with a graded ethanol series and infiltrated with an Embed-812 embedding kit (Electron Microscopy Sciences, 14120) and polymerized in oven at 60°C. After embedding, 60 nm sections were cut horizontally to the plane of the block by ultramicrotome (Leica Microsystems, Germany, UC7) and were mounted on copper slot grids with a specimen support film (Ted Pella Inc., 01805). Sections were stained with uranyl acetate (Electron Microscopy Sciences, 15200) and lead citrate (Electron Microscopy Sciences, 17800). The cells were observed at 120 kV in a Tecnai G2 microscope (Thermo Fisher Scientific, Waltham, MA, USA). Confocal micrographs were produced as high-quality images using PhotoZoom Pro 8 software (Benvista Ltd., Houston, TX, USA). Enlarged fluorescence images were fitted to the electron micrographs using the ImageJ BigWarp program.
Plasmids
The coding sequence of full-length human SHISA5 was cloned into the pEF-DEST51 vector (Invitrogen, 12285011) with a C-terminal DsRed monomer (among pDsRed-monomer-N1; Clontech, 632465) tag. SHISA5 mutants lacking the CRD and PRD were generated by following the manufacturer’s protocol in the QuikChange site-directed mutagenesis kit (Stratagene, 200519). Streptavidin (Str)-Ii_VSVG-SBP-EGFP (Addgene, 65300; a gift from Franck Perez), ptfLC3 (Addgene, 21074; a gift from Tamotsu Yoshimori), mCherry-hLC3B-pcDNA3.1 (Addgene, 40827; a gift from David Rubinsztein), pEYFP-SEC31A (Addgene, 66613; a gift from David Stephens), and pEGFP-2xFYVE (Addgene, 140047; a gift from Harald Stenmark) were acquired from Addgene as indicated [Citation41,Citation53,Citation67–69]. To construct Str-Ii_SHISA5-SBP-EGFP, VSVG in Str-Ii_VSVG-SBP-EGFP was replaced with human SHISA5 coding sequence (CCDS2770.1) at the AscI/EcoRI site of vector.
Generation of a stable cell line expressing mRFP-GFP-LC3 and EGFP-2xFYVE
To generate the reporter cell lines for autophagic flux, HeLa cells and SHISA5 KO cells transfected with ptfLC3 were subjected to 1000 μg/ml G418 selection (Millipore, 5.09290) and kept in culture. The LC3 conjugation and the autophagosome maturation of the mRFP-GFP-LC3 reporter were characterized by confocal microscopy analysis. To generate the HeLa cells and SHISA5 KO cells constitutively expressing EGFP-2xFYVE reporter protein, the linearized EGFP-2xFYVE plasmids were transfected, followed by selection with 1000 μg/ml G418.
SHISA5 knockout cell generation with CRISPR/Cas9-mediated genome editing
SHISA5 knockout cell line was generated using SHISA5 CRISPR knockout, HDR plasmids (Santa Cruz Biotechnology, sc-408226, sc-408226-HDR) following the manufacturer’s protocol. Briefly, HeLa cells were transfected with two plasmids and cultured with puromycin (1 μg/ml; AG Scientific, P-1033-SOL) containing medium. Cells were selected with puromycin until individual colonies were observed. Each colony was grown in a separate dish and was assessed for SHISA5 deficiency with western blot.
Statistical analysis
For the quantification of western blots, ImageJ software was utilized to perform densitometry analysis on the bands in the linear range of detection. The source images are available in the supplemental materials. All statistical analysis were performed and graphed using GraphPad Prism (version 9.2.0). The significance of differences was evaluated by an unpaired two-tailed t test. All data are presented as the mean ± standard error of the mean or standard deviations as indicated in the corresponding figure legends. Three independent experiments were conducted to perform statistics, unless otherwise noted in the corresponding figure legends. Significance is defined as *p < 0.05; **p < 0.005; ***p < 0.0005; ****p < 0.00005; n.s., not significant.
Supplemental Material
Download Zip (121.3 MB)Disclosure statement
No potential conflict of interest was reported by the author(s).
Supplementary material
Supplemental data for this article can be accessed here
Additional information
Funding
Related Research Data
References
- Nakatogawa H. Mechanisms governing autophagosome biogenesis. Nat Rev Mol Cell Biol. 2020;21(8):439–458.
- Mizushima N, Yoshimori T, Ohsumi Y. The role of Atg proteins in autophagosome formation. Annu Rev Cell Dev Biol. 2011;27:107–132.
- Kawabata T, Yoshimori T. Autophagosome biogenesis and human health. Cell Discov. 2020;6(1):33.
- Dikic I, Elazar Z. Mechanism and medical implications of mammalian autophagy. Nat Rev Mol Cell Biol. 2018;19(6):349–364.
- Tooze SA, Yoshimori T. The origin of the autophagosomal membrane. Nat Cell Biol. 2010;12(9):831–835.
- Ylä-Anttila P, Vihinen H, Jokitalo E, et al. 3D tomography reveals connections between the phagophore and endoplasmic reticulum. Autophagy. 2009;5(8):1180–1185.
- Hayashi-Nishino M, Fujita N, Noda T, et al. A subdomain of the endoplasmic reticulum forms a cradle for autophagosome formation. Nat Cell Biol. 2009;11(12):1433–1437.
- Ge L, Melville D, Zhang M, et al. The ER–Golgi intermediate compartment is a key membrane source for the LC3 lipidation step of autophagosome biogenesis. eLife. 2013;2:e00947.
- Hailey DW, Rambold AS, Satpute-Krishnan P, et al. Mitochondria supply membranes for autophagosome biogenesis during starvation. Cell. 2010;141(4):656–667.
- Ravikumar B, Moreau K, Jahreiss L, et al. Plasma membrane contributes to the formation of pre-autophagosomal structures. Nat Cell Biol. 2010;12(8):747–757.
- Puri C, Renna M, Bento C, et al. Diverse autophagosome membrane sources coalesce in recycling endosomes. Cell. 2013;154(6):1285–1299.
- Schütter M, Giavalisco P, Brodesser S, et al. Local fatty acid channeling into phospholipid synthesis drives phagophore expansion during autophagy. Cell. 2020;180(1):135–149. e14.
- Osawa T, Kotani T, Kawaoka T, et al. Atg2 mediates direct lipid transfer between membranes for autophagosome formation. Nat Struct Mol Biol. 2019;26(4):281.
- Valverde DP, Yu S, Boggavarapu V, et al. ATG2 transports lipids to promote autophagosome biogenesis. J Cell Biol. 2019;218(6):1787–1798.
- Nishimura T, Tooze SA. Emerging roles of ATG proteins and membrane lipids in autophagosome formation. Cell Discov. 2020;6(1):32.
- Hollenstein DM, Kraft C. Autophagosomes are formed at a distinct cellular structure. Curr Opin Cell Biol. 2020;65:50–57.
- Suzuki K, Kirisako T, Kamada Y, et al. The pre-autophagosomal structure organized by concerted functions of APG genes is essential for autophagosome formation. EMBO J. 2001;20(21):5971–5981.
- Xie Z, Klionsky DJ. Autophagosome formation: core machinery and adaptations. Nat Cell Biol. 2007;9(10):1102–1109.
- Graef M, Friedman JR, Graham C, et al. ER exit sites are physical and functional core autophagosome biogenesis components. Mol Biol Cell. 2013;24(18):2918–2931.
- King JS. Autophagy across the eukaryotes. Autophagy. 2012;8(7):1159–1162.
- Ishihara N, Hamasaki M, Yokota S, et al. Autophagosome requires specific early sec proteins for its formation and NSF/SNARE for vacuolar fusion. Mol Biol Cell. 2001;12(11):3690–3702.
- Karanasios E, Walker SA, Okkenhaug H, et al. Autophagy initiation by ULK complex assembly on ER tubulovesicular regions marked by ATG9 vesicles. Nat Commun. 2016;7:12420.
- Suzuki K, Akioka M, Kondo-Kakuta C, et al. Fine mapping of autophagy-related proteins during autophagosome formation in Saccharomyces cerevisiae. J Cell Sci. 2013;126(11):2534–2544.
- Uemura T, Yamamoto M, Kametaka A, et al. A cluster of thin tubular structures mediates transformation of the endoplasmic reticulum to autophagic isolation membrane. Mol Cell Biol. 2014;34(9):1695–1706.
- Duke EMH, Razi M, Weston A, et al. Imaging endosomes and autophagosomes in whole mammalian cells using correlative cryo-fluorescence and cryo-soft X-ray microscopy (cryo-CLXM). Ultramicroscopy. 2014;143:77–87.
- Tábara L-C, Escalante R, Johannes L. VMP1 establishes ER-microdomains that regulate membrane contact sites and autophagy. PLoS One. 2016;11(11):e0166499.
- Zhao YG, Liu N, Miao G, et al. The ER contact proteins VAPA/B interact with multiple autophagy proteins to modulate autophagosome biogenesis. Curr Biol. 2018;28(8):1234–1245. e4.
- Chowdhury S, Otomo C, Leitner A, et al. Insights into autophagosome biogenesis from structural and biochemical analyses of the ATG2A-WIPI4 complex. Proc Nat Acad Sci. 2018;115(42):E9792–E9801.
- Kotani T, Kirisako H, Koizumi M, et al. The Atg2-Atg18 complex tethers pre-autophagosomal membranes to the endoplasmic reticulum for autophagosome formation. Proc Nat Acad Sci. 2018;115(41):10363–10368.
- Axe EL, Walker SA, Manifava M, et al. Autophagosome formation from membrane compartments enriched in phosphatidylinositol 3-phosphate and dynamically connected to the endoplasmic reticulum. J Cell Biol. 2008;182(4):685–701.
- Karanasios E, Stapleton E, Manifava M, et al. Dynamic association of the ULK1 complex with omegasomes during autophagy induction. J Cell Sci. 2013;126(22):5224–5238.
- Tan D, Cai Y, Wang J, et al. The EM structure of the TRAPPIII complex leads to the identification of a requirement for COPII vesicles on the macroautophagy pathway. Proc Nat Acad Sci. 2013;110(48):19432–19437.
- Ge L, Zhang M, Kenny SJ, et al. Remodeling of ER‐exit sites initiates a membrane supply pathway for autophagosome biogenesis. EMBO Rep. 2017;18(9):1586–1603.
- Maeda S, Otomo C, Otomo T. The autophagic membrane tether ATG2A transfers lipids between membranes. Elife. 2019;8:e45777.
- Shima T, Kirisako H, Nakatogawa H. COPII vesicles contribute to autophagosomal membranes. J Cell Biol. 2019;218(5):1503–1510.
- Kim N, Kim MJ, Sung PS, et al. Interferon-inducible protein SCOTIN interferes with HCV replication through the autolysosomal degradation of NS5A. Nat Commun. 2016;7(1):1–12.
- Jung CH, Ro S-H, Cao J, et al. mTOR regulation of autophagy. FEBS Lett. 2010;584(7):1287–1295.
- Saxton RA, Sabatini DM. mTOR signaling in growth, metabolism, and disease. Cell. 2017;168(6):960–976.
- Yamamoto A, Tagawa Y, Yoshimori T, et al. Bafilomycin A1 prevents maturation of autophagic vacuoles by inhibiting fusion between autophagosomes and lysosomes in rat hepatoma cell line, H-4-II-E cells. Cell Struct Funct. 1998;23(1):33–42.
- Klionsky DJ, Abdelmohsen K, Abe A, et al. Guidelines for the use and interpretation of assays for monitoring autophagy (3rd edition). Autophagy. 2016;12(1):1–222.
- Kimura S, Noda T, Yoshimori T. Dissection of the autophagosome maturation process by a novel reporter protein, tandem fluorescent-tagged LC3. Autophagy. 2007;3(5):452–460.
- Zachari M, Ganley IG. The mammalian ULK1 complex and autophagy initiation. Essays Biochem. 2017;61(6):585–596.
- Hara T, Takamura A, Kishi C, et al. FIP200, a ULK-interacting protein, is required for autophagosome formation in mammalian cells. J Cell Biol. 2008;181(3):497–510.
- Egan DF, Chun MH, Vamos M, et al. Small molecule inhibition of the autophagy kinase ULK1 and identification of ULK1 substrates. Mol Cell. 2015;59(2):285–97.
- Itakura E, Mizushima N. Characterization of autophagosome formation site by a hierarchical analysis of mammalian Atg proteins. Autophagy. 2010;6(6):764–776.
- Velikkakath AKG, Nishimura T, Oita E, et al. Mammalian Atg2 proteins are essential for autophagosome formation and important for regulation of size and distribution of lipid droplets. Mol Biol Cell. 2012;23(5):896–909.
- Obara K, Sekito T, Niimi K, et al. The Atg18-Atg2 complex is recruited to autophagic membranes via phosphatidylinositol 3-phosphate and exerts an essential function. J Biol Chem. 2008;283(35):23972–23980.
- Bozic M, van den Bekerom L, Milne BA, et al. A conserved ATG2-GABARAP family interaction is critical for phagophore formation. EMBO Rep. 2020;21(3):e48412.
- Tang Z, Takahashi Y, Chen C, et al. Atg2A/B deficiency switches cytoprotective autophagy to non-canonical caspase-8 activation and apoptosis. Cell Death Differ. 2017;24(12):2127–2138.
- Omari S, Makareeva E, Roberts-Pilgrim A, et al. Noncanonical autophagy at ER exit sites regulates procollagen turnover. Proc Nat Acad Sci. 2018;115(43):E10099–E10108.
- Weigel AV, Chang C-L, Shtengel G, et al. ER-to-Golgi protein delivery through an interwoven, tubular network extending from ER. Cell. 2021;184(9):2412–2429. e16.
- Bourdon JC, Renzing J, Robertson PL, et al. Scotin, a novel p53-inducible proapoptotic protein located in the ER and the nuclear membrane. J Cell Biol. 2002;158(2):235–246.
- Boncompain G, Divoux S, Gareil N, et al. Synchronization of secretory protein traffic in populations of cells. Nat Methods. 2012;9(5):493–8.
- Tabaczar S, Czogalla A, Podkalicka J, et al. Protein palmitoylation: palmitoyltransferases and their specificity. Exp Biol Med (Maywood). 2017;242(11):1150–1157.
- Sanders SS, De Simone FI, Thomas GM. mTORC1 signaling is Palmitoylation-dependent in Hippocampal neurons and non-neuronal cells and involves dynamic palmitoylation of LAMTOR1 and mTOR. Front Cell Neurosci. 2019;13:115.
- Kim SW, Kim DH, Park KS, et al. Palmitoylation controls trafficking of the intracellular Ca2+ channel MCOLN3/TRPML3 to regulate autophagy. Autophagy. 2019;15(2):327–340.
- Ohashi Y, Tremel S, Williams RL. VPS34 complexes from a structural perspective. J Lipid Res. 2019;60(2):229–241.
- Stjepanovic G, Baskaran S, Lin MG, et al. Vps34 kinase domain dynamics regulate the autophagic PI 3-kinase complex. Mol Cell. 2017;67(3):528–534. e3.
- Ohashi Y, Tremel S, Masson GR, et al. Membrane characteristics tune activities of endosomal and autophagic human VPS34 complexes. eLife. 2020;9(p):e58281.
- Grotemeier A, Alers S, Pfisterer SG, et al. AMPK-independent induction of autophagy by cytosolic Ca2+ increase. Cell Signal. 2010;22(6):914–925.
- Pfisterer SG, Mauthe M, Codogno P, et al. Ca2+/calmodulin-dependent kinase (CaMK) signaling via CaMKI and AMP-activated protein kinase contributes to the regulation of WIPI-1 at the onset of autophagy. Mol Pharmacol. 2011;80(6):1066–1075.
- Ugland H, Naderi S, Brech A, et al. cAMP induces autophagy via a novel pathway involving ERK, cyclin E and Beclin 1. Autophagy. 2011;7(10):1199–1211.
- Gammoh N, Florey O, Overholtzer M, et al. Interaction between FIP200 and ATG16L1 distinguishes ULK1 complex-dependent and -independent autophagy. Nat Struct Mol Biol. 2013;20(2):144–9.
- Su H, Yang F, Wang Q, et al. VPS34 acetylation controls its lipid kinase activity and the initiation of canonical and non-canonical autophagy. Mol Cell. 2017;67(6):907–921. e7.
- Allalou A, Wählby C. BlobFinder, a tool for fluorescence microscopy image cytometry. Comput Methods Programs Biomed. 2009;94(1):58–65.
- Jung M, Choi H, Kim J, et al. Correlative light and transmission electron microscopy showed details of mitophagy by mitochondria quality control in propionic acid treated SH-SY5Y cell. Materials (Basel). 2020;13:19.
- Jahreiss L, Menzies FM, Rubinsztein DC. The itinerary of autophagosomes: from peripheral formation to kiss-and-run fusion with lysosomes. Traffic. 2008;9(4):574–87.
- Stephens DJ, Lin-Marq N, Pagano A, et al. COPI-coated ER-to-Golgi transport complexes segregate from COPII in close proximity to ER exit sites. J Cell Sci. 2000;113(Pt 12):2177–85.
- Gillooly DJ, Morrow IC, Lindsay M, et al. Localization of phosphatidylinositol 3-phosphate in yeast and mammalian cells. Embo J. 2000;19(17):4577–4588.