
ABSTRACT
Dysregulated NLRP3 inflammasome activity results in uncontrolled inflammation, which is the basis of many chronic diseases. Although the regulatory mechanism has been gradually clarified after a long period of research, the metabolic regulation of NLRP3 inflammasome is still a mystery. Here, we find that ALDOA, as a monitor of glycolysis, regulates NLRP3 inflammasome by sensing changes in glycolytic flux to participate in the formation of AXIN-based AMPK-activation complex on the lysosomal surface. In this process, ALDOA restricts PRKN/parkin-dependent mitophagy through controlling AMPK activation to maintain mitochondrial damage caused by NLRP3 agonists. Furthermore, ALDOA also regulates the transcription of SQSTM1/p62, a receptor for mitophagy, through AMPK-FOXO3 signaling. In addition to studying the mechanism by which ALDOA regulated NLRP3 inflammasome, we also screened ALDOA inhibitors and found that LYG-202, a synthetic flavonoid compound, inhibited ALDOA enzyme activity by occupying the position involved in Schiff base intermediate formation, thus preventing FBP from combining with ALDOA. In vitro, LYG-202 suppressed NLRP3 inflammasome via activating the AMPK-mitophagy signaling pathway. In vivo, LYG-202 attenuated sterile inflammation and fulminant hepatitis, and suppressed the activation of NLRP3 inflammasome activation. Therefore, our study demonstrated that the glycolytic enzyme ALDOA maintained NLRP3 inflammasome activation by monitoring the glycolytic flux to control AMPK activation during the classical activation of NLRP3.
Abbreviations
ALDOA: aldolase A; AMPK: AMP-activated protein kinase; ATG: autophagy related; ATG5: autophagy related 5; ATP: adenosine triphosphate; BMDMs: bone marrow-derived macrophages; CALCOCO2: calcium binding and coiled-coil domain 2; CASP1: caspase 1; CQ: chloroquine; FOXO3: forkhead box O3; IL1B: interleukin 1 beta; LPS: lipopolysaccharide; MAP1LC3B/LC3B: microtubule-associated protein 1 light chain 3 beta; MT: mutant; mtDNA: mitochondrial DNA; MTORC1: mechanistic target of rapamycin kinase complex 1; mtROS: mitochondrial reactive oxygen species; NLRP3: NLR family, pyrin domain containing 3; OPTN: optineurin; PBS: phosphate-buffered saline; PRKN/Parkin: parkin RBR E3 ubiquitin protein ligase; SN: supernatant; SQSTM1/p62: sequestosome 1; STK11/LKB1: serine/threonine kinase 11; TOMM20: translocase of outer mitochondrial membrane 20; ULK1: unc-51 like autophagy activating kinase 1; v-ATPase: vacuolar type H+-ATPase; WT: wild-type.
Introduction
Macrophages are an important component of the defense mechanism against microbial invasion and sterile tissue damage in the innate immune system [Citation1]. When encountering pathogen-associated molecular patterns (PAMPs) or danger/damage-associated molecular patterns (DAMPs), macrophages initiate a controlled but transient host reaction to remove foreign organisms and cellular debris, thereby restoring tissue integrity and function [Citation2,Citation3]. However, when inflammatory factors are not effectively controlled, persistent and excessive innate immune responses also exacerbate tissue damage [Citation4]. Therefore, proper control of macrophage activation is essential to restore tissue integrity and normal function.
Macrophages sense PAMPs and DAMPs via pattern recognition receptors (PRRs), including transmembrane proteins such as the Toll-like receptors (TLRs) and C-type lectin receptors (CLRs), as well as cytoplasmic proteins such as the DDX58/RIG-I-like receptors (RLRs) and NOD-like receptors (NLRs), to involve in inflammatory responses [Citation5]. Unlike PRRs that recognize ligands directly, most NLRs involved in inflammasome activation and IL1B/IL18 maturation, do not directly recognize agonists [Citation3,Citation4]. For example, the NLRP3 (NLR family, pyrin domain containing 3) inflammasome responds to multiple stimuli, including ATP, bacterial toxins, micro-crystalline substances, lipid particles, and bacteria that are not directly bound to NLRP3 [Citation6,Citation7]. The common mechanism of multiple NLRP3 agonists involves mitochondrial damage that causes the release of fragmented mitochondrial (mt)DNA and the production of mitochondrial reactive oxygen species (mtROS) [Citation8]. This suggests that limiting mitochondrial damage to reduce mtDNA release and mtROS production is essential to block NLRP3 inflammasome activation.
Mitochondrial quality control defects contribute to inflammation. Selective autophagy of mitochondria, termed mitophagy, is an important mitochondrial quality control mechanism that eliminates damaged mitochondria. Unlike general autophagy, mitophagy selectively removes mitochondria without degrading other organelles outside mitochondria. Two steps are required for clearance of damaged mitochondria by mitophagy. The first is to prepare damaged mitochondria, and the second is to initiate specific autophagy machinery to degrade the primed mitochondria. Mitochondrial priming is initiated by PINK1 (PTEN induced putative kinase 1) and the E3 ubiquitin ligase PRKN/Park2 (parkin RBR E3 ubiquitin protein ligase), which are recruited to damaged mitochondria. PRKN promotes ubiquitination of mitochondrial outer membrane proteins, which in turn triggers translocation of the ubiquitin-binding receptor SQSTM1, NBR1, OPTN or CALCOCO2/NDP52 to the mitochondria to complete mitochondrial priming. Among the autophagy machinery required for mitophagy, ULK1 is essential for the clearance of mitochondria. Thus, mitophagy cannot occur without the activation of PINK1-PRKN and ULK1.
Glycolysis is a metabolic pathway that supports the inflammatory response [Citation9]. The metabolite flux in this pathway is increased during pro-inflammatory activation of macrophages and dendritic cells [Citation10]. However, the role of glycolysis in controlling inflammasome activation is more ambiguous. Some studies have shown that the typical activation of NLRP3 inflammasome requires undisturbed glycolysis, whereas others showed that inhibition of glycolytic enzyme leads to strong activation of NLRP3 inflammasome [Citation11–14]. In our study, we demonstrated that inhibition of ALDOA (aldolase A, fructose-bisphosphate), a glycolytic flux monitor, resulted in suppression of classical activation of NLRP3 inflammasome. Moreover, ALDOA is essential for mitochondrial damage induced by NLRP3 agonists. Mechanically, inhibition of ALDOA triggered PRKN-dependent mitophagy to clear NLRP3 agonists-damaged mitochondria, which was dependent on AMPK activation by promoting the formation of AXIN-based AMPK-activation complex on the lysosomal surface. In addition, autophagy-mediated clearance of damaged mitochondria relied on SQSTM1, an autophagy receptor, while inhibition of ALDOA induced SQSTM1 transcription through activation of the AMPK-FOXO3 pathway. Together, the data suggest that ALDOA may be the target of regulating NLRP3 inflammasome.
Results
ALDOA is essential for NLRP3 inflammasome activation
To elucidate the role of glycolysis in activation of NLRP3 inflammasome, we introduced various glycolytic intermediates into glucose-starved J774A.1 cells permeabilized with streptolysin O (SLO), which induced NLRP3 inflammasome activation [Citation15–17]. Under glucose starvation conditions, addition of glucose or various glycolytic intermediates to the SLO-treated cells increased IL1B secretion. However, the addition of glyceraldehyde-3-phosphate (G3P) or dihydroxyacetone phosphate (DHAP) increased the secretion of IL1B less than the addition of glucose (). However, addition of fructose-1,6-bisphosphate (FBP), G3P or DHAP to the SLO-treated cells had no significant effect on IL1B secretion in glucose sufficiency conditions (). This suggests that the inhibition of IL1B secretion by G3P or DHAP addition is not its own function. Moreover, addition of FBP on the basis of G3P reversed the inhibition of G3P on IL1B secretion (). This suggests that the lack of FBP may cause the decrease of IL1B secretion. During glycolysis, FBP is catalyzed by ALDOA to produce two three-carbon products including G3P and DHAP. However, the role of FBP in reversing the G3P-induced decrease of IL1B secretion was dependent on the expression of ALDOA (). The addition of glycolytic intermediates had no effect on ALDOA expression, enzyme activity and cell survival (Figure S1A-S1C). Therefore, based on the above results, we hypothesized that glycolytic enzyme ALDOA may be involved in the regulation of IL1B secretion.
Figure 1. ALDOA maintained NLRP3 inflammasome activation. (A-E) ELISA of IL1B in supernatants of J774A.1 cells. (A) Various glycolytic intermediates (200 μM) as indicated were individually added to the 2-h glucose-starved J774A.1 cells pre-incubated with SLO for 5 min. (B) FBP, G3P or DHAP (200 μM) were individually added to the glucose-rich J774A.1 cells pre-incubated with SLO for 5 min. (C) Glucose, G3P, or FBP were added to the 2 h glucose-starved J774A.1 cells pre-incubated with SLO for 5 min. (D) G3P, or FBP were added to the 2 h glucose-starved J774A.1 cells stably expressing shRNA against Aldoa pre-incubated with SLO for 5 min. (E) ELISA of IL1B in supernatants of LPS-primed J774A.1 cells stably expressing shRNA against Aldoa, stimulated with ATP (5 mM) for 1 h, nigericin (4 μM) for 3 h, MSU (150 μg/ml) for 6 h. (F) Immunoblot analysis of IL1B and CASP1 in supernatants (SN) and extracts (Input) of LPS-primed J774A.1 cells stably expressing shRNA against Aldoa, stimulated as above. (G) Flow cytometry analysis (top) and quantification (bottom) of mitochondrial ROS by MitoSOX staining in LPS-primed J774A.1 cells stably expressing shRNA against Aldoa, stimulated as above. (H) Flow cytometry analysis (top) and quantification (bottom) of mitochondrial status in LPS-primed J774A.1 cells stably expressing shRNA against Aldoa, stimulated as above. Gates represent cells with damaged mitochondria. Data are presented as mean ± SD (n = 3). *P < 0.05, **P < 0.01.
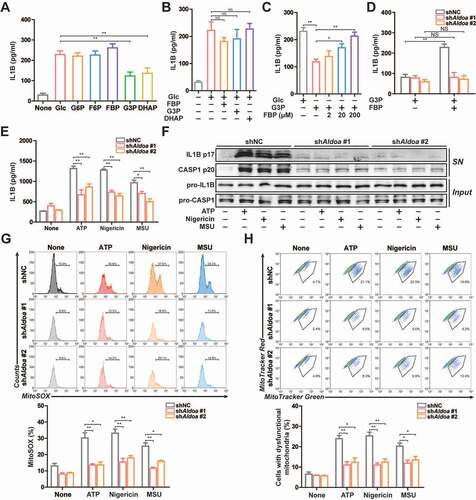
To prove this hypothesis, we constructed ALDOA knockdown J774A.1 cells and investigated this consequence in terms of NLRP3 inflammasome activation (Figure S1D). As shown in and 1 F, the secretion of IL1B and cleavage of pro-IL1B and pro-CASP1 (caspase 1) were significantly suppressed in ALDOA knockdown LPS-primed J774A.1 cells in response to treatment with ATP, nigericin and monosodium urate (MSU), three specific NLRP3 inflammasome activators. Mitochondrial dysfunction is considered to be a common signal triggered by different kinds of NLRP3 agonists, so we examined the role of ALDOA in the mitochondrial damage. All tested NLRP3 agonists induced robust mtROS production and the loss of mitochondrial membrane potential, which was alleviated in ALDOA knockdown LPS-primed J774A.1 cells (, 1 H and S1E). Moreover, NLRP3 agonists induced mtDNA release into the cytosol, which was decreased in ALDOA knockdown LPS-primed J774A.1 cells (Figure S1F). This suggests that ALDOA is necessary for NLRP3 inflammasome activation and NLRP3 agonists-induced mitochondrial damage.
ALDOA restricts PRKN-dependent mitophagy
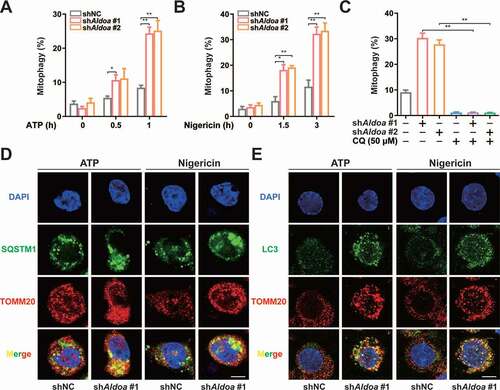
NLRP3 agonist-damaged mitochondria can be selectively cleared by PRKN-dependent mitophagy, which maintains mitochondrial quality control [Citation17–19]. Therefore, we assessed the mitophagy activity of ALDOA knockdown cells. We utilized mito-Keima to measure mitochondrial delivery to lysosomes during the NLRP3 agonist incubation. The FACS-based assay showed that mito-Keima spectral shifts were clearly observed in ALDOA knockdown cells during ATP or nigericin treatment (, 2B, S2A and S2B). Furthermore, lysosomal mito-Keima signals were observed in ALDOA knockdown cells after ATP or nigericin treatment (Figure S2C). Importantly, these Keima shifts were neutralized by CQ, an inhibitor of lysosome function ( and S2D). During PRKN-dependent mitophagy, SQSTM1 binds to poly-ubiquitinated mitochondria through its UBA domain, and the induction of mitochondrial poly-ubiquitin depends on the E3 ligase PRKN [Citation18,Citation20,Citation21]. Indeed, SQSTM1-containing aggregates were either colocalized with or adjacent to mitochondria in ALDOA knockdown macrophages (). In addition, ALDOA knockdown promoted co-localization of LC3 with mitochondria (). The mitochondrial translocation of PRKN and mitochondrial poly-ubiquitin were detected in ALDOA knockdown LPS-primed J774A.1 cells (Figure S2E and S2F). These data showed that ALDOA knockdown promoted PRKN-dependent mitophagy.
Figure 2. ALDOA limited PRKN-dependent mitophagy. (A) FACS analysis LPS-primed J774A.1 cells stably expressing shRNA against Aldoa and mito-Keima, stimulated with or without ATP (5 mM) for 0.5 h and 1 h. (B) FACS analysis LPS-primed J774A.1 cells stably expressing shRNA against Aldoa and mito-Keima, stimulated with or without nigericin (4 μM) for 1.5 h and 3 h. (C) FACS analysis LPS-primed J774A.1 cells stably expressing shRNA against Aldoa and mito-Keima treated with CQ (50 μM), stimulated with nigericin (4 μM) for 3 h. (D and E) Intracellular distribution of SQSTM1 (D) or LC3 (E) and mitochondria (TOMM20) in LPS-primed J774A.1 cells stably expressing shRNA against Aldoa, stimulated with ATP (5 mM) for 1 h, nigericin (4 μM) for 3 h, examined by confocal microscopy. Scale bars: 10 µm. Data are presented as mean ± SD (n = 3). *P < 0.05, **P < 0.01.
ALDOA controls NLRP3 inflammasome activation by limiting PRKN-dependent mitophagy
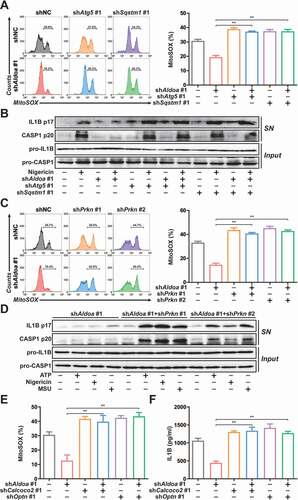
To clarify the role of mitophagy in ALDOA-controlled NLRP3 inflammasome activation, we further knocked down ATG5 or SQSTM1 in ALDOA knockdown J774A.1 cells (Figure S3A and S3B). We found that reduced mtROS release by ALDOA knockdown was reversed by simultaneous knockdown of ALDOA and ATG5 or ALDOA and SQSTM1 (). In addition, the suppression of IL1B mature and CASP1 cleavage by ALDOA knockdown was almost abolished by simultaneous knockdown of ALDOA and ATG5 or ALDOA and SQSTM1 in LPS-primed J774A.1 cells (). Furthermore, we further knocked down PRKN in ALDOA knockdown J774A.1 cells (Figure S3C). We also observed an increase in mtROS release after simultaneous knockdown of ALDOA and PRKN (). The suppression of IL1B mature and CASP1 cleavage by ALDOA knockdown was almost abolished by simultaneous knockdown of ALDOA and PRKN in LPS-primed J774A.1 cells (). Moreover, the reduction of mitochondrial damage, mtROS and mtDNA release induced by ALDOA knockdown was reversed by CQ (Figure S3D-S3F). As critical mitophagy receptors, OPTN and CALCOCO2 play important roles during PRKN mitophagy [Citation22]. Therefore, we further knocked down OPTN or CALCOCO2 in ALDOA knockdown J774A.1 cells (Figure S3G). We also found that reduced mtROS release and IL1B secretion by ALDOA knockdown was reversed by simultaneous knockdown of ALDOA and OPTN or ALDOA and CALCOCO2 (). These findings indicate that ALDOA controls NLRP3 inflammasome activation by limiting damaged mitochondria clearance, mediated by PRKN-dependent mitophagy.
Figure 3. ALDOA controlled NLRP3 inflammasome activation by restricting PRKN-dependent mitophagy. (A) Flow cytometry analysis (left) and quantification (right) of mitochondrial ROS by MitoSOX staining in LPS-primed J774A.1 cells stably expressing shRNA against Aldoa and Atg5 or Sqstm1, stimulated with nigericin (4 μM) for 3 h. (B) Immunoblot analysis of IL1B and CASP1 in supernatants (SN) and extracts (Input) of LPS-primed J774A.1 cells stably expressing shRNA against Aldoa and Atg5 or Sqstm1, stimulated with nigericin (4 μM) for 3 h. (C) Flow cytometry analysis (left) and quantification (right) of mitochondrial ROS by MitoSOX staining in LPS-primed J774A.1 cells stably expressing shRNA against Aldoa and Prkn, stimulated with nigericin (4 μM) for 3 h. (D) Immunoblot analysis of IL1B and CASP1 in supernatants (SN) and extracts (Input) of LPS-primed J774A.1 cells stably expressing shRNA against Aldoa and Prkn, stimulated with ATP, nigericin or MSU. (E) Flow cytometry analysis quantification of mitochondrial ROS by MitoSOX staining in LPS-primed J774A.1 cells stably expressing shRNA against Aldoa and Calcoco2 or Optn, stimulated with nigericin (4 μM) for 3 h. (F) ELISA of IL1B in supernatants of LPS-primed J774A.1 cells stably expressing shRNA against Aldoa and Calcoco2 or Optn, stimulated with nigericin (4 μM) for 3 h. Data are presented as mean ± SD (n = 3). *P < 0.05, **P < 0.01.
ALDOA controls AMPK activation to regulate mitophagy initiation and NLRP3 inflammasome activation
To determine the cellular pathways influenced by ALDOA, we chose three pairs of independent RNA samples from the shNC and shAldoa J774A.1 cells to perform RNA sequencing (RNA-seq) analysis (Genewiz). Knockdown of ALDOA resulted in significant increases in transcription of 782 genes and decreases in transcription of 642 genes (Data not shown). Further, we performed Gene-Set Enrichment Analysis (GSEA) analysis for ALDOA-regulated gene and found that ALDOA knockdown resulted in positive enrichment of autophagy regulation gene (Figure S4A). Indeed, we found that as many as 139 known autophagy regulation genes were increased by ALDOA knockdown (Figure S4B). In addition, ALDOA knockdown caused negative enrichment of the MTORC1 signaling pathway (), which negatively regulated autophagy by restricting the activity of the ULK protein kinase complex that is required for the formation of autophagosomes [Citation23]. Then, ALDOA knockdown down-regulated p-EIF4EBP1 (Ser65) and p-RPS6KB1/S6K1 (Thr389) expression (). Moreover, ALDOA knockdown led to positive enrichment of AMPK-mediated MTOR regulation related genes (). The expression of p-PRKAA/AMPKα (Thr172), p-ULK1 (Ser555) and p-ACACA/ACC (Ser79) were upregulated after ALDOA knockdown in J774A.1 cells (). These results indicated that ALDOA knockdown led to AMPK activation and MTORC1 inhibition.
Figure 4. ALDOA controlled the initiation of mitophagy and NLRP3 inflammasome activation by restricting AMPK activation. (A) GSEA analyses of MTORC1 signaling gene sets (top) and AMPK-regulated MTOR gene sets (bottom) in J774A.1 cells stably expressing Aldoa shRNA vs nonspecific control shRNA. (B) Immunoblot analysis of p-EIF4EBP1 (Ser65), EIF4EBP1, p-RPS6KB1/S6K1 (Thr389) and RPS6KB1/S6K1 in J774A.1 cells stably expressing shRNA against Aldoa. (C) Immunoblot analysis of p-PRKAA/AMPKα (Thr172), PRKAA/AMPKα, p-ULK1 (Ser555), ULK1, p-ACACA/ACC (Ser79) and ACACA/ACC in J774A.1 cells stably expressing shRNA against Aldoa. (D) Immunoblot analysis of p-ULK1 (Ser555), ULK1 and LC3 in J774A.1 cells stably expressing shRNA against Aldoa and Prkaa (left) or shRNA against Aldoa treated with compound C (right). (E) FACS analysis LPS-primed J774A.1 cells stably expressing mito-Keima and shRNA against Aldoa and Prkaa (left) or shRNA against Aldoa treated with compound C (right), stimulated with nigericin (4 μM) for 3 h. (F and G) Intracellular distribution of SQSTM1 (F) or LC3 (G) and mitochondria (TOMM20) in LPS-primed J774A.1 cells stably expressing shRNA against Aldoa and Prkaa, stimulated with nigericin (4 μM) for 3 h, examined by confocal microscopy. Scale bars: 10 µm. (H) Immunoblot analysis of IL1B and CASP1 in supernatants (SN) and extracts (Input) of LPS-primed J774A.1 cells stably expressing shRNA against Aldoa and Prkaa, stimulated with ATP (5 mM) for 1 h, nigericin (4 μM) for 3 h, MSU (150 μg/ml) for 6 h. Data are presented as mean ± SD (n = 3). **P < 0.01.
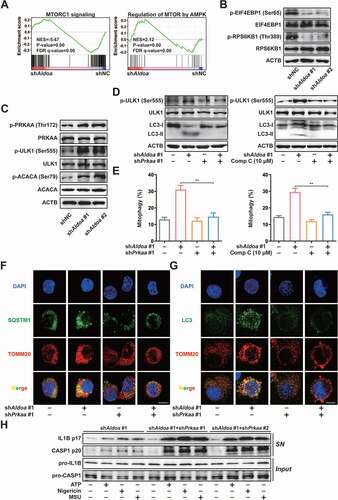
Since both AMPK activation and MTORC1 inhibition are involved in initiating autophagy, we further knocked down both PRKAA1/AMPKα1 and PRKAA2/AMPKα2 in ALDOA knockdown J774A.1 cells to investigate the effect of AMPK on ALDOA knockdown-mediated MTORC1 inhibition (Figure S4C). As shown in Figure S4D, ALDOA knockdown-mediated MTORC1 inhibition was abolished after simultaneous knockdown of ALDOA and PRKAA/AMPKα or inhibition of AMPK, which suggested that MTORC1 was controlled by ALDOA knockdown-induced AMPK activation. In addition, we found that ALDOA knockdown-triggered ULK1 phosphorylation and LC3-II upregulation were abolished after knockdown or inhibition of AMPK (). To clarify the role of AMPK in ALDOA knockdown-mediated mitophagy and NLRP3 inflammasome inhibition, we measured the mitophagy activity in ALDOA and PRKAA/AMPKα simultaneous knockdown J774A.1 cells. As shown in and S4E, the increase in mitophagy mediated by ALDOA knockdown was abolished after ALDOA and PRKAA/AMPKα simultaneous knockdown or AMPK inhibition. ALDOA knockdown-induced co-localization of SQSTM1 or LC3 with mitochondria was restricted after simultaneous knockdown of ALDOA and PRKAA/AMPKα ( and 4G). Furthermore, ALDOA knockdown-restricted IL1B mature and CASP1 cleavage was reversed in simultaneous knockdown of ALDOA and PRKAA/AMPKα LPS-primed J774A.1 cells (). Thus, ALDOA regulates NLRP3 inflammasome activation via controlling AMPK-mitophagy signaling.
ALDOA-formed Schiff base intermediate limits AMPK activation
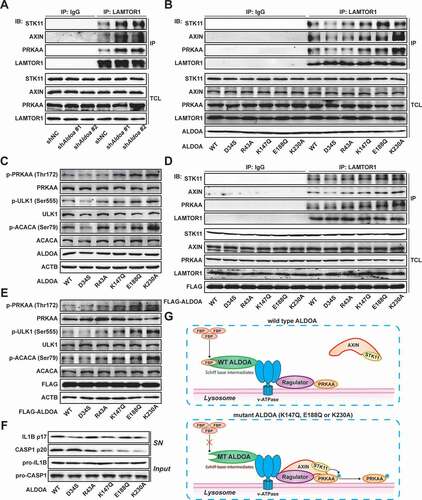
The formation of lysosomal supercomplex containing v-ATPase, ragulator, AXIN, STK11/LKB1, and AMPK has previously been shown to be necessary for AMPK activation [Citation24,Citation25]. To explore the mechanism by which ALDOA regulates AMPK, we detected the formation of the AXIN-based AMPK-activation complex on the lysosomal surface. As shown in , knockdown of ALDOA promoted the combination of AXIN, STK11/LKB1 and AMPK from LAMTOR1 in J774A.1 cells. These data illustrate that ALDOA controls AMPK activation via restricting lysosomal surface AXIN-based AMPK-activation complex formation. To analyze the possible mechanisms by which ALDOA regulates AMPK-activation complex, we constructed several ALDOA mutants involved in FBP decomposition, including D34S, R43A, K147Q, E188Q and K230A. As shown in , ALDOA K147Q, E188Q and K230A variant promoted the formation of AMPK-activation complex on the lysosomal surface, while ALDOA WT, D34S, R43A variant did not. Moreover, the expression of p-PRKAA/AMPKα (Thr172), p-ULK1 (Ser555) and p-ACACA/ACC (Ser79) were up-regulated in J774A.1 cells that expressed ALDOA K147Q, E188Q and K230A variant (). Similarly, transfection of ALDOA K147Q, E188Q and K230A variant in HEK293T cells resulted in AMPK-activation complex formation and AMPK activation ( and 5E). Furthermore, ALDOA K147Q, E188Q and K230A variant reduced mature IL1B (p17) and cleaved CASP1 (p20) expression after nigericin stimulation (). Although K147, E188, and K230 residues play different roles in ALDOA catalytic substrate cleavage, they are involved in the formation of Schiff base intermediate to varying degrees (K147 residue serves as the protonation of Schiff base formation and substrate cleavage, E188 residue involves in the dehydration of Schiff base intermediates, and K230 residue is the formation site of Schiff base intermediate) [Citation26–28]. Moreover, the mutation of ALDOA does not affect the interaction of ALDOA with various subunit of v-ATPase (Figure S4F), which is necessary for the assembly of the lysosomal supercomplex [Citation29]. In summary, blocking the formation of ALDOA Schiff base intermediate leads to AMPK activation ().
Figure 5. ALDOA involved in AMPK-activation complex formation. (A) Immunoblot analysis of STK11/LKB1, AXIN, PRKAA/AMPKα and LAMTOR1 in LAMTOR1 immunoprecipitates and total cell lysate (TCL) of J774A.1 cells stably expressing shRNA against Aldoa. (B) Immunoblot analysis of STK11/LKB1, AXIN, PRKAA/AMPKα, LAMTOR1 and ALDOA in LAMTOR1 immunoprecipitates and TCL of J774A.1 cells stably expressing Aldoa shRNA and ALDOA WT, D34S, R43A, K147Q, E188Q, or K230A variant cDNA. (C) Immunoblot analysis of p-PRKAA/AMPKα (Thr172), PRKAA/AMPKα, p-ULK1 (Ser555), ULK1, p-ACACA/ACC (Ser79), ACACA/ACC and ALDOA in J774A.1 cells stably expressing Aldoa shRNA and ALDOA WT, D34S, R43A, K147Q, E188Q, or K230A variant cDNA. (D) Immunoblot analysis of STK11/LKB1, AXIN, PRKAA/AMPKα, LAMTOR1 and ALDOA in LAMTOR1 immunoprecipitates and TCL of HEK293T cells expressing FLAG-ALDOA WT, D34S, R43A, K147Q, E188Q, or K230A variant cDNA. (E) Immunoblot analysis of p-PRKAA/AMPKα (Thr172), PRKAA/AMPKα, p-ULK1 (Ser555), ULK1, p-ACACA/ACC (Ser79), ACACA/ACC and FLAG in HEK293T cells expressing FLAG-ALDOA WT, D34S, R43A, K147Q, E188Q, or K230A variant cDNA. (F) Immunoblot analysis of IL1B and CASP1 in supernatants (SN) and extracts (Input) of LPS-primed J774A.1 cells stably expressing Aldoa shRNA and ALDOA WT, D34S, R43A, K147Q, E188Q, or K230A variant cDNA, stimulated with nigericin (4 μM) for 3 h. (G) a schematic diagram depicting formation of AMPK lysosomal supercomplex. Data are presented as mean ± SD (n = 3).
ALDOA regulates SQSTM1 transcription by controlling the AMPK-FOXO3 signaling pathway
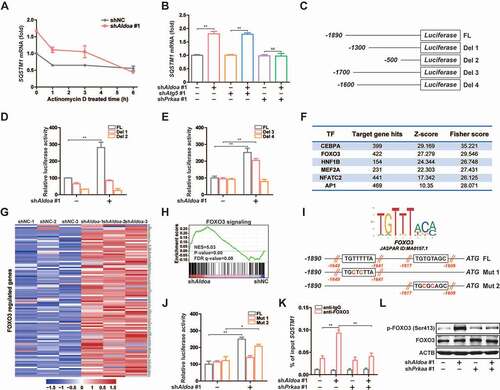
As an autophagy adaptor, SQSTM1 plays an important role in PRKN-induced mitochondrial clustering and NLRP3 inflammasome activation [Citation18,Citation30–32]. The results of RNA sequencing analysis revealed that the mRNA level of SQSTM1 was significantly increased after ALDOA knockdown (Figure S4B). Then, we found that knockdown of ALDOA upregulated SQSTM1 mRNA level, while inhibition of transcription by treating cells with Actinomycin D completely reduced SQSTM1 mRNA levels (), strongly suggesting that ALDOA knockdown-mediated SQSTM1 mRNA upregulation is at a gene transcriptional level. The upregulation of SQSTM1 mRNA may be caused by the activation of autophagy [Citation33,Citation34]. However, compared with ATG5 knockdown group, we found SQSTM1 mRNA expression was still up-regulated in simultaneous ALDOA and ATG5 knockdown group, while in simultaneous ALDOA and PRKAA/AMPKα knockdown group, the upregulated SQSTM1 mRNA was inhibited (), indicating that the increase of SQSTM1 transcription may be independent of autophagy activation but related to AMPK activation. To determine the precise mechanism whereby ALDOA regulates SQSTM1 transcription, we cloned 1890 bp of the SQSTM1 promoter, which was subcloned into a luciferase reporter plasmid to further establish the role of transcription in ALDOA knockdown-induced SQSTM1 mRNA level (). Interestingly, ALDOA knockdown provoked a dramatic induction of luciferase activity (), indicating that ALDOA knockdown-induced signals acting on the SQSTM1 promoter. To identify the elements in the SQSTM1 promoter responsible of the induction by ALDOA knockdown, we next constructed different 5ʹ deletions of the SQSTM1 promoter (). Experiments with deletions 1 and 2 demonstrate that the region encompassing nucleotides −1890 to −1300 contains potential ALDOA knockdown mediated responsive regulatory elements (). Then, we constructed other 5ʹ deletions of the SQSTM1 promoter to demonstrate that ALDOA knockdown mediated responsive regulatory elements are located in the region of −1700 to −1600 nucleotides (). Transcription factor binding motif analysis of the promoters showed that the targets of a list of transcription factors, including FOXO3, were enriched in ALDOA knockdown upregulated genes (). Indeed, we found that as many as 104 known FOXO3 target genes were upregulated by ALDOA knockdown (). GSEA analysis also showed that FOXO3 target gene sets were consistently enriched with ALDOA knockdown (). By comparing SQSTM1 promoter in the JASPAR database, we found that the SQSTM1 promoter contained two FOXO3 elements in the region of −1700 to −1600 nucleotides. The third and fifth nucleotide of the FOXO3 element were highly conserved thymine nucleotide, so we constructed two FOXO3 elements mutants, respectively (). Experiments with mutants 1 and 2 demonstrate that the region of −1649 to −1641 nucleotides was the FOXO3 element mediated by ALDOA knockdown (). To confirm that FOXO3 binds to SQSTM1 promoter, we performed a chromatin immunoprecipitation (ChIP) assay, which shows that FOXO3 bound directly to the SQSTM1 promoter in chromatin isolated from ALDOA knockdown J774A.1 cells. However, FOXO3 did not bind to the SQSTM1 promoter in ALDOA and PRKAA/AMPKα knockdown cells (). In addition, it has been shown that AMPK causes the activation of FOXO3 transcriptional activity by phosphorylation of FOXO3 [Citation35]. We found that ALDOA knockdown significantly increased p-FOXO3 (Ser413) expression, whereas ALDOA and PRKAA/AMPKα knockdown reversed this effect (). These results suggest that ALDOA knockdown induced phosphorylation of FOXO3 is dependent on PRKAA/AMPKα expression. Taken together, ALDOA knockdown promotes SQSTM1 transcription through the AMPK-FOXO3 signaling pathway.
Figure 6. ALDOA restricted SQSTM1 transcription by controlling AMPK-FOXO3 signaling. (A) Quantitative real-time PCR analysis of SQSTM1 mRNA in J774A.1 cells stably expressing Aldoa shRNA, stimulated with Actinomycin D (10 μM) for different time. (B) Quantitative real-time PCR analysis of SQSTM1 mRNA in J774A.1 cells stably expressing shRNA against Aldoa and Atg5 or Prkaa. (C) Schematic representation of the different luciferase reporter constructs of the 5ʹ deletions SQSTM1 promoter. (D and E) Analysis of SQSTM1 promoter in response to ALDOA knockdown. The different 5ʹ deletions of the SQSTM1 promoter luciferase reporter constructs were transfected into MEFs cells stably expressing Aldoa shRNA and luciferase activity was measured as described. (F) Transcription factors enriched for the ALDOA knockdown-upregulated genes identified by promoter binding site analysis. (n = 782 upregulated genes). (G) Heatmap of FOXO3 regulated genes from three independent samples in J774A.1 cells stably expressing Aldoa shRNA vs nonspecific control shRNA. Gene expression values were colored red for high abundance and blue for low abundance. (H) GSEA analyses of FOXO3 signaling gene sets in J774A.1 cells stably expressing Aldoa shRNA vs nonspecific control shRNA. (I) Sequence logo of FOXO3 reverse complement (top). Schematic representation of the different luciferase reporter constructs of the SQSTM1 promoter mutants (bottom). (J) Analysis of SQSTM1 promoter specific mutants in response to ALDOA knockdown. The specific mutants of the SQSTM1 promoter luciferase reporter constructs were transfected into MEFs cells stably expressing Aldoa shRNA and luciferase activity was measured. (K) Chromatin from J774A.1 cells stably expressing shRNA against Aldoa and Prkaa was analyzed for recruitment of FOXO3 to the regulatory region of the SQSTM1 promoter by ChIP-qPCR. (L) Immunoblot analysis of p-FOXO3 (Ser413) and FOXO3 in J774A.1 cells stably expressing shRNA against Aldoa and Prkaa. Data are presented as mean ± SD (n = 3). *P < 0.05, **P < 0.01.
Chemical screening and identification of LYG-202, directly binds to ALDOA to inhibit its enzyme activity
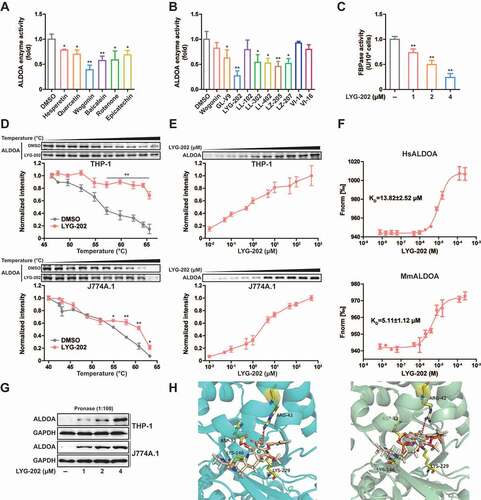
Since ALDOA controls the activation of NLRP3 inflammasome, inhibition of ALDOA activity represents a potential treatment approach for a series of inflammatory diseases. Some flavonoids exhibit extensive anti-inflammatory activity and have the potential to inhibit ALDOA [Citation36,Citation37]. We screened a number of flavonoids with anti-inflammatory effects, and found that a variety of flavonoids had the potential to inhibit ALDOA enzyme activity, and wogonin showed a more significant inhibitory effect at 10 μM (). Since wogonin inhibited ALDOA enzyme activity, we further screened the effects of wogonin synthetic derivatives on ALDOA enzyme activity. In order to exclude the effects of these compounds on cell viability, we selected 4 μM as the screening concentration, and found that LYG-202 had a high inhibitory effect on ALDOA enzyme activity. (). Moreover, ALDOA enzyme activity was significantly inhibited after LYG-202 treatment in a concentration-dependent manner in J774A.1 cells (). In addition, LYG-202 increased the thermal stability of ALDOA in a temperature- and concentration-dependent manner (, 7E and Figure S5A, S5B) [Citation38]. The dissociation constant (KD) between LYG-202 and ALDOA was determined as 13.82 ± 2.52 μM (human ALDOA) or 5.11 ± 1.12 μM (mouse ALDOA) by using the microscale thermophoresis (MST) (). And LYG-202 prevented the hydrolysis of ALDOA in a concentration-dependent manner in THP-1 and J774A.1 cells (). Results of molecular docking showed that LYG-202 formed a Pi-cation bond with ALDOA ARG-42 and a hydrogen bond with ALDOA ASP-33, occupying the ALDOA LYS-229 residue pockets to prevent formation of the fructose-1,6-bisphosphate (FBP) Schiff base (). Guided by the docking model, we designed the mutation in ALDOA protein (D34S, R43A and D34S/R43A). The mutated ALDOA protein is predicted to maintain the structural integrity and function (Figure S5C), but the binding to LYG-202 was disrupted (Figure S5D-S5F). Taken together, these results demonstrate that LYG-202, as an ALDOA-binding compound, prevents ALDOA-formed Schiff base intermediate.
Figure 7. Chemical screening and identification of LYG-202 directly bound to ALDOA. (A) ALDOA enzyme activity was detected by adding various flavonoids individually (10 μM). (B) ALDOA enzyme activity was detected by adding various synthetic derivatives of wogonin individually (4 μM). (C) FBP aldolase activity was detected in J774A.1 cells treated by 1, 2, 4 μM of LYG-202. (D) CETSA melt curve of ALDOA for heat treatment of differentiated THP-1 cells and J774A.1 cells in the absence and in the presence of LYG-202 (4 μM). (E) Drug concentration dependence isometric line of ALDOA in the presence of increasing concentrations of LYG-202 in differentiated THP-1 cells and J774A.1 cells. (F) The interaction between LYG-202 and human (Hs) ALDOA or mouse (Mm) ALDOA was detected by MST. (G) Immunoblot analysis of ALDOA in differentiated THP-1 cells and J774A.1 cells treated by 1, 2, 4 μM of LYG-202 and pronase (1:100). (H) Molecular docking analysis of LYG-202 and ALDOA in the absence (left) and in the presence of FBP (right). Data are presented as mean ± SD (n = 3). *P < 0.05, **P < 0.01 compared with DMSO group.
LYG-202 inhibits NLRP3 inflammasome activation in macrophages
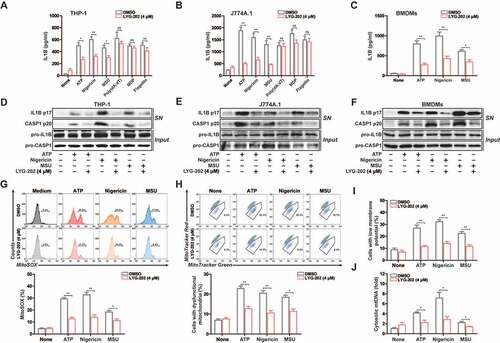
To examine the function of LYG-202 in NLRP3 inflammasome activation, we analyzed the secretion of IL1B in LPS-primed differentiated THP-1 and J774A.1 cells. As shown in and 8B, IL1B secretion was suppressed after LYG-202 treatment in response to NLRP3 agonists. In contrast, LYG-202 had no effect on the activation of IL1B secretion in response to treatment with poly (dA:dT), an AIM2 inflammasome activator, or muramyldipeptide (MDP), an NLRP1 inflammasome activator, or flagellin, an NLRC4 (NLR family CARD domain containing 4) inflammasome activator. Similarly, LYG-202 suppressed IL1B secretion in response to NLRP3 agonists in primary bone-marrow-derived macrophages (BMDMs), while tumor necrosis factor-α (TNF/TNF-α) was unchanged ( and S6A). Meanwhile, LYG-202 (4 μM) did not affect the survival of THP-1, J774A.1 cells and BMDMs (Figure S6B).
Figure 8. LYG-202 suppressed NLRP3 inflammasome activation. (A and B) ELISA of IL1B in supernatants of LPS-primed differentiated THP-1 cells (A) and J774A.1 cells (B) treated with 4 μM of LYG-202, followed by stimulation with ATP (5 mM) for 1 h, nigericin (4 μM) for 3 h, MSU (150 μg/ml), MDP (200 ng/ml) or flagellin (200 ng/ml) for 6 h, or transfection of poly(dA:dT) (1 μg/ml) for 8 h. (C) ELISA of IL1B in supernatants of BMDMs treated with 4 μM of LYG-202, followed by stimulation with ATP (5 mM) for 1 h, nigericin (4 μM) for 3 h, MSU (150 μg/ml) for 6 h. (D-F) Immunoblot analysis of IL1B and CASP1 in supernatants (SN) and extracts (Input) of LPS-primed differentiated THP-1 cells (D), J774A.1 cells (E) and BMDMs (F) treated as above. (G) Flow cytometry analysis (top) and quantification (bottom) of mitochondrial ROS by MitoSOX staining in LPS-primed J774A.1 cells treated with 4 μM of LYG-202, followed by stimulation with ATP, nigericin, or MSU. (H) Flow cytometry analysis (top) and quantification (bottom) of mitochondrial status in LPS-primed J774A.1 cells treated as above. Gates represent cells with damaged mitochondria. (I) Flow cytometry analysis of mitochondrial membrane potential by JC-1 staining in LPS-primed J774A.1 cells treated as above. (J) Quantitative real-time PCR analysis of mtDNA released from LPS-primed J774A.1 cells treated as above. Data are presented as mean ± SD (n = 3). *P < 0.05, **P < 0.01.
To confirm that LYG-202 suppressed IL1B secretion depending on NLRP3 inflammasome, we measured IL1B secretion in nlrp3−/− and casp1−/− macrophages, which are defective in inflammasome activation. When incubated with nigericin and LYG-202, all types of inflammasome-deficient macrophages exhibited low level of IL1B secretion compared with WT macrophages (Figure S6C), confirming that the inhibition of IL1B secretion by LYG-202 was highly dependent on the NLRP3 inflammasome. Consistently, LYG-202 suppressed IL1B secretion and CASP1 activity in a concentration-dependent manner (Figure S6D and S6E). Moreover, mature IL1B (p17) and cleaved CASP1 (p20) in the supernatants were significantly suppressed by LYG-202 in LPS-primed differentiated THP-1, J774A.1 cells and primary BMDMs (-8F and S6F). Collectively, these data suggest that LYG-202 suppresses NLRP3 inflammasome activation in the macrophage.
We thus examined the role of LYG-202 in the mitochondrial damage, which triggered by NLRP3 agonist. The results showed that mtROS production and the loss of mitochondrial membrane potential were significantly alleviated after LYG-202 treatment in LPS-primed J774A.1 cells (-8I) and in LPS-primed differentiated THP-1 cells (Figure S7A-S7C). Moreover, mtDNA release induced by NLRP3 agonists was decreased after LYG-202 treatment in LPS-primed J774A.1 and differentiated THP-1 cells ( and S7D). Similarly, LYG-202 also reduced mtROS production in BMDMs and the reduction of mtROS production was independent of NLRP3 or CASP1 deficiency (Figure S7E and S7F). Thus, LYG-202 reduces NLRP3 agonists-induced mitochondrial damage.
LYG-202 promotes AMPK-mediated mitophagy to inhibit NLRP3 inflammosome activation
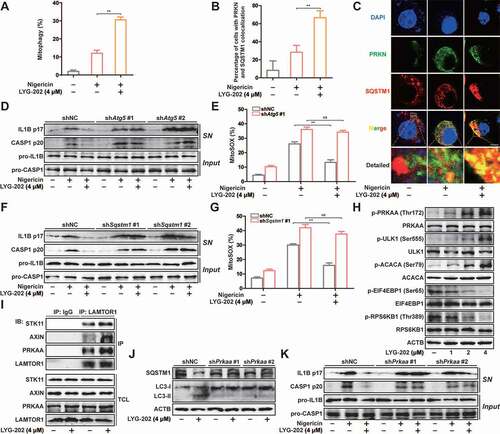
Next, we investigated changes in mitophagy after LYG-202 treatment. As shown in and S8A, the mitophagy was enhanced after LYG-202 treatment in J774A.1 cells. In addition, immunofluorescence results showed that LYG-202 induced significant colocalization of SQSTM1 and PRKN in LPS-primed J774A.1 cells () and colocalization of SQSTM1 and mitochondria in LPS-primed differentiated THP-1 cells (Figure S8B and S8C). These results confirmed that LYG-202 induced mitophagy in macrophages.
Figure 9. LYG-202 initiated mitophagy by activating AMPK to inhibit the NLRP3 inflammasome. (A) FACS analysis LPS-primed J774A.1 cells expressing mito-Keima treated with 4 μM of LYG-202, followed by stimulation with nigericin. (B and C) Quantification of cells (B) with SQSTM1 aggregation on mitochondria and Intracellular distribution (C) of SQSTM1 and mitochondria (TOMM20) in LPS-primed J774A.1 cells treated with 4 μM of LYG-202, followed by stimulation with nigericin, examined by confocal microscopy. Scale bars: 10 µm. (D) Immunoblot analysis of IL1B and CASP1 in supernatants (SN) and extracts (Input) of LPS-primed J774A.1 cells stably expressing Atg5 shRNA, which treated with 4 μM of LYG-202, followed by stimulation with nigericin. (E) Quantification of MitoSOX staining in LPS-primed J774A.1 cells stably expressing Atg5 shRNA, which treated with 4 μM of LYG-202, followed by stimulation with nigericin. (F) Immunoblot analysis of IL1B and CASP1 in supernatants (SN) and extracts (Input) of LPS-primed J774A.1 cells stably expressing Sqstm1 shRNA, which treated with 4 μM of LYG-202, followed by stimulation with nigericin. (G) Quantification of MitoSOX staining in LPS-primed J774A.1 cells stably expressing Sqstm1 shRNA, which treated with 4 μM of LYG-202, followed by stimulation with nigericin. (H) Immunoblot analysis of p-PRKAA/AMPKα (Thr172), PRKAA/AMPKα, p-ULK1 (Ser555), ULK1, p-ACACA/ACC (Ser79), ACACA/ACC, p-EIF4EBP1 (Ser65), EIF4EBP1, p-RPS6KB1/S6K1 (Thr389) and RPS6KB1/S6K1 in J774A.1 cells treated with 1, 2, 4 μM of LYG-202. (I) Immunoblot analysis of STK11/LKB1, AXIN, PRKAA/AMPKα and LAMTOR1 in LAMTOR1 immunoprecipitates and total cell lysate (TCL) of J774A.1 cells treated with 4 μM of LYG-202. (J) Immunoblot analysis of SQSTM1 and LC3 (right) in J774A.1 cells stably expressing Prkaa shRNA, which treated with 4 μM of LYG-202. (K) Immunoblot analysis of IL1B and CASP1 in supernatants (SN) and extracts (Input) of LPS-primed J774A.1 cells stably expressing Prkaa shRNA, which treated with 4 μM of LYG-202, stimulated with nigericin. Data are presented as mean ± SD (n = 3). **P < 0.01.
To determine the role of mitophagy in inhibition of NLRP3 inflammasome by LYG-202, we added CQ to block autophagy flux. As expected, LYG-202-mediated down-regulation of mature IL1B and cleaved CASP1 in the supernatants were reversed by CQ in LPS-primed differentiated THP-1 cells (Figure S8D). The decrease of mtROS mediated by LYG-202 was also reversed after CQ treatment (Figure S8E). During autophagy, ATG5 is involved in the formation of LC3-II to participate in the maturation of autophagosomes [Citation39]. After knockdown of ATG5, the decrease of mature IL1B and cleaved CASP1 expression in the supernatants and mtROS production mediated by LYG-202 was reversed in LPS-primed J774A.1 cells (Figure S8F, 9D and 9E). Furthermore, knockdown of SQSTM1 also reversed inhibition of NLRP3 inflammasome and mtROS production, which was mediated by LYG-202 (Figure S8G, 9 F and 9 G). These results suggest that LYG-202 inhibits NLRP3 inflammasome activation by inducing mitophagy-dependent damaged mitochondria clearance.
More importantly, the AMPK pathway was activated while the MTORC1 pathway was inhibited by LYG-202 in a concentration-dependent manner (). Furthermore, LYG-202 promoted the combination of AXIN, STK11/LKB1 and PRKAA/AMPKα from LAMTOR1 in J774A.1 cells (). After knockdown of PRKAA/AMPKα, down-regulation of SQSTM1 and up-regulation of LC3-II induced by LYG-202 was reversed (Figure S8H and 9 J). Moreover, the decrease of mature IL1B and cleaved CASP1 expression in the supernatants mediated by LYG-202 was reversed in PRKAA/AMPKα knockdown LPS-primed J774A.1 cells (). Taken together, LYG-202 promotes clearance of damaged mitochondria through AMPK-mitophagy to inhibit NLRP3 inflammosome activation.
LYG-202 attenuates sterile inflammation and fulminant hepatitis
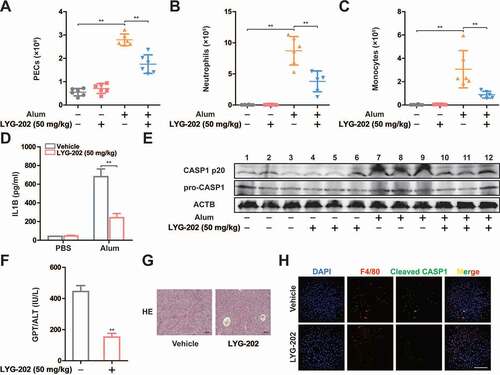
To further examine the function of LYG-202 on NLRP3 inflammasome activation in vivo, we employed alum-induced peritonitis, a mouse model of NLRP3-inflammasome-dependent inflammation [Citation40]. Upon alum challenge, the number of total peritoneal exudate cells (PECs), neutrophils, and monocytes were decreased in LYG-202 treatment mice (-10C). Furthermore, the level of IL1B in the lavage fluid was significantly reduced in LYG-202 treatment mice (). Consistently, cleaved CASP1 (p20) expression was down-regulated in PECs from LYG-202 treatment mice (). Then, we induced fulminant hepatitis, another model of NLRP3-inflammasome-dependent inflammation, with LPS plus D-galactosamine to evaluate the in vivo anti-inflammatory activity of LYG-202. As shown in -10H, LYG-202 alleviated liver damage and suppressed CASP1 activation in liver macrophages. These findings demonstrate that LYG-202 limits excessive inflammation by restraining NLRP3 inflammasome activation.
Figure 10. LYG-202 inhibited NLRP3 inflammasome-dependent sterile inflammation and fulminant hepatitis. (A-C) Alum-induced peritoneal infiltration of PEC (A), neutrophils (ITGAM/CD11b+ LY6G+ ADGRE1/F4/80−) (B), and monocytes (ITGAM/CD11b+ LY6C+ LY6G−) (C) in mice 16 h after alum or PBS injection. (D) Peritoneal IL1B in mice 16 h after alum or PBS injection. (E) Immunoblot analysis of CASP1 activation in PECs 16 h after alum or PBS injection. (F) Serum concentrations of GPT/ALT in mice after LPS plus D-gal challenge. (G) Representative liver histology in mice after LPS plus D-gal challenge. (H) Fluorescent staining of ADGRE1/F4/80, Cleaved CASP1, and DAPI in livers of mice after LPS plus D-gal challenge. Data are presented as mean ± SD (n = 6). **P < 0.01.
Discussion
Persistent and abnormal NLRP3 signals are the basis of many chronic and degenerative diseases, including auto-inflammatory syndrome, gout, osteoarthritis, Alzheimer’s disease, Type 2 diabetes, atherosclerosis, and cancer [Citation2,Citation41]. Therefore, more and more studies have been carried out on NLRP3 inflammasome. Although the regulatory mechanism has been gradually clarified after a long period of research, the metabolic regulation of NLRP3 inflammasome is still a mystery. Some studies suggest that blocking glycolysis inhibits the activation of NLRP3 by inhibiting HK1 or PKM/PKM2 [Citation11,Citation12]. This may not be limited to the inhibition of glycolysis, but more likely to be the function of the metabolic enzymes themselves. During the activation of NLRP3 inflammasome, glycolytic flux was greatly enhanced. It may not be the active effect of glycolysis, but rather the NLRP3 agonist causing mitochondrial damage. Therefore, inhibition of glycolysis may not be a direct way to regulate NLRP3 inflammasome, but an indirect way. Our study found that ALDOA, a monitor of glycolysis, regulated NLRP3 inflammasome by sensing changes in glycolytic flux. In this process, ALDOA controlled the AMPK-mitophagy signaling to maintain mitochondrial damage caused by NLRP3 agonists. Therefore, our study suggested that the glycolytic enzyme ALDOA maintained the activation of NLRP3 inflammasome by monitoring the glycolytic flux during the classical activation of NLRP3.
To clarify the role of glycolysis in the classical activation of NLRP3, we assisted glycolytic intermediates to enter macrophages by permeation of SLO. In this process, the addition of G6P did not further enhance the NLRP3 inflammasome, which suggested that the activation of NLRP3 inflammasome was mainly through the pore-forming toxicity of SLO. G3P and DHAP, the enzyme catalyzed products of ALDOA, induced a decrease in IL1B secretion in the absence of glucose, whereas the addition of glucose eliminated this effect. This suggests that inhibition of NLRP3 inflammasome activation is not a function of G3P or DHAP itself. Further study found that FBP, the enzyme catalyzed substrate of ALDOA, reversed G3P-inhibited IL1B secretion. It is inferred that the glycolytic enzyme ALDOA is involved in this process. The inhibition of NLRP3 activation by ALDOA knockdown proved our hypothesis. Previous studies have confirmed that autophagy is critical in the regulation of NLRP3 inflammasome to prevent the continued abnormal NLRP3 signals [Citation42]. Activation of NLRP3 inflammasome is associated with the presence of mitochondrial damaged [Citation43,Citation44]. Under normal conditions, damaged mitochondria are degraded by mitophagy to maintain mitochondrial homeostasis. But with continued NLRP3 signaling, this balance is disrupted to the extent that the NLRP3 inflammasome is activated. Therefore, activation of mitophagy effectively controls the activation of NLRP3 inflammasome. Among the many signals that regulate autophagy, AMPK signals are involved in the initiation of autophagy. On the one hand, AMPK antagonizes MTORC1 to regulate ULK complex activity; on the other hand, AMPK also regulates class III phosphatidylinositol 3-kinase complex activity and phosphorylates ATG9 to enhance autophagosome biosynthesis [Citation45–48]. In addition, AMPK activation also promotes mitochondrial fission, thus coupling mitochondrial dynamics with mitophagic degradation [Citation49]. In our study, ALDOA knockdown enhanced AMPK signaling and inhibited MTORC1, which may be the main reason for inhibiting ALDOA to initiate mitophagy.
AMPK is generally regarded as a sensor for adenine nucleotides that is activated in low cellular energy states [Citation50]. But new studies show that AMPK is able to sense glucose availability independently of changes in adenine nucleotides [Citation51]. During this process, aldolase acts as a sensor to detect its substrate FBP concentration. When aldolase is unoccupied by FBP, the aldolase-v-ATPase-Ragulator complex provides docking sites for the AXIN-STK11/LKB1 complex to form a new supercomplex consisting of the v-ATPase, Ragulator, AXIN, STK11/LKB1, and AMPK on the lysosomal surface [Citation52,Citation53]. Evidence that knockdown of ALDOA activates AMPK supports this conclusion. ALDOA amino acid residues play different roles in the process of catalytic FBP. For example, D34 residue acts as a base to promote the deprotonation of Schiff base intermediate in the course of substrate cleavage, R43 residue involves in the combination of 6-phosphate sites, K147 residue serves to stabilize the developing negative charge in various transition states in the course of substrate cleavage, E188 residue involves in dehydration of the Schiff base intermediate and carry out deprotonation during substrate cleavage, and K230 residue directly combines with the substrate to form Schiff base [Citation24]. In order to study the mechanism of ALDOA to regulate AMPK activation, we constructed these ALDOA mutants and found that the Schiff base intermediate formed by ALDOA and FBP was crucial for the activation of the AXIN-based AMPK-activation complex.
During PRKN-dependent mitophagy, SQSTM1, an autophagy receptor, is involved in the autophagic degradation of damage mitochondria. Our results not only confirm that SQSTM1 was involved in mitophagy induced by ALDOA knockdown, but also found that ALDOA knockdown promoted the transcription of SQSTM1 through inducing the activity of the SQSTM1 promoter. RNA sequencing analysis confirmed that ALDOA knockdown resulted in increased transcription of 782 genes. This is far more than expected for a glycolytic enzyme. Therefore, we confirmed that ALDOA knockdown may promote FOXO3-mediated SQSTM1 transcription by analyzing the transcriptional upregulating genes, hypothesizing possible transcription factors, and mutating the binding region of the SQSTM1 promoter. In addition, studies have shown that AMPK leads to the activation of FOXO3 transcriptional activity through phosphorylation of FOXO3 [Citation35]. We found that knockdown of ALDOA significantly increased p-FOXO3 (Ser413) expression, while simultaneous knockdown of ALDOA and PRKAA/AMPKα reversed this effect. These results indicated that the phosphorylation of FOXO3 induced by ALDOA knockdown was dependent on PRKAA/AMPKα expression. Furthermore, the positive enrichment of the FOXO3 signaling pathway caused by ALDOA knockdown also confirms our hypothesis. However, how ALDOA regulates the transcription of such a large number of genes remains to be further studied, and our subsequent work will also be carried out around this.
In view of ALDOA’s role in maintaining NLRP3 inflammasome activation, it is imperative to search for small molecule inhibitors of ALDOA. Flavonoids have been widely reported to have inhibitory activity against NLRP3 inflammasomes, as well as the potential to inhibit aldolase activity [Citation36]. We screened a variety of flavonoid compounds with anti-inflammatory potential. Although most of them inhibited the enzyme activity of ALDOA, the inhibitory effect of wogonin on ALDOA was most obvious at 10 μM. Further, wogonin derivatives were screened to inhibit ALDOA enzyme activity, and LYG-202 stood out due to its strong inhibition of ALDOA enzyme activity by binding to ALDOA and occupying the position that Schiff base intermediate formation, thus preventing FBP from combining with ALDOA. Then, we reported that LYG-202 suppressed IL1B secretion and CASP1 cleavage under NLRP3 agonists treatment. Moreover, LYG-202 also removed damaged mitochondria by triggering mitophagy. Furthermore, knockdown of ATG5 or SQSTM1 abolished NLRP3 inflammasome suppression mediated by LYG-202. In addition, LYG-202 also mediated AMPK activation through promotion the formation of lysosomal complexes. While knockdown of PRKAA/AMPKα abolished LYG-202-mediated autophagy and NLRP3 inflammasome suppression. In vivo, LYG-202 attenuated sterile inflammation and fulminant hepatitis, and suppressed the activation of NLRP3 inflammasome activation. In summary, we preliminarily elucidated the mechanism of ALDOA on AMPK signaling, initiation of autophagy, and maintenance of NLRP3 inflammasomes activation, and provided new targets and treatment strategies for regulating NLRP3 inflammasome activation.
Materials and Methods
Reagents and antibodies
LYG-202 (C25H30N2O5, MW: 438.52), was obtained from Z.L. (China Pharmaceutical University, China), was dissolved in dimethylsulfoxide (DMSO) as a stock solution, stored at −20°C, and freshly diluted with RPMI-1640 medium from Gibco (31,800–089) or Dulbecco’s Modified Eagle Medium (DMEM; GIBCO, 12,800–082) to the final concentration in vitro study. In vivo study, LYG-202 was prepared as intragastric administration (0.5% sodium carboxyl methyl cellulose/CMC [Sinopharm Chemical Reagent, 30,036,328]) by Dr. Xue Ke from College of Pharmacy, China Pharmaceutical University.
LPS (E. coli: Serotype O55:B5; L2880), dimethylsulfoxide (DMSO), phorbol 12-myristate 13-acetate/PMA (P8139) and adenosine triphosphate (ATP; A1852) were purchased from Sigma-Aldrich. Nigericin (tlrl-nig) and poly(dA:dT) (tlrl-patn) were purchased from Invivogen. MDP (1698), flagellin (Salmonella typhimurium; 3330) and DAPI (D1306) were purchased from Invitrogen. Paraformaldehyde was purchased from Yonghua Chemical Technology Co. Ltd. (137,202,129). Streptolysin O (SLO; S4470) was purchased from Solarbio Co. Ltd. Triton X-100 (1139) was purchased from Guangzhou Saiguo Biotech. Co. Ltd. BSA (10,711,454,001) was purchased from Roche Diagnosis Ltd. Glucose (50–99-7), G6P (54,010–71-8), F6P (26,177–86-6), FBP (38,099–82-0), G3P (591–59-3), DHAP (102,783–56-2), 3PG (80,731–10-8), and 2PG (23,295–92-3) were purchased from Shanghai Yingxin Laboratory Equipment Co. Ltd. ELISA kits for mouse IL1B (RK00006) and human IL1B (RK00001) were purchased from ABclonal Biotechnology Co. Ltd. MitoSOX Red Mitochondrial Superoxide Indicator (40778ES50), MitoTracker Deep Red FM (40743ES50) and MitoTracker Green FM (40742ES50) were purchased from YEASEN Biotech Co. Ltd. JC-1 (KGA601) was purchased from Keygen biotech.
Primary antibodies against TOMM20 (sc-17,764) and ADGRE1/F4/80 (sc-377,009) were obtained from Santa Cruz Biotechnology; antibodies against CASP1/caspase 1 (A18646), PRKN/parkin (A0968), VDAC (A15735), TUBB/beta tubulin (AC010), ATG5 (A0203), HSPA8 (A14001), ACACA/ACC (A15606), p-EIF4EBP1 (Ser65) (AP0032), EIF4EBP1 (A1248), p-RPS6KB1/S6K1 (Thr389) (AP0564), RPA6KB1/S6K1 (A16658), ULK1 (A8529), STK11/LKB1 (A2122), AXIN1 (A16019) and ACTB/β-actin (AC026) were from ABclonal Biotechnology Co. Ltd. and antibodies against IL1B(12242), p-PRKAA/AMPKα (Thr172; 2535), PRKAA/AMPKα (2532), p-ACAC/ACC (Ser79; 11,818), p-ULK1 (Ser555; 5869), ALDOA (3188), LAMTOR1 (8975), LC3A/B (4108) and poly-ubiquitin (5621) Cleaved CASP1 (89,332) were purchased from Cell Signaling Technology; antibodies to SQSTM1/p62 (AB56416) were obtained from Abcam. HRP goat anti-mouse IgG (H + L; AS003) and HRP goat anti-rabbit IgG (H + L; AS014) were from ABclonal. High-sig ECL Western Blotting Substrate was from Tanon (180–5001). PE-anti-mouse LY6G (108,407) was purchased from BioLegend. APC-anti-ITGAM/CD11b (17–0112-82), FITC-anti-mouse ADGRE1/F4/80 (11–4801-81) and PerCP-Cy5.5-anti-mouse LY6C (45–5932-80) were purchased from eBioscience. Alexa Fluor 488 donkey anti-rabbit IgG (A11008) and Alexa Fluor 594 donkey anti-mouse IgG (A31570) were obtained from Invitrogen.
Cell culture
The murine macrophage J774A.1 cell line was purchased from American Type Culture Collection (TIB-67). The cells were cultured with DMEM medium supplemented with 10% (v:v) fetal bovine serum (Gibco, 16,140,071), 100 U/ml benzyl penicillin and 100 mg/ml streptomycin. Cells were cultured in a humidified environment with 5% CO2 at 37°C, the cells were washed three times with PBS (Solarbio, P1020) and treated with 500 ng /ml LPS in the absence or presence of LYG-202.
Human acute monocytic leukemia THP-1 cells were obtained from Cell Bank of the Chinese Academic of Sciences/CBCAS. THP-1 cells were cultured in RPMI-1640 medium, supplemented with 10% (v:v) fetal bovine serum and 0.05 mM 2-mercaptoethanol, 100 U/ml benzyl penicillin and 100 mg/ml streptomycin. Cells were cultured in a humidified environment with 5% CO2 at 37°C. Differentiation of THP-1 cells was induced by 0.5 μM phorbol 12-myristate 13-acetate/PMA for 12 h. The differentiated cells were washed three times with PBS and treated with 500 ng/ml LPS in the absence or presence of LYG-202.
Bone marrow-derived macrophages (BMDM) were isolated from C57BL/6 mice and cultured with DMEM medium supplemented with 10% (v:v) fetal bovine serum and 20 ng/ml CSF2/GM-CSF (PeproTech, 315–03). Cells were harvested and seeded on cell culture dishes (60 mm × 15 mm). Exchanging culture medium every 3 days, adherent macrophages were obtained within about one week. After being cultured for 6 h without CSF2, the cells were washed three times with PBS and treated with 500 ng/ml LPS in the absence or presence of LYG-202.
Mice
Six- to eight-weeks-old female C57BL/6 J mice, weighing 18–22 g, were supplied by Shanghai Laboratory Animal Center, China Academy of Sciences. The nlrp3 knockout (nlrp3−/−) mice and casp1 knockout (casp1−/−) mice (male, 6–8 weeks old, weighing 18–22 g) were obtained from Gang Hu’s laboratory (Jiangsu Key Laboratory of Neurodegeneration, Department of Pharmacology, Nanjing Medical University). Experimental protocols were in accordance with National Institutes of Health regulations and approved by the Institutional Animal Care and Use Committee. Throughout the acclimatization and study periods, all animals had access to food and water ad libitum and were maintained on a 12 h light/dark cycle (21 ± 2°C with a relative humidity of 45 ± 10%).
Plasmids
The pCMV, pLenti, pGEX, pGL3, pLKO vector plasmid and pRL-TK plasmid were obtained from Lei Qiang’s laboratory (State Key Laboratory of Natural Medicines, China Pharmaceutical University). Point mutations of ALDOA were performed by PCR-based sitedirected mutagenesis using Mut Express II Fast Mutagenesis Kit V2 (Vazyme, C214-01). Expression plasmids for various proteins were constructed in the pCMV vector for transient transfection, in pLenti vector for lentivirus packaging (stably expression), in pGEX vector for protein purification and in pGL3 vector for reporter assay. PCR products were verified by sequencing (Sangon Biotech, Shanghai, China). The lentivirus-based vector pLKO vector was used for expression of shRNA. Sequences of specific shRNAs (from Sigma shRNA Mission library) used in this study are as follows:
shAldoa #1 (5ʹ-CCGGGCATCCATCAACCTCAATGCTCTCGAGAGCATTGAGGTTGATGGATGCTTTTTG-3ʹ)
shAldoa #2 (5ʹ-CCGGGCCCAGTATAAGAAGGATGGACTCGAGTCCATCCTTCTTATACTGGGCTTTTTG-3ʹ)
shAtg5 #1 (5ʹ-CCGGAGCCTCCTCTTCTCGTGAAATCTCGAGATTTCACGAGAAGAGGAGGCTTTTTTG-3ʹ)
shAtg5 #2 (5ʹ-CCGGGCAGAACCATACTATTTGCTTCTCGAGAAGCAAATAGTATGGTTCTGCTTTTTG-3ʹ)
shSqstm1 #1 (5ʹ-CCGGTAGTACAACTGCTAGTTATTTCTCGAGAAATAACTAGCAGTTGTACTATTTTTG-3ʹ)
shSqstm1 #2 (5ʹ-CCGGGAGGTTGACATTGATGTGGAACTCGAGTTCCACATCAATGTCAACCTCTTTTTG-3ʹ)
shPrkn #1 (5ʹ-CCGGCGTGATCTGTTTGGACTGTTTCTCGAGAAACAGTCCAAACAGATCACGTTTTTG-3ʹ)
shPrkn #2 (5ʹ-CCGGCGATTCTGACACCAGCATCTTCTCGAGAAGATGCTGGTGTCAGAATCGTTTTTG-3ʹ)
shCalcoco2 #1 (5ʹ-CCGGAGACCACTCAGGAGTATTATACTCGAGTATAATACTCCTGAGTGGTCTTTTTTG-3ʹ)
shOptn #1 (5ʹ-CCGGGCCTGTTGTTTGAGATGCAAACTCGAGTTTGCATCTCAAACAACAGGCTTTTTG-3ʹ)
shPrkaa1 #1 (5ʹ-CCGGTTGTTGGATTTCCGTAGTATTCTCGAGAATACTACGGAAATCCAACAATTTTTG-3ʹ)
shPrkaa1 #2 (5ʹ-CCGGGACCATAAATTTACCATAAAGCTCGAGCTTTATGGTAAATTTATGGTCTTTTTG-3ʹ)
shPrkaa2 #1 (5ʹ-CCGGCGAGCGACTATCAAAGACATACTCGAGTATGTCTTTGATAGTCGCTCGTTTTTG-3ʹ)
shPrkaa2 #2 (5ʹ-CCGGCGCCAGTCTTATCACTGCTTTCTCGAGAAAGCAGTGATAAGACTGGCGTTTTTG-3ʹ)
Sequences of all oligonucleotides used in this study are available upon request.
Transient transfection and lentivirus infection
Cells were seeded in 6-well plates before transfection. When the cells reached approximately 80% confluence, the transfection was performed using Lentiviral Packaging Kit (YEASEN Biotech, 41102ES10) according to the manufacturer’s instruction. The pLKO or pLenti plasmids with Lentiviral Mix (10 μg) and HG Transgene TM Reagent (60 μL) were transfected into HEK293T cells (ATCC, CRL-3216), according to the manufacturer’s instructions. Virus supernatant was collected 48 h after transfection, and then infected target cells with virus supernatant and selected puromycin or hygromycin for screening.
Cytokine quantification by enzyme-linked immunoassay
Colons from mice in each group were homogenated with lysis buffer to extract total protein. The homogenate was centrifuged at 12,000 × g at 4°C for 15 min. The amount of total extracted protein was determined by BCA protein assay kit (Thermo, 23,225). IL1B production in supernatant differentiated THP-1 cells, J774A.1 cells and BMDMs were measured by ELISA kits (ABclonal, RK00001/ RK00006) according to the manufacturers’ recommendations.
Measurement of mature IL1B and cleaved CASP1
For IL1B and cleavage CASP1 induction, macrophages were plated in 6-well plates. The medium was changed to Opti-MEM (Gibco, 11,058,021) and cells were treated for 6 h with MSU (150 µg/ml; Invivogen, tlrl-msu), MDP (200 ng /ml), flagellin (200 ng /ml), for 3 h with nigericin (4 μM) or for 60 min with ATP (5 mM). For transfection of poly(dA:dT) into cells, Lipofectamine 2000 (4 µl/ml) was used according to the manufacturer’s protocol (Invitrogen). Medium from each well was mixed with 2 ml methanol and 0.5 ml chloroform, vortexed, and centrifuged at 12,000 × g at 4°C for 5 min. The upper phase of each sample was removed and 0.5 ml methanol was added. Samples were centrifuged again at 12,000 × g at 4°C for 5 min as described above, then supernatants were removed and pellets were dried for 5 min at 50°C. Then, 20 µl loading buffer was added to each sample, followed by boiling for 10 min before SDS-PAGE and immunoblot analysis with antibodies for the detection of mature IL1B. Adherent cells in each well were lysed with the lysis buffer described above, followed by immunoblot analysis to determine the cellular content of various proteins.
CASP1 activity assay
The CASP1 activity was detected using a CASP1 activity assay kit (Beyotime, C1101) according to the manufacturer’s instructions. This assay kit is based on the ability of CASP1 to catalyze the substrate acetyl-Tyr-Val-Ala-Asp p-nitroanilide (Ac-YVAD-pNA) to produce yellow p-nitroaniline (pNA), which has a strong absorption at 405 nm. Thus, the activity of CASP1 can be assessed by measuring the absorbance of pNA using a standard pNA curve.
Measurement of mitochondrial contents
Cells seeded in non-tissue culture plates were stimulated as described above. MitoTracker Green (for total mitochondrial mass), MitoTracker Deep Red (for mitochondrial membrane potential) and MitoSOX (for mitochondrial ROS) staining were performed according to manufacturer’s instructions (YEASEN Biotech). For flow cytometry analysis, data were acquired with a FACSCalibur flow cytometer (Becton Dickinson, NJ, USA).
Mitochondrial transmembrane potential (ΔΨm) assessment
The electrical potential difference across inner ΔΨm was monitored using the ΔΨm-specific fluorescent probe JC-1 (Keygen biotech, KGA601) [Citation54]. JC-exists as a monomer with an emission at 530 nm (green fluorescence) at low membrane potential but forms J-aggregates with an emission at 590 nm (red fluorescence) at higher potentials. Differentiated THP-1 cells and J774A.1 cells were harvested and incubated with JC-1 for 30 min at 37°C in the dark, then resuspended in washing buffer and relative fluorescence intensities were monitored using the FACSCalibur flow cytometer (Becton Dickinson, NJ, USA) with settings of FL1 (green) at 530 nm and FL2 (red) 585 nm.
Measurement of cytosolic mtDNA
Macrophages were first primed with LPS (500 ng/ml) followed by treatment with ATP for 60 min or nigericin for 3 h or other NLRP3 agonists for 5 h. Measurement of cytosolic mtDNA was as previously described by using the mitochondrial isolation kit above [Citation55]. DNA was isolated from 300 μl of the cytosolic fractions and mitochondrial DNA encoding mt-CO1 (mitochondrially encoded cytochrome c oxidase I) was measured by quantitative real-time PCR with same volume of the DNA solution. Nuclear DNA encoding Rn18s ribosomal RNA was used for normalization. Primers’ sequences are as previously described [Citation55].
Immunofiuorescence
For confocal imaging of fixed cells. After the appropriate treatment, cells were fixed with 4% paraformaldehyde in PBS, permeabilized with 0.5% Triton X-100 (Guangzhou Saiguo Biotech, 1139), and blocked with 3% BSA for 1 h. Samples was incubated with primary antibodies (diluted 1:100) overnight at 4°C. After washed with PBS for three times, cells were exposed to Alexa Fluor 488 donkey anti-rabbit IgG and Alexa Fluor 594 donkey anti-mouse IgG for 1 h. Then cells were washed with PBS for three times and stained with ProLongTM Gold Antifade Mountant with DAPI. Finally, the slides were photographed with a confocal laser scanning microscope (Fluoview FV1000, Olympus, Tokyo, Japan).
Drug affinity-responsive target stabilization assay (DARTS)
Approximately 1 × 10⁷ cells were lysed with M-PER buffer (Thermo, 78,501) for 10 min at 4°C. After centrifugation at 18,000 g for 10 min, 1 × TNC buffer (50 mM Tris, pH 8.0, 140 mM NaCl, 10 mM CaCl2) was added into cell lysates. Lysates were divided equally into different groups and added with different concentration of drugs. After rotatation overnight at 4°C, the lysates were digested by pronase (Roche, PRON-RO) for 30 min at 37°C. Proteolysis was quenched by mixing with 4 × loading buffer and boiled for 10 min. Then the target protein of drugs was detected by SDS-PAGE analysis.
Cellular thermal shift assay (CETSA)
CETSA was performed to determine the direct binding between LYG-202 and ALDOA. In experiment under temperature gradient, cells were pretreated with 4 μM LYG-202 for 1 h, washed with PBS which contains protease inhibitor cocktail (Roche, P8340) and then transferred into 200 μl PCR tubes. The cells were heat shocked in the Thermal Cycler T960 (Heal Force, Hangzhou, China) at 40∼65°C for 3 min to denature proteins, and immediately cooled down at room temperature for 3 min. Finally, all the samples were subjected to three freeze-thaw cycles with liquid nitrogen and 25°C in Thermal Cycler to lyse cells, then centrifuged at 16,000 g for 20 min at 4°C. The supernatant was added with loading buffer then boiled for western blot. In experiment under concentration gradient, cells were pretreated with 0.01–500 μM LYG-202 for 30 min, then heat shocked in the Thermal Cycler T960 at 59.6°C for 3 min, other procedures were same as above.
Purification of GST fusion proteins
Protein expression was carried out in BL21 Escherichia coli co-transformed with pGEX (HsALDOA, MmALDOA, MmALDOA D34S, MmALDOA R34A, MmALDOA D34S/R34A). The cells were sonicated in lysis buffer (20 mM Tris–HCl, pH 7.6, 137 mM NaCl, 1 mM PMSF [Roche, PMSF-RO], 0.1% Tween 20 [Solarbio, T8220], 5 mM DTT) and the lysate obtained after centrifugation was incubated with Pierce Glutathione Agarose (Invitrogen, 16,100) at 4°C overnight. After washing with lysis buffer, bound proteins were eluted from the resin with elution buffer (30 mM L-glutathione reduced, 200 mM Tris-HCl, pH 8.0) and analyzed via immunoblot.
Microscale thermophoresis (MST)
ALDOA-LYG-202 binding studies were performed using a Monolith NT.115 (Nanotemper Technologies, Munich, Germany) according to manufacturer’s instructions. Briefly, recombinant WT and MT ALDOA proteins were labeled with the FITC (Sigma–Aldrich, F7250). 20 nM of labeled WT or MT ALDOA were mixed with the indicated concentrations of unlabeled LYG-202, incubated for 10 min at room temperature, and loaded into premium capillaries (NanoTemper, MO-K022). Measurements were conducted at 2 to 10% laser power and medium LED power.
Molecular docking
ALDOA protein structure (PDB ID: 1ZAH and 1ZAI) was downloaded from the RCSB Protein Data Bank (http://www.rcsb.org/pdb). Molecular docking was performed with Discovery Studio. Choose “from receptor cavities” to define the site. Select “CDOCKER” (semi-flexible docking) and start docking. In the end, the docking results were imported into Pymol for mapping.
Aldolase activity assay
The ALDOA enzyme activity was detected as described [Citation56]. The Aldolase activity of cells was detected using a FBP aldolase activity assay kit from Beijing Solarbio Science & Technology Co., Ltd (BC0925) according to the manufacturer’s instructions. FBP catalyzes fructose-1,6-bisphosphate and water to produce fructose-6-phosphate and inorganic phosphorus. GPI1/glucose isomerase (contained in the kit) and H6PD/glucose 6-phosphate dehydrogenase (contained in the kit) added in the reaction system catalyze the formation of 6-phosphogluconic acid and NADPH in turn. The increase rate of NADPH at 340 nm can be determined to calculate the activity of FBP.
Co-immunoprecipitation (Co-IP) Analysis
Cells were collected in 1.5 ml EP tube when they reached to 100%. One ml Co-IP lysis buffer (50 mM HEPES, pH 7.4, 150 mM NaCl, 1 mM EDTA, 0.5% NP40 [Thermo, 85,124], 1 mM PMSF [Roche, PMSF-RO], 1x protease inhibitor [Roche, P8340]) was added on ice for 10 min. Then centrifuged (4°C, 14,000 g, 10 min). Meanwhile, 50 μL of protein A/G magnetic beads (MCE, HY-K0202) were incubated with antibodies as indicated in each experiment for 30 min. After washed 4 times, the beads were added in each sample and rotated over night at 4°C. The next day, the beads were washed 4 times and boiled with loading buffer. Then the bound protein was detected by SDS-PAGE.
Western blot analysis
After whole cell lysates were prepared, western blot analysis was performed as described previously [Citation57]. Protein samples were separated by 10% SDS-PAGE and transferred onto nitrocellulose membranes. The membrane was blocked with 3% no fat milk in PBST (PBS with 0.1% Tween 20) at 37°C for 1 h and incubated with the indicated antibodies overnight at 4°C, and then with HRP goat anti-mouse IgG (H + L) or HRP goat anti-rabbit IgG (H + L) secondary antibody for 1 h at 37°C. The samples were visualized with High-sig ECL Western Blotting Substrate and Fully Automatic Chemiluminescence Image Analysis System (Tanon, Shanghai, China).
RNA isolation and qPCR
RNA was isolated from cells and reverse transcribed, and qPCR was performed as previously described [Citation58]. Primer sequences are as follows:
Sqstm1/p62 F: AGGATGGGGACTTGGTTGC; R: TCACAGATCACATTGGGGTGC
Gapdh F: GGCCCCTCTGGAAAGCTGTG; R: CCGCCTGCTTCACCACCTTCT
Luciferase reporter assay
The pGL3 plasmid and pRL-TK plasmid were transfected into cells using Lipofectamine 2000 reagent. Then cells were assayed by using Dual Luciferase Reporter Assay Kit (Vazyme, DL101-01). Luciferase intensity was detected with a Luminoskan Ascent (Thermo Fisher Scientific Inc. Finland).
Chromatin immunoprecipitation (ChIP) assay
Cells were cross-linked with 1% formaldehyde, quenched with 125 mM glycine, washed with PBS, sonicated with Covaris M220 ultrasonicator (Covaris, MA, USA) and centrifuged at 4°C. DNA was fragmented into around 250 bp. Protein A/G magnetic beads were preincubated with IgG or FOXO3 antibody at 4°C overnight. Cell lysates were then incubated with pretreated Protein A/G magnetic beads at 4°C for 4 h. Finally, immune complexes were eluted with elution buffer (1% SDS, 0.1 M NaHCO3, pH 8.4) at room temperature for 10 min. Reverse cross-linking was performed at 65°C overnight in a high salt buffer (0.2 M NaCl, 50 mM Tris, pH 6.5, 10 mM EDTA, 0.2 mg/ml proteinase K [Beyotime, ST532]). Extracted and purified immune-precipitated DNA was quantified by real-time PCR.
Peritonitis model
Peritonitis was induced by i.p. injection of 300 μg alum (Thermo, 77,161; dissolved in 0.2 ml sterile PBS) or PBS into 8–12 weeks old C57BL/6 J mice. Prior to the alum or PBS injection, LYG-202 (50 mg/kg) and vehicle were injected intraperitoneally twice in mice (12 h apart). 16 h after injection, mice were euthanized and the peritoneal cavities were washed with 6 ml cold sterile PBS. Total recruited peritoneal exudate cell (PEC), neutrophils (ITGAM/CD11b+ LY6G+ ADGRE1/F4/80−) and monocytes (ITGAM/CD11b+ LY6C+ LY6G−) present in the peritoneal lavage fluid were quantified by flow cytometry. Isolated cells were stained with labeled antibodies in PBS with 2% FCS and 2 mM EDTA or cell staining buffer (Biolegend, 420,201). Cells were analyzed on a Beckman Coulter Cyan ADP flow cytometer.
Fulminant hepatitis model
Fulminant hepatitis was induced by i.p. injection of LPS (0.5 µg/mouse) and D-galactosamine hydrochloride (D-Gal; Sigma-Aldrich, 34,539-M; 20 mg/mouse) into 8–12 weeks old C57BL/6 J mice. Prior to the LPS and D-Gal injection, LYG-202 (50 mg/kg) and vehicle were injected intraperitoneally twice in mice (12 h apart). D-Gal is an inhibitor of hepatic RNA synthesis, and induces hepatic damage and macrophage infiltration. When mice were given with a low dose of LPS, D-Gal strongly sensitized mice to produce apoptotic liver injury with severe hepatic congestion, resulting in fulminant hepatitis. Mice were euthanized at 6 h after LPS/D-Gal injection, blood and liver samples were then collected for pathological and immunological analyses.
Hematoxylin and Eosin Staining
Paraffin-embedded liver sections were respectively deparaffinized and stained with Hematoxylin and Eosin.
Immunofluorescence of liver tissues
The ADGRE1/F4/80+ cleaved CASP1+ cells infiltration analysis was performed on paraffin-embedded liver tissue sections. Briefly, the sections were deparaffinized, rehydrated and washed in PBS. After treatment with 3% hydrogen peroxide, and blocking with 3% BSA, the sections were incubated for 1 h at room temperature with anti- mouse ADGRE1/F4/80 (1:100) and anti-cleaved CASP1 (1:100). The slides were exposed to Alexa Fluor 488 donkey anti-rabbit IgG or Alexa Fluor 594 donkey anti-mouse IgG for 1 h, then counter-stained with DAPI for 30 min. The reaction was stopped by thorough washing in water for 5 min. Images were acquired by confocal laser-scanning microscope (Olympus, Lake Success, NY). Settings for image acquisition were identical for control and experimental tissues.
Statistical analysis
The data shown in the study were obtained in at least three independent experiments and all results represented the mean ± S.D. Differences between the groups were assessed by one-way ANOVA test. Details of each statistical analysis used were provided in the figure legends. Differences with P values < 0.05 were considered statistically significant.
Supplemental Material
Download Zip (2.6 MB)Acknowledgments
We thank all technicians of State Key Laboratory of Natural Medicines for their kind help with Microscale thermophoresis, and Mrs. zhongliuyi and Dr. Gaoyuan, technicians from Pharmaceutical Animal Experimental Center in China Pharmaceutical University for their kind help in the in vivo experiments.
Disclosure statement
No potential conflict of interest was reported by the author(s).
Supplementary material
Supplemental data for this article can be accessed here
Additional information
Funding
Related Research Data
References
- Strowig T, Henao-mejia J, Elinav E, et al. Inflammasomes in health and disease [J]. Nature. 2012;481(7381):278–286.
- Lamkanfi M, Dixit VM. Inflammasomes and their roles in health and disease [J]. Annu Rev Cell Dev Biol. 2012;28(1):137–161.
- Conforti-Andreoni C, Ricciardi-Castagnoli P, Mortellaro A. The inflammasomes in health and disease: from genetics to molecular mechanisms of autoinflammation and beyond [J]. Cell Mol Immunol. 2011;8(2):135–145.
- Jo EK, Kim JK, Shin DM, et al. Molecular mechanisms regulating NLRP3 inflammasome activation [J]. Cell Mol Immunol. 2016;13(2):148–159.
- Choi AJ, Ryter SW. Inflammasomes: molecular regulation and implications for metabolic and cognitive diseases [J]. Mol Cells. 2014;37(6):441–448.
- Elliott EI, Sutterwala FS. Initiation and perpetuation of NLRP3 inflammasome activation and assembly [J]. Immunol Rev. 2015;265(1):35–52.
- Lamkanfi M, Dixit VM. Mechanisms and functions of inflammasomes [J]. Cell. 2014;157(5):1013–1022.
- Dostert C, Petrilli V, Van Bruggen R, et al. Innate immune activation through Nalp3 inflammasome sensing of asbestos and silica [J]. Science. 2008;320(5876):674–677.
- Soto-Heredero G, M M Gomezdelasheras, Gabande-rodriguez E, et al. Glycolysis - a key player in the inflammatory response [J]. FEBS J. 2020;287(16):3350–3369.
- O’neill LA, Kishton RJ, Rathmell J. A guide to immunometabolism for immunologists [J]. Nat Rev Immunol. 2016;16(9):553–565.
- Moon JS, Hisata S, Park MA, et al. mTORC1-induced HK1-dependent glycolysis regulates NLRP3 inflammasome activation [J]. Cell Rep. 2015;12(1):102–115.
- Xie M, YU Y, Kang R, et al. PKM2-dependent glycolysis promotes NLRP3 and AIM2 inflammasome activation [J]. Nat Commun. 2016;7(1):13280.
- Wolf AJ, Reyes CN, Liang W, et al. Hexokinase Is an Innate Immune Receptor for the Detection of Bacterial Peptidoglycan [J]. Cell. 2016;166(3):624–636.
- Sanman LE, Qian Y, Eisele NA, et al. Disruption of glycolytic flux is a signal for inflammasome signaling and pyroptotic cell death [J]. Elife. 2016;5:e13663.
- Cullen SP, Kearney CJ, Clancy DM, et al. Diverse activators of the NLRP3 inflammasome promote IL-1beta secretion by triggering necrosis [J]. Cell Rep. 2015;11(10):1535–1548.
- Keyel PA, Roth R, Yokoyama WM, et al. Reduction of streptolysin O (SLO) pore-forming activity enhances inflammasome activation [J]. Toxins (Basel). 2013;5(6):1105–1118.
- Harder J, Franchi L, Munoz-planillo R, et al. Activation of the Nlrp3 inflammasome by Streptococcus pyogenes requires streptolysin O and NF-kappa B activation but proceeds independently of TLR signaling and P2X7 receptor [J]. J Immunol. 2009;183(9):5823–5829.
- Zhong Z, Umemura A, Sanchez-lopez E, et al. NF-kappaB restricts inflammasome activation via elimination of damaged mitochondria [J]. Cell. 2016;164(5):896–910.
- Ansari MY, Khan NM, Ahmad I, et al. Parkin clearance of dysfunctional mitochondria regulates ROS levels and increases survival of human chondrocytes [J]. Osteoarthritis Cartilage. 2018;26(8):1087–1097.
- Lazarou M, Sliter DA, Kane LA, et al. The ubiquitin kinase PINK1 recruits autophagy receptors to induce mitophagy [J]. Nature. 2015;524(7565):309–314.
- Komatsu M, Kageyama S, Ichimura Y. p62/SQSTM1/A170: physiology and pathology [J]. Pharmacol Res. 2012;66(6):457–462.
- Heo JM, Ordureau A, Paulo JA, et al. The PINK1-PARKIN mitochondrial ubiquitylation pathway drives a program of OPTN/NDP52 recruitment and TBK1 activation to promote mitophagy [J]. Mol Cell. 2015;60(1):7–20.
- Russell RC, Yuan HX, Guan KL. Autophagy regulation by nutrient signaling [J]. Cell Res. 2014;24(1):42–57.
- Zhang CS, Hawley SA, Zong Y, et al. Fructose-1,6-bisphosphate and aldolase mediate glucose sensing by AMPK [J]. Nature. 2017;548(7665):112–116.
- Zhang CS, Li M, Lin SC. Methods to Study Lysosomal AMPK Activation [J]. Methods Enzymol. 2017;587:465–480.
- Maurady A, Zdanov A, De Moissac D, et al. A conserved glutamate residue exhibits multifunctional catalytic roles in D-fructose-1,6-bisphosphate aldolases [J]. J Biol Chem. 2002;277(11):9474–9483.
- Morris AJ, Tolan DR. Lysine-146 of rabbit muscle aldolase is essential for cleavage and condensation of the C3-C4 bond of fructose 1,6-bis(phosphate) [J]. Biochemistry. 1994;33(40):12291–12297.
- Morris AJ, Davenport RC, Tolan DR. A lysine to arginine substitution at position 146 of rabbit aldolase A changes the rate-determining step to Schiff base formation [J]. Protein Eng. 1996;9(1):61–67.
- Forgac M. Vacuolar ATPases: rotary proton pumps in physiology and pathophysiology [J]. Nat Rev Mol Cell Biol. 2007;8(11):917–929.
- Scaini G, Barichello T, Fries GR, et al. TSPO upregulation in bipolar disorder and concomitant downregulation of mitophagic proteins and NLRP3 inflammasome activation [J]. Neuropsychopharmacol. 2019;44(7):1291–1299.
- Xu Y, Shen J, Ran Z. Emerging views of mitophagy in immunity and autoimmune diseases [J]. Autophagy. 2020;16(1):3–17.
- Narendra D, Kane LA, Hauser DN, et al. p62/SQSTM1 is required for Parkin-induced mitochondrial clustering but not mitophagy; VDAC1 is dispensable for both [J]. Autophagy. 2010;6(8):1090–1106.
- Wu Y, Jin Y, Sun T, et al. p62/SQSTM1 accumulation due to degradation inhibition and transcriptional activation plays a critical role in silica nanoparticle-induced airway inflammation via NF-kappaB activation [J]. J Nanobiotechnology. 2020;18(1):77.
- Li Z, Li Y, Zhou X, et al. Autophagy involved in the activation of the Nrf2-antioxidant system in testes of heat-exposed mice [J]. J Therm Biol. 2018;71:142–152.
- Greer EL, Oskoui PR, Banko MR, et al. The energy sensor AMP-activated protein kinase directly regulates the mammalian FOXO3 transcription factor [J]. J Biol Chem. 2007;282(41):30107–30119.
- Martinez-castillo M, Pacheco-Yepez J, Flores-huerta N, et al. Flavonoids as a natural treatment against entamoeba histolytica [J]. Front Cell Infect Microbiol. 2018;8:209.
- Serafini M, Peluso I, Raguzzini A. Flavonoids as anti-inflammatory agents [J]. Proc Nutr Soc. 2010;69(3):273–278.
- Jafari R, Almqvist H, Axelsson H, et al. The cellular thermal shift assay for evaluating drug target interactions in cells [J]. Nat Protoc. 2014;9(9):2100–2122.
- Kim KW, Paul P, Qiao J, et al. Enhanced autophagy blocks angiogenesis via degradation of gastrin-releasing peptide in neuroblastoma cells [J]. Autophagy. 2013;9(10):1579–1590.
- Eisenbarth SC, Colegio OR, O’Connor W, et al. Crucial role for the Nalp3 inflammasome in the immunostimulatory properties of aluminium adjuvants [J]. Nature. 2008;453(7198):1122–1126.
- Heneka MT, Kummer MP, Latz E. Innate immune activation in neurodegenerative disease [J]. Nat Rev Immunol. 2014;14(7):463–477.
- Mehto S, Chauhan S, Jena KK, et al. IRGM restrains NLRP3 inflammasome activation by mediating its SQSTM1/p62-dependent selective autophagy [J]. Autophagy. 2019;15(9):1645–1647.
- Kim MJ, Yoon JH, Ryu JH. Mitophagy: a balance regulator of NLRP3 inflammasome activation [J]. BMB Rep. 2016;49(10):529–535.
- Lin Q, Li S, Jiang N, et al. PINK1-parkin pathway of mitophagy protects against contrast-induced acute kidney injury via decreasing mitochondrial ROS and NLRP3 inflammasome activation [J]. Redox Biol. 2019;26:101254.
- T A DITE, Ling NXY, Scott JW, et al. The autophagy initiator ULK1 sensitizes AMPK to allosteric drugs [J]. Nat Commun. 2017;8(1):571.
- Egan DF, Shackelford DB, Mihaylova MM, et al. Phosphorylation of ULK1 (hATG1) by AMP-activated protein kinase connects energy sensing to mitophagy [J]. Science. 2011;331(6016):456–461.
- Weerasekara VK, Panek DJ, Broadbent DG, et al. Metabolic-stress-induced rearrangement of the 14-3-3zeta interactome promotes autophagy via a ULK1- and AMPK-regulated 14-3-3zeta interaction with phosphorylated Atg9 [J]. Mol Cell Biol. 2014;34(24):4379–4388.
- Kim J, Kim YC, Fang C, et al. Differential regulation of distinct Vps34 complexes by AMPK in nutrient stress and autophagy [J]. Cell. 2013;152(1–2):290–303.
- Toyama EQ, Herzig S, Courchet J, et al. Metabolism. AMP-activated protein kinase mediates mitochondrial fission in response to energy stress [J]. Science. 2016;351(6270):275–281.
- Liang J, SHAO SH, Xu ZX, et al. The energy sensing LKB1-AMPK pathway regulates p27(kip1) phosphorylation mediating the decision to enter autophagy or apoptosis [J]. Nat Cell Biol. 2007;9(2):218–224.
- Lin SC, Hardie DG. AMPK: sensing glucose as well as cellular energy status [J]. Cell Metab. 2018;27(2):299–313.
- Zhang CS, Jiang B, Li M, et al. The lysosomal v-ATPase-Ragulator complex is a common activator for AMPK and mTORC1, acting as a switch between catabolism and anabolism [J]. Cell Metab. 2014;20(3):526–540.
- Zhang CS, Li M, Zong Y, et al. Determining AMPK activation via the lysosomal v-ATPase-ragulator-AXIN/LKB1 axis [J]. Methods Mol Biol. 2018;1732:393–411.
- Guo Y, Zhao Y, Zhou Y, et al. LZ-101, a novel derivative of danofloxacin, induces mitochondrial apoptosis by stabilizing FOXO3a via blocking autophagy flux in NSCLC cells [J]. Cell Death Dis. 2019;10(7):484.
- Nakahira K, Haspel JA, Rathinam VA, et al. Autophagy proteins regulate innate immune responses by inhibiting the release of mitochondrial DNA mediated by the NALP3 inflammasome [J]. Nat Immunol. 2011;12(3):222–230.
- Cho EJ, Devkota AK, Stancu G, et al. A robust and cost-effective luminescent-based high-throughput assay for fructose-1,6-bisphosphate aldolase A [J]. SLAS Discov. 2020;25(9):1038–1046.
- Zhao Y, Guo Q, Zhu Q, et al. Flavonoid VI-16 protects against DSS-induced colitis by inhibiting Txnip-dependent NLRP3 inflammasome activation in macrophages via reducing oxidative stress [J]. Mucosal Immunol. 2019;12(5):1150–1163.
- Zhao Y, Guo Q, Zhao K, et al. Small molecule GL-V9 protects against colitis-associated colorectal cancer by limiting NLRP3 inflammasome through autophagy [J]. Oncoimmunology. 2017;7(1):e1375640.