
ABSTRACT
Modulation of the host cell cycle has emerged as a common theme among the pathways regulated by bacterial pathogens, arguably to promote host cell colonization. However, in most cases the exact benefit ensuing from such interference to the infection process remains unclear. Previously, we have shown that Salmonella actively induces G2/M arrest of host cells, and that infection is severely inhibited in cells arrested in G1. In this study, we demonstrate that Salmonella vacuolar replication is inhibited in host cells blocked in G1, whereas the cytosolic replication of the closely related pathogen Shigella is not affected. Mechanistically, we show that cells arrested in G1, but not cells arrested in G2, present dysregulated endolysosomal trafficking, displaying an abnormal accumulation of vesicles positive for late endosomal and lysosomal markers. In addition, the macroautophagic/autophagic flux and degradative lysosomal function are strongly impaired. This endolysosomal trafficking dysregulation results in sustained activation of the SPI-1 type III secretion system and lack of vacuole repair by the autophagy pathway, ultimately compromising the maturation and integrity of the Salmonella-containing vacuole. As such, Salmonella is released in the host cytosol. Collectively, our findings demonstrate that the modulation of the host cell cycle occurring during Salmonella infection is related to a disparity in the permissivity of cells arrested in G1 and G2/M, due to their intrinsic characteristics.
Abbreviations: CDK4: cyclin dependent kinase 4; CDK6: cyclin dependent kinase 6; CDK4-CDK6i: CDK4-CDK6 inhibitor IV; cfu: colony-forming units; CHQ: chloroquine; DMSO: dimethyl sulfoxide; EEA1: early endosome antigen 1; FITC: fluorescein isothiocyanate; GFP: green fluorescent protein; hpi: hours post-infection; LAMP1: lysosomal associated membrane protein 1; MAP1LC3B/LC3B: microtubule associated protein 1 light chain 3 beta; MOI: multiplicity of infection; RAB7: RAB7, member RAS oncogene family; SCV: Salmonella-containing vacuole; SPI-1: Salmonella pathogenicity island-1; SPI-2: Salmonella pathogenicity island-2; TFEB: transcription factor EB; T3SS: type III secretion system
Introduction
The bacterium Salmonella enterica serovar Typhimurium (hereafter, Salmonella) is a facultative intracellular pathogen that causes self-limiting gastroenteritis in several animal species, including humans. Salmonella is able to infect various cell types, including epithelial cells and macrophages, in the gastrointestinal tract of infected hosts [Citation1]. Following entry into host cells, Salmonella mostly resides and replicates in a membrane-bound vacuole, referred to as Salmonella-containing vacuole (SCV) [Citation2,Citation3]. In epithelial cells, a subpopulation of the bacteria can escape the SCV and hyper-replicate in the host cell cytosol [Citation4,Citation5]. The maturation of the SCV results from extensive interactions with the endolysosomal trafficking pathway. Importantly, Salmonella interaction with host cells is orchestrated by the action of bacterial effector proteins that are secreted into host cells through two type III secretion systems (T3SS) [Citation6–8]. The T3SS encoded in the pathogenicity island-1 (SPI-1 T3SS) is associated with invasion of epithelial cells and initial steps of SCV biogenesis. On the other hand, the effector proteins secreted by the pathogenicity island-2 T3SS (SPI-2 T3SS) are crucial to SCV maturation, bacterial replication, and intracellular survival.
Modulation of the host cell cycle has emerged as a recurrent feature in bacterial pathogenesis. For example, it has been described that Shigella flexneri and enteropathogenic Escherichia coli (EPEC) block host cells in G2/M [Citation9,Citation10], Neisseria gonorrhoeae arrests cells in the G1 phase [Citation11], and Listeria monocytogenes induces S phase delay [Citation12]. Several molecular strategies are exploited by bacterial pathogens to control the host cell cycle, including the secretion of bacterial effectors and toxins (generally called cyclomodulins) into the host cytosol [Citation13,Citation14], or via the modulation of host microRNAs that regulate the cell cycle machinery [Citation15]. Although the most frequent outcome of host cell cycle regulation during bacterial infections is to favor host cell colonization, in most cases the exact benefit to the infection process remains unclear.
Similar to other bacterial pathogens, Salmonella has been shown to manipulate the host cell cycle [Citation16–18]. Studies performed in our laboratory showed that Salmonella induces G2/M cell cycle arrest in infected cells via the secretion of the SPI-2 T3SS effector SpvB [Citation18], in agreement with previous results of SpvB ectopic expression [Citation19]. Moreover, through the modulation of microRNAs, in particular the downregulation of the MIR15 family and consequent upregulation of cell cycle-related targets (e.g. CCND1 [cyclin D1]), Salmonella promotes the transition between the G1 and S phases [Citation18]. This is a crucial event for Salmonella pathogenesis, because host cells arrested in G1 are refractory to infection, whereas cells arrested in G2/M are permissive. Nonetheless, it remains unclear why cells blocked in the G1 phase provide an environment that is not favorable to Salmonella infection.
Here, we investigated distinguishing features of cells arrested in the G1 phase, when compared to cycling cells, to explain the lower permissivity of the former to Salmonella infection. We found that Salmonella vacuolar replication is inhibited in host cells blocked in the G1 phase. We demonstrate that this inhibition is a result of extensive dysregulation of endolysosomal trafficking, leading to deficient maturation and compromised integrity of the SCV. Collectively, our findings elucidate that modulation of the host cell cycle by Salmonella favors infection, by promoting bacterial escape from the unfavorable environment for vacuolar replication encountered in cells blocked in the G1 phase.
Results
Salmonella replication is impaired in cells arrested in the G1 phase of the host cell cycle
Previous studies have indicated that Salmonella infects and replicates more efficiently in host cells arrested in the G2/M phases of the cell cycle, whereas cells blocked in the G1 phase are significantly less permissive to infection [Citation18,Citation20]. To investigate to which extent Salmonella replication within host cells is impaired in the G1 phase, we pre-treated HeLa cells, a widely used model for bacterial-host interaction studies, with an inhibitor of CDK4 (cyclin dependent kinase 4) and CDK6 (cyclin dependent kinase 6), referred to as CDK4-CDK6i [Citation21], to arrest cells in G1 (, S1A). The efficiency of Salmonella infection was evaluated at various times post-infection by fluorescence microscopy and colony-forming units (cfu) assays. Interestingly, bacterial entry into host cells and early stages of infection were not affected in cells arrested in G1 when compared to cycling cells (1 h post-infection [hpi]), while a strong decrease in bacterial replication was observed at later time points (8 and 20 hpi; 7.6 to 9.6-fold decrease between cells arrested in G1 and cycling cells at 20 hpi; ). Similarly, Salmonella replication at late times was impaired in cells in the G1 phase in a colon epithelial cell line (HCT-8 cells; 20 hpi; ). Of note, the percentage of HCT-8 cells with high levels of Salmonella replication at 4 and 8 hpi was significantly increased in G1-arrested cells (,F). To ensure that the impairment of Salmonella infection in G1 was not due to an effect of CDK4-CDK6i directly on the bacteria, we first established that the inhibitor did not affect Salmonella growth (Fig. S1B). Also, CDK4-CDK6i treatment had only a minor effect on cell viability (reduction from 94% in cycling cells to 86% in G1-arrested cells; Fig. S1C). Moreover, G1 arrest was induced using an alternative drug, specifically lovastatin (Fig. S1A) [Citation22,Citation23]. Similar to CDK4-CDK6i, lovastatin treatment inhibited Salmonella replication at late times post-infection (20 hpi), while the early interaction of bacteria with host cells remained unaffected (1 hpi) (Fig. S1D, S1E). Along this line, we have previously shown that cells overexpressing microRNAs (MIR15 family, MIR7-5p, MIR9-5p, MIR26A-5p, MIR26B-5p) and knockdown of cell-cycle related genes (CCND1, CDK4, CDK6), which induce arrest in the G1 phase, inhibit the late stages of Salmonella infection [Citation18].
Figure 1. Salmonella replication is compromised in epithelial cells blocked in G1. (A) Schematic representation of the experimental design. Cells were treated with vehicle (DMSO, cycling) or CDK4-CDK6i to induce G1 arrest, and 16 h later were infected with Salmonella; DMSO or CDK4-CDK6i were maintained during infection. Infection was analyzed at 1, 4, 8, and 20 hpi. (B-G) Representative images (B, E), percentage of infected cells (C, F), and quantification of intracellular Salmonella by cfu (D, G) of HeLa (B-D) or HCT-8 (E-G) cells treated with DMSO (cycling) or CDK4-CDK6i (G1 arrest), and infected with Salmonella. Data for the percentage of infected cells, determined by automated image analysis, are shown for total infected cells and cells with replicating bacteria. (H) Percent of viability of Galleria mellonella larvae at the indicated times after Salmonella infection. Larvae were injected once with CDK4-CDK6i or DMSO 24 h prior to Salmonella infection. (I and J) Representative images (I), and quantification of intracellular Shigella by cfu (J) of HeLa cells treated with DMSO (cycling) or CDK4-CDK6i (G1 arrest), and infected with Shigella. Infection was performed at MOI 25 (D, G, I, J) or MOI 50 (B, C, E, F). Scale bars: 25 µm. Results are shown as mean±s.e.m. of n = 8 (D, G), n = 6 (F) or n = 5 (C, J) biologically independent experiments; microscopy images are representative of n = 6 (E) or n = 5 (B, I) biologically independent experiments; *P < 0.05, #P < 0.05, ###P < 0.001 and ***P < 0.001 (statistical analysis is detailed in Table S1).
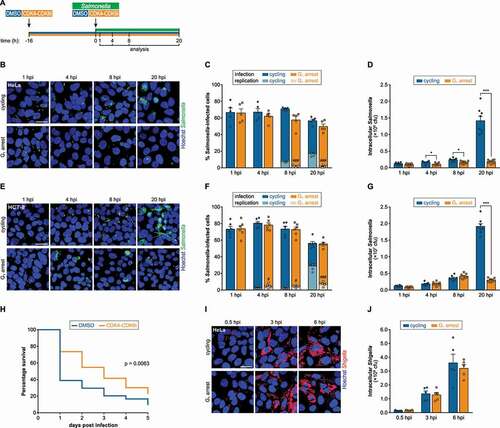
Because the arrest of host cells in the G1 phase of the cell cycle by CDK4-CDK6i or lovastatin caused a dramatic reduction of Salmonella infection in vitro, we decided to evaluate if this could translate into a phenotype in vivo. For this purpose, we used Galleria mellonella larvae, an established infection model for testing of antibacterial activity [Citation24]. Pre-treatment of larvae with CDK4-CDK6i increased G. mellonella survival to Salmonella infection compared to vehicle- (DMSO-) treated larvae (), indicative of a less productive infection.
To evaluate if inhibition of bacterial intracellular replication in cells blocked in the G1 phase is a general phenomenon or restricted to Salmonella, we analyzed the infection of the closely related pathogen Shigella flexneri. Shigella intracellular load was similar in cells in G1 and cycling cells, at all time points post-infection tested (0.5 hpi – early, 3 hpi – intermediate, and 6 hpi – late; ,J).
Overall, these results demonstrate that intracellular replication of Salmonella, but not that of Shigella, is impaired in host cells arrested in the G1 phase of the cell cycle.
Salmonella SPI-2 T3SS activation and SPI-1 shutdown are compromised in the G1 phase of the host cell cycle
Although Salmonella and Shigella are closely related bacterial pathogens, they exhibit distinct intracellular lifestyles. In epithelial cells, Salmonella replication occurs mostly in the SCV, particularly at late times post-infection, whereas Shigella rapidly escapes from the vacuole and replicates exclusively in the host cytosol [Citation25]. Given that Salmonella replication, but not that of Shigella, was inhibited in cells arrested in G1, we hypothesize that this phenotype could be related to its vacuolar lifestyle. The activation of Salmonella SPI-2 T3SS is crucial for the process of SCV maturation and subsequent vacuolar bacterial replication [Citation8].
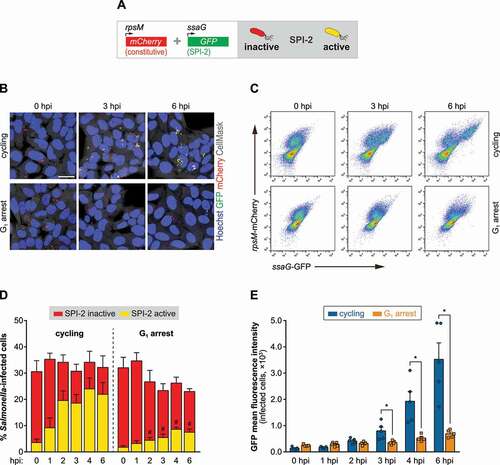
As a first approach to evaluate SPI-2 T3SS activation, we used a Salmonella strain containing a reporter plasmid that expresses green fluorescent protein (GFP) under the control of a SPI-2 T3SS gene promotor (ssaG) [Citation26,Citation27], and that also expresses mCherry constitutively (). Thus, GFP expression is only induced in a properly matured SCV, whereas mCherry expression allows the detection of all the bacteria present inside host cells. Microscopy and flow cytometry analyses revealed a strong reduction of SPI-2 T3SS activation in HeLa and HCT-8 cells blocked in G1, when compared to cycling cells (, S2A-D). Of note, a clear increase of cells with high Salmonella replication was observed in G1-arrested HCT-8 cells, particularly at 6 hpi (Fig. S2A). According to the literature [Citation4], the high number of bacterial per cell and the fact that these were SPI-2 negative indicate that these are hyper-replicating bacteria in the host cytosol.
Figure 2. Inhibition of Salmonella vacuolar replication in cells arrested in G1 results from compromised activation of SPI-2 T3SS. (A) Schematic representation of the reporter for SPI-2 T3SS activation. SPI-2 T3SS reporter Salmonella strain harbors a plasmid that expresses GFP under the control of a SPI-2 T3SS gene promotor (ssaG), and a second plasmid that expresses mCherry from a constitutive promoter (rpsM). (B) Representative images of HeLa cells treated with DMSO (cycling) or CDK4-CDK6i (G1 arrest), and infected with Salmonella harboring the SPI-2 T3SS reporter. (C-E) Representative scatter plots of flow cytometry analysis (C) and corresponding quantification of the percentage of Salmonella-infected cells (mCherry-positive cells), percentage of cells with activated SPI-2 T3SS (mCherry- and GFP-positive cells) (D), and GFP mean fluorescence intensity of the infected cells (E), of HeLa cells treated with DMSO (cycling) or CDK4-CDK6i (G1 arrest), and infected with Salmonella harboring the SPI-2 T3SS reporter. Infection was performed at MOI 25. Scale bar: 25 µm. Results are shown as mean±s.e.m. of n = 5 biologically independent experiments; microscopy images are representative of n = 5 biologically independent experiments; *P < 0.05 and #P < 0.05 (statistical analysis is detailed in Table S1).
To further confirm the impaired activation of the SPI-2 T3SS in G1, we analyzed by qPCR the expression levels of 3 SPI-2 T3SS effectors (PipB2, SopD2, SteC), 2 SPI-2 T3SS apparatus components (SsaG, SseC), and of the transcriptional regulator SsrB, which positively controls SPI-2 T3SS [Citation8,Citation28–30]. The levels of all 6 transcripts were significantly lower in cells blocked in G1 compared to cycling cells, both in HeLa and HCT-8 cells (, S3A). Additionally, we evaluated the protein levels of SteC and PipB2. Consistent with the qPCR data, the protein levels were considerably lower in cells arrested in G1 (,C, S3B, S3C). To exclude that the compromised SPI-2 T3SS activation was due to a direct effect of CDK4-CDK6i on the bacteria, Salmonella was grown in acidic SPI-2-inducing minimal medium (pH 5.8) [Citation31] in the absence or presence of CDK4-CDK6i. Expression of the tested SPI-2 dependent transcripts was induced in this medium compared to control medium (pH 7.0), though similar in the presence or absence of CDK4-CDK6i (Fig S3D), indicating that the CDK4-CDK6i does not directly affect SPI-2 activation by the bacteria.
Figure 3. Activation of SPI-2 T3SS and shutdown of SPI-1 T3SS are impaired in host cells blocked in G1. (A) Expression levels of SPI-2 T3SS-related transcripts (pipB2, sopD2, steC, ssaG, sseC, ssrB), evaluated by qRT-PCR, in HeLa cells treated with DMSO (cycling) or CDK4-CDK6i (G1 arrest), and infected with Salmonella. Data are shown normalized to control cells, collected 1 hpi. (B-E) Protein levels of SteC, PipB2 (SPI-2 T3SS effectors, B and C), SopE, and SptP (SPI-1 T3SS effectors, D and E), determined by western blot, in HeLa cells treated with DMSO (cycling) or CDK4-CDK6i (G1 arrest), and infected with Salmonella. Quantification data are shown normalized to control cells, collected at 2 hpi (B and C) or 0.5 hpi (D and E), and normalized to both ACTB/β-actin and GroEL (loading controls for human and bacterial cells, respectively). Infection was performed at MOI 25 (A) or MOI 100 (B-E). Results are shown as mean±s.e.m. of n = 6 (A) or n = 4 (B-E) biologically independent experiments; western blots are representative of n = 4 biologically independent experiments; *P < 0.05, **P < 0.01 and ***P < 0.001 (statistical analysis is detailed in Table S1).
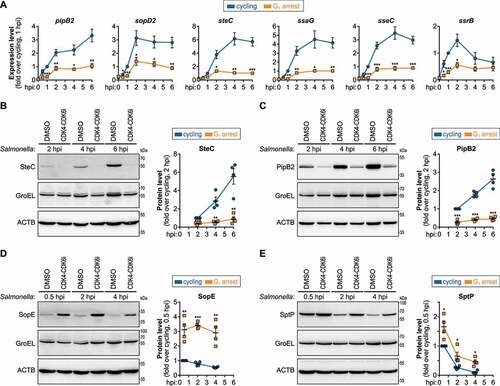
The compromised activation of the SPI-2 T3SS in cells blocked in G1 prompted us to also investigate the activation status of the SPI-1 T3SS. As extensively described [Citation6,Citation32], the expression of SPI-1 T3SS genes is downregulated following Salmonella internalization into host cells, while the expression of SPI-2 T3SS genes is induced, thus facilitating the transition between the Salmonella extracellular and intracellular lifestyles. Interestingly, the protein levels of the 2 tested SPI-1 effectors, specifically SopE and SptP, were significantly higher in cells arrested in G1 than in cycling cells (,E, S3E, S3F).
These results were further corroborated by lower levels of SteC and higher levels of SopE upon infection of cells knockdown for CDK4 (Fig. S3G, S3H), which also resulted in G1 arrest albeit less efficiently than CDK4-CDK6 inhibitors [Citation33–35]. Of note, in cells blocked in G2 by treatment with RO-3306 (Fig. S1A), an inhibitor of CDK1/cyclin dependent kinase 1 [Citation36], the protein levels of SPI-2 and SPI-1 effectors remained unchanged when compared to cycling cells (Fig. S3I, S3J).
Taken together, these results show that the activation of SPI-2 T3SS and shutdown of SPI-1 T3SS are specifically and strongly impaired in host cells blocked in the G1 phase of the cell cycle, explaining the compromised vacuolar replication of Salmonella.
Endolysosomal trafficking and autophagy are dysregulated in mammalian cells arrested in the G1 phase of the cell cycle
The impaired SPI-2 T3SS activation suggests that SCV maturation is severely compromised in G1. Maturation of the SCV is deeply interconnected with endolysosomal trafficking of host cells and therefore we investigated various aspects of this process. Firstly, we observed an abnormal accumulation of vesicles in cells arrested in G1, when compared to cycling cells (). Transmission electron microscopy (TEM) revealed that these vesicles were filled with electron-dense non-digested content (, S4A). In agreement, we observed a strong increase in the number of vesicles labeled with LysoTracker in cells blocked in G1 (). Immunofluorescence staining of early endosomes (EEA1 [early endosome antigen 1]), late endosomes (RAB7 [RAB7, member RAS oncogene family]), and lysosomes (LAMP1 [lysosomal associated membrane protein 1]) in cells in G1 corroborated marked alterations of the endolysosomal trafficking. In particular, we observed that G1 cells exhibited an accumulation of EAA1-positive vesicles in a perinuclear localization, compared to a more evenly distributed localization of these vesicles in cycling cells (); for both RAB7 and LAMP1, the differences were even more striking, with a clear accumulation of vesicles labeled with these markers in cells arrested in G1 (, S4B). The increase of RAB7 and LAMP1 protein levels in cells blocked in G1 was also detected by western blot (, S4C), while the EEA1 levels were not changed ().
Figure 4. Cells arrested in G1 exhibit dysregulated endolysosomal trafficking and autophagy. (A and B) Bright-field (A) and transmission electron microscopy (TEM) (B) images of HeLa cells treated with DMSO (cycling) or treated with CDK4-CDK6i (G1 arrest). (C) Representative images of HeLa cells treated with DMSO (cycling) or CDK4-CDK6i (G1 arrest) and stained for various endolysosomal markers (LysoTracker, EEA1, RAB7, and LAMP1). (D) EEA1, RAB7 and LAMP1 protein levels, determined by western blot, in HeLa cells treated with DMSO (cycling) or CDK4-CDK6i (G1 arrest). ACTB/β-actin or TUBA4A/α-tubulin were used as loading controls. (E) Representative images of HeLa cells treated with DMSO (cycling) or treated with CDK4-CDK6i (G1 arrest) and stained for the autophagy marker LC3B. (F and K) LC3B protein levels, determined by western blot, in HeLa cells treated with DMSO (cycling), CDK4-CDK6i (G1 arrest; F) or RO-3306 (G2 arrest; K). Where indicated, cells were co-treated with the autophagosome-lysosome fusion inhibitor chloroquine (CHQ, 100 µM) for the last 3 h. Quantification of LC3B-II protein levels (normalized to loading control) is shown normalized to control cells without CHQ treatment. (G) Representative images of HeLa cells treated with DMSO (control), CDK4-CDK6i (G1 arrest) or CHQ (200 µM, 3 h) and stained for the transcription factor TFEB. (H) TFEB protein levels, determined by western blot, in cytoplasmic (cyt) and nuclear (nuc) extracts of HeLa cells treated with DMSO (cycling), CDK4-CDK6i (G1 arrest) or CHQ. LMNB1 (lamin B1) and TUBA4A/α-tubulin were used to control the purity of the nuclear and cytoplasmic fractions, respectively. (I and J) Representative images of HeLa cells treated with DMSO (cycling) or treated with RO-3306 (G2 arrest) and stained for LAMP1 (I) or LC3B (J). (L) Representative images of HeLa cells treated with DMSO (cycling) or CDK4-CDK6i (G1 arrest) and incubated with DQ-Red BSA. (M) Flow cytometry quantification of mean fluorescence intensity of DQ-Red BSA of HeLa cells treated with DMSO (cycling) or CDK4-CDK6i (G1 arrest). Data from cells treated with CHQ and NH4Cl, inhibitors of lysosomal acidification, are shown for comparison. (N) CTSD (cathepsin D) processing, evaluated by western blot, in HeLa cells treated with DMSO (cycling) or CDK4-CDK6i (G1 arrest). ACTB/β-actin was used as a loading control. Scale bars: 25 µm, except panel B, 3 µm. Results are shown as mean±s.e.m. of n = 7 (M), n = 6 (D), n = 5 (F) or n = 4 (K) biologically independent experiments; microscopy images are representative of n = 5 (B, C, E), or n = 3 (A, G, I, J, L) biologically independent experiments; western blots are representative of n = 6 (D), n = 5 (F, H, N) or n = 4 (K) biologically independent experiments; *P < 0.05, **P < 0.01 and ***P < 0.001 (statistical analysis is detailed in Table S1).
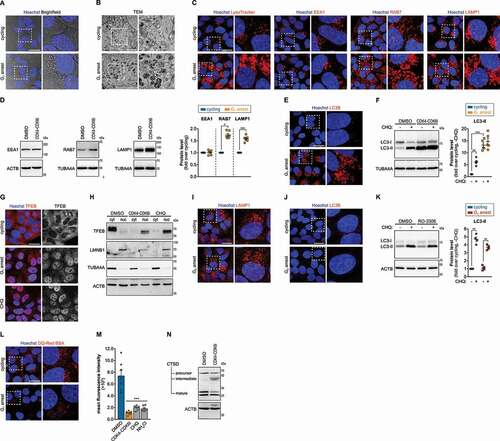
Given the dramatic changes in endolysosomal components/trafficking network, we reasoned that the autophagy pathway could also be altered. Indeed, CDK4-CDK6 inhibition strongly increased the number of vesicles labeled for the autophagosome marker MAP1LC3B/LC3B (microtubule associated protein 1 light chain 3 beta) (, S4D). In addition, LC3B-II protein levels, generated by the conjugation of cytosolic LC3B-I to phosphatidylethanolamine on the surface of autophagosomes, were also increased in CDK4-CDK6i-treated cells (, S4E). These results are compatible with either an increase of autophagosome biogenesis or impairment of autophagic flux in G1. In control cells, the inhibition of autophagosome-lysosome fusion by chloroquine (CHQ) treatment increased LC3B-II. In contrast, CHQ failed to cause an additional increase of LC3B-II levels in CDK4-CDK6i-treated cells (, S4E), indicating a compromised autophagic flux in these cells.
The TFEB (transcription factor EB) is a major regulator of lysosomal function and autophagy [Citation37], and its activity is strictly regulated by multiple mechanisms, including its subcellular localization. While inactive TFEB is predominantly cytosolic, under conditions of lysosomal dysfunction/stress TFEB is activated and translocates to the nucleus where it activates transcription of target genes, mostly involved in lysosomal biogenesis, acidification, and autophagy [Citation38]. Interestingly, we observed nuclear translocation of TFEB in cells arrested in G1, similarly to what is typically observed in cells undergoing lysosomal stress (e.g. CHQ treatment) ().
The strong increase of LAMP1 and LC3B labeled vesicles and impaired autophagic flux in cells blocked in G1 by CDK4-CDK6i treatment were further supported by similar results in cells depleted of CDK4 (Fig. S4F-H). Conversely, both the endolysosomal trafficking and autophagy pathway in G2-arrested cells were comparable to cycling cells (). It should be noted that G2 arrest only had negligible effect on host cell viability, comparable to that of G1 arrest (Fig. S1C). Also relevant, was the observation that the described phenotypes were specific to G1-arrested cells and did not occur in cycling cells synchronized by double thymidine block and collected after release in the G2 or G1 phases (8 h and 12 h post-release, respectively; Fig. S4I-L).
Overall, these results demonstrate that in cells blocked in G1 there is an impairment of the endolysosomal trafficking, with potential implications for the maturation of the SCV.
Lysosomal function is compromised in cells blocked in the G1 phase of the host cell cycle
The accumulation of endolysosomal vesicles, impaired autophagic flux, and nuclear translocation of TFEB strongly suggest that cells arrested in G1 experience lysosomal stress, likely due to a defect in lysosomal function.
To evaluate lysosomal function we used the DQ-Red BSA conjugate, which is labeled to a high degree with red-fluorescent BODIPY TR-X so that the fluorescence is self-quenched. When DQ-Red BSA is cleaved by lysosomal hydrolases, de-quenching of the fluorophore occurs increasing the fluorescence signal, which can be monitored by microscopy or flow cytometry [Citation39,Citation40]. Interestingly, the fluorescence in cells treated with CDK4-CDK6i was significantly lower than that observed in control cells (, S5A, S5B). A comparable low fluorescence signal was detected when lysosomal degradation was inhibited by treatment with CHQ or ammonium chloride (, S5B).
To further corroborate these findings, we evaluated the processing of CTSD (cathepsin D), one of the most abundant lysosomal proteases [Citation41]. Maturation of CTSD occurs by a series of proteolytic processing steps that occur in the lysosomes [Citation42]. A decrease of the mature form of CTSD and an accumulation of its intermediate form were observed in cells arrested in G1 compared to cycling cells (, S5C), demonstrating that processing and maturation of CTSD are compromised in G1.
Taken together, these results indicate that the degradative lysosomal function is impaired in cells blocked in the G1 phase of the cell cycle, likely explaining the massively dysregulated endolysosomal trafficking.
Maturation and integrity of the Salmonella-containing vacuole is impaired in G1-arrested cells
It is well established that SCV biogenesis and maturation involve sequential interactions with the endolysosomal pathway. For example, the early SCV membrane is enriched in early endosome membrane markers (e.g. EEA1), which are then replaced by late endosomal/lysosomal markers (e.g. LAMP1) [Citation2,Citation3]. As such, the dysregulation of endolysosomal trafficking observed in cells arrested in G1 prompted us to investigate the process of SCV maturation in these cells.
Microscopy analysis showed that the association of EEA1 with Salmonella was similar in cells blocked in G1 and cycling cells and, as expected, it decreased over time (). However, LAMP1 association to the bacteria was dramatically altered in cells arrested in G1. In cycling/control cells, LAMP1 association with Salmonella increased over time, as expected, and the formation of Salmonella-induced filaments was observed at 4 hpi (). Conversely, in cells blocked in G1 the association of LAMP1 with bacteria remained low at all times post-infection tested, despite the overall increased amount of LAMP1-positive vesicles ().
Figure 5. Cells arrested in the G1 phase show severely compromised maturation and integrity of the SCV. (A, B, E and G) Representative images of HeLa cells treated with DMSO (cycling) or CDK4-CDK6i (G1 arrest), infected with Salmonella, and labeled for EEA1 (A), LAMP1 (B), LGALS3 (E) or LC3B (G). Quantification of the percentage of bacteria colocalizing with the markers at the indicated times post-infection is shown. (C) Evaluation of pH changes of the environment encountered by Salmonella within HeLa cells treated with DMSO (cycling) or CDK4-CDK6i (G1 arrest) and infected with Salmonella. Measurement was performed by flow cytometry, based on reversible fluorescence quenching of FITC-labeled bacteria. Lower ΔAFU values indicate a more acidic environment. Data from cells treated with bafilomycin A1, an inhibitor of the V-type ATPase responsible for lysosomal acidification, are shown for comparison. (D) Representative images of HeLa cells treated with DMSO (cycling) or CDK4-CDK6i (G1 arrest) and stained for LGALS3. Quantification of the number of LGALS3 spots per cell is shown in the violin plot. Results are shown from 1,600 cells per condition and independent experiment (8,000 cells total); white circles show the medians, box limits indicate the 25th and 75th percentiles, whiskers extend 1.5 times the interquartile range from the 25th and 75th percentiles, polygons extend to extreme values. (F) Proportion of cytosolic Salmonella present in HeLa cells treated with DMSO (cycling) or CDK4-CDK6i (G1 arrest), collected at 4 hpi. Quantification was performed by the CHQ resistance assay. (H) Model representation of the effect of G1 host cell cycle arrest on Salmonella infection. Cycling cells (control, left panel): Upon invasion of epithelial cells, Salmonella is contained within the SCV. Early SCV biogenesis steps are mediated by SPI-1 T3SS effector proteins. Subsequently, the SCV undergoes an endosome-like maturation process (e.g. LAMP1 recruitment, acidification of the SCV), which is accompanied by a shutdown of the SPI-1 T3SS system and activation of the SPI-2 T3SS system, leading to Salmonella vacuolar replication. SPI-1 T3SS can induce early SCV damage, which can be repaired by the autophagy machinery. Alternatively, Salmonella escapes to the cytoplasm, where it can be targeted for degradation, or replicates within the host cytosol. G1-arrested cells (CDK4-CDK6i, right panel): Salmonella-infected cells show sustained secretion of SPI-1 T3SS, causing damage to the SCVs. Repair, maturation and integrity of the SCV are compromised, due to dysregulated endolysosomal trafficking and inhibited autophagy, with consequent Salmonella release into the host cell cytoplasm. SPI-2 T3SS activation and vacuolar replication are blocked. Infection was performed at MOI 25 (A, B, E, F, G) or MOI 250 (C). Scale bars: 25 µm. Results are shown as mean±s.e.m. of n = 12, (C), n = 10 (F), or n = 5 (A, B, D, E, G) biologically independent experiments; microscopy images are representative of n = 5 (A, B, D, E, G) biologically independent experiments; *P < 0.05, **P < 0.01 and ***P < 0.001 (statistical analysis is detailed in Table S1).
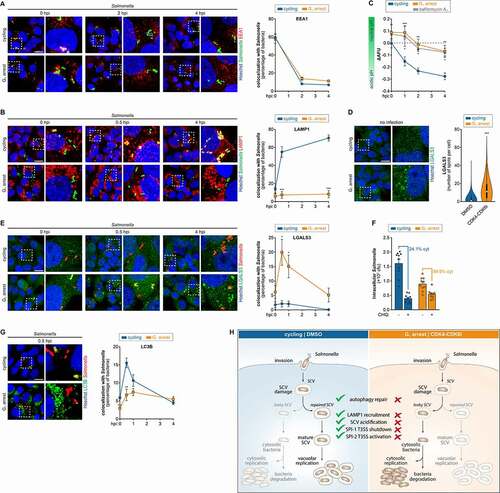
In addition to the dynamic recruitment of host factors to the SCV membrane, SCV maturation also entails the decrease of its luminal pH to approximately 5.0 [Citation43,Citation44]. Of relevance, this acidification is one of the physiological triggers that stimulate the expression and activate the SPI-2 T3SS [Citation28,Citation31,Citation45–48]. To assess pH changes of the host cell environment encountered by Salmonella during the initial hours of infection in cells arrested in G1 and cycling cells, we monitored the reversible fluorescence quenching of fluorescein isothiocyanate (FITC) labeled Salmonella, as previously described for Staphylococcus aureus [Citation49,Citation50]. Since FITC fluorescence is quenched at acidic pH, a higher change in fluorescence (ΔAFU, difference in arbitrary fluorescence units) is indicative of a less acidic environment. In cycling cells, the pH of the environment of Salmonella acidified with the progression of infection between invasion and 4 hpi (). However, in cells arrested in G1, the pH alterations were significantly less pronounced and similar to those observed in cells treated with bafilomycin A1, a V-type ATPase inhibitor that impairs endosomal acidification.
Taken together, these results indicate that, upon invasion of cells arrested in G1, Salmonella resides inside an SCV labeled with EEA1. However, recruitment of LAMP1 and acidification of the host cell microenvironment in which Salmonella is contained do not occur, indicating that SCV maturation is blocked and/or that SCV integrity is compromised.
To probe the instability of the SCV in cells blocked in G1, we evaluated the recruitment of LGALS3/galectin 3 protein to the vacuoles. LGALS3 is a member of the galectin carbohydrate-binding proteins [Citation51] that has been reported to be recruited to damaged endo-lysosomes [Citation52] and bacterial-induced ruptured vacuoles [Citation53–55]. When considering non-infected cells, a comparison of cycling cells and cells arrested in G1 revealed that the latter showed an increase in the number of LGALS3 puncta per cell (, S5D). In agreement, in the context of Salmonella infection a strong increase of Salmonella decorated with LGALS3 was observed in cells blocked in G1 compared to cycling cells (). Conversely, cells arrested in G2 or cycling cells synchronized in G2 or G1 showed similar LGALS3 staining to control cells (Fig. S5E, S5F). Of note, the increase of LGALS3 recruitment in cells arrested in G1 was not mediated by the SPI-1 effectors SopE and SptP, as shown upon infection with ΔsopE, ΔsptP and WT strains (Fig. S5G). Taken together, these data indicate an increase of damaged endolysosomal vesicles and ruptured SCVs in cells arrested in G1.
Given the impaired integrity of the SCV in G1-arrested cells, we reasoned that this could result in the escape of Salmonella to the cytosol. By applying the chloroquine resistance assay, which assesses the differential killing of vacuolar and cytosolic bacteria [Citation56], we quantified the proportion of cytosolic Salmonella in G1 and cycling cells. While in cycling cells, only 24.1% of the total Salmonella was present in the cytoplasm (not accessible to CHQ killing), the fraction of cytosolic bacteria was significantly higher in cells arrested in G1 (59.9%; ).
To evaluate the bacterial recognition by the autophagy pathway we have quantified the recruitment of LC3B to Salmonella. As previously described [Citation57,Citation58], there was an increase in the number of bacteria decorated with LC3B early after invasion in cycling cells, peaking at 0.5 hpi, which then declined (). Interestingly, LC3B recruitment to the bacteria was significantly reduced in G1-arrested cells at 0.5 hpi, although it was comparable at basal levels later during infection (4 hpi).
Overall, these results demonstrate that in cells blocked in the G1 phase of the cell cycle the maturation, integrity and repair of the SCV are severely compromised, resulting in the release/escape of the bacteria to the cytoplasm and thus explaining the inefficient vacuolar replication observed in these cells.
Discussion
Multiple bacterial pathogens modulate the cell cycle of host cells. However, for most pathogens, the exact outcome of this modulation to the infection process remains unclear, although arguably occurring for the pathogens benefit. Some studies suggest that the arrest or slowdown of the host cell cycle progression could constitute a bacterial strategy to perturb the integrity of the epithelial barrier and therefore favor pathogen access to the subepithelial layer. Other studies indicate that the cell cycle arrest/delay reduces the epithelial turnover and exfoliation, thus lengthening the timespan of the bacterial replicative reservoir [Citation13,Citation14,Citation59]. A less explored hypothesis is that the cell cycle modulation that occurs during bacterial infections is related to a differential permissivity of specific phase(s) of the host cell cycle to infection, due to intrinsic characteristics (e.g. activation/inactivation of specific pathways, presence/absence of key molecular factors).
Previously, we have shown that Salmonella replication at late stages post-infection is favored in cells arrested in G2/M and is strongly inhibited in cells blocked in G1 [Citation18]. In agreement with a preference for G2/M, it was shown that Salmonella preferentially invades mitotic cells due to an increase of cholesterol at the plasma membrane [Citation20]. Moreover, Salmonella uses at least two independent mechanisms to drive the host cell cycle to a phase that is permissive (G2/M) for bacterial replication [Citation18]. Specifically, this is accomplished by the downregulation of microRNAs and consequent target modulation to enforce the G1/S transition; the subsequent G2/M arrest is achieved through the secretion of the Salmonella effector protein SpvB. The convergence of these two mechanisms highlights the relevance for Salmonella infection of driving host cells to the G2/M cell cycle stage.
In this study, we addressed the reasons underlying the detrimental environment of cells blocked in the G1 phase to Salmonella replication during late stages of infection. We demonstrate that vacuolar replication is the critical stage of the Salmonella infection cycle that is inhibited in cells blocked in G1. Concurring, infection of the closely related pathogen Shigella flexneri, which replicates exclusively in the host cytosol, was not affected in G1-arrested cells. This is particularly interesting given that it has been demonstrated that Shigella, similarly to Salmonella, induces G2/M arrest of epithelial cells [Citation9]. For Shigella, the cell cycle arrest mechanism is dependent on the interaction of the bacterial effector protein IpaB with MAD2L2/mitotic arrest deficient 2 like 2, an inhibitor of the anaphase-promoting complex (APC). This disparity between Salmonella and Shigella likely indicates that for Shigella the arrest of the host cell cycle serves the broad function of interfering with epithelial cell turnover, whereas for Salmonella the arrest is, in addition, occurring in a cell stage that allows vacuolar replication, in detriment of a cell stage deleterious for this process. The preference or avoidance of a certain host cell cycle phase by pathogens has not been thoroughly addressed, although there are other instances of this phenotype. For example, G1 and G2/M phases are permissive to Legionella pneumophila replication, whereas the S phase is restrictive [Citation60,Citation61]. Additionally, the G2 phase was shown to be advantageous for Staphylococcus aureus intracellular replication in comparison to cells in G1 or asynchronous/cycling cells [Citation62].
Mechanistically, we show that cells arrested in the G1 phase present dysregulated endolysosomal trafficking, with a clear accumulation of vesicles positive for late endosomal and lysosomal markers, but in which the autophagic flux and degradative lysosomal function are strongly impaired. The interplay between the endolysosomal trafficking and cell cycle progression has not been extensively studied, despite reports of the requirement of lysosomes for cell cycle progression [Citation63]. Furthermore, in agreement with our results, it has recently been reported that treatment with CDK4-CDK6 inhibitors or CDK4 depletion, results in increased number of vesicles labeled with LysoTracker, LAMP1 and LC3B [Citation64], and impaired autophagic flux and lysosomal degradation leading to cancer cell senescence [Citation65]. Of note, we demonstrate that the alterations of endolysosomal trafficking and autophagy do not occur in synchronized cells progressing through the G1 phase. Moreover, cells arrested in G2 presented endolysosomal trafficking and autophagic flux similar to cycling cells. Overall, we show that the dysregulation of endolysosomal trafficking and autophagy pathway are phenotypes associated with G1 arrest, rather than linked to unspecific cell cycle arrest. This is relevant, since we aimed at determining why Salmonella induces cell cycle arrest in G2/M rather than in the G1 phase.
Given the dramatic dysregulation of the endolysosomal network observed in host cells blocked in G1, it was conceivable that the maturation/integrity of the SCV was compromised. This was indeed confirmed by the lack of recruitment of LAMP1 to the bacteria and the impaired acidification of the environment encountered by Salmonella. This hypothesis was further supported by the increase of the fraction of bacteria decorated with LGALS3, a marker for damaged endolysosomal vesicles and SCVs, and of cytosolic Salmonella, observed in cells arrested in G1. Overall, our results demonstrate that the integrity of the SCV is severely compromised in cells blocked in G1, therefore preventing the Salmonella vacuolar replication.
Bacterial vacuoles can be disrupted by the activity of T3SSs, including the SPI-1 T3SS that was shown to elicit SCV damage during the early stages of Salmonella infection [Citation58,Citation66–68]. The repair of this damage is promoted by the autophagy pathway, which is therefore essential to preserve SCV integrity and, ultimately, support SCV maturation [Citation57]. Interestingly, we observed a sustained expression of the SPI-1 T3SS effectors in cells blocked in G1. Our results support a model whereby the persistent SPI-1 T3SS expression is, at least in part, responsible for an increased SCV damage in cells in G1 (). Given the compromised autophagic flux in these cells, the autophagy proteins are sequestered and thus not available for repairing the SCV membrane. Indeed, we show that LC3B recruitment to Salmonella at early times post-infection was impaired in cells arrested in G1. Other aspects of the endolysosomal misregulation may also contribute to the compromised vacuole integrity/maturation. The lack of integrity of SCV precludes SCV maturation and consequently SPI-2 T3SS activation and vacuolar replication; rather, Salmonella is released to the cytosol. Although cells arrested in G1 exhibited compromised lysosomal degradative function, which could potentially constitute a favorable environment for Salmonella vacuolar replication, the deficient SCV maturation leads to a deleterious outcome for Salmonella infection.
In the cytosol, Salmonella can either be eliminated by autophagy [Citation58,Citation69] or proliferate at very high rates, a phenomenon known as hyper-replication. The cytosolic replication was shown to occur in epithelial cells in a small fraction of cells, both in vitro and in vivo [Citation4,Citation56]. In epithelial cells in culture, Salmonella cytosolic replication occurs earlier than vacuolar replication, starting at approx. 4 hpi and continuing until the death of host cells by pyroptosis at approx. 8–10 hpi [Citation4,Citation5,Citation56,Citation70]. We observed the occurrence of cytosolic replication in HCT-8 cells at 6 and 8 hpi, characterized by a high number of SPI-2 inactive bacteria per cell, which was exacerbated in cells arrested in G1. Cytosolic replication was not observed in HeLa-229 cells, which according to our unpublished observations are not permissive to cytosolic replication, contrary to HeLa-CCL2 [Citation56,Citation71–73]. Despite the relevance of the cytosolic replication for Salmonella dissemination [Citation4], our data support the hypothesis that vacuolar replication is the preferred Salmonella intracellular lifestyle [Citation1,Citation74]. Indeed, Salmonella employs multiple mechanisms to ensure that the arrest occurs in a cell cycle phase that supports vacuolar replication. This might also have implications for the intracellular lifestyle adopted by Salmonella (vacuolar vs. cytosolic replication) in distinct cell types (e.g. cycling vs. quiescent or senescent cells).
Similar to other bacterial pathogens, Salmonella prolongs the lifespan of its replicative niche (e.g. cells of the intestinal epithelial layer), both in vitro and in vivo [Citation17,Citation18]. The bacterial strategies that evolved to modulate the host cell cycle during infection appear to serve this goal. Our results contribute to explain the preference of Salmonella for an arrest in G2/M rather than in the G1 phase of the host cell cycle. Finally, our observations of a broad dysregulation of endolysosomal trafficking and autophagy in cells arrested in the G1 phase will be of general importance to the study of the role of the mammalian cell cycle in host-pathogen interactions, as well as in other biological contexts.
Materials and methods
Mammalian cell culture
Human epithelial HeLa-229 (ATCC, CCL-2.1) were cultured in DMEM GlutaMAX containing 1.0 g/l glucose (Gibco, 21,885), and human colon cancer HCT-8 (ATCC, CCL-244) were cultured in RPMI 1640 GlutaMAX (Gibco, 72,400). Cell lines were acquired from ATCC/LGC Standards and no further authentication was performed. Media were supplemented with 10% fetal bovine serum (Gibco, 10,270–106). Cells were maintained at 37°C in a 5% CO2 humidified atmosphere. All cell lines tested negative for mycoplasma contamination.
For cfu assays, RNA isolation, and confocal microscopy experiments, cells were seeded 48 h before infection in 24-well plates, at a density of 5.0 × 10⁴ for control, 6.5 × 10⁴ for CDK4-CDK6i or lovastatin (HeLa-229), or 6.5 × 10⁴ for control, 8.5 × 10⁴ for CDK4-CDK6i (HCT-8) cells per well; for western blot, cells were seeded 48 h before infection in 6-well plates, at a density of 1.8 × 10⁵ for control, 2.3 × 10⁵ for CDK4-CDK6i (HeLa-229), or 2.5 × 10⁵ for control, 3.0 × 10⁵ for CDK4-CDK6i (HCT-8) cells per well; for microscopy quantification, cells were seeded 48 h or 72 h before infection in 384-well plates at a density of 1.5 × 10³ for HeLa-229 or 1.4 × 10³ for HCT-8 cells per well, respectively.
For cell cycle arrest in the G1 phase, cells were treated with the CDK4/6 Inhibitor IV (CDK4-CDK6i, 10 µM or 20 µM for HeLa or HCT-8, respectively; Calbiochem/Sigma, 219492) or lovastatin (10 µM; Sigma, 1370600); for cell cycle arrest in the G2 phase, cells were treated with RO-3306 (4.5 µM; Sigma, SML0569). For non-infected samples, cells were treated with CDK4-CDK6i, lovastatin, or RO-3306 for 16 h, 20 h, or 9 h, respectively. For infection, cells were treated with CDK4-CDK6i, lovastatin, or RO-3306 for 16 h, 20 h, or 9 h prior to infection, respectively, as well as during infection (with 10 μg/ml gentamicin).
Cell synchronization was performed by double thymidine block as described previously [Citation18]. Cells were collected at 8 h and 12 h post release, for populations synchronized in G2 and G1 phase, respectively. Non-synchronized cells were used as control for each time point.
Bacterial strains
Salmonella enterica serovar Typhimurium strain SL1344 expressing GFP constitutively from a chromosomal locus [Citation75] and Shigella flexneri serotype 5 strain M90T expressing mCherry from a plasmid [Citation76] were used in this study. Salmonella strains with chromosomal epitope-tagged (3xFLAG) SopE, SteC, SptP, or PipB2 [Citation77] and Salmonella ΔsopE, ΔsptP mutant strains were kindly provided by J. Vogel (University of Würzburg, Germany). The Salmonella strain used to monitor SPI-2 activation was generated by co-transforming the WT strain with plasmid pYC104 [Citation77], which expresses GFP under the control of the SPI-2 T3SS gene ssaG promoter (kindly provided by J. Vogel, University of Würzburg, Germany) and pFPV-mCherry for constitutive expression of mCherry (Addgene plasmid 20956; gift from O. Steele-Mortimer). Salmonella and Shigella were grown aerobically in LB-Miller broth (NaCl 10 g/l, tryptone 10 g/l, yeast extract 5 g/l). When appropriate, the medium was supplemented with the following antibiotics: ampicillin 100 μg/ml, chloramphenicol 20 μg/ml, kanamycin 25 μg/ml.
For generating the growth curves, overnight bacterial cultures were diluted and adjusted to OD600 0.05 and grown in 100 μl LB or LB with CDK4-CDK6i (10 µM) for 7 h at 37°C in 96-well plates, under continuous orbital shaking. OD600 was measured using an EnSpire Multimode plate reader (Perkin Elmer), at 30 min intervals.
Bacterial infections
For Salmonella and Shigella infections, overnight cultures were diluted 1:100 in LB and grown at 37°C with shaking until OD600 2 (Salmonella) or OD600 0.4 (Shigella). Bacteria were then harvested by centrifugation for 2 min at 12,000 g and resuspended in complete medium. Cells were infected with the bacteria at the multiplicity of infection (MOI) indicated in the figure legend. After the addition of bacteria, cells were centrifuged at room temperature (RT) for 10 min at 250 g (Salmonella) or 15 min at 2,000 g (Shigella), and incubated at 37°C in a 5% CO2 humidified atmosphere for 20 min (Salmonella) or 15 min (Shigella). Extracellular bacteria were killed by replacing the medium with fresh medium containing 50 μg/ml gentamicin for 30 min (time point 0 hpi). The medium was then exchanged to medium containing 10 μg/ml gentamicin, until analysis.
To quantify bacterial invasion or intracellular replication by cfu assays, cells were washed three times with PBS (2.7 mM KCl, 1.8 mM KH2PO4, 137 mM NaCl, 10 mM Na2HPO4, pH 7.4) and lysed with PBS containing 0.1% Triton X-100 (Roth, 3051.4). Cell lysates were serially diluted in PBS and plated on LB agar plates supplemented with the respective selection antibiotics.
Chloroquine (CHQ) resistance assay was applied to quantify the fraction of cytosolic Salmonella in the total population, as previously described [Citation56]. Briefly, cells were infected in 24-well plates as described above. Before collection at 4 hpi, two wells were treated for 1 h with CHQ (400 µM; Sigma, C6628; to measure CHQ-resistant bacteria) and two wells were left untreated (to measure total bacteria). Collection and quantification of bacteria were performed as described above for the cfu assays. Percentage of cytosolic Salmonella was calculated as CHQ-resistant Salmonella/total bacteria × 100.
siRNA transfection
CDK4 (Sigma, SASI_Hs01_00122490) pre-designed siRNA and siGENOME Non-Targeting siRNA #5 (Dharmacon, Thermo Scientific, D-001210-05) were transfected into HeLa cells by a standard reverse transfection protocol at a final concentration of 50 nM, using the transfection reagent Lipofectamine RNAi-MAX (Invitrogen, 13778030), as previously described [Citation78]. For confocal microscopy and western blot experiments, cells were seeded in 24-well plates, at a density of 5.0 × 10⁴ cells per well. Sixty-eight hours after transfection, cells were processed for immunofluorescence or infected with Salmonella, as described above.
Galleria mellonella infection
Larvae of Galleria mellonella at the final instar larval stage were purchased from UK Waxworms and stored at 16°C. Only larvae with no visible signs of melanization were used in the experiments. Randomly assigned sets of the 15 larvae were placed in 10-cm Petri dishes and incubated at 37°C for 24 h before the start of the experiment. CDK4-CDK6i and matching volumes of DMSO were diluted in water and administered by an injection of 10 µl aliquots (containing 18 µg of CDK4-CDK6i) into the hemocoel through the last left proleg, using a Hamilton precision syringe with a 30-gauge 12-mm-long needle. The larvae were incubated at 37°C for 24 h and then infected with Salmonella. Salmonella inoculum was prepared as described above and diluted in PBS to obtain 1 × 10⁴ cfu in 10 µl. Bacterial suspensions were injected in the last right proleg. The number of dead larvae, i.e. that displayed melanization and no movement in response to touch, was scored daily. For all experiments, control groups of larvae that were inoculated with PBS or that did not receive the injection were used. In all experiments, a maximum of 1 dead larva was observed in these additional control groups; for simplicity, these were not included in the figure.
In vitro SPI-2 induction assay
To induce the expression of SPI-2 genes in vitro, Salmonella culture conditions based on low phosphate, low magnesium medium (LPM) adjusted to acidic pH were used, as previously described [Citation31]. Briefly, Salmonella was grown in LB overnight, diluted 1:100 in LB and grown to OD600 2, washed twice with PBS and once in LPM. Salmonella was then diluted 1:50 in LPM pH 7.0 or pH 5.8 (5 mM KCl, 7.5 mM [NH4]2SO4, 0.5 mM K2SO4, 38 mM glycerol [0.3% v:v], 0.1% casamino acids, 8 µM MgCl2, 337 µM KH2PO4, 1 µg/ml thiamine hydrochloride), and 100 mM Tris-HCl (for titration to pH 7.0) or 80 mM MES (for titration to pH 5.8). Salmonella in LPM pH 5.8 was treated with CDK4-CDK6i (10 µM) or vehicle (DMSO). Cultures were grown at 37°C with shaking until OD600 0.3. Bacteria were collected by centrifugation for 2 min at 2,000 g and lysed in TRIzol (Invitrogen, 15596026).
RNA isolation and quantitative real-time PCR
For RNA isolation, cells were lysed in TRIzol (Invitrogen, 15596026) and RNA was extracted by phenol-chloroform followed by isopropanol precipitation. For quantification of gene expression, total RNA was reverse transcribed using hexameric random primers and M-MLV reverse transcriptase (Invitrogen, 28025021), according to the manufacturer’s instructions. qRT-PCR was performed using SsoAdvanced Universal SYBR Green Supermix (BioRad, 172–5274) according to the manufacturer’s instructions. The following primer pairs were used: GFP, 5ʹ-ATGCTTTTCCCGTTATCCGG-3ʹ and 5ʹ-GCGTCTTGTAGTTCCCGTCATC-3ʹ; pipB2, 5ʹ-AATCTTAAAGGCGCTGTCCTT-3ʹ and 5ʹ-TACTGTCGCCTAGTGATGTTCC-3ʹ; sopD2, 5ʹ-CATGGATGTGAACGTGAAAATC-3ʹ and 5ʹ-AAGCGGTCTTGTTGAGATGG-3ʹ; steC, 5ʹ-GACGGATGCATCACAACCAG-3ʹ and 5ʹ-CATGTAACCGATAGACTGTCCCA-3ʹ; ssaG, 5ʹ-GCCAGGCCATTAATGACAAA-3ʹ and 5ʹ-TTTAGCAATGATTCCACTAAGCA-3ʹ; sseC, 5ʹ-GAGGTGCAAAATGCATTACGTA-3ʹ and 5ʹ-CTTTACGCGCTTTATCCTCCT-3ʹ; ssrB, 5ʹ-AATGCCTGTTGTGCATACGA-3ʹ and 5ʹ-TTAGCACCTGCGGCTAAAGT-3ʹ. Expression of the SPI-2 T3SS-related genes was normalized to GFP (constitutively expressed by Salmonella).
qRT-PCR was performed using a CFX96 Touch Real-Time PCR detection system (Bio-Rad). Relative gene expression was calculated using the 2−ΔΔCt method.
Fluorescence staining and microscopy
Cells seeded in glass coverslips in 24-well plates or black clear-bottom 384-well plates (Greiner, 781090) were fixed with 4% paraformaldehyde (PFA) for 15 min at RT, permeabilized with 0.5% Triton X-100 in PBS for 10 min, followed by blocking in 1% bovine serum albumin (BSA; Roth, 8076.3) in PBS for 30 min. Cells were then stained with the following primary antibodies diluted in blocking solution: EEA1 (1:200, overnight at 4°C; BD Biosciences, 610457, RRID:AB_397830), RAB7 (1:100, overnight at 4°C; Cell Signaling Technology, 9367S, RRID:AB_1904103), LAMP1 (1:100, overnight at 4°C; Santa Cruz Biotechnology, sc-20011, RRID:AB_626853), LC3B (1:100, overnight at 4°C; Sigma, L7543, RRID:AB_796155; or 1:1000, 2 h at RT; MBL, PM036, RRID:AB_2274121), TFEB (1:100, overnight at 4°C; Cell Signaling Technology, 4240, RRID:AB_11220225), LGALS3/galectin 3 (1:50 overnight at 4°C; Santa Cruz Biotechnology, sc-23938, RRID:AB_627658). Cells were washed with PBS and incubated with the corresponding secondary antibodies conjugated with Alexa Fluor 488 or 594 (1:250, 2 h at RT; ThermoFisher Scientific, A21201, A21202, A21441, A21442, or A21471).
Cells were stained with HCS CellMask Deep Red stain (1:15,000, 30 min at RT; ThermoFisher Scientific, H32721) and nuclei were counterstained with Hoechst 33342 (1:5,000, 15 min at RT; ThermoFisher Scientific, H3570).
For labeling of vesicles, cells were incubated prior to fixation with LysoTracker Red DND-9 (75 nM, 2 h at 37°C; ThermoFisher Scientific, L7528). For evaluation of the intracellular protease activity, cells were incubated for 5 h prior to fixation with DQ-Red BSA (5 µg/ml, ThermoFisher Scientific, D12051).
Confocal microscopy images, shown as maximum projected Z-stack images, were acquired with a Leica SP5 (Leica Microsystems) or Zeiss LSM 710 (Zeiss) laser scanning confocal microscopes. Alternatively, image acquisition was performed using an Operetta automated high-content screening fluorescence microscope (Perkin Elmer), at 20× magnification, with a total of 9 images acquired per well (corresponding to approximately 2,000–2,500 cells analyzed per experimental condition and independent experiment).
Image analysis of infection was performed using the Columbus image analysis software (Perkin Elmer), as described previously [Citation78,Citation79]. Briefly, bacteria were identified and cells were classified as positive or negative for Salmonella or Shigella depending on the quantification of the bacteria signal. Through the quantification of the intensity and area of the fluorescence signal corresponding to the bacteria at the level of single host cells, the bacterial intracellular load for the different time points was determined. An appropriate threshold was applied to define cells with a high intracellular bacterial load, indicative of high intracellular replication. Image analysis for the quantification of number of LGALS3 spots was performed using custom workflows implemented in the Columbus image analysis software. In brief, following nuclei and cytoplasm segmentation using Hoechst and CellMask stainings, respectively, LGALS3 spots were identified from the diffusely distributed fluorescence signal using the “Identify spots” building block and quantified. The number of spots per cell, from at least 1,600 cells per experimental condition and independent experiment, from 5 independent experiments, was used to generate the violin plots. The quantification of bacterial colocalization with endolysosomal markers based on confocal images was performed from at least 30–50 infected cells (corresponding to at least 100 bacteria) per condition and independent experiment, and counted manually. Analysis for the colocalization of Salmonella with LGALS3 and LC3B from images acquired using the Operetta microscope were performed using custom workflows implemented in the Columbus image analysis software. In brief, nuclei and cells were segmented based on Hoechst staining. The cells with nuclei presenting smaller area and higher Hoechst signal intensity and very high LGALS3 or LC3B signal intensity were excluded from the analysis (cells dividing or dying). The LGALS3 and LC3B spots were identified and selected from the background signal using the “identify spots” building block. Salmonella were also identified by using the “identify spots” building block. To identify the Salmonella colocalized with LGALS3 and LC3B, the GFP intensity was calculated in the previously identified spots of LGALS3 and LC3B. The fraction of colocalization of Salmonella with LGALS3-LC3B was calculated by dividing the number of colocalized spots by the number of total Salmonella spots.
Transmission electron microscopy
Sample preparation was performed by the Imaging Core Facility of the University of Würzburg. Briefly, cells were fixed with 2.5% glutaraldehyde in 0.05 M sodium cacodylate buffer for 15 min at RT followed by 105 min at 4°C. The monolayer was then rinsed with cacodylate buffer, post fixed with 2% osmium tetroxide for 1 h, and dehydrated through a graded ethanol series. Cells were subsequently embedded in Epon resin (EMbed 812; Electron Microscopy Sciences, EMS 14120) overnight, and then sectioned. Samples were analyzed with a JEOL JEM-2100 (JEOL GmbH) transmission electron microscope.
Protein extracts and western blot
For whole cell extracts, cells were washed with PBS and directly lysed in Laemmli’s sample buffer. Nuclear/cytoplasmic fractionation was performed as described previously [Citation80], with minor modifications. Briefly, cells were detached in PBS-EDTA (5 mM), washed with ice-cold PBS, resuspended in ice-cold hypotonic lysis buffer (HLB; 10 mM Tris, pH 7.5, 10 mM NaCl, 3 mM MgCl2, 0.3% [v:v] IGEPAL CA-630 [Sigma, I8896], 1 mM DTT, 1× protease cocktail inhibitor [Sigma-Aldrich, P8340]), followed by a 12-min incubation on ice. The lysate was then centrifuged at 800 g at 4°C for 5 min and the supernatant (cytoplasmic fraction) was collected. The nuclei pellet was washed three times with HLB, by pipetting up/down and centrifuged at 150 g at 4°C for 2 min, and finally resuspended in HLB. 5× Laemmli’s sample buffer was added to the cytoplasmic and nuclear fractions.
Samples were sonicated, separated in SDS-PAGE followed by western blot. The following antibodies were used: ACTB/β-actin (1:5,000; Sigma, A2228, RRID:AB_476697), TUBA4A/α-tubulin (1:3,000; Sigma, T6074, RRID:AB_477582), RAB7 (1:1,000; Cell Signaling Technology, 9367S, RRID:AB_1904103), LAMP1 (1:300; Santa Cruz Biotechnology, sc-20011, RRID:AB_626853), LC3B (1:1,000; Sigma, L7543, RRID:AB_796155), TFEB (1:1,000; Cell Signaling Technology, 4240, RRID:AB_11220225), CTSD/cathepsin D (1:300; Sigma, SAB4200767, RRID:AB_2888690), LMNB1/lamin B1 (1:300; Santa Cruz Biotechnology, sc-374015, RRID:AB_10947408), FLAG (1:1,000; Sigma, F1804, RRID:AB_262044), GroEL (1:10,000; Sigma, G6532, RRID:AB_259939) and anti-mouse and anti-rabbit secondary antibodies coupled to horseradish peroxidase (1:10,000; GE Healthcare, NA931 and NA934, respectively). Signals were detected using SuperSignal West Dura Extended Duration Substrate (Pierce, 34,075) using an ImageQuant LAS 4000 CCD camera (GE Healthcare) or an Imager Chemi 5QE CCD camera (VWR).
Quantification of western blots was performed with ImageJ. Uncropped images of immunoblots are shown in Data S1.
Flow cytometry
For cell cycle analysis, collection of cells and sample preparation was performed as described previously [Citation18].
For quantification of intracellular protease activity, cells were incubated for 5 h prior to fixation with DQ-Red BSA (5 µg/ml; ThermoFisher Scientific, D12051). Cells were then washed twice with PBS, detached using PBS-EDTA 5 mM, and fixed with 4% PFA.
For quantification of SPI-2 T3SS activation, cells were infected with Salmonella harboring the SPI-2 reporter (MOI 25) as described above and collected at the indicated times post-infection in PBS-EDTA 5 mM, and fixed in 4% PFA.
Analysis of cell viability was performed using 7-amino-actinomycin D (7-AAD; BD Biosciences, 51–68981E), a viability dye excluded from cells with intact membranes (viable cells), as described previously [Citation18].
pH changes in the host cell environment of Salmonella were measured by the reversible fluorescence quenching of FITC-labeled Salmonella, as previously described for Staphylococcus aureus [Citation49,Citation50]. Briefly, Salmonella was grown as described above to OD600 1.9, labeled with fluorescein 5(6)-isothiocyanate (FITC, 0.1 mg/ml in PBS; Sigma, F3651) at 37°C for 1 h. Following 3 washes with PBS, FITC-labeled Salmonella was resuspended in cell culture medium and used for infection as described above (MOI 250). CDK4-CDK6i treatment was performed as described above. Bafilomycin A1 treatment (100 nM; InvivoGen, tlrl-baf1) was performed for 1 h before collection. At the indicated times post-infection, cells were detached in PBS-EDTA 5 mM, washed and resuspended in PBS. Each sample was aliquoted, with one aliquot being treated with the neutralizing ionophore monensin (50 µM; Sigma, M5273) for 15 min at 37°C, to determine the maximum fluorescence. The other aliquot was left untreated. The number of internalized bacteria, expressed as arbitrary fluorescence units (AFU), was calculated according to the following formula: AFU = MFI infected cells × % infected cells. The difference in AFU (ΔAFU) in the absence or presence of the ionophore monensin, normalized to the invasion rate, was used as a readout for pH changes in the environment encountered by the bacteria, as follows: ΔAFU = (AFU−monensin – AFU+monensin)/AFU+monensin. Given that FITC fluorescence quenching is dependent on pH, higher ΔAFU values are indicative of a less acidic environment.
For all experiments, cells were analyzed on a BD Accuri C6 or FACSAria III flow cytometer (BD Biosciences). Data analysis was performed using the FlowJo software (BD Biosciences). The Dean-Jett-Fox model was applied for the analysis of the cell cycle.
Statistical analysis
Unless otherwise indicated, data are presented as mean ± standard error of the mean (s.e.m.), with the exact number of experiments performed indicated in the figure legends. Statistical analysis was performed using Prism Software (GraphPad). Normal distribution of the data was assessed by the Shapiro-Wilk test. For statistical comparison of datasets, the following tests were used: for two conditions, two-tailed Student’s t-test or multiple t-test corrected for multiple comparison using the Holm-Sidak method; for three or more conditions/groups, one-way ANOVA with Tukey’s or Dunnett’s post-hoc test or two-way ANOVA with Tukey’s or Dunnett’s multiple comparison test; for non-parametric data Wilcoxon Signed Rank or Kruskal-Wallis with Dunn’s multiple comparison tests; for the survival curves, log-rank (Mantel-Cox) test; for the medians from two groups, Mann-Whitney U-test. Statistical analysis is detailed in Table S1. Values of P < 0.05 were considered significant. Violin plots were generated using BoxPlotR web tool.
Supplemental Material
Download Zip (13.4 MB)Acknowledgments
JD and SC are recipients of PhD scholarships from the Portuguese Foundation for Science and Technology (SFRH/BD/144443/2019 and 2020.06572.BD, respectively); RS is a recipient of a PhD scholarship from the Doctoral Programme in Experimental Biology and Biomedicine of the Center for Neuroscience and Cell Biology, University of Coimbra (PD/BD/129294/2017)
Disclosure statement
The authors declare no competing interests.
Supplementary material
Supplemental data for this article can be accessed here
Additional information
Funding
Related Research Data
References
- Castanheira S, Garcia-Del Portillo F. Salmonella populations inside host cells. Front Cell Infect Microbiol. 2017;7:432.
- Steele-Mortimer O. The Salmonella-containing vacuole: moving with the times. Curr Opin Microbiol. 2008 Feb;11(1):38–45.
- Tuli A, Sharma M. How to do business with lysosomes: Salmonella leads the way. Curr Opin Microbiol. 2019 Feb;47:1–7.
- Knodler LA, Vallance BA, Celli J, et al. Dissemination of invasive Salmonella via bacterial-induced extrusion of mucosal epithelia. Proc Natl Acad Sci U S A. 2010 Oct 12;107(41):17733–17738.
- Malik-Kale P, Winfree S, Steele-Mortimer O, et al. The bimodal lifestyle of intracellular Salmonella in epithelial cells: replication in the cytosol obscures defects in vacuolar replication. PLoS One. 2012;7(6):e38732.
- LaRock DL, Chaudhary A, Miller SI. Salmonellae interactions with host processes. Nat Rev Microbiol. 2015 Apr;13(4):191–205.
- Moest TP, Meresse S. Salmonella T3SSs: successful mission of the secret(ion) agents. Curr Opin Microbiol. 2013 Feb;16(1):38–44.
- Jennings E, Thurston TLM, Holden DW, et al. Salmonella SPI-2 type III secretion system effectors: molecular mechanisms and physiological consequences. Cell Host Microbe. 2017 Aug 9;22(2):217–231.
- Iwai H, Kim M, Yoshikawa Y, et al. A bacterial effector targets Mad2L2, an APC inhibitor, to modulate host cell cycling. Cell. 2007 Aug 24;130(4):611–623.
- Taieb F, Nougayrede JP, Watrin C, et al. Escherichia coli cyclomodulin Cif induces G2 arrest of the host cell cycle without activation of the DNA-damage checkpoint-signalling pathway. Cell Microbiol. 2006 Dec;8(12):1910–1921.
- Jones A, Jonsson AB, Aro H, et al. Neisseria gonorrhoeae infection causes a G1 arrest in human epithelial cells. FASEB J. 2007 Feb;21(2):345–355.
- Leitao E, Costa AC, Brito C, et al. Listeria monocytogenes induces host DNA damage and delays the host cell cycle to promote infection. Cell Cycle. 2014;13(6):928–940.
- El-Aouar Filho RA, Nicolas A, De Paula Castro TL, et al. Heterogeneous family of cyclomodulins: smart weapons that allow bacteria to hijack the eukaryotic cell cycle and promote infections. Front Cell Infect Microbiol. 2017;7:208.
- Nougayrede JP, Taieb F, De Rycke J, et al. Cyclomodulins: bacterial effectors that modulate the eukaryotic cell cycle. Trends Microbiol. 2005 Mar;13(3):103–110.
- Aguilar C, Mano M, Eulalio A, et al. MicroRNAs at the host-bacteria interface: host defense or bacterial offense. Trends Microbiol. 2019 Mar;27(3):206–218.
- Mambu J, Barilleau E, Fragnet-Trapp L, et al. Rck of Salmonella typhimurium delays the host cell cycle to facilitate bacterial invasion. Front Cell Infect Microbiol. 2020;10:586934.
- Santos AJM, Durkin CH, Helaine S, et al. Clustered intracellular Salmonella enterica serovar typhimurium blocks host cell cytokinesis. Infect Immun. 2016 Jul;84(7):2149–2158.
- Maudet C, Mano M, Sunkavalli U, et al. Functional high-throughput screening identifies the miR-15 microRNA family as cellular restriction factors for Salmonella infection. Nat Commun. 2014 Aug 22;5:4718.
- Mesa-Pereira B, Medina C, Camacho EM, et al. Novel tools to analyze the function of Salmonella effectors show that SvpB ectopic expression induces cell cycle arrest in tumor cells. PLoS One. 2013;8(10):e78458.
- Santos AJ, Meinecke M, Fessler MB, et al. Preferential invasion of mitotic cells by Salmonella reveals that cell surface cholesterol is maximal during metaphase. J Cell Sci. 2013 Jul 15;126(Pt 14):2990–2996.
- Soni R, O’Reilly T, Furet P, et al. Selective in vivo and in vitro effects of a small molecule inhibitor of cyclin-dependent kinase 4. J Natl Cancer Inst. 2001 Mar 21;93(6):436–446.
- Javanmoghadam-Kamrani S, Keyomarsi K. Synchronization of the cell cycle using lovastatin. Cell Cycle. 2008 Aug;7(15):2434–2440.
- Keyomarsi K, Sandoval L, Band V, et al. Synchronization of tumor and normal cells from G1 to multiple cell cycles by lovastatin. Cancer Res. 1991 Jul 1;51(13):3602–3609.
- Cutuli MA, Petronio Petronio G, Vergalito F, et al. Galleria mellonella as a consolidated in vivo model hosts: new developments in antibacterial strategies and novel drug testing. Virulence. 2019 Dec;10(1):527–541.
- Mellouk N, Enninga J. Cytosolic access of intracellular bacterial pathogens: the shigella paradigm. Front Cell Infect Microbiol. 2016;6:35.
- Lober S, Jackel D, Kaiser N, et al. Regulation of Salmonella pathogenicity island 2 genes by independent environmental signals. Int J Med Microbiol. 2006 Nov;296(7):435–447.
- Schlumberger MC, Kappeli R, Wetter M, et al. Two newly identified SipA domains (F1, F2) steer effector protein localization and contribute to Salmonella host cell manipulation. Mol Microbiol. 2007 Aug;65(3):741–760.
- Chakravortty D, Rohde M, Jager L, et al. Formation of a novel surface structure encoded by Salmonella Pathogenicity Island 2. EMBO J. 2005 Jun 1;24(11):2043–2052.
- Nikolaus T, Deiwick J, Rappl C, et al. SseBCD proteins are secreted by the type III secretion system of Salmonella pathogenicity island 2 and function as a translocon. J Bacteriol. 2001 Oct;183(20):6036–6045.
- Walthers D, Carroll RK, Navarre WW, et al. The response regulator SsrB activates expression of diverse Salmonella pathogenicity island 2 promoters and counters silencing by the nucleoid-associated protein H-NS. Mol Microbiol. 2007 Jul;65(2):477–493.
- Coombes BK, Brown NF, Valdez Y, et al. Expression and secretion of Salmonella pathogenicity island-2 virulence genes in response to acidification exhibit differential requirements of a functional type III secretion apparatus and SsaL. J Biol Chem. 2004 Nov 26;279(48):49804–49815.
- Perez-Morales D, Banda MM, Chau NYE, et al. The transcriptional regulator SsrB is involved in a molecular switch controlling virulence lifestyles of Salmonella. PLoS Pathog. 2017 Jul;13(7):e1006497.
- Chen H, Xu X, Wang G, et al. CDK4 protein is degraded by anaphase-promoting complex/cyclosome in mitosis and reaccumulates in early G1 phase to initiate a new cell cycle in HeLa cells. J Biol Chem. 2017 Jun 16;292(24):10131–10141.
- Zhu X, Ma SP, Yang D, et al. miR-142-3p suppresses cell growth by targeting CDK4 in colorectal cancer. Cell Physiol Biochem. 2018;51(4):1969–1981.
- Gogolin S, Ehemann V, Becker G, et al. CDK4 inhibition restores G(1)-S arrest in MYCN-amplified neuroblastoma cells in the context of doxorubicin-induced DNA damage. Cell Cycle. 2013 Apr 1;12(7):1091–1104.
- Vassilev LT, Tovar C, Chen S, et al. Selective small-molecule inhibitor reveals critical mitotic functions of human CDK1. Proc Natl Acad Sci U S A. 2006 Jul 11;103(28):10660–10665.
- Napolitano G, Ballabio A. TFEB at a glance. J Cell Sci. 2016 Jul 1;129(13):2475–2481.
- Sardiello M, Palmieri M, di Ronza A, et al. A gene network regulating lysosomal biogenesis and function. Science. 2009 Jul 24;325(5939):473–477.
- Marwaha R, Sharma M. DQ-red BSA trafficking assay in cultured cells to assess cargo delivery to lysosomes. Biol Protoc. 2017 Oct 5;7(19).
- Reis RC, Sorgine MH, Coelho-Sampaio T, et al. A novel methodology for the investigation of intracellular proteolytic processing in intact cells. Eur J Cell Biol. 1998 Feb;75(2):192–197.
- Yadati T, Houben T, Bitorina A, et al. The Ins and outs of cathepsins: physiological function and role in disease management. Cells. 2020 Jul 13;9(7).
- Zaidi N, Maurer A, Nieke S, et al. Cathepsin D: a cellular roadmap. Biochem Biophys Res Commun. 2008 Nov 7;376(1):5–9.
- Drecktrah D, Knodler LA, Howe D, et al. Salmonella trafficking is defined by continuous dynamic interactions with the endolysosomal system. Traffic. 2007 Mar;8(3):212–225.
- Rathman M, Sjaastad MD, Falkow S, et al. Acidification of phagosomes containing Salmonella typhimurium in murine macrophages. Infect Immun. 1996 Jul;64(7):2765–2773.
- Liew ATF, Foo YH, Gao Y, et al. Single cell, super-resolution imaging reveals an acid pH-dependent conformational switch in SsrB regulates SPI-2. Elife. 2019;29:8.
- Alpuche Aranda CM, Swanson JA, Loomis WP, et al. Salmonella typhimurium activates virulence gene transcription within acidified macrophage phagosomes. Proc Natl Acad Sci U S A. 1992 Nov 1;89(21):10079–10083.
- Yu XJ, McGourty K, Liu M, et al. pH sensing by intracellular Salmonella induces effector translocation. Science. 2010 May 21;328(5981):1040–1043.
- Choi J, Groisman EA. Acidic pH sensing in the bacterial cytoplasm is required for Salmonella virulence. Mol Microbiol. 2016 Sep;101(6):1024–1038.
- Lam TT, Giese B, Chikkaballi D, et al. Phagolysosomal integrity is generally maintained after staphylococcus aureus invasion of nonprofessional phagocytes but is modulated by strain 6850. Infect Immun. 2010 Aug;78(8):3392–3403.
- Grosz M, Kolter J, Paprotka K, et al. Cytoplasmic replication of staphylococcus aureus upon phagosomal escape triggered by phenol-soluble modulin alpha. Cell Microbiol. 2014 Apr;16(4):451–465.
- Johannes L, Jacob R, Leffler H, et al. Galectins at a glance. J Cell Sci. 2018 May 1;131(9).
- Aits S, Kricker J, Liu B, et al. Sensitive detection of lysosomal membrane permeabilization by lysosomal galectin puncta assay. Autophagy. 2015;11(8):1408–1424.
- Feeley EM, Pilla-Moffett DM, Zwack EE, et al. Galectin-3 directs antimicrobial guanylate binding proteins to vacuoles furnished with bacterial secretion systems. Proc Natl Acad Sci U S A. 2017 Feb 28;114(9):E1698–E1706.
- Paz I, Sachse M, Dupont N, et al. Galectin-3, a marker for vacuole lysis by invasive pathogens. Cell Microbiol. 2010 Apr 1;12(4):530–544.
- Fredlund J, Santos JC, Stevenin V, et al. The entry of Salmonella in a distinct tight compartment revealed at high temporal and ultrastructural resolution. Cell Microbiol. 2018 Apr;20: 4.
- Knodler LA, Nair V, Steele-Mortimer O, et al. Quantitative assessment of cytosolic Salmonella in epithelial cells. PLoS One. 2014;9(1):e84681.
- Kreibich S, Emmenlauer M, Fredlund J, et al. Autophagy proteins promote repair of endosomal membranes damaged by the Salmonella type three secretion system 1. Cell Host Microbe. 2015 Nov 11;18(5):527–537.
- Birmingham CL, Smith AC, Bakowski MA, et al. Autophagy controls Salmonella infection in response to damage to the Salmonella-containing vacuole. J Biol Chem. 2006 Apr 21;281(16):11374–11383.
- Kim M, Ashida H, Ogawa M, et al. Bacterial interactions with the host epithelium. Cell Host Microbe. 2010 Jul 22;8(1):20–35.
- de Jesus-Diaz DA, Murphy C, Sol A, et al. Host cell S phase restricts legionella pneumophila intracellular replication by destabilizing the membrane-bound replication compartment. mBio. 2017 Aug 22;8(4).
- Sol A, Lipo E, de Jesus-Diaz DA, et al. Legionella pneumophila translocated translation inhibitors are required for bacterial-induced host cell cycle arrest. Proc Natl Acad Sci U S A. 2019 Feb 19;116(8):3221–3228.
- Alekseeva L, Rault L, Almeida S, et al. Staphylococcus aureus-induced G2/M phase transition delay in host epithelial cells increases bacterial infective efficiency. Plos One. 2013;8(5):e63279.
- Jin Y, Weisman LS. The vacuole/lysosome is required for cell-cycle progression. Elife. 2015 Aug;31:4.
- Yin Q, Jian Y, Xu M, et al. CDK4/6 regulate lysosome biogenesis through TFEB/TFE3. J Cell Biol. 2020 Aug 3;219:8.
- Martinez-Carreres L, Puyal J, Leal-Esteban LC, et al. CDK4 regulates lysosomal function and mTORC1 activation to promote cancer cell survival. Cancer Res. 2019 Oct 15;79(20):5245–5259.
- Thurston TL, Wandel MP, von Muhlinen N, et al. Galectin 8 targets damaged vesicles for autophagy to defend cells against bacterial invasion. Nature. 2012 Jan 15;482(7385):414–418.
- Tattoli I, Sorbara MT, Vuckovic D, et al. Amino acid starvation induced by invasive bacterial pathogens triggers an innate host defense program. Cell Host Microbe. 2012 Jun 14;11(6):563–575.
- Klein JA, Grenz JR, Slauch JM, et al. Controlled activity of the Salmonella invasion-associated injectisome reveals its intracellular role in the cytosolic population. mBio. 2017 Dec 5;8(6).
- Gomes LC, Dikic I. Autophagy in antimicrobial immunity. Mol Cell. 2014 Apr 24;54(2):224–233.
- Knodler LA, Crowley SM, Sham HP, et al. Noncanonical inflammasome activation of caspase-4/caspase-11 mediates epithelial defenses against enteric bacterial pathogens. Cell Host Microbe. 2014 Aug 13;16(2):249–256.
- Chong A, Starr T, Finn CE, et al. A role for the Salmonella type III secretion system 1 in bacterial adaptation to the cytosol of epithelial cells. Mol Microbiol. 2019 Oct;112(4):1270–1283.
- Finn CE, Chong A, Cooper KG, et al. A second wave of Salmonella T3SS1 activity prolongs the lifespan of infected epithelial cells. PLoS Pathog. 2017 Apr;13(4):e1006354.
- Wrande M, Andrews-Polymenis H, Twedt DJ, et al. Genetic determinants of Salmonella enterica serovar typhimurium proliferation in the cytosol of epithelial cells. Infect Immun. 2016 Dec;84(12):3517–3526.
- Anand I, Choi W, Isberg RR, et al. The vacuole guard hypothesis: how intravacuolar pathogens fight to maintain the integrity of their beloved home. Curr Opin Microbiol. 2020 Apr;54:51–58.
- Papenfort K, Said N, Welsink T, et al. Specific and pleiotropic patterns of mRNA regulation by ArcZ, a conserved, Hfq-dependent small RNA. Mol Microbiol. 2009 Oct;74(1):139–158.
- Tawk C, Nigro G, Rodrigues Lopes I, et al. Stress-induced host membrane remodeling protects from infection by non-motile bacterial pathogens. EMBO J. 2018 Dec 3;37:23.
- Westermann AJ, Forstner KU, Amman F, et al. Dual RNA-seq unveils noncoding RNA functions in host-pathogen interactions. Nature. 2016 Jan 28;529(7587):496–501.
- Aguilar C, Cruz AR, Rodrigues Lopes I, et al. Functional screenings reveal different requirements for host microRNAs in Salmonella and Shigella infection. Nat Microbiol. 2020 Jan;5(1):192–205.
- Rodrigues Lopes I, Silva RJ, Caramelo I, et al. Shedding light on microRNA function via microscopy-based screening. Methods. 2019 Jan 1;152:55–64.
- Gagnon KT, Li L, Janowski BA, et al. Analysis of nuclear RNA interference in human cells by subcellular fractionation and argonaute loading. Nat Protoc. 2014 9;Sep(9):2045–2060.