
ABSTRACT
Acquired chemotherapy resistance is one of the main culprits in the relapse of breast cancer. But the underlying mechanism of chemotherapy resistance remains elusive. Here, we demonstrate that a small adaptor protein, SH3BGRL, is not only elevated in the majority of breast cancer patients but also has relevance with the relapse and poor prognosis of breast cancer patients. Functionally, SH3BGRL upregulation enhances the chemoresistance of breast cancer cells to the first-line doxorubicin treatment through macroautophagic/autophagic protection. Mechanistically, SH3BGRL can unexpectedly bind to ribosomal subunits to enhance PIK3C3 translation efficiency and sustain ATG12 stability. Therefore, inhibition of autophagy or silence of PIK3C3 or ATG12 can effectively block the driving effect of SH3BGRL on doxorubicin resistance of breast cancer cells in vitro and in vivo. We also validate that SH3BGRL expression is positively correlated with that of PIK3C3 or ATG12, as well as the constitutive occurrence of autophagy in clinical breast cancer tissues. Taken together, our data reveal that SH3BGRL upregulation would be a key driver to the acquired chemotherapy resistance through autophagy enhancement in breast cancer while targeting SH3BGRL could be a potential therapeutic strategy against breast cancer.
Abbreviations: ABCs: ATP-binding cassette transporters; Act D: actinomycin D; ACTB/β-actin: actin beta; ATG: autophagy-related; Baf A1: bafilomycin A1; CASP3: caspase 3; CHX: cycloheximide; CQ: chloroquine; Dox: doxorubicin; FBS: fetal bovine serum; GAPDH: glyceraldehyde-3-phosphate dehydrogenase; GEO: gene expression omnibus; GFP: green fluorescent protein; G6PD: glucose-6-phosphate dehydrogenase; GSEA: gene set enrichment analysis; IHC: immunochemistry; KEGG: Kyoto Encyclopedia of Genes and Genomes; MAP1LC3B/LC3B: microtubule-associated protein 1 light chain 3 beta; 3-MA: 3-methyladenine; mRNA: messenger RNA; PIK3C3: phosphatidylinositol 3-kinase catalytic subunit type 3; SH3BGRL: SH3 domain binding glutamate-rich protein-like; SQSTM1/p62: sequestosome 1; ULK1: unc-51 like autophagy activating kinase 1
Introduction
Breast cancer is the most prevalent malignancy and a leading cause of cancer-associated death in women, which is mainly accounted for metastasis and relapse [Citation1]. The emergence of resistance to chemotherapy is one of the major reasons for this late metastasis or relapse of breast cancer patients [Citation2,Citation3]. Doxorubicin (Dox), an anthracycline used as a DNA topoisomerase II inhibitor, is recognized as the effective and first-line adjuvant chemotherapy for breast cancer patients [Citation4]. Mechanistically, Dox induces cell death or cell growth arrest through inhibition of topoisomerase II to impair DNA replication and transcription [Citation5,Citation6], intercalation with DNA to cause DNA damage, and production of free radicals to result in increasing mitochondrial membrane permeability, which all lead to cancer cell apoptosis [Citation7]. However, resistance to Dox often emerges in malignant breast tumors, resulting in patients’ relapse, metastasis and poor prognosis [Citation8–11]. The current view on the cause of Dox resistance mainly includes the upregulation of ATP-binding cassette transporters (ABCs) of ABC family members [Citation11–14], mutation or depletion of topoisomerase II [Citation15,Citation16], enhanced capability for DNA damage repair [Citation17–19], increased detoxification by overexpression of glutathione S-transferases [Citation20,Citation21] or the dysfunction of cell death program, including apoptosis (type I programmed cell death) [Citation22,Citation23] and autophagic cell death (type II programmed cell death) [Citation24–26].
Recently, the role of autophagy in Dox resistance in breast cancer has been extensively investigated. Inhibition of autophagy can overcome or reverse Dox resistance at least partly in a variety of cancer types, including breast cancer [Citation27–35], revealing that combination with chemotherapy and autophagy inhibition would be a promising therapeutic strategy. However, the exact relevance of autophagy and Dox resistance is unclear.
Autophagy, also known as macroautophagy, is a lysosomal degradation process that recycles unwanted or damaged cellular organelles and proteins to regenerate various precursors to maintain cellular biosynthesis and viability upon stresses, including nutrient deprivation, hypoxia, chemotherapeutic toxicity [Citation36–38]. The classical autophagy process comprises five steps: initiation, nucleation (formation of phagophore), elongation and closure (formation of autophagosome), fusion (formation of autolysosome), and degradation and recycling [Citation39–41]. Autophagy initiation and phagophore formation require two protein complexes, the Atg1/ULK1 and the Vps34/PIK3C3 complexes. Likely, autophagosome formation includes two trimeric ATG16L1 complexes ATG12–ATG5-ATG16L1 and ATG16L1-SQSTM1-LC3-II [Citation42,Citation43], indicating the importance of the regulation of autophagy-related proteins for cell homeostasis.
Autophagy is also known to play paradoxical roles in cancer as either a tumor suppression in the early stage of tumorigenesis or a tumor promoter in cancer cell survival amid metabolic stresses and anticancer cytotoxicity [Citation44–48]. So far, many anticancer agents, including both chemotherapy and targeted agents can activate autophagy and confer resistance to cytotoxic chemotherapy [Citation24,Citation49–51]. For instance, combination with autophagy inhibition could sensitize cancer cells to the same chemotherapy regime along with elevated tumor regression and prolonged mice survival period in response to alkylating agents [Citation52–55]. However, the intriguing mechanism on how autophagy is activated upon chemotherapeutic agents, including doxorubicin is still elusive. Therefore, dissecting the underlying mechanism of this therapy-resistant autophagy is necessary.
SH3BGRL (SH3 domain binding glutamate-rich protein-like) encodes a protein of 114 amino acids with the Homer SH3-binding and EVH1-binding motifs [Citation56]. As a scaffold protein, SH3BGRL would play varied roles in cellular events by protein-protein interaction [Citation57]. For instance, SH3BGRL is involved in formations of the central nervous system and intestine of zebrafish and the progression of Parkinson disease [Citation58,Citation59]. But the function of SH3BGRL in human cancer remains largely unknown. Clinically, SH3BGRL is shown to be overexpressed in various types of breast cancers, including BRCA1 mutant, ESR/ER-positive, triple-negative and lymphocytic infiltration-positive breast tumors by proteomics analysis [Citation60–62], suggesting its possible tumor-promoting role. Recently, we found that SH3BGRL renders innate ERBB2/HER2-targeting drug resistance in breast cancer [Citation63]. In contrast to this oncogenic character, SH3BGRL is shown as an inhibitor of REL/v-Rel-induced transformation in chicken cells [Citation64] and a suppressor in leukemogenesis [Citation65] and triple-negative breast cancer cells [Citation66]. However, the exact biological role of SH3BGRL in breast cancer remains largely unknown.
Here, we uncover that SH3BGRL can enhance autophagy occurrence to lead doxorubicin resistance in breast cancer cells through enhancing PIK3C3 translation and ATG12 protein stability, suggesting SH3BGRL as a novel possible target for doxorubicin-resistant breast cancer.
Results
SH3BGRL upregulation is associated with a poor prognosis of breast cancer
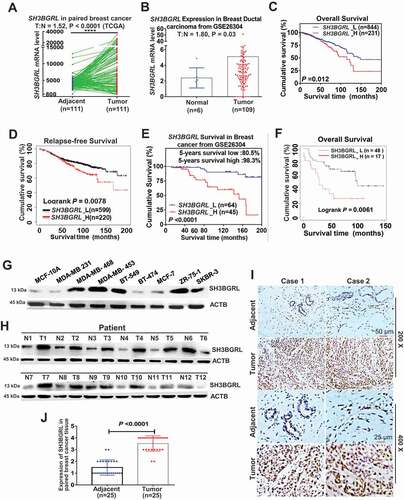
To evaluate the biological role of SH3BGRL in the progression of breast cancer, we first analyzed public breast cancer datasets and found that SH3BGRL mRNA is upregulated in the majority of breast cancers, compared to their adjacent normal ones (; ). We also investigated the clinical relevance of SH3BGRL upregulation in breast cancer progression and noted that patients with elevated SH3BGRL mRNA levels had worse overall survival and relapse-free survival by analyses of GSE26304 and TCGA datasets (). In addition, Kaplan–Meier Plotter analysis showed that breast cancer patients with high SH3BGRL protein had poorer overall survival based on analysis of 65 cases of breast cancers (). To verify SH3BGRL overexpression in breast cancer patients, we performed immunoblots and showed that SH3BGRL protein expression was markedly upregulated in most of the breast cancer cell lines () as well as in 12 breast cancer tissues (), compared with that in the immortalized normal breast cell MCF-10A or the paired adjacent noncancerous tissues, respectively. We further examined 25 pairs of paraffin-embedded breast cancer tissues by immunohistochemistry (IHC) and observed that SH3BGRL protein was highly expressed in breast cancer tissues compared to the adjacent counterparts (), verifying the SH3BGRL upregulation in breast cancers. Taken together, these results indicated that SH3BGRL upregulation might contribute to the poor outcome of breast cancer patients.
Figure 1. SH3BGRL upregulation is associated with the poor prognosis of breast cancer. (A,B) SH3BGRL upregulation in breast cancer tissues, compared with the paired normal tissues based on TCGA dataset. Tumor (T) = 111, Normal (N) = 111; Ratio of SH3BGRL in tumor to normal (T:N) is 1.52; P < 0.0001 (A) and GSE26304 dataset (T = 109, N = 6; T:N = 1.8; P = 0.03) (B) analyses. (C,D) Kaplan–Meier analysis of overall survival (C, n = 1075; P = 0.003) or relapse-free survival (D, n = 1119; P = 0.0078) of breast cancer patients with low versus high SH3BGRL expression from two TCGA datasets. (E,F) Kaplan–Meier analysis of overall survival of cases from GSE26304 dataset (n = 109; P < 0.0001) (E) or Kaplan-Meier Plotter Tang_2018 dataset (n = 65; P = 0.0061) (F) of breast cancer patients with low versus high SH3BGRL expression. (G,H) Immunoblots of SH3BGRL in 12 pairs of breast cancer samples and matched adjacent normal tissues (G), and in MCF-10A and 8 cultured breast cancer cell lines (H). ACTB served as the loading control. (I,J) IHC staining of SH3BGRL expression in 25 paired human breast cancer tissues, compared with their adjacent normal ones (I). Statistical SH3BGRL expression is shown (J). Scale bars are shown; P < 0.0001.
SH3BGRL confers resistance to doxorubicin cytotoxicity through autophagic protection
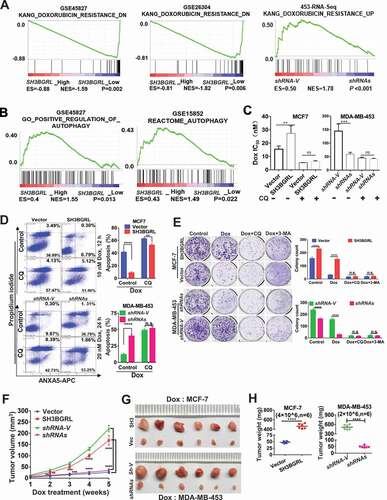
To understand the underlying physiological role of SH3BGRL in breast cancer progression and the poor prognosis, we performed the gene set enrichment analysis (GSEA) of breast cancer patient cohorts from various public datasets. Interestingly, GSEA analyses demonstrated that SH3BGRL expression is positively correlated with the enrichment of gene signature for doxorubicin resistance, but inversely with the doxorubicin-sensitive gene signature (). Meanwhile, SH3BGRL mRNA level was elevated in almost all patients with conventional chemotherapy, targeted therapy and endocrino-therapy, based on analyses of breast cancer patient cohorts retrieved from the public Gene Expression Omnibus (GEO) databases (Fig. S1B, Table S1). Typically, SH3BGRL was significantly upregulated in doxorubicin (Dox)-resistant MCF-7 cells. Further analyses uncovered that SH3BGRL expression was also positively correlated to autophagy-related gene signature from analysis of more breast cancer patient cohorts (GSE45827 and GSE15852) (; Fig. S1C,D). Given that autophagy is a crucial cellular event against chemotherapy [Citation27–35], including against Dox in clinical breast cancer treatment, we suspected that SH3BGRL might promote autophagy-mediated Dox resistance in breast cancer. To verify this hypothesis, we overexpressed SH3BGRL in MCF-7 cells with a low level of endogenous SH3BGRL (Fig. S2A) and knocked down it in MDA-MB-453 cells with high endogenous SH3BGRL (Fig. S2B). Blockade of cell autophagy completion with a known inhibitor, chloroquine (CQ), or its initiation with a class III phosphatidylinositol 3-kinase inhibitor, 3-methyladenine (3-MA) showed marginal influence on colony formation (Fig. S2C,D) and cell apoptosis of both SH3BGRL-high and their control cells (Fig. S2E,F), but this blockade sensitized SH3BGRL-overexpressing cells to have similar Dox cytotoxicity response as their parental counterparts (Fig. S2E,F, Dox). Cytotoxicity analysis showed that SH3BGRL overexpression increased IC50 of cells to Dox, while SH3BGRL knockdown decreased it, and inhibition of cell autophagy with CQ efficiently neutralized the effects (; Fig. S2G,H). Flow cytometry and colony formation analyses verified that SH3BGRL overexpression conferred cell resistance to Dox treatment, and blockade of cell autophagy by either CQ or 3-MA sensitized cells to Dox cytotoxicity (, MCF-7; Fig. S2I). In contrast, SH3BGRL knockdown sensitized cell apoptosis to Dox treatment and reduced colony formation ability, and inhibition of autophagy almost abrogated these discrepancies (, MDA-MB-453; Fig. S2J). Immunoblots revealed that SH3BGRL blocked the cleavages of PARP and CASP3 (caspase 3), but increased the autophagic SQSTM1/p62 degradation upon Dox treatment (Fig. S2K). Conversely, SH3BGRL knockdown reversed these events in MDA-MB-453 cells (Fig. S2L), and blockade of autophagy attenuated all these alterations in both cell types (Fig. S2K,L). We further evaluated the Dox resistance induced by SH3BGRL overexpression in a subcutaneous xenograft tumor model and observed that SH3BGRL overexpression promoted the tumor growth of MCF-7 cells even with Dox therapy, while SH3BGRL silence dramatically sensitized tumors induced by MDA-MB-453 cells to Dox (). Therefore, SH3BGRL might confer autophagy-mediated chemoresistance in breast cancer.
Figure 2. SH3BGRL confers resistance to doxorubicin (Dox)-induced apoptosis through autophagy. (A) GSEA enrichment analysis of SH3BGRL expression and Dox resistance signature in public breast datasets (GSE45827,n = 130; GSE26304, n = 109) and MDA-MB-453 cells. (B) GSEA plots of SH3BGRL expression with autophagy gene signatures in public breast cancer datasets GSE45827(n = 130) and GSE15852 (n = 41). (C) IC50 of Dox in the indicated cells under combined treatment with CQ or without CQ. (D) Flow cytometry analyses of MCF-7 cells with SH3BGRL overexpression or MDA-MB-453 cells with SH3BGRL knockdown with their parental control cells treated with indicated concentrations of Dox and time with or without CQ. The left panels show the staining of ANXA5-FITC and PI, and the right ones present the quantification of apoptotic cells. (E) Colony formation of the cells as shown in (D) with treatments of Dox combined with CQ or 3-MA or without them (Control), respectively. The upper panels show representative images of generated colonies. Each experiment was independently repeated three times. (F-H) Xenograft model of MCF-7 and MDA-MB-453 tumor cells for tumor progression in nude mice. The growth curves of each tumor progression were measured by tumor volume (F), mean tumor weight of the dissected tumors after five weeks of tumor growth (G) and their weight statistical analysis (H). Six nude mice in each group were subcutaneously injected with indicated cells for 1 week, and the Dox treatment was conducted. All statistical analyses are shown as *P < 0.05, **P < 0.01, ***P < 0.001, ****P < 0.0001 and n.s, no significance, respectively.
SH3BGRL triggers autophagy in breast cancer cells
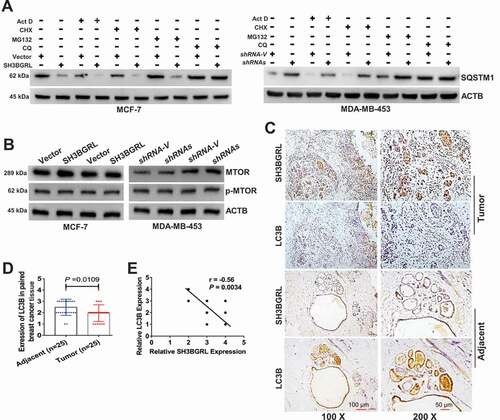
To verify the driving effect of SH3BGRL on macroautophagy, we examined the two typical autophagy markers, LC3B and SQSTM1, and showed that SH3BGRL overexpression decreased SQSTM1 level even without Dox-induced stress, whereas SH3BGRL knockdown increased it in breast cancer cells () along with the relevant LC3B-I to LC3B-II transition for autophagy progression (). Furthermore, when inhibiting the autophagosome-lysosome fusion step with bafilomycin A1 (Baf A1) for a short time to probe the releasing autophagy flux [Citation67], we observed an evident LC3B-II enrichment in the SH3BGRL-overexpressing cells, in contrast, it was faded in cells with SH3BGRL knockdown (), indicating the existence of SH3BGRL-induced autophagy flux. Immunofluorescence staining indicated that the LC3B aggregation puncta were clearly increased by SH3BGRL overexpression in MCF-7 cells, while SH3BGRL knockdown decreased it in MDA-MB-453 cells under either serum-free or amino acid-depleted EBSS starvation (). The marked lysosomal SQSTM1 degradation was also confirmed (), and no clear MTOR activation was related to SH3BGRL-induced autophagy (). Moreover, we validated the relationship between SH3BGRL and autophagy events in breast cancer patients with IHC staining of SH3BGRL and LC3B in the same cohort of 25 paired human breast cancer specimens. Staining and statistical analysis demonstrated that patients with SH3BGRL high expression manifested a clear decrease of total LC3B protein level, compared with the paired adjacent normal tissues (). Meanwhile, SH3BGRL protein level was statistically correlated with that of LC3B in patients negatively (). Collectively, these results indicated that elevated SH3BGRL promotes autophagy progression in breast cancer cells.
Figure 3. SH3BGRL promotes autophagy flux in breast cancer cells.(A-C) Immunoblots of SQSTM1, LC3B-I and LC3B-II in indicated cells with or without Dox treatment (A). ACTB was used as an internal loading control. Statistical analyses of SQSTM1 expression (B) and LC3B-II:LC3B-I ratio(C) in indicated cells. ***P < 0.001, ****P < 0.0001, n.s., no significance. (D) Immunoblots of SQSTM1, LC3B-I and LC3B-II in indicated cells. Cells were pretreated with 50 nM Baf A1 for 4 h and cultured in either normal culture medium (upper panel, Normal) or EBSS medium (lower panel, EBSS) for another 2 h, respectively. ACTB was used as an internal loading control. (E) Immunoblots of autophagy-related proteins and the cleaved c-CASP3 in MCF-7 SH3BGRL overexpressing cells or MDA-MB-453 SH3BGRL knockdown cells. Cells were treated with Dox along with or without 50 nM BafA1 for 4 h. (F,G) Representative immunofluorescence staining of LC3B puncta in indicated cells with Serum-free medium (F) for 12 h or EBSS culture for 6 h (G). Cells were counterstained with DAPI in blue. Bars: 25 μm. (H) Quantifications of LC3B puncta intensity in the assayed cells (F,G) were presented as histograms. ***P < 0.001, ****P < 0.0001.
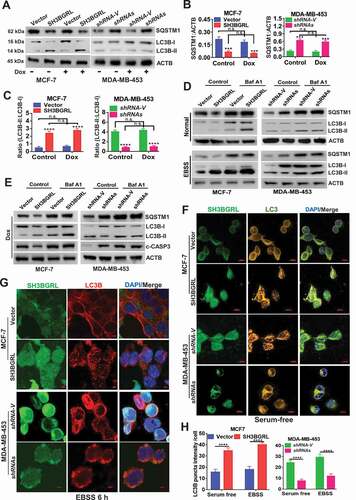
Figure 4. SH3BGRL renders autophagy of breast cancers. (A) Immunoblots of SQSTM1 protein in the MCF-7 cells with SH3BGRL overexpression or MDA-MB-453 cells with SH3BGRL knockdown, respectively. Cells were treated with or without 0.5 µg/ml actinomycin D (Act D), 50 μg/ml cycloheximide (CHX), 20 μM MG132, or 50 μM CQ for 12 h, respectively. (B) Immunoblots of MTOR and its phosphorylated form in the indicated cells. (C,D). Representative IHC staining of total LC3B protein expression in 25 paired human breast cancer tissues compared with adjacent normal ones (C) Scale bars: 100 mm (insets, 50 mm). Statistical LC3B expression is shown (D), P = 0.0109. (E) Correlation analysis of SH3BGRL expression level with that of LC3B in breast cancer tissues. (n = 25; r = −0.56; P = 0.0034).
SH3BGRL drives autophagy through PIK3C3 translation enhancement through interacting with ribosomes
To further explore the underlying mechanism of SH3BGRL in autophagy, affinity purification, co-immunoprecipitation and mass spectrometry (MS) were approached to figure out the SH3BGRL-bound proteins in breast cancer tissues (Fig. S3A). MS identification indicated that SH3BGRL interacts with abundant translation machinery proteins, including small and large subunits of ribosomes, translation initiation factors and translation extension factors in both breast cancer tissues (Fig. S3B,C) and cells (). Therefore, we suspected that SH3BGRL might interact with ribosomes to modulate the translation process of proteins, including autophagy-related proteins. Colocalization and interaction of SH3BGRL with a ribosomal RPL7a subunit in different breast cancer cells and 293 T cells were observed with immunofluorescence and co-immunoprecipitation assays, respectively (Fig. S3D,E).
Figure 5. SH3BGRL drives autophagy through PIK3C3 translation by interaction ribosome. (A) GST affinity isolation of SH3BGRL with ribosomal subunits. GST affinity isolation was performed with lysates of MCF-7 and MDA-MB-453 cells, followed by MS peptide sequencing. (B) Heatmap of RNA-seq and Polyribosome-profile analyses of ULK1, PIK3C3, BECN1, ATG7, ATG5, ATG3, MAP1LC3B and SQSTM1. (C) Immunoblots of SH3BGRL and PIK3C3 in indicated cells. ACTB was used as an internal loading control. Statistical analysis of PIK3C3 expression in indicated cells by four independent immunoblots. (D) Immunoblots of PIK3C3 protein in the indicated cells treated with or without 50 μg/ml cycloheximide (CHX) for 6 h. PIK3C3 expression was statistically analyzed based on three independent experiments. (E,F) Polyribosome profiling of PIK3C3 mRNA in MCF-7 (E) or MDA-MB-453 (F) cells. ACTB was used as an internal negative loading control. The marked numbers are equivalent to the collected fractions after gradient centrifuge. Fraction 1 represents the top (10%) of the gradient, fraction 10 represents the bottom (50%) of the gradient. (G) Polyribosome profiling of ATG12 mRNA in indicated cells as (E). All experiments were independently repeated at least three times. (H) Immunoblots of ULK1, BECN1, ATG7, ATG5 and ATG3 in the indicated cells. ACTB was used as a loading control. All significant differences are shown as *P < 0.05, **P < 0.01, ***P < 0.001, ****P < 0.0001.
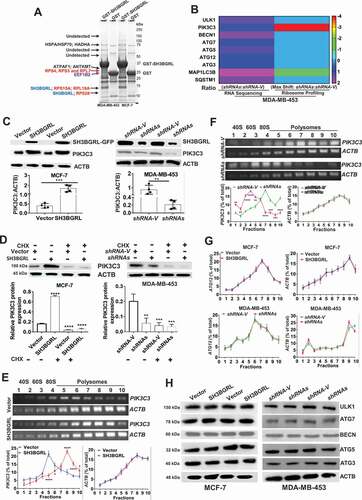
To further investigate whether SH3BGRL participates in whole protein translation, we performed a polyribosome-mRNA profiling by sucrose density-gradient centrifugation, followed by RNA-sequencing in MDA-MB-453 cells. Sequence analysis revealed that SH3BGRL depletion dramatically altered some gene translation, which is indicated by the mRNA fraction shift (Fig. S3F; Table S2). In addition, we analyzed the translation efficiency of autophagy-related genes in our profiled sequence and found that autophagy-initiating PIK3C3 mRNA showed about 4 shifts to the lighter portion, indicating its translation attenuation (; Fig. S3G), but no other autophagy-related gene was observed (Fig. S4A-L; Table S3). Besides, RNA-seq and quantitative mRNA expression analyses demonstrated that SH3BGRL marginally impaired expression of these genes at the transcriptional level, including PIK3C3 and ATG12 (Fig. S4M-O; Table S3,S4), suggesting the possible main PIK3C3 upregulation by SH3BGRL at the translational level.
As expected, immunoblot results showed that PIK3C3 was evidently increased in SH3BGRL-overexpressing cells, but decreased in SH3BGRL knockdown cells (). Moreover, we examined PIK3C3 mRNA and protein level in breast cancer cell lines and found PIK3C3 protein was almost all upregulated, but the mRNA level was not well consistent with each protein level (Fig. S5A,B). When blockade of ribosome translation by a translation inhibitor, cycloheximide (CHX), PIK3C3 protein level in SH3BGRL-overexpressing cells was clearly reverted to that of the parental cells (). Moreover, we further performed the polyribosome profiling in cells and observed that PIK3C3 mRNA shifted into the heavier polyribosome fractions in SH3BGRL high cells (), whereas it, in turn, shifted into the lighter portion in SH3BGRL-knocked down cells (). There was no fraction shift or transcriptional expression change of ATG12 (; Fig. S5C,D) and protein change of other autophagy genes (). Immunofluorescence further confirmed that SH3BGRL overexpression facilitated the LC3B aggregation and PI3KC3 expression, but its depletion attenuated these events (Fig. S5E). Taken together, our results demonstrated that SH3BGRL may promote breast cancer cell autophagy at least through enhancing PIK3C3 translation by interaction with ribosomes.
SH3BGRL also promotes autophagy through sustaining ATG12 stability
Along with the above-mentioned effect, we also observed that SH3BGRL could effectively upregulate ATG12 in breast cancer cells at protein level (; S6A,B), but not its mRNA level and translational event as described. CHX chase assay demonstrated that SH3BGRL sufficiently reduced ATG12 degradation rate in MCF-7 cells, while SH3BGRL silence accelerated it in MDA-MB-453 cells (). Reciprocal co-immunoprecipitation (co-IP) disclosed that SH3BGRL interacts with ATG12 and BECN, but no other autophagy-related proteins in various cells (; Fig. S6C). Moreover, immunofluorescence staining also showed co-localization of ATG12 with SH3BGRL in the above two cell lines ().
Figure 6. SH3BGRL also enhances autophagy through sustaining ATG12 stability. (A) Immunoblots of ATG12 in the indicated cells. ACTB was used as a loading control. Statistical analysis of ATG12 expression by four independent immunoblots. ***P < 0.001, ****P < 0.0001. (B) ATG12 protein stability analysis. Indicated cells were treated with 50 μg/ml cycloheximide (CHX) for 0, 3, 6, 9 h and the statistical analysis of ATG12 expression was conducted with three independent experiments. ***P < 0.001, ****P < 0.0001. (C) Co-immunoprecipitation of SH3BGRL and ATG12 in lysates of HEK293T, MCF-7, MDA-MB-231 and MDA-MB-453 cells. (D) Co-immunoprecipitation analysis of the interaction domain of SH3BGRL with ATG12 in 293 T and MCF-7 cells transfected with indicated SH3BGRL and truncated mutants, respectively. Cells were treated with MG132 for 12 h to block the degradation of ATG12. (E) Immunoblots of ATG12 in the indicated cells. Cells were treated with or without MG132 for 12 h. Statistical analysis of ATG12 expression was performed with three independent experiments. *P < 0.05, **P < 0.01. (F) Ubiquitination analysis of ATG12. Cells were treated with or without MG132 for 12 h. Lysates from Indicated cells were immunoprecipitated with ATG12 antibody, followed by immunoblotting analysis with antibody against ubiquitin.
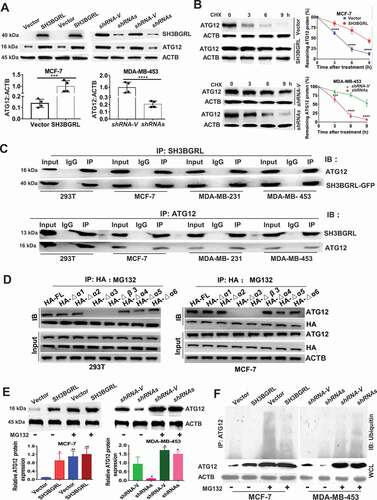
To characterize the motif of SH3BGRL for the possible binding with ATG12, we individually deleted all 6 α helixes and β3 sheet (core region of SH3B domain) of SH3BGRL to conduct co-IP analysis. Results showed that deletion of either α3 helix or β3 sheet of SH3BGRL abrogated its interaction with ATG12, while deletion of the α5 helix also attenuated the interaction, and the total ATG12 protein amount was decreased along with the α3 helix- or β3 sheet-deleted mutant of SH3BGRL expression (Fig. S6E). To further investigate the possible proteasome degradation of ATG12 for the less ATG12 binding with the α3 helix or β3 sheet-deleted SH3BGRL mutants, we treated the cells with proteasome inhibitor, MG132 and found that the α3 helix or β3 sheet in SH3BGRL is still essential to the binding of SH3BGRL with ATG12 (). Immunoblot confirmed that SH3BGRL β3 or α3 domain breakdown consequently caused ATG12 reduction, compared with other deletions in MCF-7 (Fig. S6F), suggestive of the interaction between SH3BGRL and ATG12. To validate if the interaction between SH3BGRL and ATG12 blocks ATG12 ubiquitination degradation, we treated cells with MG132 again. Immunoblots revealed that blockade of proteasome process, the ATG12 expression in parent MCF-7 cells or the MDA-MB-453 SH3BGRL knockdown cells showed similar level to the SH3BGRL-high counterparts (), indicating the mimicking effect of protosome inhibition to SH3BGRL. Ubiquitination assay directly manifested that the decreased ubiquitin-conjugated ATG12 in SH3BGRL-overexpressing cells, and the increased in SH3BGRL-silenced ones (). Thus, these results demonstrated that SH3BGRL can parallelly enhance autophagy through stabilizing ATG12 by either interaction with ATG12 to block its degradation or by binding with and weakening ATG12 E3 ligase function in breast cancer cells.
PIK3C3 and ATG12 contribute to SH3BGRL-mediated doxorubicin resistance
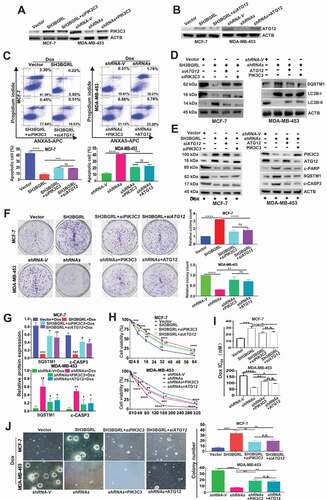
To validate the characterized autophagy-mediated Dox resistance by SH3BGRL-PIK3C3/ATG12 axis, we additionally knocked down PIK3C3 or ATG12 in SH3BGRL-overexpressing cells (), or forced expression of them in SH3BGRL knockdown cells (), respectively. Flow cytometry analysis indicated that the additional silence of endogenous PIK3C3 or ATG12 in SH3BGRL-overexpressing MCF-7 cells markedly promoted apoptosis () along with less autophagy () as well as the elevated apoptosis featured with the cleaved PARP and CASP3 () upon Dox treatment. Meanwhile, this PIK3C3 or ATG12 silence resulted in lower cell viability, less colony formation under Dox treatment (, MCF-7). Conversely, the forced PIK3C3 or ATG12 expression in SH3BGRL-knockdown MDA-MB-453 cells repressed cell apoptosis, increased autophagy level and Dox resistance (, MDA-MB-453), confirming the crucial role of autophagy in chemoresistance induced by SH3BGRL for PIK3C3 or/and ATG12 upregulation.
Figure 7. PIK3C3 and ATG12 contribute to SH3BGRL-mediated Dox resistance. (A,B) Immunoblots of PIK3C3 (A) and ATG12 (B) in indicated cells. ACTB served as the loading control. (C) Flow cytometry analysis of the indicated MCF-7 series cells. 10 nM or 20 nM Dox was used to treat MCF-7 or MDA-MB-453 cells for 12 h or 24 h, respectively. The left panel shows the staining of ANXA5-FITC and PI. The right panel is the quantification of apoptotic cells. (D) Immunoblots of the indicated autophagy markers in MCF-7-SH3BGRL overexpression cells with either ATG12 or PIK3C3 knockdown, or in MDA-MB-453-SH3BGRL knockdown cells with either ATG12 or PIK3C3 forced expression. (E) Immunoblots of SQSTM1 and the cleaved CASP3 in the above cells in (C). MCF-7 cells were treated with 10 nM Dox for 12 h, and MDA-MB-453 cells with 20 nM Dox for 24 h. (F) Representative images of colonies formed by indicated cells with10 nM or 20 nM Dox treatment. The right panel shows the quantification of colony formation. Colonies with more than 60 cells were scored. (G) Statistical SQSTM1 and the cleaved CASP3 expression by three independent experiments. 10 nM Dox was used for MCF-7 cells, and 20 nM for MDA-MB-453 cells. (H) Cell viability analysis of indicated cells under treatment with Dox at various concentrations, combined with or without CQ for 24 h. (I) IC50 of the indicated cells under treatment as in (D). (J) Representative images of soft agar colonies of the indicated cells after treatments with10 nM or 20 nM Dox treatment for 48 h (Left panel). Quantification of soft agar colony is shown in the right panel. Colonies (larger than 0.1 mm diameter) were quantified after 18 days of culture. Significant differences are shown as *P < 0.05, **P < 0.01, ***P < 0.001, ****P < 0.0001, and n.s means no significance.
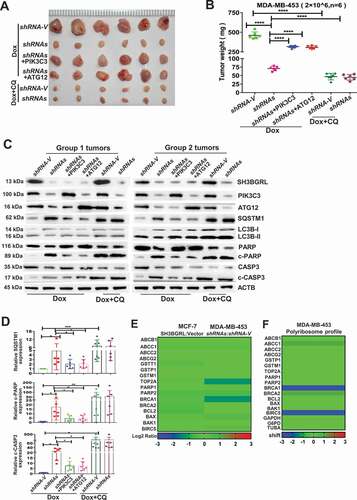
The physiological role of SH3BGRL-mediated autophagy to Dox resistance of breast cancer was further evaluated by a subcutaneous xenograft tumor model. SH3BGRL knockdown in breast cancer cells markedly sensitized its tumors to Dox therapy, leading to reduced tumor burdens, while supplemental PIK3C3 or ATG12 overexpression abrogated the tumor regression (, Dox). Impressively, the combination of Dox with autophagy inhibitor, CQ could efficiently render the regression of SH3BGRL-high tumors of MDA-MB-453 cells (, Dox+CQ). Moreover, we determined this SH3BGRL-PIK3C3 or ATG12 and the subsequent autophagy and apoptosis events in these xenografted tumors. Results showed that SH3BGRL depletion sufficiently inhibited cell autophagy and tumor cell apoptosis upon Dox treatment (, Dox). Whereas, PIK3C3 or ATG12 overexpression in SH3BGRRL-silenced tumors promoted autophagy and suppressed tumor cell apoptosis, and the combination of Dox with CQ enhanced more tumor cell apoptosis (, Dox+CQ). In addition, we analyzed and found that SH3BGRL presented no obvious influence on the other chemotherapy-resistant genes, including ABCs, topoisomerase II (TOP2A), repair of DNA damage, detoxifying systems and classical apoptosis (type I programmed cell death), indicating that SH3BGRL-derived autophagy is the main cause to chemotherapy, including Dox (; Table S5-6). Taken together, these results demonstrated that SH3BGRL-PIK3C3-ATG12 autophagy axis confers the effective Dox or other chemoresistance in breast cancer.
Figure 8. PIK3C3 and ATG12 contribute to tumorigenicity and Dox resistance. (A,B) Xenograft model of chemotherapy in nude mice. Six nude mice in each group were subcutaneously injected with indicated cells for 1 week, mice were treated with Dox combined with or without CQ for two weeks. Mean tumor weights were quantified around another three weeks later (B). ****P < 0.0001. (C) Immunoblots of SH3BGRL, PIK3C3, ATG12, SQSTM1, LC3B, PARP, cleaved (c)-PARP, CASP3 and c-CASP3 in the indicated mice tumor tissues. ACTB was used as a loading control. (D) Statistical analysis of SQSTM1, c-CASP3 and c-PARP expressions in the indicated six group mice tumors. Error bars represent mean ± s.d.*P < 0.05, **P < 0.01, ***P < 0.001. (E) Transcriptional expression analysis of classical genes involved in Dox resistance from RNA-Seq of MCF-7 and MDA-MB-453 cells with SH3BGRL expression alteration. (F) Translational expression analysis of general genes involved in Dox resistance based on polyribosome profiling results of MDA-MB-453 cells.
Activation of SH3BGRL-PIK3C3/ATG12 canonical autophagy in breast cancer patients
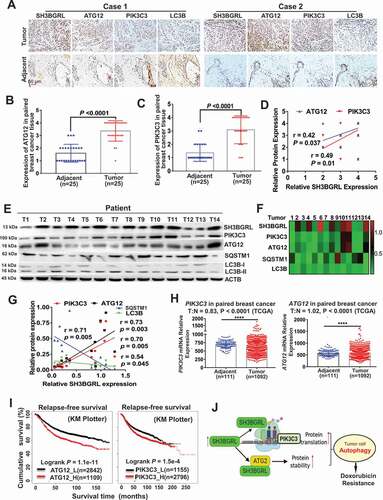
Next, we investigated the clinical relevance of SH3BGRL-PIK3C3/ATG12 autophagy on breast cancer. IHC staining of SH3BGRL, PIK3C3, ATG12 and LC3B was performed in the same cohort of 25 paired breast cancer specimens. Results revealed that SH3BGRL, ATG12 and PIK3C3 were coordinately elevated in breast cancers, while LC3B was downregulated, compared to the paired adjacent normal tissues (; S7A). Statistical analysis showed that SH3BGRL is positively correlated to the expression of PIK3C3 or ATG12, and negatively to LC3B, respectively (). These results were further verified in another 14 fresh breast cancer tissues by immunoblotting, in which SH3BGRL expression was analyzed to be positively correlated to that of PIK3C3 and ATG12, and negatively to SQSTM1 and LC3B (). SH3BGRL mRNA was also elevated in 10 paired tumor tissues, but no dramatic change of PIK3C3 or ATG12 mRNA level was observed (Fig. S7B). The less than 1.2-fold marginal changes of PIK3C3 and ATG12 mRNA levels were also validated by analyses of other breast cancer cohorts (GSE45827, GSE26304 and TCGA dataset) (; Fig. S8A-F). In contrast, PIK3C3 and ATG12 protein were both upregulated in these 10 pairs of tissues clearly (Fig. S8G), indicating the main upregulation of PIK3C3 and ATG12 on posttranscriptional regulation.
Figure 9. Activation of SH3BGRL-PIK3C3/ATG12 autophagy axis in breast cancer patients. (A). Representative IHC staining of SH3BGRL, ATG12, PIK3C3 and LC3B expressions in 25 primary breast cancer specimens along with the matched adjacent normal tissues. Scale bar: 50 µm. (B,C) Statistical analysis of ATG12 (B) and PIK3C3 (C) in tissues of (A). (D) Correlation analysis of SH3BGRL protein level to that of ATG12 (r = 0.42; P = 0.037) or PIK3C3 (r = 0.49; P = 0.01) in breast cancer tissues in (A). (E) Immunoblots of the indicated proteins in 14 fresh breast cancer specimens. ACTB was used as a loading control. (F) Heatmap of protein expression of SH3BGRL, PIK3C3, ATG12, SQSTM1, and LC3B protein band intensity in (E), which was quantified and analyzed with densitometry and Image J software. (G) Correlation analysis of SH3BGRL protein level with that of PIK3C3, ATG12, SQSTM1 or LC3B in (F). (H) Marginal elevation of PIK3C3 mRNA expression in breast cancer tissues, compared with normal breast tissues (T = 1092, N = 111;T:N = 0.83, P < 0.0001; TCGA) and ATG12 mRNA (T = 1092, N = 111;T:N = 1.02, P < 0.0001; TCGA). (I) Kaplan–Meier relapse-free survival curves of breast cancer patients based on mRNA of ATG12 (n = 3951; P = 1.1e-11) or PIK3C3 (n = 3951; P = 1.5e-4). (J) Schematic mechanism of SH3BGRL-PIK3C3/ATG12 autophagy on doxorubicin resistance in breast cancer. All statistical analyses are shown as ****P < 0.0001.
Besides, PIK3C3 and ATG12 mRNAs could also be upregulated by treatment with conventional chemotherapy, targeted therapy, or endocrinotherapy drugs, based on analysis of the public Gene Expression Omnibus (GEO) dataset of breast cancer cell lines (Fig. S8H,I; Table S1). Eventually, Kaplan–Meier Plotter of the random large-scale breast cancer datasets demonstrate that patients with high PIK3C3 or ATG12 levels significantly suffered poorer 5-year overall survival, relapse-free survival, and metastasis-free survival in breast cancer patients (; ). All results above validate the relevance of this SH3BGRL-PIK3C3-ATG12 autophagy axis on Dox chemo-resistance in breast cancers via posttranscriptional regulation in breast cancer metastasis relapse and poorer clinical outcomes ().
Discussions
Chemotherapy, including the anthracycline, Dox, still is widely used as the first-line treatment of breast cancer [Citation4]. However, acquired resistance to chemotherapy is often with disease progression, relapse and metastasis [Citation8,Citation9]. Activation of cytoprotective autophagy is one of the crucial causes of drug resistance [Citation27–30], but the reason for protective autophagy is elusive. Here, we disclose small adaptor protein, SH3BGRL, as a novel main cause of this protective autophagy, contributes to chemotherapy resistance, especially to doxorubicin. Therefore, either targeting SH3BGRL or combinational inhibition of autophagy with anticancer drugs would be a potential therapeutic strategy to break and overcome Dox resistance or another drug resistance.
As a scaffold protein, it is rational to predict that SH3BGRL could play important roles in protein-protein interaction and signal transduction to regulate multiple important cellular processes [Citation57]. Recently, we characterized the interaction between SH3BGRL and ERBB2/HER2 in the resistance of ERBB2/HER2-target therapy and cisplatin in breast cancer [Citation63]. Likely, here we also identify that SH3BGRL interacts with ATG12 to maintain ATG12 level by inhibiting the ubiquitin-mediated ATG12 degradation. But the detailed mechanism still needs to be further dissected. Tentatively, we speculate that binding of SH3BGRL to ATG12 might block the interaction between ATG12 and its E3 ligase, or SH3BGRL interacts with the E3 ligase to halter the binding of ATG12 with its E3 ligase.
Unexpectedly, we also observe that SH3BGRL can bind with abundant translational machinery proteins, including ribosomal subunits, indicating its interaction with ribosomes. As an adaptor protein, we suspect that the interaction of SH3BGRL with ribosomal subunits may cause a unique conformational structure, which subsequently leads to the bias for mRNA translation in the mRNA-ribosome complex assembly or elongation processes. Nevertheless, we experimentally demonstrate that SH3BGRL can efficiently affect multiple mRNA polyribosome profiles on the whole gene level, including PIK3C3. However, the detailed function of SH3BGRL in ribosome assembly, the target mRNA bias selectivity, or elongation efficacy in the translation process should be thoroughly dissected by structural analysis.
Elevation of PIK3C3 and ATG12 protein levels along with the no obvious change of their mRNA levels in SH3BGRL-positive breast cancer tissues indicates that the dysregulation of critical genes at the post-translational level is common in tumors. However, the high-throughput RNA-sequencing is generally approached to assess gene expression alteration [Citation68], the inconsistency of a gene’s mRNA abundance with its protein level should be given extensive attention in evaluating the real effect of a gene in diseases [Citation69]. Thus, the combination of RNA-sequencing with the translatome or polyribosome profiling would be an ideal strategy.
Autophagy acts as a double-edged sword in cancer cell survival and death. Increasing evidence predominantly indicates that autophagy functions for cell survival upon stresses induced by anti-cancer agents [Citation44,Citation46,Citation48]. Here, we present that SH3BGRL upregulation can promote cytoprotective autophagy to enhance Dox resistance through multiple manners, such as by the accelerated translation of PIK3C3 for autophagy initiation or the increased protein stability of ATG12 in autophagosome formation. Likely, autophagy can lead to sequestration of Dox in lysosomes to reduce cell damage [Citation31,Citation70]. Therefore, usage of autophagy inhibitor agents could efficiently abolish SH3BGRL-mediated Dox resistance. In addition, as the total LC3 (A or B) protein can be downregulated in SH3BGRL-high breast cancers, the detection of LC3 (A or B) would be helpful to autophagy-inhibiting therapy. When evaluating the IC50 of a specific chemotherapy agent in cells, the seeding cell confluency, cell type and tumor cell heterogeneity should be considered, as these could cause experimental inconsistency.
Overall, our results at least uncover that SH3BGRL is a novel drug-resistant gene to promote autophagy-mediated Dox resistance in breast cancer through upregulations of PIK3C3 and ATG12 with distinct mechanisms. Thus, targeting SH3BGRL or its downstream key effectors would be a possible strategy to overcome drug resistance of chemotherapy in breast cancers.
Materials and methods
Cell culture and reagents
Human breast cancer cell lines MCF-7, MDA-MB-231, MDA-MB-453, MDA-MB-468, ZR-75-1, SKBR-3, BT-549, BT-474 and HEK293T cell lines were purchased from the Cell Bank of Chinese Academy of Sciences (TCHu 74, TCHu227, TCHu233, TCHu136, TCHu126, TCHu 225, TCHu 93, TCHu143, GNHu 43, respectively) and cultured in RPMI 1640 (Gibco, 11875085) or DMEM (Gibco, 11995123) with 10% FBS at 37°C in a 5% CO2 incubator. MCF-10A, a non-tumorigenic breast epithelial cell line, was purchased from the American Type Culture Collection (ATCC, CRL-10317) and cultured in keratinocyte serum-free medium (KSFM; Gibco, 12568010) supplemented with 0.1 ng/ml human recombinant EGF (epidermal growth factor; Gibco, PHG0315) and 20 μg/ml bovine pituitary extract (Invitrogen, 13028014). All used cell lines were also authenticated using the STR method and tested for mycoplasma contamination. Generally, cells were treated with indicated reagents at 85% of confluency. Chloroquine diphosphate salts (CQ; Selleck, S6999) were dissolved in DMSO (Sigma, D8418) at 50 μM as a stock to be used, while the equal volume of DMSO was used as control. Likewise, actinomycin D (Act D, 0.5 µg/ml; Sigma, SBR00013), cycloheximide (CHX, 50 μg/ml; Sigma, 5087390001), 3-methyladenine (3-MA, 5 mM; Selleck,S2767), bafilomycin A1 (Baf A1, 50 nM; Selleck, S1413) and MG132 (20 μM; Sigma, C2211) was also used at the indicated time points to terminate the novel transcription, protein synthesis and degradation, respectively.
Clinical samples and Immunohistochemistry (IHC)
wenty-five pairs of breast cancer tissue with the corresponding adjacent counterparts and 14 fresh breast cancer tissues were collected with the informed consents and approved by the Research Ethics Committee, according to Sun Yat-Sen University health regulation. Tissues were formalin-fixed, paraffin-embedded and sliced into 5 μm serial sections with Leica BM 2135 microtome, which were subsequently incubated with anti-SH3BGRL (1:200 dilution; Sigma-Aldrich, HPA051248). Antibodies of anti-LC3B (1:200 dilution), anti-PIK3C3 (1:200 dilution) and ATG12 (1:200 dilution) were also purchased from Cell Signaling Technology (CST; 3868, 3358S, 4180, respectively) Biological Reagents Company Limited, respectively. Slices were developed with Polink-1 HRP DAB Detection System (ZSGB-BIO, ZLI-9036) and Images were captured and confirmed by two independent professional pathologists by microscopy (Nikon, Tokyo, Japan). The color intensity of slides was divided into four grades (points) to score SH3BGRL, PIK3C3, ATG12 and LC3B expression levels for statistical analysis.
The stable cell establishment
The stable cell lines of MCF-7 with SH3BGRL overexpression and MDA-MB-453 with SH3BGRL knockdown as well as the HA-tagged SH3BGRL mutants were established as previously described [Citation63]. PIK3C3-specific siRNA: 5′- CAGAGAAGTTTCACTACATCTAT-3′ and that of ATG12 (5′-CACCAAGTTTCACTGTGTAATTG-3′) were purchased from Invitrogen for knockdown of PIK3C3 and ATG12, respectively. Cells were transfected with Lipofectamine 3000 (Invitrogen, L3000075). Supplemental PIK3C3 or ATG12 overexpression was achieved with EGFP-PIK3C3 or EGFP-ATG12 plasmids in pEGFP-C1 Vector (Vigene, CH810399, CH821707, respectively) in MDA-MB-453 SH3BGRL knockdown cells and selected with 500 μg/ml G418 (Sigma-Aldrich, A1720) for 4–5 weeks. Single stable cell clones were picked under a fluorescence microscope (Nikon, Tokyo, Japan) to make stable cell pools.
Immunofluorescence microscopy
Cells were seeded on coverslips and fixed with 4% paraformaldehyde in 1× PBS (1 mM KH2PO4, 0.3 mM Na2HPO4.7H2O, 0.15 M NaCl, pH 7.4; Gibco, 10010031) for 20 min, followed by treatment with 0.2% Triton X-100 (BIOSHARP, 523287) for another 15 min at room temperature. Cells were then blocked with 4% BSA (Thermo, 23209) in PBS for 1.5 h and incubated with indicated primary antibodies overnight at 4°C. After 3 times washes with 1× PBS, cells were stained with Alexa Fluor 488-, 594-, or 647 conjugated secondary antibodies (Invitrogen; A10680, A32740, A32733, respectively) at room temperature for 1 h. Cells were then washed and counterstained with DAPI for 3 min, then mounted with an anti-fade reagent. Slides were viewed and photographed with an LSM710 confocal microscope (Carl Zeiss AG). Images were processed by Photoshop (Adobe Systems).
Autophagy assays
Autophagy flux was examined in terms of LC3B-II turnover with immunoblotting LC3B-II (CST, 3868) protein level or the endogenous LC3B puncta number as described [Citation67]. The completion of autophagy was evaluated with SQSTM1 protein level. For endogenous LC3B staining, cells were pre-treated with EBSS (Gibco, 14155063) or serum-free starvation for 1 h and then fixed for immunofluorescence with LC3B antibody. The average channel pixel intensity of LC3B within the cytoplasmic area per cell was scored by Photoshop as the overall amount of LC3B puncta in each cell.
Antibodies and Immunoblotting
Antibodies of anti-SH3BGRL (1:1000; Sigma-Aldrich, HPA051248), anti-ACTB/β-actin (1:2000; CST, 4967), anti-SQSTM1/p62 (1:1000; CST, 5114), anti-LC3B (1:1000; CST, 3868), anti-PIK3C3 (1:1000; CST, 3358S), anti-ATG12 (1:1000; CST, 4180), anti-ULK1 (1:1000; CST, 4773), anti-ATG7 (1:1000; CST, 8558), anti-BECN1 (1:1000; CST, 3495), anti-ATG5 (1:1000; CST, 8540), anti-ATG3 (1:1000; CST, 3415), anti-RPL7A (1:1000; CST, 2415), anti-MTOR (1:1000; CST, 2983), anti-phospho-MTOR (Ser2448) (1:1000; CST, 2971), anti-HA (1:1000; CST, 3724), anti-ubiquitin (1:1000; CST, 3933S), anti-PARP (1:1000; CST, 9542), anti-c-PARP (1:1000; CST, 9541), anti-CASP3/caspase 3 (1:1000; CST, 9662) and anti-c-CASP3 (1:1000; CST, 9661) were purchased and used. For immunoblotting, cells were lysed with lysis buffer (10 mM Tris–HCl, pH 7.4, 150 mM NaCl; 0.5% NP-40 [Thermo, 28324], 1 mM EDTA, 0.2 mM PMSF [Thermo, 36978] and protease inhibitor cocktail [Thermo, 87786]) on ice. Whole cell lysates were centrifuged at 13,780 g for 15 min at 4°C, and the supernatant was collected and assessed using the BCA protein assay (Thermo, 23225). Total proteins were separated with SDS-polyacrylamide gel electrophoresis and transferred to nitrocellulose membrane (Millipore, Z358657), followed by incubation with the indicated antibodies and visualized on film by chemiluminescent substrates (Millipore, CPSOC) development. Protein band intensity was quantified and analyzed with densitometry and ImageJ software.
Co-immunoprecipitation assay and MS analysis
Cell lysates were incubated with 30 μL antibody or IgG conjugated with protein G magnetic beads (Thermo, 10003D) overnight at 4°C. Beads were washed with washing buffer (25 mM HEPES, pH 7.4, 150 mM NaCl, 0.5% NP-40,1 mM EDTA, 1 mM PMSF) for six times and the pelleted beads were resuspended in 30 μL 1 M glycine (pH 3.0) for electrophoresis or immunoblot analysis. The separated protein bands were stained with Coomassie Brilliant Blue. The specific bands were subjected to MS analysis by the commercial company.
Ubiquitination and protein half-life analyses
To detect the ubiquitination of endogenous ATG12, MCF-7-GFP, MCF-7-SH3BGRL, MDA-MB-453-shRNA-V and MDA-MB-453-shRNAs cells were treated with 20 μM MG132 for 12 h to block proteasome degradation. ATG12 was first immunoprecipitated with its antibody and then immunoblotted with an antibody against ubiquitin. For ATG12 half-life analysis, 50 μg/ml cycloheximide (Sigma-Aldrich, 5087390001) was used to treat cells for 0, 3, 6, and 9 h, and ATG12 protein was quantified by immunoblotting and densitometry analysis.
RNA extraction, cDNA synthesis, and real-time quantitative PCR
Total RNA was extracted from cells or frozen tumor specimens using the TRIzol Reagent (Invitrogen, 15596026). An equal amount of mRNA was used to generate cDNAs with a Revert Aid First Strand cDNA Synthesis Kit (Thermo, K1621) for semi-quantitative RT-PCR or real-time quantitative-PCR (qPCR). qPCR was performed using a 480 SYBR Green I Master kit (Thermo, AB1323A) and a LightCycler480 Detection System (Roche). The primer sequences used for real-time PCR are listed in Table S7. mRNA expression was presented as relative to the ACTB/β-actin level regarding the band intensity determined by densitometry and ImageJ software.
Ribosome mRNA profiling and sequencing
For polyribosome isolation [Citation71], cells were incubated with 90 mg/ml cycloheximide for 10 min, followed by trypsinization and harvest. Twenty million cells were resuspended in RSB (20 mM Tris-HCl, pH 7.4, 20 mM NaCl, 30 mM MgCl2, RNasin [Thermo, N8080119], 100 mg/ml heparin [Invitrogen, RP-43138], and 5 mg/ml cycloheximide). An equal volume of lysis buffer (1.2% Triton X-100 [BIOSHARP, 523287], 1.2% deoxycholate [Sigma-Aldrich, D5670]) was added on ice for 5 min. The nuclei and cell debris were removed by centrifugation for 3 min at 12,000 rpm. The supernatant was then diluted with an equal volume of dilution buffer (25 mM Tris-HCl, pH 7.4, 25 mM NaCl, 25 mM MgCl2, 0.05% Triton X-100, 500 mg/ml heparin), from which 0.4 ml extract was loaded onto 11.5 ml linear 10% to 50% sucrose (Sigma-Aldrich, V900116) gradients and centrifuged at 36,000 rpm for 2 h with a SW41 rotor (Beckman). Ten (1.2 ml each) fractions were collected with the BioComp piston gradient fractionator linked to an EM-1 UV Monitor (Bio-Rad). Fractions were incubated in 1% SDS and proteinase K (Invitrogen, QS0510) at 42°C for 30 min. RNA was purified from each fraction by phenol-chloroform extraction, followed by ethanol precipitation. PIK3C3, ATG12 or ACTB mRNA was detected by semi-quantitative RT-PCR. Meanwhile, mRNA from each fraction was subjected to RNA-sequencing analysis. Gene fraction shift represents the value of the marked fraction number with maximum target RNA minus that of the control group from sucrose density-gradient centrifugation. The marked numbers are equivalent to the collected fractions after gradient centrifuge, for instance, fraction 1 represents the top (10%) of the gradient, fraction 8 represents the bottom (50%) of the gradient. ACTB, GAPDH, TUBA/a-tubulin and G6PD mRNA were checked and used as negative controls for polyribosome profiling analysis.
Xenograft tumor models
Four-week-old female BALB/c nude mice were obtained from Guangdong Medical Laboratory Animal Center. Six nude mice in each group were individually and subcutaneously injected into the left and right sides of their armpit area with 4 × 10⁶ MCF-7 cells or 2 × 10⁶ MDA-MB-453 cells as indicated to examine the tumorigenicity in vivo. Once the tumor size reached 5 mm in diameter two weeks later, doxorubicin (5 mg/kg; Selleck, S1208) with or without CQ (20 mg/kg) was intraperitoneally injected once three days, 7 timed in total. Five weeks later, mice were executed and the tumors were harvested and analyzed. All mouse experiments were approved and conducted under a protocol of the Institutional Animal Care and Use Committee (IACUC) of Sun Yat-sen University.
Cell counting kit-8 (CCK8) assay
Cells were seeded into 96-well plates in triplicate (6000 cells per well) and cultured overnight. On the next day, cells were treated with 10 or 20 nM doxorubicin combined with or without 20 μM CQ in 100 μl media at the indicated period. CCK8 reagent (BB-4202-1, Best Bio) was then added to each well (10 μl per well) and incubated at 37°C for 2 h. The absorbance at 450 nm was measured by an enzyme-labeling instrument (GEN10S-BASIC, Tecan) and considered cell viability.
Anchorage-independent growth assay
Two thousand cells were trypsinized and suspended in 2 mL complete medium plus 0.3% agar (Sigma-Aldrich, 05040). The agar-cell mixture was plated on top of a 0.5% agar layer with a complete medium. Cells were treated with 10 or 20 nM doxorubicin with or without 20 μM CQ and 5 mM 3-methyladenine for 24 h, followed by continuously growing for another 18 to 25 days, viable colonies larger than 0.1 mm in diameter were counted. The experiment was carried out in triplicates.
Colony formation assay
Colony formation assay was initiated by seeding cells in 6-well plates. Cells were treated with doxorubicin or DMSO as control, combined with or without 20 μM CQ, 5 mM 3-MA for 24 h, followed by continuously growing in fresh medium without indicated concentrations of drugs for another 16 to 21 days. Colonies were fixed with 4% formaldehyde for 15 min and stained with 0.5% crystal violet for another 10 min. Colonies were counted under an inverted microscope.
Apoptosis analysis
The indicated MCF-7 or MDA-MB-453 cells were respectively treated with 10 nM doxorubicin for 12 h or with 20 nM for 24 h, combined with or without 20 μM CQ and 5 mM 3-MA. Cells were detached with 0.25% EDTA-free trypsin and washed with PBS, followed by APC-conjugated ANXA5/Annexin V and PI (KeyGEN BioTECH, KGA1017) staining for 20 min at room temperature in dark. These cells were then analyzed by flow cytometry (Beckman, Gallios).
Gene expression profiling and GSEA analysis
Analyses of human breast cancer data from The Cancer Genome Atlas (TCGA) data (https://portal.gdc.cancer.gov/projects/TCGA-BRCA), Kaplan Meier Plotter (https://kmplot.com/analysis/) and Gene Expression Omnibus (GEO) datasets, including GSE26304, GSE45827, GSE15852, GSE28784, GSE12791, GSE22796, GSE3929, GSE54326, GSE16070, GSE16080, GSE15043, GSE28415, GSE18912, GSE26459, GSE12708, GSE7390 and GSE1456 in the NCBI database (https://www.ncbi.nlm.nih.gov/geo/) were conducted. SH3BGRL expression was considered as a numeric variable. A continuous-type CLS file of the SH3BGRL expression to phenotype labels in GSEA was applied. The metric for ranking genes in GSEA was set as “Pearson”, and the other parameters were set to their default values. GSEA was performed using GSEA 2.0.9 software (http://www.broadinstitute.org/gsea/).
Statistical analysis
Statistical analyses were performed using GraphPad Prism 7. For comparison of two groups, P-values were calculated with a Student’s t-test. For comparison of more than two groups, P-values were calculated using the ANOVA test. The relationship between SH3BGRL, PIK3C3, or ATG12 expression or the clinicopathological characteristics was tested with the v2 test. Survival curves were plotted with the Kaplan–Meier method and compared by the log-rank test. Survival data were evaluated using univariate or multivariate Cox regression analysis. Bivariate correlations between variables were calculated using Spearman’s rank correlation coefficients. P < 0.05 was considered statistically significant in all cases.
Competing interests
Drs. Haihe Wang and Shulan Yang, researchers on the study team, are co-inventors on Patent 201710512823.6 (Sun Yat-sen University) which deals with the application of SH3BGRL as a diagnostic and therapy target. No other authors have competing interests.
Supplemental Material
Download Zip (7 MB)Disclosure statement
No potential conflict of interest was reported by the author(s).
Supplementary material
Supplemental data for this article can be accessed here.
Additional information
Funding
Related Research Data
References
- Bray F, Ferlay J, Soerjomataram I, et al. Global cancer statistics 2018: GLOBOCAN estimates of incidence and mortality worldwide for 36 cancers in 185 countries. CA Cancer J Clin. 2018;68(6):394–424.
- Holohan C, Van Schaeybroeck S, Longley DB, et al. Cancer drug resistance: an evolving paradigm. Nat Rev Cancer. 2013;13(10):714–726.
- Ahles TA, Saykin AJ. Candidate mechanisms for chemotherapy-indu-ced cognitive changes. Nat Rev Cancer. 2007;7(3):192–201.
- Gradishar W, Salerno KE. NCCN guidelines update: breast cancer. J Natl Compr Canc Netw. 2016;14:641–644.
- Nitiss JL. DNA topoisomerase II and its growing repertoire of biological functions. Nat Rev Cancer. 2009;9(5):327–337.
- Berger JM, Gamblin SJ, Harrison SC, et al. Structure and mechanism of DNA topoisomerase II. Nature. 1996;379(6562):225–232.
- Tacar O, Sriamornsak P, Dass CR, et al. Doxorubicin: an update on anticancer molecular action, toxicity and novel drug delivery systems. J Pharm Pharmacol. 2013;65(2):157–170.
- Meredith AM, Dass CR. Increasing role of the cancer chemotherapeutic doxorubicin in cellular metabolism. J Pharm Pharmacol. 2016;68(6):729–741.
- Wang C, Sun X, Wang K, et al. Breast cancer targeted chemotherapy based on doxorubicin-loaded bombesin peptide modified nanocarriers. Drug Deliv. 2016;23(8):26972702.
- Zhao Y, Huan ML, Liu M, et al. Doxorubicin and resveratrol co-delivery nanoparticle to overcome doxorubicin resistance. Sci Rep. 2016;6:35267.
- Kruh GD, Goldstein LJ. Doxorubicin and multidrug resistance. Curr Opin Oncol. 1993;5:1029–1034.
- Ferreira RJ, Dos Santos DJ, Ferreira MJ, et al. P-glycoprotein and membrane roles in multidrug resistance. Future Med Chem. 2015;7(7):929–946.
- Gottesman MM, Fojo T, Bates SE, et al. Multidrug resistance in cancer: role of ATP-dependent transporters. Nat Rev Cancer. 2002;2(1):48–58.
- International Transporter C, Giacomini KM, Huang SM, et al. Membrane transporters in drug development. Nat Rev Drug Discov 2010;9(3):215–236.
- Azarova AM, Lyu YL, Lin CP, et al. Roles of DNA topoisomerase II isozymes in chemotherapy and secondary malignancies. Proc Natl Acad Sci U S A. 2007;104(26):11014–11019.
- Bugg BY, Danks MK, Beck WT, et al. Expression of a mutant DNA topoisomerase II in CCRFCEM human leukemic cells selected for resistance to teniposide. Proc Natl Acad Sci USA. 1991;88:7654–7658.
- Bouwman P, Jonkers J. The effects of deregulated DNA damage signalling on cancer chemotherapy response and resistance. Nat Rev Cancer. 2012;12(9):587–598.
- Helleday T, Petermann E, Lundin C, et al. DNA repair pathways as targets for cancer therapy. Nat Rev Cancer. 2008;8(3):193–204.
- Pearl LH, Schierz AC, Ward SE, et al. Therapeutic opportunities within the DNAdamage response. Nat Rev Cancer. 2015;15(3):166–180.
- Singh SV, Nair S, Ahmad H, et al. Glutathione S-transferases and glutathione peroxidases in doxorubicin-resistant murine leukemic P388 cells. Biochem Pharmacol. 1989;38:3505–3510.
- Meijer C, Mulder NH, Timmer-Bosscha H, et al. Relationship of cellular glutathione to the cytotoxicity and resistance of seven platinum compounds. Cancer Res. 1992;52:6885–6889.
- Fernald K, Kurokawa M. Evading apoptosis in cancer. Trends Cell Biol. 2013;23(12):620–633.
- Rathore R, McCallum JE, Varghese E, et al. Overcoming chemotherapy drug resistance by targeting inhibitors of apoptosis proteins (IAPs). Apoptosis. 2017;22(7):898–919.
- Liu L, Yang M, Kang R, et al. DAMP-mediated autophagy contributes to drug resistance. Autophagy. 2011;7:112–114.
- Yan MM, Ni JD, Song D, et al. Interplay between unfolded protein response and autophagy promotes tumor drug resistance. Oncol Lett. 2015;10(4):1959–1969.
- Kumar A, Singh UK, Chaudhary A, et al. Targeting autophagy to overcome drug resistance in cancer therapy. Future Med Chem. 2015;7:1535–1542.
- Christowitz C, Davis T, Isaacs A, et al. Mechanisms of doxorubicin-induced drug resistance and drug resistant tumour growth in a murine breast tumour model. BMC Cancer. 2019;19(1):757.
- Aydinlik S, Erkisa M, Cevatemre B, et al. Enhanced cytotoxic activity of doxorubicin through the inhibition of autophagy in triple negative breast cancer cell line. Biochim Biophys Acta Gen Subj. 2017;1861(2):49–57.
- Abdel-Mohsen MA, Abdel Malak CA, El- Shafey ES, et al. Influence of copper (I) nicotinate complex and autophagy modulation on doxorubicin-induced cytotoxicity in HCC1806 breast cancer cells. Adv Med Sci. 2019;64(1):202–209.
- Gao M, Xu Y, Qiu L, et al. Sensitization of multidrug-resistant malignant cells by liposomes coencapsulating doxorubicin and chloroquine through autophagic inhibition. J Liposome Res. 2017;27(2):151–160.
- Guo B, Tam A, Santi SA, et al. Role of autophagy and lysosomal drug sequestration in acquired resistance to doxorubicin in MCF-7 cells. BMC Cancer. 2016;16(1). DOI:https://doi.org/10.1186/s12885-016-2790-3
- Liu Z, Shi A, Song D, et al. Resistin confers resistance to doxorubicin induced apoptosis in human breast cancer cells through autophagy induction. Am J Cancer Res. 2017 Mar 1;7(3):574–583.
- Wang Z, Liu Z, Wu S, et al. Long non-coding RNA CTA sensitizes osteosarcoma cells to doxorubicin through inhibition of autophagy. Oncotarget. 2017 May 9;8(19):31465–31477.
- Wang Z, Liu Z, Wu S, et al. Long non-coding RNA CTA sensitizes osteosarcoma cells to doxorubicin through inhibition of autophagy. Oncotarget. 2017 May 9;8(19):31465–31477.
- Xu XD, Zhao Y, Zhang M, et al. Inhibition of autophagy by deguelin sensitizes pancreatic cancer cells to doxorubicin. Int J Mol Sci. 2017;18(2):370.
- Codogno P, Mehrpour M, Proikas-Cezanne T, et al. Canonical and non-canonical autophagy: variations on a common theme of self-eating? Nat Rev Mol Cell Biol. 2011;13(1):7–12.
- Galluzzi L, Pietrocola F, Levine B, et al. Metabolic control of autophagy. Cell. 2014;159(6):1263–1276.
- Klionsky DJ, Abdalla FC, Abeliovich H, et al. Guidelines for the use and interpretation of assays for monitoring autophagy. Autophagy. 2012;8:445–544.
- Subramani S, Malhotra V. Non-autophagic roles of autophagy-related proteins. EMBO Rep. 2013;14(2):143–151.
- Levine B, Kroemer G. Autophagy in the pathogenesis of disease. Cell. 2008;132(1):27–42.
- Yang Z, Klionsky DJ. Eaten alive: a history of macroautophagy. Nat Cell Biol. 2010;12(9):814822.
- Lin L, Baehrecke EH. Autophagy, cell death, and cancer. Mol Cell Oncol. 2015;2(3):e985913.
- Glick D, Barth S, Macleod KF, et al. Autophagy: cellular and molecular mechanisms. J Pathol. 2010;221(1):3–12.
- White E. Deconvoluting the context-dependent role for autophagy in cancer. Nat Rev Cancer. 2012;12(6):401–410.
- Guo JY, Xia B, White E, et al. Autophagy-mediated tumor promotion. Cell. 2013;155(6):1216–1219.
- Das CK, Mandal M, Kogel D, et al. Pro-survival autophagy and cancer cell resistance to therapy. Cancer Metastasis Rev. 2018;37(4):749–766.
- Levy JMM, Towers CG, Thorburn A, et al. Targeting autophagy in cancer. Nat Rev Cancer. 2017;17(9):528–542.
- Li YJ, Lei YH, Yao N, et al. Autophagy and multidrug resistance in cancer. Chin J Cancer. 2017;36(1):52.
- Kim HJ, Lee SG, Kim YJ, et al. Cytoprotective role of autophagy during paclitaxel-induced apoptosis in Saos-2 osteosarcoma cells. Int J Oncol. 2013;42(6):1985–1992.
- Yang L, Yu Y, Kang R, et al. Up-regulated autophagy by endogenous high mobility group box-1 promotes chemoresistance in leukemia cells. Leuk Lymphoma. 2012;53(2):315–322.
- Yang C, Gao R, Wang J, et al. High-mobility group nucleosome-binding domain 5 increases drug resistance in osteosarcoma through upregulating autophagy. Tumour Biol. 2014;35(7):63576363.
- Amaravadi RK, Yu D, Lum JJ, et al. Autophagy inhibition enhances therapy-induced apoptosis in a Myc-induced model of lymphoma. J Clin Invest. 2007;117(2):326–336.
- Zhang Q, Si S, Schoen S, et al. Suppression of autophagy enhances preferential toxicity of paclitaxel to folliculin-deficient renal cancer cells. J Exp Clin Cancer Res. 2013 Dec 4;32(1):99.
- Sasaki K, Tsuno NH, Sunami E, et al. Chloroquine potentiates the anticancer effect of 5-fluorouracil on colon cancer cells. BMC Cancer. 2010;10:370.
- Xi G, Hu X, Wu B, et al. Autophagy inhibition promotes paclitaxel induced apoptosis in cancer cells. Cancer Lett. 2011;307(2):141–148.
- Yin L, Xiang Y, Zhu DY, et al. Crystal structure of human SH3BGRL protein: the first structure of the human SH3BGR family representing a novel class of thioredoxin fold proteins. Proteins. 2005;61(1):213–216.
- Cesareni G, Panni S, Nardelli G, et al. Can we infer peptide recognition specificity mediated by SH3 domains? FEBS Lett. 2002;513(1):38–44.
- Tong F, Zhang M, Guo X, et al. Expression patterns of SH3BGR family members in zebrafish development. Dev Genes Evol. 2016;226(4):287–295.
- Werner CJ, Heyny-von Haussen R, Mall G, et al. Proteome analysis of human substantia nigra in Parkinson’s disease. Proteome Sci. 2008;6:8.
- Van ‘T Veer LJ, Dai H, van de Vijver MJ, et al. Gene expression profiling predicts clinical outcome of breast cancer. Nature. 2002;415:530–536.
- Abba MC, Hu Y, Sun H, et al. Gene expression signature of estrogen receptor alpha status in breast cancer. BMC Genomics. 2005;6:37.
- Muniz Lino MA, Palacios-Rodriguez Y, Rodriguez-Cuevas S, et al. Comparative proteomic profiling of triple-negative breast cancer reveals that up-regulation of RhoGDI-2 is associated to the inhibition of caspase 3 and caspase 9. J Proteomics. 2014;111:198211.
- Li H, Zhang M, Wei Y, et al. SH3BGRL confers innate drug resistance in breast cancer by stabilizing HER2 activation on cell membrane. J Exp Clin Cancer Res. 2020;39:81.
- Majid SM, Liss AS, You M, et al. The suppression of SH3BGRL is important for v-Rel-mediated transformation. Oncogene. 2005;25:756–768.
- Xu L, Zhang M, Li H, et al. SH3BGRL as a novel prognostic biomarker is down-regulated in acute myeloid leukemia. Leuk Lymphoma. 2018;59:918–930.
- Wang H, Liu B, Al-Aidaroos AQ, et al. Dual-faced SH3BGRL: oncogenic in mice, tumor suppressive in humans. Oncogene. 2016;35:3303–3313.
- Klionsky DJ, Abdel-Aziz AK, Abdelfatah S, et al. Guidelines for the use and interpretation of assays for monitoring autophagy (4th edition)1. Autophagy. 2021 Jan;17(1):1–382.
- Nagaraj N, Wisniewski JR, Geiger T, et al. Deep proteome and transcriptome mapping of a human cancer cell line. Mol Syst Biol. 2011;7:548.
- Maier T, Guell M, Serrano L, et al. Correlation of mRNA and protein in complex biological samples. FEBS Lett. 2009;583:3966–3973.
- Coley HM, Amos WB, Twentyman PR, et al. Examination by laser scanning confocal fluorescence imaging microscopy of the subcellular localisation of anthracyclines in parent and multidrug resistant cell lines. Br J Cancer. 1993;67:1316–1323.
- Takagi M, Absalon MJ, McLure KG, et al. Regulation of p53 translation and induction after DNA damage by ribosomal protein L26 and nucleolin. CELL. 2005;123:49–63.