
ABSTRACT
Necrosis that appears at the ischemic distal end of random-pattern skin flaps increases the pain and economic burden of patients. Necroptosis is thought to contribute to flap necrosis. Lysosomal membrane permeabilization (LMP) plays an indispensable role in the regulation of necroptosis. Nonetheless, the mechanisms by which lysosomal membranes become leaky and the relationship between necroptosis and lysosomes are still unclear in ischemic flaps. Based on Western blotting, immunofluorescence, enzyme-linked immunosorbent assay, and liquid chromatography-mass spectrometry (LC-MS) analysis results, we found that LMP was presented in the ischemic distal portion of random-pattern skin flaps, which leads to disruption of lysosomal function and macroautophagic/autophagic flux, increased necroptosis, and aggravated necrosis of the ischemic flaps. Moreover, bioinformatics analysis of the LC-MS results enabled us to focus on the role of PLA2G4E/cPLA2 (phospholipase A2, group IVE) in LMP of the ischemic flaps. In vivo inhibition of PLA2G4E with an adeno-associated virus vector attenuated LMP and necroptosis, and promoted flap survival. In addition, microRNA-seq helped us determine that Mir504-5p was differentially expressed in ischemic flaps. A string of in vitro and in vivo tests was employed to verify the inhibitory effect of Mir504-5p on PLA2G4E, LMP and necroptosis. Finally, we concluded that the inhibition of PLA2G4E by Mir504-5p reduced LMP-induced necroptosis, thereby promoting the survival of random-pattern skin flaps.
Abbreviations: AAV: adeno-associated virus; ACTA2/α;-SMA: actin alpha 2, smooth muscle, aorta; ALOX15/12/15-LOX: arachidonate 15- lipoxygenase; c-CASP8: cleaved caspase; c-CASP3: cleaved caspase 3; CTSD: cathepsin D; CTSB: cathepsin B; CTSL: cathepsin L; DMECs: primary mouse dermal microvascular endothelial cells; ELISA: enzyme-linked immunosorbent assay; F-CHP: 5-FAM-conjugated collagen hybridizing peptide; FISH: fluorescence in situ hybridization; HUVECs: human umbilical vein endothelial cells; LAMP1: lysosomal-associated membrane protein 1; LAMP2: lysosomal-associated membrane protein 2; LC-MS: liquid chromatography-mass spectrometry; LDBF: laser doppler blood flow; LMP: lysosomal membrane permeabilization; LPE: lysophosphatidylethanolamine; LPC: lysophosphatidylcholine; MAP1LC3/LC3: microtubule-associated protein 1 light chain 3; MLKL: mixed lineage kinase domain-like; NDI: N-dodecylimidazole; PECAM1/CD31: platelet/endothelial cell adhesion molecule 1; PLA2G4A/cPLA2: phospholipase A2, group IVA (cytosolic, calcium-dependent); PLA2G4E/cPLA2: phospholipase A2, group IVE; qPCR: quantitative real-time polymerase chain reaction; RIPK1: receptor (TNFRSF)-interacting serine-threonine kinase 1; RIPK3: receptor-interacting serine-threonine kinase 3; RISC: RNA-induced silencing complex; ROS: reactive oxygen species; shRNA: short hairpin RNA; SQSTM1: sequestosome 1; TBHP: tert-butyl hydroperoxide; TUNEL: terminal deoxynucleotidyl transferase dUTP nick end labelling.
Introduction
Random-pattern skin flaps are one of the most commonly used techniques in the field of plastic and reconstructive surgery. Nevertheless, necrosis at the distal end of the flap greatly limits the flap length:width ratio. Ischemia is the main pathological condition that induces skin flap necrosis. Once the length to width ratio of the flap is beyond 1.5–2:1, the degree of ischemia will exceed the tolerance threshold of the skin tissue, then necrosis will occur [Citation1]. If we cannot intervene within a short period of time, ischemia of the flap will cause further damage, such as cell death, an inflammatory response, and strong oxidative stress damage after prolonged ischemia, ultimately leading to irreversible necrosis.
Macroautophagy/autophagy is a lysosome-dependent intracellular degradation pathway that plays a role in many diseases [Citation2–5]. For example, autophagy affects the survival ability of cells under stress and aids in resistance to the invasion of foreign pathogens, such as viruses [Citation6]. Previous studies have found that autophagy also increases tissue angiogenesis [Citation7,Citation8]. Consistently, our previous research revealed that autophagy in ischemic flaps is inhibited and that enhanced autophagic flux promotes flap survival by increasing angiogenesis [Citation9,Citation10]. These findings suggest that autophagy plays a role in a latent mechanism oriented toward the treatment of ischemic diseases. In addition, lysosomal dysfunction was observed in our previous experimental results. Lysosomes are membrane-surrounded acidic organelles that play a crucial role in maintaining cell function stability. Approximately 70 types of acid hydrolases are found in the lysosome at the center of the intracellular degradation pathway, and abundant membrane proteins and accessory proteins make the lysosome a platform for the transmission of various signals [Citation11]. Therefore, lysosomal dysfunction will cause severe cell dysfunction and even cell death. Previous studies have revealed that lysosomal dysfunction, especially an increase in lysosomal membrane permeability, is an important pathological mechanism in many diseases [Citation12,Citation13]. The increased permeability of the lysosomal membrane not only disrupts the function of the lysosome but also causes damage to other organelles in the cell due to detachment of hydrolases from the lysosome cavity. However, the mechanisms that affect the integrity of lysosomal membranes under pathological conditions are still poorly understood.
Since phospholipids account for most of the membrane composition, phospholipases are always attractive in the study of biological membranes. There are six types of the group IV phospholipase A2 family, including PLA2G4A/cPLA2 (phospholipase A2, group IVA (cytosolic, calcium-dependent)), PLA2G4B/cPLA2 (phospholipase A2, group IVB (cytosolic)), PLA2G4C/cPLA2 (phospholipase A2, group IVC (cytosolic, calcium-independent)), PLA2G4D/cPLA2 (phospholipase A2, group IVD), PLA2G4E/cPLA2 (phospholipase A2, group IVE) and PLA2G4F/cPLA2 (phospholipase A2, group IVF) [Citation14]. Previous studies have shown that PLA2G4A and PLA2G4E are mainly related to lysosome function [Citation15–18]. Both PLA2G4A and PLA2G4E cleave the sn-2 position of glycerophospholipids, releasing arachidonic acid and lysophospholipids [Citation19]. Arachidonic acid mediates the occurrence of inflammation, while lysophospholipids remain in the lysosome membrane and cause the permeability of the lysosome membrane to increase [Citation19–21]. However, neither the changes in PLA2G4A and PLA2G4E, and the lipid composition of lysosomal membranes nor the manner in which destruction of lysosomal integrity affects cell survival have been elucidated in random-pattern skin flaps. According to our preliminary results, Mir504-5p, one of the top 10 significantly reduced microRNAs in ischemic flaps, was potentially related to PLA2G4E. So, we focused our attention on the role of PLA2G4E in ischemic flaps.
In addition, the condition of lysosomes seems to affect the occurrence of necroptosis. Necroptosis is a recently discovered proinflammatory cell programmed death pathway, and its elucidation has caused us to speculate that necrosis might take place in a regulated manner. As the key molecules of necroptosis, RIPK1 (receptor (TNFRSF)-interacting serine-threonine kinase 1), RIPK3 (receptor-interacting serine-threonine kinase 3) and MLKL (mixed lineage kinase domain-like) undergo a series of phosphorylation cascades after a cell receives a death signal [Citation22]. Finally, phosphorylation of MLKL will cause MLKL oligomerization and transfer to the membrane, inducing rupture of the cell membrane [Citation23,Citation24]. Previous studies have shown that impaired autophagic flux caused by ischemia activates necroptosis, and as key players in autophagic flux, lysosomes remove MLKL from the cell membrane through their degradation function, thereby inhibiting necroptosis [Citation25,Citation26]. Moreover, recent studies have suggested that changes in lysosomal membrane permeability play an indispensable role in necroptosis [Citation27,Citation28]. These findings led us to speculate whether damage to lysosomal function in skin flaps causes an increase in necroptosis.
The role of microRNAs in normal physiological functions and disease processes has attracted much attention. Recently, microRNAs have been introduced as important players in disease processes [Citation29–32]. microRNAs are 18–21 base pair noncoding small RNAs that regulating the expression levels of target genes by promoting mRNA degradation or inhibiting mRNA transcription [Citation33,Citation34]. Accumulated evidence has demonstrated the precise targeting and effective inhibition of target genes by microRNAs, which suggests that they may have great potential in preventing skin flap necrosis [Citation35,Citation36]. However, there is still a lack of detailed studies on the functions of microRNAs in skin flaps. Here, we carried out experiments to explore the possible mechanism underlying skin flap necrosis. Specifically, we sought to determine (1) whether lysosomal membrane permeabilization (LMP)-induced necroptosis is an important factor affecting the survival of random-pattern skin flaps; (2) whether LMP, the main form of lysosome damage in skin flaps, is caused by PLA2G4E; and (3) whether microRNA has the potential to inhibit PLA2G4E and become an effective treatment to improve skin flap survival.
Results
Lysosomal dysfunction was associated with necroptosis in ischemic flaps
Autophagy is a lysosome-dependent degradation pathway, and the delivery of autophagosomes to lysosomes is a key step in completing autophagy [Citation37]. Therefore, lysosomes are an important part of the autophagy process. To further understand the changes in lysosomal function in ischemic flaps, we extracted the tissue proteins in area I and area II of flaps and evaluated the proteins related to lysosomal function via Western blotting. showed that the protein levels of lysosomal markers (LAMP2 [lysosomal-associated membrane protein 2], CTSD [cathepsin D], CTSB [cathepsin B], and CTSL [cathepsin L]) in area II were significantly decreased compared with area I. In the late stage of autophagic flux, lysosomes are fused with autophagosomes for degradation; disorder of lysosomal function is always accompanied by the disruption of autophagic flux, so the condition of autophagic flux is an important indicator of lysosomal function [Citation38]. Our results showed that the levels of autophagosomal protein MAP1LC3/LC3 (microtubule-associated protein 1 light chain 3) and autophagy substrate proteins (UB [ubiquitin] and SQSTM1 [sequestosome 1]) were increased significantly in area II. Immunofluorescence staining further confirmed the above results. ) showed that the number of LC3 II puncta and the integrated intensity of SQSTM1 in area II were significantly increased. These results indicated that autophagic flux and lysosomal function were disrupted in ischemic flaps.
Figure 1. Lysosomal dysfunction was associated with necroptosis in ischemic flaps. (A) LAMP2, c-CTSD (cleaved CTSD), sc-CTSB (single-chain CTSB), sc-CTSL (single-chain CTSL), UB, SQSTM1 and LC3 protein levels in the skin from area I and area II on postoperative day 7. (B) Quantification of the expression levels of lysosome- and autophagy-related proteins in the skin from both areas. Data are expressed as the means ± SEM (n = 6). (C) Immunofluorescence staining of LC3-II and SQSTM1 in the skin from area I and area II on postoperative day 7. Scale bars: 10 μm. (D) Comparison of the number of LC3-II puncta in each cell of the dermal layer between area I and area II; comparison of the integrated intensity of SQSTM1 in the dermal layer between area I and area II. Data are expressed as the means ± SEM (n = 6). (E) RIPK1, p-RIPK1, RIPK3, p-RIPK3, MLKL, p-MLKL, CASP8 and c-CASP8 protein levels in the skin from area I and area II on postoperative day 7. (F) Quantification of the expression levels of necroptosis-related proteins in the skin from both areas. Data are expressed as the means ± SEM (n = 6). (G) Immunofluorescence staining to detect p-RIPK3 in the skin from both areas on postoperative day 7. Scale bars: 10 μm. (H) Comparison of the integrated intensity of p-RIPK3 in the dermal layer between both areas. Data are expressed as the means ± SEM (n = 6). Significance: *p < 0.05.
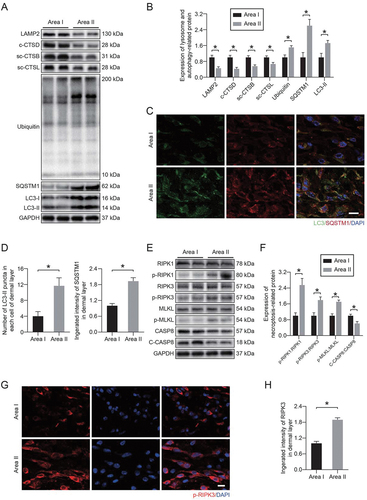
We also detected necroptotic proteins in area I and area II. Our results showed that the phosphorylation level of necroptotic proteins was higher in area II compared with area I, and the activity of CASP8 (caspase 8), which has an inhibitory effect on necroptosis, was reduced in area II (). Immunofluorescence staining was also performed. showed that the integrated intensity of phosphorylated RIPK3 was significantly increased in area II. In addition, we applied specific detection methods to evaluate the vitality of different areas of the flap. We observed a dramatic reduction in the number of PECAM1/CD31 (platelet/endothelial cell adhesion molecule 1)-ACTA2/α-SMA (actin alpha 2, smooth muscle, aorta)-positive vessels in area II (Fig. S1A-B). Furthermore, the degree of collagen damage (determined by 5-FAM-conjugated collagen hybridizing peptide [F-CHP] staining) and cell death (determined by terminal deoxynucleotidyl transferase dUTP nick end labeling [TUNEL]) were significantly increased in area II (Fig. S1C-F). These results suggested a potential link between necroptosis and lysosomal function in ischemic flaps.
LMP induced lysosomal dysfunction, autophagic flux disruption and necroptosis in ischemic flaps
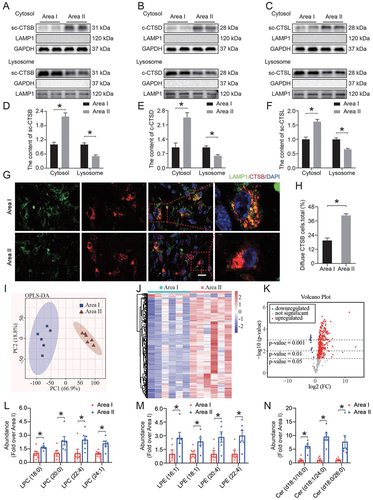
Compared with area I, a higher content of lysosomal enzymes in the cytosolic fractions from area II was observed, which was accompanied by a decrease in the enzyme content in the lysosomal fractions (). Immunofluorescence co-staining of CTSB and LAMP1 (lysosomal-associated membrane protein 1) showed that CTSB appeared more diffuse and had fewer puncta in area II compared with area I (). The leakage of lysosomal enzymes into the cytosol indicated that LMP occurred in ischemic flaps. We then prepared lysosome-enriched fractions from area I and area II to analyze the lipid composition of lysosomal membranes using liquid chromatography-mass spectrometry (LC-MS). Complete lipids were extracted from the lysosome-enriched fraction and subjected to LC-MS analysis. As shown in , according to multivariate and univariate analyses, our observations revealed a significant difference between area I and area II. In area II, 464 specific lipids showed differences in abundance compared to area I. Furthermore, several classes of lysophospholipids (lysophosphatidylcholine [LPC] and lysophosphatidylethanolamine [LPE]) were significantly increased in area II (). On the other hand, a significant increase in ceramides was observed in area II (). This indicated that the increase in lysophospholipids decomposed from the lysosomal membrane might be an important cause of LMP in ischemic flaps.
Figure 2. LMP induced lysosomal dysfunction, autophagic flux disruption and necroptosis in ischemic flaps. (A-C) Protein levels of (A) sc-CTSB, (B) c-CTSD and (C) sc-CTSL in the cytoplasm and lysosomes extracted from the skin of area I and area II. (D-F) Quantification of the protein levels of (D) sc-CTSB, (E) c-CTSD and (F) sc-CTSL in the cytoplasm and lysosomes extracted from the skin. (G) Immunofluorescence staining of LAMP1 and CTSB in the skin from area I and area II on postoperative day 7. Scale bars: 10 μm. (H) Comparison of the ratio of diffuse CTSB cells in the dermal layer between the two areas. Data are expressed as the means ± SEM (n = 6). (I) Orthogonal Projections to Latent Structures Discriminant Analysis (OPLS-DA) plot comparing area I and area II in positive ion mode UPLC-HDMS demonstrating separation of the data from both areas. (J) Heatmap demonstrating the distinct abundance features of area I and area II data. (K) Volcano plot highlighting features that demonstrated p < 0.05, p < 0.01 and p < 0.001 when comparing area II to area I. (L-N) Comparison of the abundance of (L) LPC, (M) LPE and (N) ceramide between the two areas. Data are presented as the means ± SEM (n = 6). Significance: *p < 0.05.
N-dodecylimidazole (NDI) is a widely used LMP inducer [Citation39,Citation40]. It’s pharmacological mechanism is that NDI produces surfactant properties and destroys the lysosomal membrane after being protonated and captured in a low pH environment [Citation41]. To further verify the relationship between necroptosis and LMP, we applied NDI to destroy the lysosomal membrane and detected changes in necroptosis. The results, which were consistent with our hypothesis, were presented in Fig. S2A-D. When LMP was increased under the effect of NDI, both autophagic flux disruption and necroptosis were significantly increased (Fig. S2A-D). Furthermore, after NDI treatment, the necrotic area of the skin flap increased significantly, accompanied by a significant decrease in blood supply (Fig. S2E-H). All of these findings suggested that increased LMP aggravated lysosomal dysfunction, autophagic flux disruption and necroptosis in the ischemic area, thereby further aggravating flap necrosis.
Activated PLA2G4E increased LMP and exacerbated necroptosis in ischemic flaps
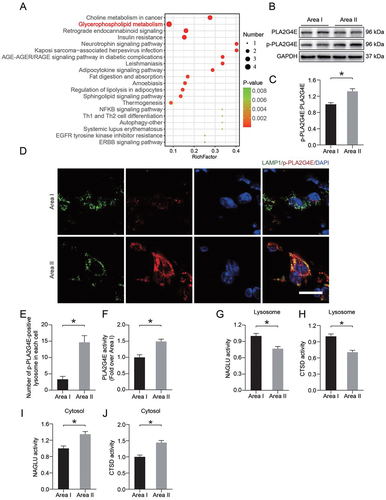
The accumulation of PLA2 products (LPC and LPE) and PLA2 activators (ceramides) led us to speculate that increased lysosomal membrane permeability after ischemia injury might occur through activation of PLA2s (). KEGG pathway mapper revealed significant changes in glycerophospholipid metabolism (). These results led us to detect the activity of PLA2G4E. Using Western blotting, we observed an increase in the PLA2G4E phosphorylation level in area II compared with area I (). Immunofluorescence staining showed a higher level of p-PLA2G4E colocalization with the lysosomal marker LAMP1 in injured area II (). The activity of PLA2G4E detected by enzyme-linked immunosorbent assay (ELISA) was significantly increased in area II (). In addition, we also measured the activity of the lysosomal enzymes CTSD and NAGLU (alpha-N-acetylglucosaminidase (Sanfilippo disease IIIB)) via ELISA. As shown in , we observed that the activities of both enzymes in the lysosomes in area II were significantly decreased compared with those in area I. Moreover, dramatically higher activity of both enzymes was observed in the cytosolic fractions from area II than area I (). These changes suggested that PLA2G4E was activated in lysosomes following ischemic injury in ischemic flaps, which might mediate LMP.
Figure 3. PLA2G4E might induce LMP in the ischemic flap. (A) Pathway analysis showing the top 20 pathways involved in differences between area I and area II. (B) PLA2G4E and p-PLA2G4E protein levels in the skin from both areas on postoperative day 7. (C) Quantification of the phosphorylation level of PLA2G4E in the skin. Data are presented as the means ± SEM (n = 6). (D) Immunofluorescence staining of LAMP1 and p-PLA2G4E in the skin from both areas on postoperative day 7. Scale bars: 10 μm. (E) Comparison of the number of p-PLA2G4E-positive lysosomes in each cell of the dermal layer between area I and area II. Data are expressed as the means ± SEM (n = 6). (F) ELISA results showing the activity of PLA2G4E in the skin from both areas on postoperative day 7. Data are expressed as the means ± SEM (n = 6). (G-J) ELISA results of the activity of lysosomal enzymes (H and J) CTSD and (G and I) NAGLU in lysosomal and cytosolic fractions extracted from the skin of both areas on postoperative day 7. Data are expressed as means ± SEM (n = 6 per group). Significance: *p < 0.05.
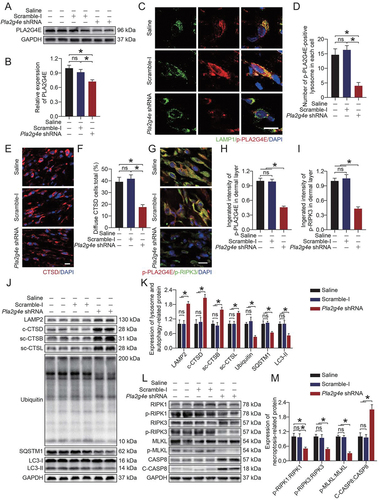
To further verify the role of PLA2G4E in ischemic flaps, we employed a Pla2g4e short hairpin RNA (shRNA) adeno-associated virus (AAV) vector for knockdown of PLA2G4E. As shown in ), AAV-Pla2g4e shRNA injection significantly decreased the PLA2G4E expression level relative to that in the Saline and AAV-scramble-I groups. As revealed by immunofluorescence staining, AAV-Pla2g4e shRNA injection suppressed the activation of PLA2G4E at the lysosome (). Next, we explored whether PLA2G4E inhibition restores lysosomal function and inhibits necroptosis. As shown in ), in comparison to the Saline and AAV-scramble-I groups, CTSD staining appeared less diffuse and more puncta in the AAV-Pla2g4e shRNA group. Moreover, after AAV-Pla2g4e shRNA injection, the co-expression of p-PLA2G4E and p-RIPK3 in area II was significantly reduced (). Western blotting demonstrated that AAV-Pla2g4e shRNA injection restored the levels of lysosomal proteins (LAMP2, CTSD, CTSB, CTSL) and inhibited necroptosis (). The reduction in LC3-II, UB and SQSTM1 indicated an increase in autophagic flux, which further confirmed the reduction of LMP (. We also performed experiments on the skin tissues of area I. Our results showed that AAV-Pla2g4e shRNA injection reduced the expression of PLA2G4E in area I but had no significant effect on LMP and necroptosis (Fig. S3A-K). Considering that CASP8 is also involved in apoptosis occurrence, we performed relevant experiments to determine the effect of PLA2G4E on apoptosis in ischemic flaps. As shown in Fig. S4A-B, after AAV-Pla2g4e shRNA injection, the levels of cleaved (c)-CASP3 (caspase 3) and BAX (BCL2-associated X protein) were decreased, and that of BCL2 (B cell leukemia/lymphoma 2) was increased. Consistently, immunofluorescence staining of c-CASP3 showed that the integrated intensity of c-CASP3 decreased significantly after injection of AAV-Pla2g4e shRNA (Fig. S4C-D). These results indicated that the apoptosis level in ischemic flaps was depressed via the mitochondrial apoptosis pathway after PLA2G4E inhibition.
Figure 4. Activated PLA2G4E increased LMP and exacerbated necroptosis in ischemic flaps. (A) PLA2G4E protein levels in the skin from the saline, AAV-scramble-I and AAV-Pla2g4e shRNA groups on postoperative day 7. (B) Quantification of optical density values of PLA2G4E in each group. Data are presented as the mean ± SEM (n = 6). (C) Immunofluorescence staining of LAMP1 and p-PLA2G4E in the skin from area II in each group on postoperative day 7. Scale bars: 10 μm. (D) Comparison of the number of p-PLA2G4E-positive lysosomes in each cell of the dermal layer among the three groups. Data are expressed as the means ± SEM (n = 6). (E) Immunofluorescence staining of CTSD in the skin from area II in each group on postoperative day 7. Scale bars: 10 μm. (F) Comparison of the ratio of diffuse CTSD cells in the dermal layer among the three groups. Data are expressed as the means ± SEM (n = 6). (G) Immunofluorescence staining of p-PLA2G4E and p-RIPK3 in the skin from area II in each group on postoperative day 7. Scale bars: 10 μm. (H) Comparison of the integrated intensity of p-PLA2G4E in the dermal layer among the three groups. Data are expressed as the means ± SEM (n = 6). (I) Comparison of the integrated intensity of p-RIPK3 in the dermal layer among the three groups. Data are expressed as the means ± SEM (n = 6). (J) LAMP2, c-CTSD, sc-CTSB, sc-CTSL, UB, SQSTM1 and LC3 protein levels in the skin from area II in each group on postoperative day 7. (K) Quantification of the expression levels of lysosome- and autophagy-related proteins in the skin from area II in each group. Data are expressed as the means ± SEM (n = 6). (L) RIPK1, p-RIPK1, RIPK3, p-RIPK3, MLKL, p-MLKL, CASP8 and c-CASP8 protein levels in the skin from area II in each group on postoperative day 7. (M) Quantification of optical density values of necroptosis-related proteins in the skin from area II in each group. Data are expressed as the means ± SEM (n = 6). Significance: *p < 0.05.
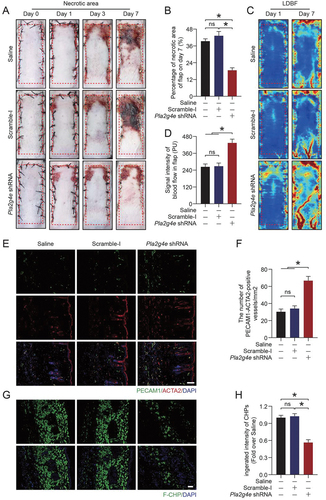
Next, we used digital photos to record the survival of the flaps in different periods. As shown in , AAV-Pla2g4e shRNA injection significantly increased the survival area of the flap. Laser doppler blood flow (LDBF) imaging was used to monitor the blood flow in the flap. We observed that the AAV-Pla2g4e shRNA group had a better blood supply (). Consistently, immunofluorescence staining of PECAM1 and ACTA2 showed better angiogenesis in the AAV-Pla2g4e shRNA group (). F-CHP staining indicated that AAV-Pla2g4e shRNA injection effectively promoted the remodeling of skin collagen (). Overall, these findings suggested that PLA2G4E at the lysosome was activated after ischemic injury, mediated LMP and exacerbated necroptosis, eventually causing skin flap necrosis.
Figure 5. Activated PLA2G4E hindered the survival of random-pattern skin flaps. (A) Photograph of random-pattern skin flaps on mice treated with saline, AAV-scramble-I or AAV-Pla2g4e shRNA at different times (0, 1, 3 and 7 days after surgery). (B) Comparison of the survival area among the three groups on postoperative day 7. Data are expressed as the means ± SEM (n = 6). (C) LDBF of random-pattern skin flaps on mice at 1 and 7 days after surgery in each group. (D) Comparison of signal intensity of blood flow in random-pattern skin flaps among the three groups on postoperative day 7. Data are expressed as the means ± SEM (n = 6). (E) Immunofluorescence staining of PECAM1 and ACTA2 in the skin from area II in each group on postoperative day 7. Scale bars: 100 μm. (F) Comparison of the density of PECAM1-ACTA2-positive blood vessels among the three groups. Data are expressed as the means ± SEM (n = 6). (G) F-CHP staining for the detection of damaged collagen in the skin from area II in each group on postoperative day 7. Scale bars: 100 μm. (H) Comparison of the integrated intensity of F-CHP among the three groups. Data are expressed as the means ± SEM (n = 6). Significance: *p < 0.05.
PLA2G4E induced necroptosis via increased LMP in ischemic flaps
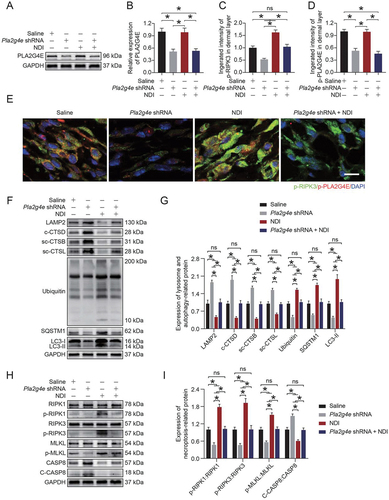
To further determine the relationship between PLA2G4E, LMP, and necroptosis in the ischemic flaps, we carried out a rescue assay comparing a Saline group, Pla2g4e shRNA group, NDI group, and NDI + Pla2g4e shRNA group. As shown in ), NDI treatment did not cause changes in PLA2G4E expression in saline-treated mice, while AAV-Pla2g4e shRNA injection significantly inhibited PLA2G4E expression in saline-treated mice with or without NDI treatment. We next performed immunofluorescence co-staining of p-PLA2G4E and p-RIPK3 in cells in the dermis of skin flaps. The results showed that the co-expression of p-PLA2G4E and p-RIPK3 decreased in the AAV-Pla2g4e shRNA group compared with the Saline group, and NDI treatment increased the level of p-RIPK3 and had no effect on the level of p-PLA2G4E in saline-treated mice; in addition, compared with the Saline group, the co-treatment of NDI and AAV-Pla2g4e shRNA in saline-treated mice did not cause significant changes in the expression of p-PLA2G4E and p-RIPK3 (). Furthermore, Western blotting was applied to detect the expression of related proteins of autophagic flux, LMP and necroptosis. Compared with the Saline group, NDI inhibited autophagic flux, exacerbated necroptosis and increased LMP in the ischemic flaps in saline-treated mice, while the AAV-Pla2g4e shRNA injection partially offseted the adverse effects of NDI; compared with the Saline group, AAV-Pla2g4e shRNA injection enhanced autophagic flux, depressed necroptosis and decreased LMP in the ischemic flaps in saline-treated mice, while the NDI-treatment partially offseted the beneficial effects of the AAV-Pla2g4e shRNA injection; no significant differences were observed between the Saline group and the NDI + Pla2g4e shRNA group (). Together, these results demonstrated that PLA2G4E induced necroptosis by increasing LMP in ischemic flaps.
Figure 6. PLA2G4E induced necroptosis via increased LMP in ischemic flaps. (A) PLA2G4E protein levels in the skin from area II of the saline, AAV-Pla2g4e shRNA, NDI and AAV-Pla2g4e shRNA + NDI groups on postoperative day 7. (B) Quantification of the optical density values of PLA2G4E in each group. Data are expressed as the mean ± SEM (n = 6). (C) Comparison of the integrated intensity of p-PLA2G4E in the dermal layer among the four groups. Data are expressed as the means ± SEM (n = 6). (D) Comparison of the integrated intensity of p-RIPK3 in the dermal layer among the four groups. Data are expressed as the means ± SEM (n = 6). (E) Immunofluorescence staining of p-PLA2G4E and p-RIPK3 in the skin from area II in each group on postoperative day 7. Scale bars: 10 μm. (F) LAMP2, c-CTSD, sc-CTSB, sc-CTSL, UB, SQSTM1 and LC3 protein levels in the skin from area II in each group on postoperative day 7. (G) Quantification of the expression levels of lysosome- and autophagy-related proteins in the skin from area II in each group. Data are expressed as the means ± SEM (n = 6). (H) RIPK1, p-RIPK1, RIPK3, p-RIPK3, MLKL, p-MLKL, CASP8 and c-CASP8 protein levels in the skin from area II in each group on postoperative day 7. (I) Quantification of the optical density values of necroptosis-related proteins in the skin from area II in each group. Data are expressed as the means ± SEM (n = 6). Significance: *p < 0.05.
Mir504-5p downregulated Pla2g4e by directly targeting the 3’-UTR.
We next wanted to find an effective treatment to inhibit PLA2G4E. As an emerging therapeutic approach, microRNAs attracted our attention. MicroRNAs accurately and effectively inhibit target genes. In this study, RNA was isolated from skin flaps (area I and area II), and microRNA-seq was carried out. As shown in , we identified 63 differentially expressed microRNAs. Among them, 20 microRNAs were reduced in the ischemic area. Through analysis and database comparison, we identified the 10 microRNAs with the most significant reduction and found that Mir504-5p might specifically target Pla2g4e ().
Figure 7. Mir504-5p downregulated Pla2g4e by directly targeting the 3’-UTR. (A) Heatmap showing differentially expressed microRNAs between area I and area II on postoperative day 7. (B) Relative expression level of Mir504-5p in area I and area II on postoperative day 7. Data are presented as the mean ± SEM (n = 5). (C) FISH assay of Mir504-5p in DMECs without any treatment. Scale bars: 20 μm. (D-E) Luciferase reporter assay and comparison of the relative luciferase activity in DMECs treated with Pla2g4e-WT, Pla2g4e-MUT, Mir-NC or Mir504-5p mimic for 48 h. Data are presented as the mean ± SEM (n = 6). (F) Immunoprecipitation of RISC in DMECs overexpressing Mir-NC or Mir504-5p with the Pan-AGO2 antibody. IgG was employed as a negative control, and ACTB was employed as an internal control. (G) Relative mmu-Mir504-5p incorporation into RISC in DMECs overexpressing Mir-NC or Mir504-5p. Data are presented as the mean ± SEM (n = 6). (H) Relative Pla2g4e incorporation into RISC in DMECs overexpressing Mir-NC or Mir504-5p. Data are presented as the mean ± SEM (n = 6). Significance: *p < 0.05.
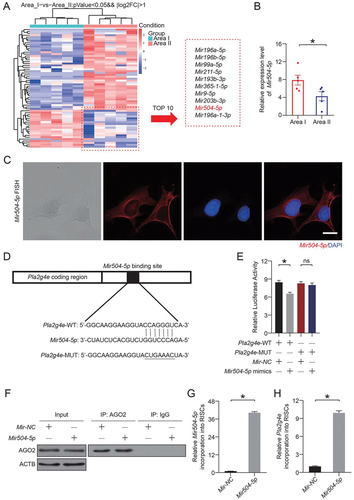
For in-depth verification of the targeting effect exerted by Mir504-5p and to determine whether Mir504-5p truly inhibits Pla2g4e, we carried out the following experiments. Fluorescence in situ hybridization (FISH) assays were performed, and the results revealed that Mir504-5p was expressed in the cytoplasm (), indicating that Mir504-5p may bind to cytoplasmic mRNA. WT and MUT 3′-UTR sequences of Pla2g4e were constructed (). Then, a luciferase reporter assay was performed in transfected primary mouse dermal microvascular endothelial cells (DMECs). The relative luciferase activity was significantly decreased when Mir504-5p was upregulated and cells were cotransfected with the Pla2g4e WT luciferase construct, but not with the MUT construct (). RNA-ChIP analysis was utilized to detect Pla2g4e mRNA abundance in the RNA-induced silencing complex (RISC) following overexpression of Mir504-5p (). Higher levels of Pla2g4e, which was incorporated into RISC, were observed in Mir504-5p-overexpressing cells (). According to the above results, Pla2g4e acted as a target gene of Mir504-5p.
Overexpression of Mir504-5p suppressed PLA2G4E and protected the function of HUVECs
To further verify the effect of Mir504-5p on cell function stimulated by oxidative stress, we designed and produced a Mir504-5p mimic. Tert-Butyl hydroperoxide (TBHP) was used to create an oxidative stress environment, and the appropriate TBHP concentration (35 μM) was determined through a Cell Counting Kit-8 (CCK-8) experiment (Fig. S5A). Dihydroethidium (DHE) staining showed obvious oxidative stress damage in the THBP treatment group (Fig. S5B-C).
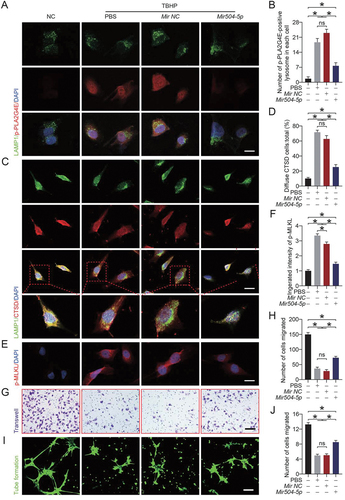
Then, we applied the Mir504-5p mimic to overexpress Mir504-5p. As shown in , Mir504-5p effectively inhibited the activation of PLA2G4E (). CTSD staining was less diffuse after Mir504-5p mimic treatment (). These findings suggested that Mir504-5p protected lysosomes from LMP. Moreover, immunofluorescence staining of p-MLKL showed that when lysosome integrity was maintained, necroptosis was significantly reduced (). We also detected the viability of human umbilical vein endothelial cells (HUVECs) through cell migration assays and in vitro angiogenesis (tube formation) assays. As shown in , more migrating cells were observed in the Mir504-5p mimic group. Consistently, compared with the PBS and Mir-NC groups, the Mir504-5p mimic significantly improved the angiogenesis of HUVECs (). Altogether, the results indicated that Mir504-5p overexpression inhibited PLA2G4E activation, protected lysosomes from LMP, and inhibited necroptosis and maintained cell viability.
Figure 8. Overexpression of Mir504-5p suppressed PLA2G4E and protected the function of HUVECs. (A) Immunofluorescence staining of LAMP1 and p-PLA2G4E in HUVECs exposed to different treatments for 24 h (NC, TBHP, TBHP + Mir-NC or TBHP + Mir504-5p mimic). Scale bars: 20 μm. (B) Comparison of the number of p-PLA2G4E-positive lysosomes in each HUVEC among the four groups. Data are expressed as the means ± SEM (n = 6). (C) Immunofluorescence staining of LAMP1 and CTSD in HUVECs exposed to different treatments for 24 h (NC, TBHP, TBHP + Mir-NC or TBHP + Mir504-5p mimic). Scale bars: 20 μm. (D) Comparison of the ratio of diffuse CTSD cells (refer to HUVECs) among the four groups. Data are expressed as the means ± SEM (n = 6). (E) Immunofluorescence staining of p-MLKL in HUVECs exposed to different treatments for 24 h (NC, TBHP, TBHP + Mir-NC or TBHP + Mir504-5p mimic). Scale bars: 20 μm. (F) Quantification of the integrated intensity of p-MLKL in HUVECs. Data are expressed as the means ± SEM (n = 6). (G) Cell migration assays were performed on HUVECs after 24 h of different treatments (NC, TBHP, TBHP + Mir-NC or TBHP + Mir504-5p mimic), and the presented results were obtained after 12 h of culture. Scale bars: 200 μm. (H) Quantification and analysis of the number of migrated cells (refer to HUVECs). Data are expressed as the means ± SEM (n = 6). (I) An in vitro angiogenesis (tube formation) assay was performed on HUVECs after 24 h of different treatments (NC, TBHP, TBHP + Mir-NC or TBHP + Mir504-5p mimic), and the presented results were obtained after 6 h of culture. Scale bars: 200 μm. (J) Quantification and analysis of tube length (pixels; ×104). Data are expressed as the means ± SEM (n = 6). Significance: *p < 0.05.
Overexpression of Mir504-5p suppressed PLA2G4E, stabilized the lysosomal membrane and inhibited necroptosis in vivo
Next, our intention was to verify the function of Mir504-5p in vivo. We designed and synthesized a Mir504-5p-up AAV vector. Successful transfection with the Mir504-5p-up AAV vector was verified by quantitative real-time polymerase chain reaction (qPCR). Fig. S6A showed that injection of the Mir504-5p-up AAV vector significantly increased the level of Mir504-5p. qPCR results also indicated that the level of Pla2g4e was significantly reduced after Mir504-5p-up AAV vector treatment (Fig. S6B). These results demonstrated that upregulating Mir504-5p in vivo effectively reduced the level of Pla2g4e.
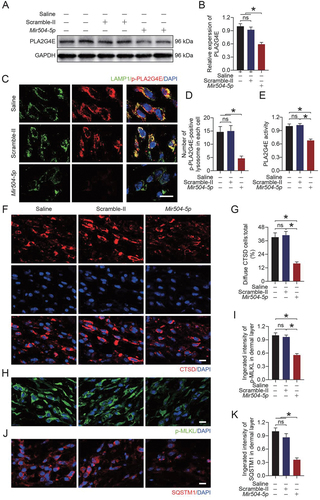
Immunofluorescence and Western blotting results were consistent with the above results. As shown in , Mir504-5p significantly inhibited the expression of PLA2G4E. Immunofluorescence staining indicated that the activation of PLA2G4E (p-PLA2G4E) was significantly reduced (). ELISA results revealed that the activity of PLA2G4E was lower in the AAV-Mir504-5p-up group (). However, in area I of flaps, our results showed that AAV-Mir504-5p-up inhibited PLA2G4E expression but did not affect LMP or necroptosis (Fig. S7A-H). Immunofluorescence staining of CTSD revealed more puncta in the AAV-Mir504-5p-up group (). This confirmed that Mir504-5p alleviated the LMP by inhibiting PLA2G4E expression. Conversely, overexpression of Mir504-5p resulted in inhibition of necroptosis (). Simultaneously, autophagic flux was enhanced, reflected by the level of SQSTM1 (). Western blotting was also performed to detect related markers. We found that after AAV-Mir504-5p-up injection in the ischemic flaps, the stability of the lysosomal membrane was increased, autophagic flux was restored (Fig. S8A-B), and necroptosis was inhibited (Fig. S8C-D).
Figure 9. Overexpression of Mir504-5p suppressed PLA2G4E, stabilized the lysosomal membrane and inhibited necroptosis in vivo. (A) Western blotting to detect the PLA2G4E expression levels in the skin from area II in the saline, AAV-scramble-II and AAV-Mir504-5p-up groups on postoperative day 7. (B) Quantification of the optical density values of PLA2G4E in each group. Data are expressed as the mean ± SEM (n = 6). (C) Immunofluorescence staining of LAMP1 and p-PLA2G4E in the skin from area II in each group on postoperative day 7. Scale bars: 10 μm. (D) Comparison of the number of p-PLA2G4E-positive lysosomes in each cell of the dermal layer among the three groups. Data are expressed as the means ± SEM (n = 6). (E) ELISA results showing the activity of PLA2G4E in the skin from area II in each group on postoperative day 7. Data are expressed as the means ± SEM (n = 6). (F) Immunofluorescence staining of CTSD in the skin from area II in each group on postoperative day 7. Scale bars: 10 μm. (G) Comparison of the ratio of diffuse CTSD cells in the dermal layer among the three groups. Data are expressed as the means ± SEM (n = 6). (H) Immunofluorescence staining of p-MLKL in the skin from area II in each group on postoperative day 7. Scale bars: 10 μm. (I) Quantification of the integrated intensity of p-MLKL in the dermal layer. Data are expressed as the means ± SEM (n = 6). (J) Immunofluorescence staining of SQSTM1 in the skin from area II in each group on postoperative day 7. Scale bars: 10 μm. (K) Quantification of the integrated intensity of SQSTM1 in the dermal layer. Data are expressed as the means ± SEM (n = 6). Significance: *p < 0.05.
On day 7, we observed better flap survival in the AAV-Mir504-5p-up group (Fig. S9A-B). LDBF imaging consistently showed a better blood supply after AAV-Mir504-5p-up injection (Fig. S9C-D). Furthermore, immunofluorescence staining of PECAM1 and ACTA2 was applied to visualize blood vessels. As shown in Fig. S9E-F, better angiogenesis was observed in the AAV-Mir504-5p-up group. F-CHP staining and TUNEL assays were applied to detect the degree of collagen damage and cell death. Consistently, there was less collagen damage and cell death in the AAV-Mir504-5p-up group (Fig. S9G-J). Considering these data, Mir504-5p effectively inhibited PLA2G4E expression, alleviated LMP and necroptosis and promoted flap survival.
Discussion
Skin transplantation is an important procedure to solve large-scale skin defects in the clinic. However, ischemic injury caused by surgery is inevitable. If not handled properly, the oxidative stress damage, cell death and inflammatory response caused by ischemia will induce severe necrosis. Our present study provided novel evidence indicating that PLA2G4E played an important role in LMP following ischemia in random-pattern skin flaps (a type of flap commonly used in skin transplantation). In ischemic flaps, we found that PLA2G4E caused changes in the lysosomal membrane composition (more lysophospholipids) and that LMP induced by lysophospholipids was responsible for lysosomal dysfunction, autophagic flux disruption, and subsequent exacerbation of necroptosis. Furthermore, we found that Mir504-5p effectively inhibited PLA2G4E expression, which might be an effective treatment for regulating PLA2G4E in ischemic flaps. More importantly, we showed that modulation of PLA2G4E had profound impacts on the outcomes of ischemic flaps in our animal model, suggesting that PLA2G4E might be a promising therapeutic target for ischemic flaps.
The role of autophagy in flap survival was demonstrated in our previous studies [Citation9,Citation10]. Lysosomes, which complete the autophagy process by fusing with autophagosomes, are an important part of the intracellular degradation pathway. The lysosome not only contains a large number of enzymes required for life activities but also has abundant signaling proteins on its membrane surface, including transcription factors that regulate lysosome biogenesis, such as transcription factor EB and transcription factor E3, as well as mammalian target of rapamycin [Citation42]. However, few studies have focused on impaired lysosomal dysfunction and its functional definition in the field of ischemic flaps. In the current study, we found that the expression of proteins related to lysosomal function in area II of the ischemic flap was significantly decreased compared with area I. Lysosomes are an important part of autophagic flux and the disruption of autophagic flux reflects impaired lysosome function. In the study, the substrate proteins SQSTM1 and UB were significantly increased in area II. Moreover, the level of LC3 II also rose significantly. These data indicated that there was disorder of lysosomal function in ischemic flaps, and it was accompanied by disruption of autophagic flux.
LMP is an important form of lysosomal damage and can be induced by an intralysosomal fenton reaction, reactive oxygen species (ROS) and other cellular stresses [Citation43]. Lysosome leakage not only causes loss of lysosomal functionality but also results in release of protons and ROS that directly destroy intracellular components. Moreover, cathepsins released from lysosomes induce lysosome-mediate cell death, such as necroptosis [Citation44]. Here, we hypothesized that LMP plays an important role in lysosomal dysfunction in ischemic flaps. Our results demonstrated that more cathepsins penetrated into the cytoplasm in area II compared with area I, while the cathepsins in the lysosome were significantly reduced. Through laser confocal microscopy, we found that LAMP1 (a lysosomal marker protein) and CTSB colocalized less in area II. These results suggested that LMP was presented in ischemic flaps and caused loss of lysosomal function.
PLA2G4E is an important phospholipase that hydrolyzing glycerophospholipids from the sn-2 position and releasing lysophospholipids and arachidonic acid (which mediates inflammation) [Citation45,Citation46]. Lysophospholipids have detergent-like characteristics and have the ability to directly cause lysosomal membrane rupture [Citation47–49]. However, few studies have focused on PLA2G4E-mediated LMP in ischemic flaps. In our study, to clarify the mechanism of LMP, we applied LC-MS to analyze the lipid composition of the separated lysosomal membranes from area I and area II, and the results of the lipid analysis brought PLA2G4E into our field of view and aroused our interest. We found that the proportion of lysophospholipids in the lysosomal membrane components in area II was significantly increased compared with that in area I. According to prior research, cPLA2 reasonably functions under the activation of various factors, including ROS and ceramide [Citation50–53]. Ischemic injury undoubtedly provides a large amount of ROS for activation of cPLA2. Simultaneously, lipid analysis showed that compared with area I, ceramide was also significantly increased in area II of ischemic flaps. Furthermore, increased PLA2G4E expression was observed in area II, and we found that LAMP1 (a lysosomal marker protein) and p-PLA2G4E (activated PLA2G4E) colocalized under laser confocal microscopy. Our AAV-Pla2g4e shRNA experiments showed that reduced PLA2G4E reduced LMP and promoted the survival of ischemic flaps. Thus, PLA2G4E-mediated LMP was the culprit of lysosomal dysfunction in ischemic flaps.
Necroptosis refers to a form of controllable necrosis that is dependent on RIPK1, RIPK3 and MLKL. Through necrosomes, MLKL is phosphorylated and mediates necroptosis by forming pores in the cell membrane. Necrosis is the main complication after flap operations, and for a long time, it has been considered an unregulated and uncontrollable process [Citation37]. The discovery of necroptosis changed the traditional understanding of cell death and provided attractive targets to avoid unwanted cell death. Importantly, a previous study found that calcium, ceramide, cPLA2 and LMP are important inducers of necroptosis [Citation44]. A previous study has shown that the release of contents caused by increased lysosomal permeability is an important stimulating factor for necroptosis [Citation37]. Lysosomes have also been found to inhibit necroptosis occurrence by degrading necroptotic proteins [Citation54]. However, few studies have focused on necroptosis in the field of ischemic flaps. In the current study, we found that compared with area I, the phosphorylation level of necroptosis-related proteins was significantly increased in area II. In addition, we used NDI to aggravate LMP in our animal model, and the results demonstrated that necroptosis was further aggravated after NDI treatment and that AAV-Pla2g4e shRNA injection alleviated necroptosis occurrence. These results indicated that PLA2G4E-mediated LMP induced necroptosis in ischemic flaps. Regarding the controversy concerning the inducer of necroptosis, our work provides valuable evidence that necroptosis was mediated by PLA2G4E-induced LMP in flaps after ischemia. Various types of cells, such as endothelial cells, adipose cells, fibroblasts, and neutrophils (which infiltrate during inflammation), are present in the dermis of mammalian skin. It would be very good to know which cell type is the first to undergo necroptosis, this knowledge would allow us to better understand the pathological process in ischemic flaps. Previous studies have found that ischemia-reperfusion trigger neurovascular necroptosis in the central nervous system, which leads to secondary damage to other cell types [Citation55]. Our current study is still unable to provide an answer, but this will be a good research direction in the future using advanced technologies, such as single-cell sequencing and spatial transcriptomics. In our study, we showed that activation of necroptosis occurred in a cell-autonomous manner (i.e., cells with Mir504-5p-mediated PLA2G4E activation exhibited LMP and subsequent necroptosis). Previous studies have also found that increased free-radical levels and HSPA/HSP70 (heat shock protein family A (Hsp70)) have the ability to provoke LMP [Citation56,Citation57]. Thus, necroptosis may be caused in a noncell-autonomous manner. Perhaps the accumulation of intracellular ROS or HSPA under stress exceeds the ability of cells to compensate for clearance, then destroys the lysosomal membrane, which leads to LMP and causes cells to undergo necroptosis. The occurrence of necroptosis in ischemic flaps may be in this noncell-autonomous manner as well, which needs further study. In addition, we observed that the level of c-CASP8 increased significantly after PLA2G4E inhibition. CASP8 is a cysteine protease that triggers apoptosis in response to the activation of cell surface death receptors, such as FAS (Fas (TNF receptor superfamily member 6)), TNFRSF10B/TRAIL-R2 (tumor necrosis factor receptor superfamily, member 10b) and TNFRSF1A/TNF-R1 (tumor necrosis factor receptor superfamily, member 1a) [Citation58]. In the current study, our results showed that the levels of c-CASP3 and BAX were decreased and that of BCL2 was increased after PLA2G4E inhibition. These results suggested that, although CASP8 was activated after PLA2G4E inhibition, the apoptosis level was depressed via the mitochondrial apoptosis pathway. Regarding the mechanism by which PLA2G4E may affect mitochondrial apoptosis, further research is needed.
MicroRNAs, 18–21 base pair noncoding small RNAs, have been studied extensively in recent years and have become a well-targeted treatment in some fields [Citation59–61]. Because of their precise targeting ability and effective silencing of target genes, microRNAs have attracted much attention. However, their involvement in ischemic flaps is poorly defined. Considering our results that inhibition of PLA2G4E expression reduced LMP and necroptosis, the ability of microRNAs to silence genes had aroused our interest. We used microRNA-seq to analyze the expression of microRNAs in random-pattern skin flaps. The analysis results showed that compared with area I, 63 types of microRNAs were differentially expressed in area II, including 20 that showed decreased expression. By comparison with an online database of microRNA targets, we found that Mir504-5p (a microRNA that was significantly decreased in ischemic skin flaps) might be able to target Pla2g4e. The results of the RNA immunoprecipitation assay and luciferase reporter assay confirmed that Mir504-5p directly targeted Pla2g4e. FISH experiments revealed that Mir504-5p was expressed in the cytoplasm. We also designed and constructed a Mir504-5p-up AAV vector to overexpress Mir504-5p in vivo. Our results showed that Mir504-5p inhibited PLA2G4E in vivo, thereby promoting flap survival.
To the best of our knowledge, we are the first to provide valuable evidence that PLA2G4E induced LMP in flaps after ischemia, which further induced necroptosis. We also demonstrated that Mir504-5p exerted an inhibitory effect on PLA2G4E. Interestingly, recent research on circular RNAs has attracted much attention. Since circular RNAs contain abundant microRNA binding sites, they are used as a “molecular sponge” of microRNAs to regulate the expression of target genes [Citation62]. Therefore, circular RNAs may also play an important role in ischemic flaps. In view of the fact that we have verified the role of Mir504-5p, further research is needed to determine whether there is a circular RNA that regulating Mir504-5p. In addition, a previous study has reported that oxymatrine effectively inhibits the activity of cPLA2 [Citation63]. As a classic inhibitor of cPLA2, AACOCF3 has been used as the standard inhibitor for cPLA2 research [Citation64]. However, whether these inhibitors are also effective for PLA2G4E in ischemic flaps are still unknown. Moreover, recent studies have found that ALOX15/12/15-LOX (arachidonate 15-lipoxygenase) also effectively regulates the activity of cPLA2. On the one hand, ALOX15 directly phosphorylates MAPK14/p38 (mitogen-activated protein kinase 14) and then activates cPLA2 by phosphorylating the Ser505 site in cPLA2; on the other hand, ALOX15 induces an influx of calcium ions in cells, and due to the high concentration in the cells, calcium ions bind to the C2 domains of p-cPLA2 and cPLA2, which in turn causes the transport of both from the cytoplasm to the lysosomal membrane to destroy the membrane structure [Citation65,Citation66]. These findings indicate that regulating this signaling pathway may be an important treatment option to inhibit PLA2G4E-induced LMP. Thus, future evaluations of pharmacological PLA2G4E inhibitors or modulators of PLA2G4E-related pathways should be performed in ischemic flaps. While the current study focused on LMP-induced necroptosis, other types of programmed cell death, such as ferroptosis and pyroptosis, are also affected by LMP [Citation67]. Our findings regarding PLA2G4E, LMP, necroptosis and autophagic flux also apply to ferroptosis and pyroptosis in ischemic flaps should be further verified. Overall, we think that the current work provided a vital supplement to the field of PLA2G4E treatment, which will likely be an important cornerstone of clinical trials in the future.
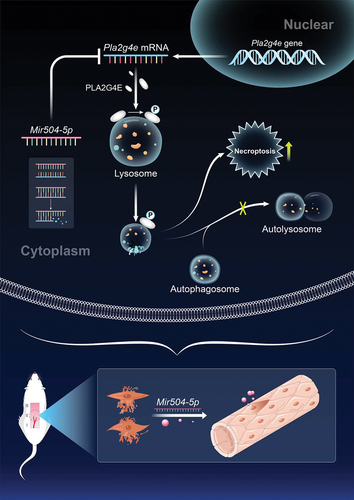
In conclusion, our study found that in ischemic flaps, lysosomal function and autophagic flux were disrupted, and necroptosis was aggravated. We also demonstrated that LMP was the culprit in causing lysosomal dysfunction and necroptosis in ischemic flaps and that the changes in the lipid composition of the lysosomal membrane mediated by PLA2G4E caused the occurrence of LMP. Moreover, our results indicated that Mir504-5p effectively inhibited PLA2G4E expression in the ischemic condition. Thus, we proposed that the suppression of PLA2G4E by Mir504-5p to depress LMP-mediated necroptosis might be a promising treatment for postoperative ischemic flap necrosis ().
Figure 10. Schematic illustration of the suggested molecular mechanism highlighting the roles of PLA2G4E/cPLA2, Mir504-5p, LMP, autophagy and necroptosis in the pathophysiology of skin flap necrosis and subsequent increased flap survival.
Materials and methods
Random-pattern skin flap model
Wenzhou Medical University’s Experimental Animal Center (License no. SCXK [ZJ] 2015–0001) provided adult C57BL/6 J mice (male, average weight 20–30 g). All animal experiments performed in this study followed the Guide for Care and Use of Laboratory Animals of the China National Institutes of Health, based on the approval of the Animal Care and Use Committee of Wenzhou Medical University (wydw2019-0729). One percent (w/v) pentobarbital sodium (50 mg/kg) was intraperitoneally injected into the mice for anesthesia. After depilation, a random-pattern skin flap (1.5 cm × 4.5 cm) was placed on the mouse back, and both sacral arteries were sectioned. Then, 4–0 silk was applied to suture the flap in situ.
As shown in Fig. S10, the flap was averagely divided into three areas from its distal part to the pedicle in the following order: area I, area II, and area III. As mentioned in the introduction, once the length to width ratio of the flap is beyond 1.5–2:1, necrosis will occur in the skin tissue. So, in our experiment, on postoperative day 7, area I is normally healthy, and area III is normally necrotic without intervention. area II, on the other hand, is usually ischemic and tending toward necrosis. To promote flap survival, area II was used as the watershed area at which therapies are targeted to inhibit ischemia and potential necrosis. Moreover, tissues from area I and area II were usually compared in the differences of pathological mechanisms, so as to find potential targets to reduce the ischemic injury. Therefore, area I and area II were selected for histological and molecular biological examination.
Groups and treatments
C57BL/6 J mice (n = 35) that did not receive any treatment after flap surgery were euthanized on the 7th day, and the skin of area I and area II was collected for functional comparison. Other C57BL/6 J (n = 156) mice were randomly divided into three parts. Part 1: C57BL/6 mice were randomly divided into a Saline group (n = 6) and NDI group (n = 6). NDI (C15H28N2, HPLC > 95%; S72183) was purchased from Yuanyebio. After surgery, mice in the NDI group were given 100 µL of NDI (100 mg/kg/day) in saline by oral gavage, while mice in the saline group were given an equal volume of saline with the same protocol. Part 2: C57BL/6 mice were randomly divided into a Saline group (n = 12), NDI group (n = 12), AAV-Pla2g4e shRNA group (n = 12) and AAV-Pla2g4e shRNA + NDI group (n = 12). Twenty-eight days prior to flap surgery, mice in the AAV-Pla2g4e shRNA group and AAV-Pla2g4e shRNA + NDI group received 18 µL viral vectors in Saline with 5 × 10⁹ packaged genomic particles via subcutaneous injections in 3 areas using a microsyringe. The saline group was given an equal volume of saline using the same protocol. After surgery, mice in the NDI group and AAV-Pla2g4e shRNA + NDI group were given 100 µL of NDI (100 mg/kg/day) by oral gavage, while mice in the saline group and AAV-Pla2g4e shRNA group were given 100 µL of saline by oral gavage daily. Part 3: C57BL/6 mice were randomly divided into a Saline group (n = 24), AAV-scramble-I group (for the Pla2g4e shRNA group; n = 12), AAV-Pla2g4e shRNA group (n = 12), AAV-scramble-II group (for the Mir504-5p-up group; n = 24), and AAV-Mir504-5p-up group (n = 24). Twenty-eight days prior to flap surgery, mice in the AAV-scramble-I group (for the Pla2g4e shRNA group), AAV-Pla2g4e shRNA group, AAV-scramble-II group (for the Mir504-5p-up group) and AAV-Mir504-5p-up group received 18 µL viral vectors in saline with 5 × 10⁹ packaged genomic particles using the same protocol described for part 2. The saline group was given an equal volume of saline using the same protocol. For subsequent detections, mice were euthanized on day 7, and tissue samples (0.5 cm × 0.5 cm) from area I and area II of the flaps were collected, as shown in Figure S10.
AAV vector packaging
AAV-Pla2g4e shRNA (mouse Pla2g4e) and AAV-Mir504-5p-up (mouse Mir504-5p) were constructed and packaged by GeneChem Chemical Technology Co., Ltd. (Shanghai, China). The detailed protocols were performed as published in the article [Citation9,Citation68]. The titers of AAV-Pla2g4e shRNA, AAV-scramble-I (for AAV-Pla2g4e shRNA), AAV-Mir504-5p-up, and AAV-scramble-II were 2.32 × 10¹³, 2.4 × 10¹², 7.82 × 10¹², and 8.76 × 10¹² genomic copies per mL, respectively, determined by qPCR.
Immunohistochemistry
Mouse skin tissues were fixed with 4% paraformaldehyde. After dehydration, the tissue was embedded in paraffin and cut into 4-μm sections. In every IF study, xylene was used to deparaffinize the sections. The deparaffinized tissue was rehydrated, and antigen retrieval was performed in sodium citrate buffer. Sections cooled to room temperature were blocked with 3% BSA (Beyotime, ST025) in PBS (Procell, PB180327) containing 0.2% Triton X-100 (Aladdin, T109027). Then, sections were incubated overnight with primary antibodies at 4°C. The next day, the sections were incubated with secondary antibodies for 1 h at room temperature. Nuclei were stained with DAPI. The primary antibodies employed targeted LC3B (Cell Signaling Technology, 3868), p-RIPK3 (Abcam, ab205421), PECAM1 (Affinity, AF6191), ACTA2 (Proteintech, 67,735-1-Ig), CTSB (Abcam, ab214428), LAMP1 (Santa Cruz Biotechnology, sc-20,011), p-PLA2G4E (antibody against p-PLA2G4E was prepared by Dia-An Biotech, Inc., in Wuhan, China), CTSD (Abcam, ab75852), p-MLKL (Affinity, AF3902), and SQSTM1 (Abcam, ab56416). The secondary antibodies used included goat polyclonal secondary antibody to rabbit IgG – H&L (DyLight® 488; Abcam, ab96883), goat anti-mouse IgG H&L (DyLight® 488; Abcam, ab96871), goat anti-mouse IgG H&L (DyLight® 594; Abcam, ab96873), and goat anti-rabbit IgG H&L (DyLight® 594; Abcam, ab96885). Antibody against AGO2 (2897S) was purchased from Cell Signaling Technology. The TUNEL experiment was conducted on frozen skin sections using an In Situ Cell Death Detection Kit, Fluorescein (Millipore Sigma, 11,684,795,910) according to the manufacturer’s protocol. F-CHP (3Helix Inc., FLU300) was employed to detect skin collagen damage according to the manufacturer’s protocol.
Immunocytochemistry
HUVECs cultured on glass coverslips were fixed with 4% paraformaldehyde, permeabilized with 0.1% Triton X-100 in PBS (Procell, PB180327) for 5 min and blocked with 10% goat serum (Beyotime, C0265) in PBS for 1 h. Coverslips were incubated overnight with primary antibodies at 4°C and then incubated with secondary antibodies in blocking solution for 1 h at room temperature. Nuclei were stained with DAPI. The primary antibodies used targeted LAMP1 (Santa Cruz Biotechnology, sc-20,011), p-PLA2G4E (antibody against p-PLA2G4E was prepared by Dia-An Biotech, Inc., in Wuhan, China), CTSD (Abcam, ab75852), and p-MLKL (Affinity, AF3902). The secondary antibodies used included goat anti-mouse IgG H&L (DyLight® 488) and goat anti-rabbit IgG H&L (DyLight® 594).
Subcellular fractionation and preparation of lysosome-enriched fractions
Approximately 100 mg of skin tissue was collected and homogenized on ice with a Dounce tissue grinder. Lysosomal fractions were obtained from tissue homogenates via differential centrifugation in accordance with the protocol of the manufacturer (Lysosome Enrichment Kit for Tissue and Cultured Cells; Thermo Fisher Scientific, 89,839), and the resulting supernatant fractions were collected as cytosolic fractions. Isolated lysosomes were stored at −80°C for further research.
Western blotting
Tissue samples (5 mm × 5 mm) from area I or of the same volume from area II of the flaps were dissected and homogenized in ice-cold RIPA lysis solution (Beyotime, P0013B) supplemented with protease inhibitor cocktail (Sigma-Aldrich, P8340) and phosphatase inhibitor cocktail III (Sigma-Aldrich, P0044). Homogenates were centrifuged at 20,000 g for 30 min at 4°C to collect the tissue lysate. The protein concentration was measured using a Pierce BCA Protein Assay Kit (Thermo Fisher Scientific, 23,225). Thirty micrograms of protein were run on 4–22% SDS-PAGE gels, and the proteins were transferred onto PVDF membranes (Millipore). Membranes were blocked with 5% skim milk (BD Biosciences, 232,100), followed by application of primary antibodies at 4°C for 12 h; then, the membranes were incubated with HRP-conjugated secondary antibodies (Proteintech, SA00001-1, SA00001-2, SA00001-3, SA00001-15) at room temperature for 2 h. Protein bands were detected with an Omni-ECL Pico Light Chemiluminescence Kit (EpiZyme, SQ201) and visualized using a ChemiDoc mechanism (Bio-Rad). Image Lab software (Bio-Rad) was employed to analyze the bands. Primary antibodies against the following proteins were used in this study: RIPK1 (Cell Signaling Technology, 3493), p-RIPK1 (Cell Signaling Technology, 53,286), RIPK3 (Cell Signaling Technology, 95,702), p-RIPK3 (Cell Signaling Technology, 91,702), MLKL (Cell Signaling Technology, 37,705), p-MLKL (Abcam, ab196436), CASP8 (Cell Signaling Technology, 4790), c-CASP8 (Cell Signaling Technology, 8592), LAMP2 (Abcam, ab13524), CTSD (Abcam, ab75852), CTSB (Abcam, ab214428), CTSL (R&D Systems, AF1515), SQSTM1 (Abcam, ab56416), UB (Cell Signaling Technology, 3936S), LC3B (Cell Signaling Technology, 3868), GAPDH (Cell Signaling Technology, 5174), LAMP1 (Santa Cruz Biotechnology, sc-20,011), PLA2G4E (Proteintech, 18,088-1-AP), and p-PLA2G4E (antibody against p-PLA2G4E was prepared by Dia-An Biotech, Inc., Wuhan, China). The secondary antibodies employed were goat anti-mouse IgG (H + L), HRP conjugate (Proteintech, SA00001-1), goat anti-rabbit IgG (H + L), HRP conjugate (Proteintech, SA00001-2), donkey anti-goat IgG (H + L), HRP conjugate (Proteintech, SA00001-3), goat anti-rat IgG (H + L), and HRP conjugate (Proteintech, SA00001-15).
LC-MS
Chemicals: All chemicals and solvents were analytical or HPLC grade. Water (W5-4), methanol (A452-4), acetonitrile (A998-4) and isopropanol (A451-4) were purchased from Thermo Fisher Scientific. Ammonium formate (540–69-2) and chloroform (67–66-3) were from Titan Chemical Reagent Co., Ltd. L-2-chlorophenylalanine (C2001) was from HC Biotech.
Sample Preparation: 600 μL of methanol:water (1:1, v:v) were added to each sample, then transformed to a 4 mL glass vial, 20 μL of L-2-Chlorophenylalanine (0.3 mg/mL) dissolved in methanol as internal standard. 600 μL of chloroform were added to each aliquot, dispersing sample by pipette. Using ultrasonic homogenizer to breaking up the lysosomes for 6 min at 500 W. All of the mixtures of each sample were transferred to 10 mL sharp bottom glass centrifuge tube, extracted by ultrasonication for 10 min in ice-water bath, then placed at 4°C for 30 min prior to decanting of 600 μL of subnatant to sample vials. 600 μL chloroform:methanol (2:1, v:v) was added into the residue samples, samples vortexed for 30 s, extracted by ultrasonic for 10 min in ice-water bath, then placed at 4°C for 30 min prior to decanting of subnatant to sample vials. Combined two subnatants and mixed well. Then the mixed subnatant was dried under a nitrogen stream and re-dissolved in 300 μL of isopropanol:methanol (1:1, v:v), vortexed for 30 s and extracted by ultrasonic for 3 min in ice-water bath, then transferred to 1.5-mL microcentrifuge tubes, and then centrifuged at 15,866 x g and 4°C for 10 min prior to decanting of supernatant to sample vials. QC samples were prepared by mixing aliquot of all samples to be a pooled sample.
LC-MS Analysis: A Dionex Ultimate 3000 RS UHPLC fitted with Q-Exactive quadrupole-Orbitrap mass spectrometer equipped with heated electrospray ionization (ESI) source (Thermo Fisher Scientific, Waltham, MA, USA) was used to analyze the metabolic profiling in both ESI positive and ESI negative ion modes. An ACQUITY UPLC BEH C18 column (1.7 μm, 2.1 × 100 mm) were employed in both positive and negative modes. The binary gradient elution system consisted of (A) acetonitrile:water (60:40, v:v, containing 10 mmol/L ammonium formate) and (B) acetonitrile:isopropanol (10:90, v:v, containing 10 mmol/L ammonium formate) and separation was achieved using the following gradient: 0 min, 5% B; 0.5 min, 5% B; 2 min, 43% B; 2.1 min, 52% B; 8.5 min, 53% B; 8.6 min,75% B; 14 min, 90% B; 14.5 min, 100% B; 15.5 min, 100% B; 15.7 min, 5% B and 18 min, 5% B. The flow rate was 0.4 mL/min and column temperature was 60°C. All the samples were kept at 4°C during the analysis. The injection volume was 5 μL. Positive: Heater Temp 350°C, Sheath Gas Flow rate 50 arb, Aux Gas Flow Rate 15 arb, Sweep Gas Flow Rate 1 arb, spray voltage 3.8 kV, Capillary Temp 320°C, S-Lens RF Level 75%. MS1 scan ranges: 135–2000. Negative: Heater Temp 350°C, Sheath Gas Flow rate 50 arb, Aux Gas Flow Rate 15 arb, Sweep Gas Flow Rate 1 arb, spray voltage 3.0 kV, Capillary Temp 320°C, S-Lens RF Level 75%. MS1 scan ranges: 135–2000. The QCs were injected at regular intervals throughout the analytical run to provide a set of data from which repeatability can be assessed.
Determination of flap survival area
Macroscopic behaviors, such as the flap shape and formation and the color and hair condition, were observed and recorded on a daily basis. On postoperative day 7, the percentage of flap survival area was assessed in high-quality images by employing Image-Pro Plus software (ver. 6.0; Media Cybernetics, Silver Spring, MD, USA). The percentage of flap survival area was calculated using the formula below: % Survival = Survival area ÷ Total area × 100%.
LDBF imaging
LDBF was applied to visualize the blood supply and vascular network of the flap in this study. After anesthesia, the mice were placed in a safe and quiet environment. Then, the blood supply and small vessels of the flap were measured using a laser Doppler instrument (Moor Instruments, Axminster, UK). Blood flow, estimated by perfusion units (PU), was calculated with moorLDI Review software (ver. 6.1; Moor Instruments). Each mouse underwent measurement 3 times, and the average value was used for in-depth statistical analysis.
ELISA
The activity of PLA2G4E (EIAab, E6978m), CTSD (EIAab, E1280m) and NAGLU (MSKBIO, KT-22858) were detected by using ELISA kits according to the manufacturer’s protocols. The optical density of the samples for quantification of PLA2G4E, CTSD and NAGLU was read by a microplate reader at 550 nm with a correction wavelength of 450 nm.
MicroRNA-seq
RNA extraction and library construction: The extraction of total RNA was conducted using a mirVana microRNA Isolation Kit (Ambion, AM1561) in accordance with the manufacturer’s protocol. Quantification of total RNA was carried out using a Nanodrop 2000 spectrophotometer (Thermo Fisher Scientific Inc., USA). RNA integrity was assessed with an Agilent 2100 Bioanalyzer (Agilent Technology, USA). One microgram of total RNA from every sample was applied to small RNA library construction using TruSeq Small RNA Sample Prep Kits (NEB, E7850L) according to the suggestions of the manufacturer. Library quality was estimated on the Agilent Bioanalyzer 2100 system with DNA High Sensitivity Chips. The libraries were subjected to final sequencing on an Illumina HiSeq X Ten platform. The generation of 150 bp paired-end reads was achieved. Small RNA sequencing and analysis were implemented by OE Biotech Co., Ltd. (Shanghai, China).
Bioinformatic analysis: Basic reads were converted into sequence data (also called raw data/reads) via base calling. Low-quality reads were filtered, and the reads with 5ʹ primer contaminants and poly (A) met the removal criteria. For reads with no 3ʹ adapter or insert tag, reads shorter than 15 nt or longer than 41 nt were filtered out of the raw data, and clean reads were obtained. In terms of primary analysis, the length distribution featured by the clean sequences in the reference genome was decided. rRNAs, tRNAs, small nuclear RNAs (snRNAs), and other explanations were given to noncoding RNAs as annotations. Following alignment, these RNAs were then subjected to a Bowtie search in Rfam v.10.1 (http://www.sanger.ac.uk/software/Rfam). The selected microRNAs were searched against the miRBase v22 database (http://www.mirbase.org/). Analysis of the recognized microRNA expression patterns featured by different samples was performed. Going forward, analysis of unannotated reads was performed with mirdeep2, aiming to forecast novel microRNAs. In accordance with the hairpin structure of a pre-microRNA and the miRBase database, identification of the corresponding microRNA star sequence and microRNA mature sequence was conducted. Calculation and filtering of differentially expressed microRNAs was performed based on a threshold p value < 0.05. Comparatively, the P value, which was determined based on the DEG algorithm in the R package derived from experiments with biological replicates, was also based on the Audic Claverie statistic for experiments with no biological replicates. The targets of differentially presented microRNAs were forecasted depending on miRanda software for animals based on the following parameters: S ≥ 150, ΔG ≤ −30 kcal/mol, with a demand for strict 5ʹ seed pairing. In addition, TargetFinder was applied to microRNA target prediction in plants.
Cell culture and treatments
HUVECs were obtained from the Molecular Pharmacology Research Center, School of Pharmaceutical Science, Wenzhou Medical University. Cells were cultured in an incubator at 5% CO2 with 95% air at 37°C. Sterile 10% fetal bovine serum and 1% penicillin-streptomycin solution were supplemented in Dulbecco’s modified Eagle’s medium (DMEM; Procell, PM150210) for cell culture. HUVECs were treated with TBHP solution (IC50: 35 μM) for 24 h to mimic oxidative stress damage. In accordance with the treatments, the division of cells was determined for NC, TBHP, TBHP + Mir-NC, and TBHP + Mir504-5p mimic. Mir-NC and Mir504-5p mimic were designed by GeneChem Chemical Technology Co., Ltd. (Shanghai, China). DMECs were cultured in dedicated complete medium for further research.
Luciferase reporter assay
Sequences consistent with the 3ʹ-UTR of Pla2g4e mRNA were composed of WT or MUT Mir504-5p binding sequences and synthesized by GeneCreate (Wuhan, China). These sequences, which were first cloned into a pmirGLO luciferase control reporter vector (Promega, E1330), aimed to generate the Pla2g4e 3ʹ-UTR reporter constructs (pmirGLO-WT-Pla2g4e and pmirGLO-MUT-Pla2g4e). DMECs, cultured at a density of 2 × 10⁴ cells/well in 96-well culture plates, were transfected with Mir504-5p mimic or negative control and cotransfected with 0.2 μg of pmirGLO-WT-Pla2g4e or pmirGLO-MUT-Pla2g4e 3ʹ-UTR. Five hours posttransfection, the transfection medium was removed and replaced with medium containing 6 μM curcumin (Sigma-Aldrich, 239,802) solubilized in 100% dimethyl sulfoxide (DMSO; Sigma-Aldrich, D8418). Measurements of luciferase activity were performed 48 h posttransfection using a Dual-Luciferase® Reporter Assay System (Promega, E1910).
RNA immunoprecipitation assay
DMECs overexpressing Mir504-5p or Mir-NC were collected by centrifugation and lysed with RIP lysis buffer. For each IP, antibody-conjugated beads (Sigma-Aldrich, RIP-12RXN) were resuspended in 900 μL of RIP Immunoprecipitation Buffer (Sigma-Aldrich, RIP-12RXN) and added to 100 μL of lysate. IP reactions were tumbled at 4°C overnight and subsequently washed 3 times with RIP wash buffer. Proteinase K (Sigma-Aldrich, 1,245,680,100) digestion and phenol-chloroform-isopropyl alcohol were employed to release and extract the immunoprecipitated RNA. mRNA was quantified using qPCR.
FISH
FISH was conducted to determine the subcellular location of Mir504-5p. Fluorescein-labeled probes against Mir504-5p were designed and synthesized by GeneCreate (Wuhan, China). DMECs were fixed with 4% paraformaldehyde and then treated with permeabilization solution at 4°C for 5 min. After blocking, the Mir504-5p probes were added and hybridized overnight in the dark. Nuclei were stained with DAPI. Finally, fluorescence signals were scanned using a confocal laser microscope system.
qPCR
Total RNA was removed from skin flaps using TRIzol reagent (Thermo Fisher Scientific, 15,596,026) according to the manufacturer’s instructions. Quantification was carried out using a two-step reaction process: reverse transcription (RT) and PCR. Each RT reaction comprised 0.5 μg of RNA, 2 μL of 5 × TransScript All-in-one SuperMix for qPCR and 0.5 μL of gDNA Remover, within a volume of 10 μL. The reaction was conducted in a GeneAmp® PCR System 9700 (Applied Biosystems, USA) for 15 min at 42°C followed by 5 s at 85°C. Then, the 10 μL RT reaction mix was diluted 10× in nuclease-free water and kept at −20°C. Real-time PCR was carried out in a LightCycler® 480 II Real-time PCR Instrument (Roche, Switzerland) with a 10 μL PCR mixture, including 1 μL of cDNA, 5 μL of 2 × PerfectStartTM Green qPCR SuperMix (TransGen Biotech Co., AQ601), 0.2 μL of forward primer, 0.2 μL of reverse primer and 3.6 μL of nuclease-free water. Reactions were incubated in a 384-well optical plate (Roche, 04729749001) at 94°C for 30 s, followed by 45 cycles of 94°C for 5 s and 60°C for 30 s. Every sample was analyzed in triplicate. The end of the PCR cycles included a melting curve analysis, which was conducted to validate the specific generation of the expected PCR product. Primer sequences were designed in the laboratory and synthesized by GeneChem based on mRNA sequences obtained from the NCBI database as follows: Mir504-5p 5ʹ- ACACTCCAGCTGGGAGACCCTGGTCTGCAC-3ʹ (forward) and 5ʹ-TGGTGTCGTGGAGTCG-3ʹ (reverse); Pla2g4e 5ʹ-CAGACAAAGCCCCTGAAACA-3ʹ (forward) and 5ʹ-GTGGGAAGTAAGCCACGATG-3ʹ (reverse); Rnu6 5ʹ-CTCGCTTCGGCAGCACATATACT-3ʹ (forward) and 5ʹ-ACGCTTCACGAATTTGCGTGTC-3ʹ (reverse); Actb 5ʹ-GGCTCCTAGCACCATGAAGA-3ʹ (forward) and 5ʹ-AGCTCAGTAACAGTCCGCC-3ʹ (reverse). Eventually, the targeted mRNAs were normalized to Rnu6 mRNA or Actb mRNA expression. The 2‐ΔΔCt algorithm was used for qPCR analysis.
Cell counting kit 8
HUVECs were seeded in 96-well plates at 5 × 10³ cells per well. The cell density in each well was 50%; the cells were treated with specific concentrations (0, 5, 10, 20, 40, 80 and 160 μM) of TBHP solution (Tokyo Chemical Industry Co., B3153). The THBP-containing medium was discarded after 24 h of incubation and replaced with 90 μL of fresh cell culture medium after three washes with PBS solution. Afterward, 10 μL CCK-8 solution (Dojindo, CK04) was added to each well and incubated with the cells at 37°C for 4 h. Measurement of the absorbance of each well was performed at 450 nm with a microplate reader.
Tube formation assay
The in vitro angiogenic activity of HUVECs was assessed using ibidi μ-slides (Ibidi, 81,506) precoated with 10 μL/well growth factor-reduced Matrigel (Corning, 356,234). Briefly, HUVECs were stained with cell-permeable dye (calcein AM; Beyotime, C2012) for 30 min and replated in ibidi μ-slides. After 6 h of incubation at 37°C in a cell culture incubator, capillary-like tube formation was observed under a computer-assisted microscope. Tube formation was defined as a tube-like structure that exhibited a length four times its specific width. The length of the tube in duplicate wells was determined and averaged using ImageJ software.
Cell migration
To determine the in vitro migration activity of HUVECs, cell migration assays were performed with Transwell inserts (8.0-μm polycarbonate membrane; Corning, 3422). After treatments, HUVECs were seeded into the upper chambers and incubated at 37°C for 12 h. Then, the cells in each chamber were fixed with 4% paraformaldehyde and stained with crystal violet. The migrated cells were imaged with a computer-assisted microscope.
Statistical analysis
Statistical analyses were implemented using SPSS software version 19 (Chicago, IL, USA). All the data are expressed as the mean ± standard error of the mean (SEM). To control for unwanted sources of variation, normalization was performed for all data presented in this study. One-way analysis of variance (ANOVA) based on LSD (equal variances assumed) post hoc analysis or Dunnett’s T3 (equal variances not assumed) approach was conducted for assessment of significant differences between two groups among three or four groups. Independent-sample t-tests were employed to determine remarkably significant differences between two groups. P-values less than 0.05 were deemed to be statistically significant.
Data availability
Additional data collected during this study are available from the corresponding author upon reasonable request.
Supplemental Material
Download MS Word (6.2 MB)Acknowledgments
This work was supported by grants from National Natural Science Foundation of China (No. 82072192 to Kailiang Zhou, No. 81801930 to Jian Ding, No. 81873942 to Weiyang Gao, No. 82102674 to Yao Li); Public Welfare Technology Research Project of Zhejiang Province (No. LGF20H150003 to Kailiang Zhou,LGF20H060013 to Yaosen Wu); and Wenzhou Science and Technology Bureau Foundation (No. Y20210438 to Kailiang Zhou).
Disclosure statement
No potential conflict of interest was reported by the author(s).
Supplementary material
Supplemental data for this article can be accessed here
Additional information
Funding
References
- Li Y, Jiang QL, Van der Merwe L, et al. Preclinical efficacy of stem cell therapy for skin flap: a systematic review and meta-analysis. Stem Cell Res Ther. 2021;12:28.
- Nowak-Sliwinska P, Alitalo K, Allen E, et al. Consensus guidelines for the use and interpretation of angiogenesis assays. Angiogenesis. 2018;21:425–532.
- Xiao W, Yeerken D, Li J, et al. Nlp promotes autophagy through facilitating the interaction of Rab7 and FYCO1. Signal Transduct Target Ther. 2021;6(1):152.
- Lv Y, Zhang W, Zhao J, et al. SRSF1 inhibits autophagy through regulating Bcl-x splicing and interacting with PIK3C3 in lung cancer. Signal Transduct Target Ther. 2021;6(1):108.
- Wu AG, Pan R, Law BY, et al. Targeting autophagy as a therapeutic strategy for identification of liganans from Peristrophe japonica in Parkinson’s disease. Signal Transduct Target Ther. 2021;6:67.
- Miao G, Zhao H, Li Y, et al. ORF3a of the COVID-19 virus SARS-CoV-2 blocks HOPS complex-mediated assembly of the SNARE complex required for autolysosome formation. Dev Cell. 2020;56(4):427–442.
- Chen CG, Iozzo RV. Angiostatic cues from the matrix: endothelial cell autophagy meets hyaluronan biology. J Biol Chem. 2020;295(49):16797–16812.
- Zhou DM, Sun LL, Zhu J, et al. MiR-9 promotes angiogenesis of endothelial progenitor cell to facilitate thrombi recanalization via targeting TRPM7 through PI3K/Akt/autophagy pathway. J Cell Mol Med. 2020;24:4624–4632.
- Zhou K, Chen H, Lin J, et al. FGF21 augments autophagy in random-pattern skin flaps via AMPK signaling pathways and improves tissue survival. Cell Death Dis. 2019;10(12):872.
- Wu H, Chen H, Zheng Z, et al. Trehalose promotes the survival of random-pattern skin flaps by TFEB mediated autophagy enhancement. Cell Death Dis. 2019;10(7):483.
- Saftig P, Puertollano R. How lysosomes sense, integrate, and cope with stress. Trends Biochem Sci. 2020;46:97–112.
- Wang K, Zhan Y, Chen B, et al. Tubeimoside I-induced lung cancer cell death and the underlying crosstalk between lysosomes and mitochondria. Cell Death Dis. 2020;11:708.
- Kuang F, Liu J, Li C, et al. Cathepsin B is a mediator of organelle-specific initiation of ferroptosis. Biochem Biophys Res Commun. 2020;533(4):1464–1469.
- Ghosh M, Tucker DE, Burchett SA, et al. Properties of the Group IV phospholipase A2 family. Prog Lipid Res. 2006;45(6):487–510.
- Ohto T, Uozumi N, Hirabayashi T, et al. Identification of novel cytosolic phospholipase A(2)s, murine cPLA(2){delta}, {epsilon}, and {zeta}, which form a gene cluster with cPLA(2){beta}. J Biol Chem. 2005;280(26):24576–24583.
- Capestrano M, Mariggio S, Perinetti G, et al. Cytosolic phospholipase A(2)epsilon drives recycling through the clathrin-independent endocytic route. J Cell Sci. 2014;127(Pt 5):977–993.
- Sarkar C, Jones JW, Hegdekar N, et al. PLA2G4A/cPLA2-mediated lysosomal membrane damage leads to inhibition of autophagy and neurodegeneration after brain trauma. Autophagy. 2020;16(3):466–485.
- Li Y, Jones JW, Sarkar HMCC, et al. cPLA2 activation contributes to lysosomal defects leading to impairment of autophagy after spinal cord injury. Cell Death Dis. 2019;10:531.
- Yi K, Zhan Q, Wang Q, et al. PTRF/Cavin1 remodels phospholipid metabolism to promote tumor proliferation and suppress immune responses in glioblastoma by stabilizing cPLA2. Neuro Oncol. 2020;23(3):387–399 .
- Zheng L, Xie C, Zheng J, et al. An imbalanced ratio between PC(16:0/16:0) and LPC(16:0) revealed by lipidomics supports the role of the Lands’ cycle in ischemic brain injury. J Biol Chem. 2020;296:100151 .
- Giurdanella G, Lupo G, Gennuso F, et al. Activation of the VEGF-A/ERK/PLA2 axis mediates early retinal endothelial cell damage induced by high glucose: new insight from an in vitro model of diabetic retinopathy. Int J Mol Sci. 2020;21(20):7528.
- Xia K, Zhu F, Yang C, et al. Discovery of a potent RIPK3 inhibitor for the amelioration of necroptosis-associated inflammatory injury. Front Cell Dev Biol. 2020;8:606119.
- Fresquet V, Garcia-Barchino MJ, Larrayoz MJ, et al. Endogenous retroelement activation by epigenetic therapy reverses the Warburg effect and elicits mitochondrial-mediated cancer cell death. Cancer Discov. 2020;11(5):1268–1285.
- Afonso MB, Rodrigues PM, Mateus-Pinheiro M, et al. RIPK3 acts as a lipid metabolism regulator contributing to inflammation and carcinogenesis in non-alcoholic fatty liver disease. Gut. 2020;70(12):2359–2372.
- Zhang H, Yin Y, Liu Y, et al. Necroptosis mediated by impaired autophagy flux contributes to adverse ventricular remodeling after myocardial infarction. Biochem Pharmacol. 2020;175:113915.
- Fan W, Guo J, Gao B, et al. Flotillin-mediated endocytosis and ALIX–syntenin-1–mediated exocytosis protect the cell membrane from damage caused by necroptosis. Sci Signal. 2019;12(583):eaaw3423.
- Cai X, Liu Y, Hu Y, et al. ROS-mediated lysosomal membrane permeabilization is involved in bupivacaine-induced death of rabbit intervertebral disc cells. Redox Biol. 2018;18:65–76.
- Dos Santos AF, Inague A, Arini GS, et al. Distinct photo-oxidation-induced cell death pathways lead to selective killing of human breast cancer cells. Cell Death Dis. 2020;11:1070.
- Kim J, Kwon J, Kim M, et al. Low-dielectric-constant polyimide aerogel composite films with low water uptake. Polym J. 2016;48(7):829–834.
- Shen S, Wu Y, Chen J, et al. CircSERPINE2 protects against osteoarthritis by targeting miR-1271 and ETS-related gene. Ann Rheum Dis. 2019;78(6):826–836.
- Liu W, Rong Y, Wang J, et al. Exosome-shuttled miR-216a-5p from hypoxic preconditioned mesenchymal stem cells repair traumatic spinal cord injury by shifting microglial M1/M2 polarization. J Neuroinflammation. 2020;17(1):47.
- Zhang X, Yuan S, Li H, et al. The double face of miR-320: cardiomyocytes-derived miR-320 deteriorated while fibroblasts-derived miR-320 protected against heart failure induced by transverse aortic constriction. Signal Transduct Target Ther. 2021;6(1):69.
- Huang T, Wan X, Alvarez AA, et al. MIR93 (microRNA -93) regulates tumorigenicity and therapy response of glioblastoma by targeting autophagy. Autophagy. 2019;15(6):1100–1111.
- Ozturk DG, Kocak M, Akcay A, et al. MITF-MIR211 axis is a novel autophagy amplifier system during cellular stress. Autophagy. 2019;15:375–390.
- Chang CH, Yen MC, Liao SH, et al. Dual role of MiR-21-Mediated signaling in HUVECs and rat surgical flap under normoxia and hypoxia condition. Int J Mol Sci. 2017;18(9):1917.
- Biswas S, Roy S, Banerjee J, et al. Hypoxia inducible microRNA 210 attenuates keratinocyte proliferation and impairs closure in a murine model of ischemic wounds. Proc Natl Acad Sci U S A. 2010;107(15):6976–6981.
- Vandenabeele P, Galluzzi L, Vanden Berghe T, et al. Molecular mechanisms of necroptosis: an ordered cellular explosion. Nat Rev Mol Cell Biol. 2010;11(10):700–714.
- Mauthe M, Orhon I, Rocchi C, et al. Chloroquine inhibits autophagic flux by decreasing autophagosome-lysosome fusion. Autophagy. 2018;14:1435–1455.
- Boyer MJ, Horn I, Ra FF, et al. pH dependent cytotoxicity of N-dodecylimidazole: a compound that acquires detergent properties under acidic conditions.
- Wilson Pd Fau - Firestone RA, Firestone Ra Fau - Lenard J, Lenard J. The role of lysosomal enzymes in killing of mammalian cells by the lysosomotropic detergent N-dodecylimidazole.
- Kosic M, Arsikin-Csordas K, Paunovic V, et al. Synergistic anticancer action of lysosomal membrane permeabilization and glycolysis inhibition. J Biol Chem. 2016;291(44):22936–22948.
- Nissinen TA, Hentila J, Fachada V, et al. Muscle follistatin gene delivery increases muscle protein synthesis independent of periodical physical inactivity and fasting. FASEB J. 2021;35(3):e21387.
- Papadopoulos C, Kravic B, Meyer H. Repair or Lysophagy: dealing with Damaged Lysosomes. J Mol Biol. 2020;432(1):231–239.
- Vanden Berghe T, Vanlangenakker N, Parthoens E, et al. Necroptosis, necrosis and secondary necrosis converge on similar cellular disintegration features. Cell Death Differ. 2010;17(6):922–930.
- Biswas NK, Das S, Maitra A, et al. Somatic mutations in arachidonic acid metabolism pathway genes enhance oral cancer post-treatment disease-free survival. Nat Commun. 2014;5(1):5835.
- Peng Z, Chang Y, Fan J, et al. Phospholipase A2 superfamily in cancer. Cancer Lett. 2021;497:165–177.
- Hong JH, Chung G, Cowan AK. Delayed leaf senescence by exogenous lyso-phosphatidylethanolamine: towards a mechanism of action. Plant Physiol Biochem. 2009;47:526–534.
- Sun GY, Chuang DY, Zong Y, et al. Role of cytosolic phospholipase A2 in oxidative and inflammatory signaling pathways in different cell types in the central nervous system. Mol Neurobiol. 2014;50:6–14.
- Vigo C. Effect of C-reactive protein on platelet-activating factor-induced platelet aggregation and membrane stabilization. J Biol Chem. 1985;260:3418–3422.
- Liu NK, Deng LX, Zhang YP, et al. Cytosolic phospholipase A2 protein as a novel therapeutic target for spinal cord injury. Ann Neurol. 2014;75:644–658.
- Chen HM, Yang CM, Chang JF, et al. AdipoR-increased intracellular ROS promotes cPLA2 and COX-2 expressions via activation of PKC and p300 in adiponectin-stimulated human alveolar type II cells. Am J Physiol Lung Cell Mol Physiol. 2016;311:L255–69.
- Lin CC, Lin WN, Cho RL, et al. TNF-alpha-Induced cPLA2 expression via NADPH oxidase/reactive oxygen species-dependent NF-kappaB cascade on human pulmonary alveolar epithelial cells. Front Pharmacol. 2016;7:447.
- Zhou XL, Wei XJ, Li SP, et al. Interactions between cytosolic phospholipase A2 activation and mitochondrial reactive oxygen species production in the development of ventilator-induced diaphragm dysfunction. Oxid Med Cell Longev. 2019;2019:2561929.
- Liu S, Li Y, Choi HMC, et al. Lysosomal damage after spinal cord injury causes accumulation of RIPK1 and RIPK3 proteins and potentiation of necroptosis. Cell Death Dis. 2018;9:476.
- Naito MG, Xu D, Amin P, et al. Sequential activation of necroptosis and apoptosis cooperates to mediate vascular and neural pathology in stroke. Proc Natl Acad Sci U S A. 2020;117:4959–4970.
- Serrano-Puebla A, Boya P. Lysosomal membrane permeabilization as a cell death mechanism in cancer cells. Biochem Soc Trans. 2018;46:207–215.
- Yashin DV, Romanova EA, Ivanova OK, et al. The Tag7-Hsp70 cytotoxic complex induces tumor cell necroptosis via permeabilisation of lysosomes and mitochondria. Biochimie. 2016;123:32–36.
- Mandal R, Barron JC, Kostova I, et al. Caspase-8: the double-edged sword. Biochim Biophys Acta Rev Cancer. 2020;1873:188357.
- Xue H, Yuan G, Guo X, et al. A novel tumor-promoting mechanism of IL6 and the therapeutic efficacy of tocilizumab: hypoxia-induced IL6 is a potent autophagy initiator in glioblastoma via the p-STAT3-MIR155-3p-CREBRF pathway. Autophagy. 2016;12:1129–1152.
- Li Y, Zhou D, Ren Y, et al. Mir223 restrains autophagy and promotes CNS inflammation by targeting ATG16L1. Autophagy. 2019;15:478–492.
- Babuta M, Furi I, Bala S, et al. Dysregulated autophagy and lysosome function are linked to exosome production by micro-RNA 155 in alcoholic liver disease. Hepatology. 2019;70:2123–2141.
- Han J, Zhuang W, Feng W, et al. The circular RNA circINPP4B acts as a sponge of miR-30a to regulate Th17 cell differentiation during progression of experimental autoimmune encephalomyelitis. Cell Mol Immunol. 2021;18(9):2177–2187.
- Huang M, Hu -Y-Y, Dong X-Q, et al. The protective role of oxymatrine on neuronal cell apoptosis in the hemorrhagic rat brain. J Ethnopharmacol. 2012;143(1):228–235.
- Huang JP, Cheng ML, Wang CH, et al. Therapeutic potential of cPLA2 inhibitor to counteract dilated-cardiomyopathy in cholesterol-treated H9C2 cardiomyocyte and MUNO rat. Pharmacol Res. 2020;160:105201.
- Dias RG, Sampaio SC, Sant’Anna MB, et al. Articular inflammation induced by an enzymatically-inactive Lys49 phospholipase A2: activation of endogenous phospholipases contributes to the pronociceptive effect. J Venom Anim Toxins Incl Trop Dis. 2017;23(1):18.
- Cui L, Zhang X, Yang R, et al. Baicalein is neuroprotective in rat MCAO model: role of 12/15-lipoxygenase, mitogen-activated protein kinase and cytosolic phospholipase A2. Pharmacol Biochem Behav. 2010;96(4):469–475.
- Wang F, Gomez-Sintes R, Boya P. Lysosomal membrane permeabilization and cell death. Traffic. 2018;19(12):918–931.
- Jeong D, Yoo J, Lee P, et al. miR-25 tough decoy enhances cardiac function in heart failure. Mol Ther. 2018;26(3):718–729.