
ABSTRACT
Ovarian granulosa cells (GCs) proliferate and differentiate along with follicular growth, and this is indispensable for oocyte development and female fertility. Although the role of macroautophagy/autophagy in ovarian function has been reported, its contribution to the regulation of GC characteristics remains elusive. The siRNA-mediated knockdown of two key autophagy-related genes ATG5 and BECN1 and the autophagy inhibitor chloroquine were used to interfere with autophagy in GCs. Inhibition of autophagy both genetically and pharmacologically resulted in decreased expression of genes associated with GC differentiation, including CYP19A1/Aromatase and FSHR, as well as in reduced estradiol synthesis. Mechanistically, when autophagy was disrupted, the transcription factor WT1 accumulated in GCs due to its insufficient degradation by the autophagic pathway, and this inhibited GC differentiation. Finally, decreased expression of several autophagy-related genes, as well as reduced LC3-II:LC3-I and elevated SQSTM1/p62 protein levels, which are indications of decreased autophagy, were detected in GCs from biochemical premature ovarian insufficiency patients. In summary, our study reveals that autophagy regulates the differentiation of ovarian GCs by degrading WT1 and that insufficient autophagy might be involved in ovarian dysfunction.
Abbreviations: ATG: autophagy related; bPOI: biochemical premature ovarian insufficiency; CHX: cycloheximide; Co-IP: co-immunoprecipitation; CQ: chloroquine; E2: estradiol; FSH: follicle stimulating hormone; FSHR: follicle stimulating hormone receptor; GC: granulosa cell; LIR: LC3-interacting region; MAP1LC3/LC3: microtubule associated protein 1 light chain 3; POI: premature ovarian insufficiency; RAP: rapamycin; siRNA: small interfering RNA; WT1: WT1 transcription factor
Introduction
During folliculogenesis, the development of ovarian somatic cells is finely regulated to coordinate with the growth and maturation of oocytes [Citation1,Citation2]. Among the ovarian somatic cells, granulosa cells (GCs) surround the oocytes and play crucial roles in follicle development and fate determination [Citation3,Citation4]. They not only protect and communicate with oocytes, but also possess steroidogenesis and endocrine functions [Citation5]. In addition to proliferation, GCs differentiate into appropriate stages over the course of follicular development [Citation6]. Although several factors such as gonadotropins [Citation7] and transcription factors [Citation8,Citation9] have been shown to be involved in GC differentiation, the regulatory mechanisms remain largely elusive.
Autophagy is a highly conserved and precisely regulated self-degradation process in eukaryotic cells that plays a key role in the maintenance of cellular homeostasis [Citation10]. Depending on the molecular mechanisms that are involved, autophagy is divided into macroautophagy, microautophagy, and chaperone-mediated autophagy [Citation11]. Of these, macroautophagy/autophagy is the most well-studied process in which autophagosomes and lysosomes combine to form autolysosomes [Citation12], and it requires the cooperation and interaction of numerous molecules encoded by ATG (autophagy related) genes [Citation13]. Autophagy not only maintains the normal physiological function of cells in a basal state, but also serves as an adaptive process induced by stresses such as starvation, infection, and hypoxia [Citation14]. It has also been shown that autophagy is involved in the pathogenesis of a variety of human diseases including cancers and neurodegenerative diseases [Citation15–17].
Although its role in specific ovarian disorders is unclear, autophagy has emerged as a critical mechanism in maintaining the homeostasis that is very important for ovarian function and female reproduction [Citation18,Citation19]. It has been reported that autophagy participates in regulating the apoptosis of GCs to accelerate follicular atresia [Citation20,Citation21], and insufficient autophagy of granulosa-luteal cells results in declined progesterone synthesis and subsequent preterm delivery in mice [Citation22]. However, the underlying mechanism through which autophagy dysregulation is involved in the dysfunction of GCs remains to be determined.
In this study, we demonstrated that impaired autophagy disturbed the differentiation of GCs by inhibiting degradation of WT1, and we observed defective autophagy in the GCs of biochemical POI (bPOI) patients. Our findings provide the first evidence for the role of autophagy in GC differentiation and suggest that impaired autophagy in GCs may be involved in the pathogenesis of POI.
Results
Autophagy inhibition impairs the differentiation of GCs
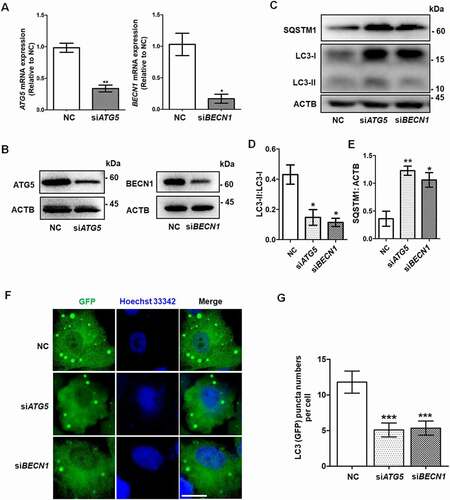
The proliferation, differentiation, and steroidogenesis capacity of GCs plays an indispensable role in folliculogenesis [Citation23]. To determine the role of autophagy in GCs, we used siRNA to knock down the expression of two key ATG genes, ATG5 and BECN1, in KGN cells, which are a human GC line (). The ratio of LC3-II to LC3-I expression was clearly decreased in both the siATG5 and siBECN1 groups compared with the negative control (NC) group (), indicating the efficient inhibition of autophagy. Moreover, the accumulation of SQSTM1/p62 also suggested the downregulation of autophagy (). To determine the autophagic flux, we infected LC3 reporter adenovirus into KGN cells after silencing ATG5 and BECN1. Because the GFP signal is quenched in the acidic condition when it enters autolysosome, the green (GFP) puncta indicate the phagophore, autophagosome, and amphisome [Citation24]. The fluorescence results showed that the green LC3 puncta were significantly reduced in KGN cells with knockdown of ATG5 or BECN1 after starvation, indicating that the autophagic flux was decreased ().
Figure 1. Knockdown of ATG5 and BECN1 inhibited autophagy in GCs. The negative control siRNA (NC), ATG5 siRNA (siATG5), and BECN1 siRNA (siBECN1) were transfected into KGN cells, and 48 h later the knockdown efficiencies were determined in both mRNA (A) and protein (B) levels. GAPDH and ACTB/β-actin served as the internal control for mRNA and protein, respectively. Data are presented as mean ± SD, n = 3, *P < 0.05, **P < 0.01 vs. NC. (C) The expression of LC3 and SQSTM1 proteins in these three groups was detected by Western blot. ACTB was used as the loading control. Quantitative analysis showed lower LC3-II:LC3-1 ratios (D) and higher levels of SQSTM1 (E) in the siATG5 and siBECN1 groups, compared to the NC group. Data are presented as mean ± SD, n = 3, *P < 0.05, **P < 0.01. (F) KGN cells were transfected with NC, siATG5, and siBECN1 for 24 h, followed by infection with LC3 reporter adenovirus for 48 h. The distribution of green (GFP) LC3 puncta was observed under a fluorescence microscope after starvation for 6 h. Cell nuclei were counterstained with Hoechst 33342. Scale bar: 5 μm. (G) Quantification of green LC3 puncta in KGN cells of each group. Data are presented as mean ± SD, n = 3, ***P < 0.001.
We next examined the proliferation of KGN cells after autophagy inhibition by siRNA using the Cell Counting Kit-8 (CCK8) assay and 5-ethynyl-2ʹ-deoxyuridine (EdU) staining. No differences in the growth of cultured cells (Fig. S1A) or EdU-positive cell rates (Fig. S1B and C) were observed between the NC, siATG5, and siBECN1 groups. Additionally, we disrupted autophagy in a pharmacological manner in GCs. Because 3-Methyladenine (3-MA), which is an autophagy inhibitor that selectively targets class III phosphatidylinositol 3-kinase (PtdIns3K), was reported to affect glucose metabolism and induce apoptosis in GCs [Citation25], we used chloroquine (CQ), which is another widely used autophagy inhibitor, in the following experiments. Western blot showed obvious accumulation of LC3-II and SQSTM1 in CQ-treated KGN cells (Fig. S1D); however, similar to the results of the siRNA experiment, the CCK8 and EdU assays also showed no obvious effect on the proliferation of KGN cells by pharmacological inhibition of autophagy (Fig. S1E-G). Collectively, our results showed that blocking autophagy did not significantly affect the proliferation of GCs.
To explore the effect of autophagy inhibition on GC differentiation, the expression of genes related to GC differentiation was measured by qRT-PCR. The mRNA levels of CYP19A1, FSHR, GATA4, GATA6, INHBA, SF1, and SP1 in KGN cells were significantly downregulated in the siATG5 and siBECN1 groups (). In addition, we also observed obvious downregulation of the genes encoding steroidogenic enzymes, such as HSD3B1 and STAR, in KGN cells after knocking down ATG5 and BECN1 (). However, LHCGR mRNA was not detected in all groups. LHCGR is not only critical for luteinization, but also is a marker for the late differentiation of GCs [Citation26]. Furthermore, decreased expression of CYP19A1 and FSHR were confirmed by Western blot in the siATG5 and siBECN1 groups (), which indicated the impaired differentiation of KGN cells in response to autophagy inhibition. In order to exclude the off-target effects, we also used additional siRNAs to downregulate the expression of these two genes to inhibit autophagy (Fig. S2A-E). The results also showed that the expression levels of CYP19A1 and FSHR were decreased in KGN cells after knockdown of ATG5 and BECN1 (Fig. S2F). In addition, compared with the control group, the expression of CYP19A1 and FSHR was also decreased in CQ-treated KGN cells at both the mRNA and protein levels (). We then examined the effects of impaired autophagy on estradiol (E2) and progesterone synthesis and found that the level of E2 was significantly decreased in the siATG5 and siBECN1 groups (, Fig. S2G) and in CQ-treated KGN cells (). However, progesterone was not detected in the supernatant of KGN cells from any of the groups. We also cultured mouse primary GCs and used CQ to inhibit autophagy. The expression of CYP19A1 and FSHR was decreased () and the E2 level was lower after autophagy inhibition (). To sum up, autophagy insufficiency inhibited the early differentiation of GCs, but did not affect luteinization in vitro.
Figure 2. Autophagy inhibition leads to insufficient differentiation of GCs. (A) After siRNA transfection of KGN cells for 48 h, the mRNA expression of the genes related to GC differentiation and steroidogenesis, including CYP19A1, FSHR, GATA4, GATA6, INHBA, SF1, SP1, HSD3B1, and STAR, showed significant downregulation in both the siATG5 and siBECN1 groups. GAPDH served as the internal control. Data are presented as mean ± SD, n = 3, * P < 0.05, ** P < 0.01, ***P < 0.001. vs. NC. (B) After treatment of KGN cells with CQ, the mRNA expression of CYP19A1 and FSHR was downregulated compared to controls. GAPDH served as the internal control. Data are presented as mean ± SD, n = 3. ** P < 0.01 vs. CON. (C and D) Protein levels of CYP19A1 and FSHR were decreased in KGNs transfected with siATG5 and siBECN1 or pretreated with CQ as measured by Western blot. ACTB was used as the loading control. (E) E2 production in KGN cell supernatant was decreased in both the siATG5 (6.32 ± 1.41 ng/mg) and siBECN1 (8.81 ± 0.56 ng/mg) groups compared to the NC group (15.33 ± 0.36 ng/mg). Data are presented as mean ± SD, n = 3, **P < 0.01 vs. NC. (F) E2 production in CQ-treated KGN cells (7.96 ± 0.47 ng/mg) was lower than that in the control group (18.11 ± 1.10 ng/mg). Data are presented as mean ± SD, n = 3, **P < 0.01 vs. CON. (G) Mouse GCs were harvested and cultured in vitro. After 48 h treatment with 50 μM CQ, the protein levels of CYP19A1 and FSHR were lower than those in the control group. GAPDH was used as the loading control. (H) The E2 production was decreased in CQ-treated mouse GCs (0.12 ± 0.03 ng/mg) compared to the control group (0.82 ± 0.18 ng/mg). Data are presented as mean ± SD, n = 3, **P < 0.01 vs. CON.
Impaired autophagy inhibits the degradation of WT1
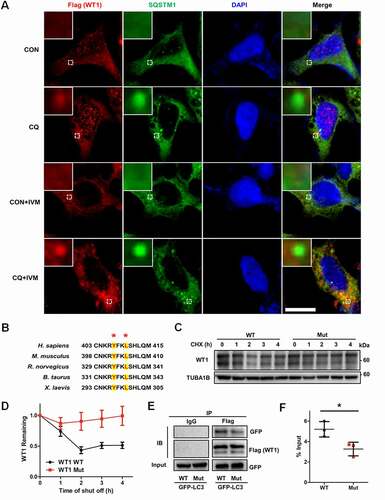
Being key transcription factors, WT1 (WT1 transcription factor) and FOXO1 (forkhead box O1) play inhibitory roles during the differentiation of GCs [Citation9,Citation27]. To investigate how autophagy modulates GC differentiation, we detected the expression of WT1 and FOXO1 proteins. Western blot showed that the protein levels of WT1 were upregulated in the siATG5 and siBECN1 groups, whereas expression of FOXO1 showed no obvious differences (, Fig. S2H). The WT1 gene has four splicing variants that translate into four protein isoforms with molecular masses of 52–54 kDa. Consistent with previous studies [Citation28,Citation29], they appeared as two bands on Western blot. However, no increase in the WT1 mRNA was observed in GCs with decreased expression of ATG5 or BECN1 (beclin 1) (), which suggested that autophagy insufficiency upregulated WT1 expression at the protein level rather than at the mRNA level. To determine whether the degradation of WT1 was changed after autophagy dysfunction, we performed cycloheximide (CHX) chase assays and found that WT1 degradation was obviously delayed in the GCs in the siATG5 and siBECN1 groups, compared with the NC group (). Consistently, the accumulation of WT1 protein was observed in GCs after CQ treatment () and reduced degradation of WT1 protein was detected in CQ-treated KGN cells compared with the control group (). Furthermore, WT1 was mainly accumulated in nuclei of KGN cells after CQ treatment (). Next, we overexpressed WT1 in HEK293T cells and blocked autophagy by CQ treatment. The results showed more accumulation of WT1 protein in the nuclei and partial colocalization of WT1 and SQSTM1 in the cytoplasm after autophagy inhibition (). In contrast, after further addition of ivermectin (IVM), which is an inhibitor of KPNA-KPNB1-mediated nuclear import, WT1 protein remained in the cytoplasm and the colocalization of WT1 and SQSTM1 was more obvious (), suggesting the autophagy-dependent degradation of WT1 protein. Generally, there are one or more LC3-interacting region (LIR) motifs in the autophagic substrates, and these are responsible for the interaction with LC3 and subsequent degradation through the autophagy-lysosome pathway [Citation30]. Accordingly, we recognized a typical LIR motif in the WT1 protein that is highly conserved among species (). To determine whether the interaction between WT1 and LC3 was dependent on the LIR motif, we introduced the mutations p.Y407A and p.L410A into WT1, and the results showed that the degradation of the mutant WT1 protein was obviously delayed (). Furthermore, compared with the wild-type WT1 protein, the mutation in the LIR motif reduced amount of the co-immunoprecipitating between WT1 and LC3 (). Collectively, these results suggest that the degradation of WT1 protein occurs in an autophagy-dependent manner.
Figure 3. Accumulation of WT1 in GCs results from autophagy inhibition. (A) Western blot showed that, compared to NC, there was an increase in WT1 protein in both the siATG5 and siBECN1 groups, but there were no significant changes in FOXO1 protein. GAPDH was used as the loading control. (B) The qRT-PCR results showed that, compared to NC, the WT1 mRNA did not change significantly and FOXO1 mRNA decreased in the siATG5 group, while both WT1 and FOXO1 mRNA decreased significantly in the siBECN1 group. Data are presented as mean ± SD, n = 3, *P < 0.05, **P < 0.01 vs. NC. (C) After 0 h, 2 h, 4 h, and 6 h of CHX treatment to inhibit protein synthesis, Western blot was performed to detect the remaining amount of WT1 protein in KGN cells transfected with NC, siATG5, and siBECN1. GAPDH was used as the loading control. (D) The results of the quantitative analysis showed that the degradation rate of the WT1 protein in the siATG5 and siBECN1 groups was significantly slower compared to the NC. Data are presented as mean ± SD, n = 3. (E) Compared to control, there was a significant increase in WT1 protein level in KGN cells treated with CQ, but no significant change in FOXO1 protein. GAPDH was used as the loading control. (F and G) The degradation rate of WT1 protein in KGN cells pretreated with CQ was also delayed significantly. GAPDH was used as the loading control. Data are presented as mean ± SD, n = 3. It was noted that because the CHX chase assay was carried out after 48 h of siRNA infection or CQ treatment, the WT1 and SQSTM1 proteins had already accumulated in the siRNA or CQ group at 0 h (C and F). (H) Compared to control, the WT1 protein in the nucleus was elevated in KGN cells pretreated with CQ. LMNB1 and GAPDH were used as the loading controls for the nuclear and cytoplasmic proteins, respectively.
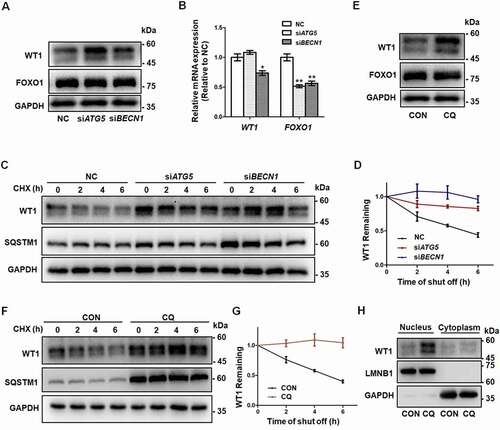
Figure 4. The degradation of WT1 occurs in an autophagy-dependent way. (A) Immunofluorescence staining of WT1 (red) and SQSTM1 (green) was performed in control and CQ and/or IVM-treated HEK293T cells transfected with Flag-WT1 plasmids. The nuclei were stained with DAPI (blue). Enlarged insets are marked by dashed boxes. Scale bar: 5 μm. (B) Sequence alignment of the LIR motifs of WT1 protein among species. The conserved residues in LIR motifs are shown by asterisks. (C) Wild-type (WT) and mutant WT1 (Y407A/L410A) plasmids were transfected into HEK293T cells for 48 h, and CHX chase assays were performed. The remaining amounts of WT1 protein were analyzed by Western blot. TUBA1B was used as the loading control. (D) Quantitative analysis of the degradation rates of WT and mutant (Mut) WT1 protein in HEK293T cells. Data are presented as mean ± SD, n = 3. (E) Wild-type (WT) or mutant (Mut) WT1 and GFP-LC3 plasmids were cotransfected into HEK293T cells. Cells were harvested for Co-IP assays and immunoprecipitated with anti-Flag antibody, and then WT1 and LC3 protein were detected by Flag and GFP antibodies by Western blot. IgG was used as the negative control. (F) Quantitative analysis of the amount of the co-immunoprecipitating between wild-type (WT) or mutant (Mut) WT1 and GFP-LC3. The immunoprecipitated GFP-LC3 was compared with the input. Data are presented as mean ± SD, n = 3, *P < 0.05.
Accumulation of WT1 inhibits the differentiation of GCs
To further determine whether the accumulation of WT1 inhibits the differentiation of GCs, we used adenovirus to overexpress WT1 in KGN cells. Western blot showed the downregulation of CYP19A1 and FSHR following WT1 accumulation (), and E2 production was also reduced (). When WT1 was silenced by transfecting siRNAs in KGN cells (Fig. S3A and B), the expression of CYP19A1 and FSHR was elevated ( and Fig. S3B) and E2 production was increased accordingly ( and Fig. S3C). Furthermore, the decreased expression of CYP19A1 and FSHR resulting from CQ treatment could be rescued by the transfection of siRNAs against WT1 ( and Fig. S3B). Correspondingly, the synthesis of E2 was increased by knockdown of WT1 in CQ-pretreated KGN cells ( and Fig. S3C).
Figure 5. The accumulation of WT1 protein inhibits the differentiation of GCs. (A) Western blot showed that CYP19A1 and FSHR levels in KGN cells infected with adenovirus overexpressing WT1 (Adv-WT1) were significantly decreased. GAPDH was used as the loading control. (B) After incubation with 10 nM testosterone for 24 h, the E2 synthesis capacity of KGN cells overexpressing WT1 (6.30 ± 0.25 ng/mg) was significantly lower than that of the control group (15.21 ± 0.69 ng/mg). Data are presented as mean ± SD, n = 3, **P < 0.01 vs. Ad-CON. (C) Transfection with 100 nM WT1 siRNA (siWT1) resulted in a decreased WT1 mRNA level. GAPDH was used as the internal control. Data are presented as mean ± SD, n = 3, **P < 0.01 vs. NC. (D) Western blot showed that WT1 protein decreased significantly after siWT1 transfection, and the protein levels of CYP19A1 and FSHR were upregulated in siWT1 KGN cells. In siWT1 cells, after the subsequent treatment with 50 μM CQ for 48 h, the expression of WT1 was significantly lower than that in NC cells, and the levels of CYP19A1 and FSHR were elevated. ACTB was used as the loading control. (E) After 24 h incubation with 10 nM testosterone, the E2 synthesis ability of siWT1 KGN cells (24.70 ± 1.46 ng/mg) was significantly higher than that of NC cells (18.38 ± 1.35 ng/mg). After CQ treatment, the E2 synthesis ability of siWT1 KGN cells (8.52 ± 0.44 ng/mg) was significantly higher than that of NC cells (6.08 ± 0.67 ng/mg). Data are presented as mean ± SD, n = 3, *P < 0.05.
Inhibition of autophagy impedes GC differentiation in vivo
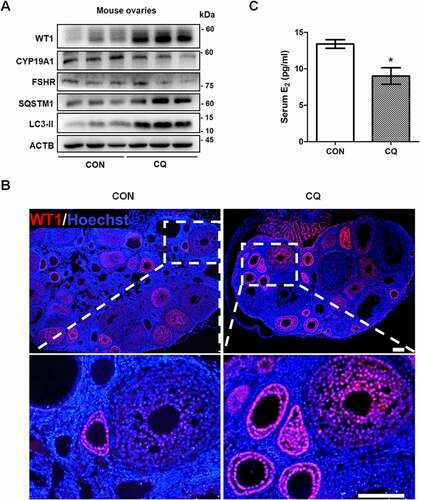
To observe the effect of reduced autophagy on GC differentiation in vivo, we inhibited autophagy in mouse ovaries by intraperitoneal injection of CQ. The accumulation of LC3-II and SQSTM1 indicated the blockage of autophagy (). We also detected the excess expression of WT1 in mouse ovaries (), and its expression was increased in the GCs of preantral follicles after CQ injection (). This is interesting because in accordance with its inhibitory role in GC differentiation during follicle development [Citation27], WT1 is mainly expressed in GCs before the stage of secondary follicles (). Accordingly, the decreased levels of CYP19A1 and FSHR suggested the inhibitory effect on GC differentiation after autophagy inhibition (). In addition, the serum E2 concentrations of CQ-treated mice were significantly lower than those of control mice ().
Figure 6. Autophagy inhibition delays GCs differentiation and increases WT1 in the ovaries of mice. Ovaries were dissected from mice with or without 5 days of 20 mg/kg CQ intraperitoneal injection. (A) Western blot showed that the protein levels of SQSTM1 and LC3-II were significantly increased in the ovaries of the mice injected intraperitoneally with CQ for 5 days. The expression of WT1 was increased and the differentiation markers CYP19A1 and FSHR were decreased compared to the controls. ACTB was used as the loading control. (B) Immunofluorescence showed the increased expression of WT1 (red) in the GCs of preantral follicles of mice treated with CQ. The nuclei were stained with DAPI (blue). Scale bars: 37.5 μm. (C) Serum E2 in CQ-treated mice (9.01 ± 1.13 pg/ml) was significantly lower than that in the control group (13.41 ± 0.58 pg/ml). Data are presented as mean ± SD, n = 5, *P < 0.05 vs. CON.
Activation of autophagy promotes GC differentiation
To further determine the effect of autophagy on GC differentiation, we activated autophagy with rapamycin (RAP) in KGN cells. The elevated LC3-II:LC3-I ratio and reduced SQSTM1 level indicated that autophagy was enhanced after RAP treatment (). As expected, with the decreased expression of WT1, upregulated CYP19A1 and FSHR, as well as increased E2 production, were observed in RAP-treated KGN cells (). Collectively, these results further demonstrated that autophagy affected GC differentiation by regulating WT1 protein.
Figure 7. Activation of autophagy promotes differentiation in GCs. (A) Western blot showed that LC3-II:LC3-I in KGN cells pretreated with RAP was increased and SQSTM1 protein was decreased compared to the control group. GAPDH was used as the loading control. (B) After pretreatment with RAP, the expression of the differentiation markers CYP19A1 and FSHR was increased and WT1 protein was decreased. GAPDH was used as the loading control. (C) The E2 synthesis capacity of KGN cells treated with RAP (45.91 ± 1.91 ng/mg,) was significantly higher than that of the control group (35.76 ± 0.52 ng/mg). Data are presented as mean ± SD, n = 3, **P < 0.01 vs. CON.
Autophagy is downregulated in the GCs of bPOI patients
Abnormal differentiation in GCs has been found to impair ovarian function and to be related to human reproductive disorders, such as premature ovarian insufficiency (POI) [Citation31,Citation32]. The decline in ovarian function has been proposed to be continuous and irreversible, and the development of POI has been divided into three stages, namely, the occult, biochemical, and overt stages [Citation33]. We collected ovarian GCs from follicular fluids of 51 bPOI patients and 47 control women. The detailed clinical characteristics of all participants are summarized in Table S1. We first confirmed the identity of the GCs by staining for CYP19A1, which is specifically expressed in GCs. The immunofluorescence results showed that over 95% of the harvested cells were positive for CYP19A1 (). The microarray analysis of GCs from 10 patients with bPOI and 10 control women showed that a total of 21 genes related to autophagy were significantly downregulated in bPOI patients (Table S2). According to their function in the process of autophagy, 12 genes (ATG5, BECN1, SIRT1, TRIM13, VMP1, WDR45, PRKAA1, RB1CC1, SQSTM1, WAC, PIK3C3, and WIPI1) were selected for further validation by qRT-PCR assay in 24 bPOI patients and 26 controls. The mRNA levels of six genes (ATG5, BECN1, SIRT1, TRIM13, VMP1, and WDR45) were further confirmed (Fig. S4A-F), whereas the other five genes (RB1CC1, SQSTM1, PRKAA1, WAC, and WIPI1) showed no obvious differences between bPOI patients and controls (Fig. S4G-K). One gene (PIK3C3) was increased in bPOI patients (Fig. S4L).
Figure 8. Autophagy is decreased in the GCs of bPOI patients, and a model for autophagic regulation in ovarian GCs differentiation is proposed. (A) Immunofluorescence staining showed that almost all of the cells were CYP19A1-positive (red). The nuclei were stained with DAPI (blue). Scale bar: 150 μm. (B) The expression of LC3 and SQSTM1 proteins in GCs from controls and bPOI patients was detected by Western blot, and representative results are shown. GAPDH was used as the loading control. Quantitative analysis showed a lower LC3-II:LC3-1 ratio (C) and higher level of SQSTM1 (D) in the GCs of bPOI patients (n = 13), compared to controls (n = 15). Data are presented as mean ± SD. ***P < 0.001 vs. Control. (E) A proposed model for the role of autophagy in ovarian GC differentiation. In the normal situation (left), autophagy facilitates the maintenance of the WT1 protein, which is an inhibitory transcriptional factor for the differentiation of GCs. This precisely regulated expression pattern of WT1 is crucial for the differentiation of GCs and promotes the expression of the key genes in GC differentiation, such as CYP19A1 and FSHR, and the E2 synthesis ability is enhanced resulting from the maturation of GCs. However, when autophagy insufficiency occurs in GCs (right), the accumulated WT1 caused by delayed degradation inhibits the expression of genes involved in GC differentiation and thus leads to insufficient E2 production.
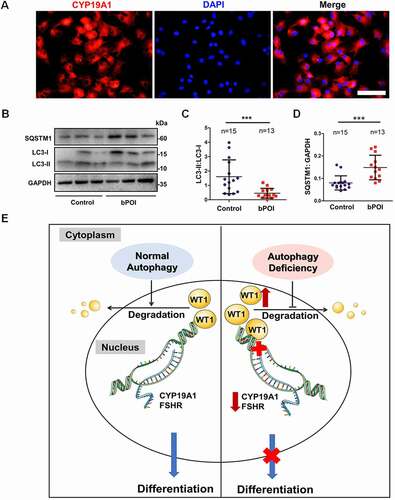
To further determine the level of autophagy in GCs from patients with bPOI, we detected the conversion of LC3-I to LC3-II and the amount of autophagic substrate protein SQSTM1 in GCs from 13 patients and 15 control women by Western blot. The decreased ratio of LC3-II:LC3-I and the elevated SQSTM1 level indicated the relatively low level of autophagy in the GCs of bPOI patients (). Taken together, these results suggested the existence of impaired autophagy in GCs from bPOI patients.
Discussion
The results presented here suggested the autophagy-dependent regulation in GC differentiation and firstly showed reduced autophagy level in GCs of bPOI patients. Under normal conditions, sufficient autophagy ensures the appropriate level of WT1 protein to facilitate the differentiation of GCs, whereas with insufficient autophagy, the excessive accumulation of WT1 inhibits the transcriptional activation of CYP19A1 and FSHR, which leads to defective differentiation of GCs and impaired E2 synthesis ().
As the pivotal mechanism in regulating cellular homeostasis, autophagy participates in several key developmental processes, and appropriate activation of autophagy is a strategy for resource allocation [Citation34,Citation35], especially during the complicated but delicate reproductive process in mammals [Citation18]. We have demonstrated that autophagy-dependent regulation of protein homeostasis is vital during the development of the male reproductive system. Autophagy deficiency caused by knocking out atg7 inhibits the differentiation of sperms due to the accumulation of PDLIM1, which is essential for the normal morphology and function of mature sperms [Citation36], and insufficient autophagic degradation of SLC9A3R2/NHERF2 (SLC9A3 regulator 2) inhibits cholesterol uptake in Leydig cells leading to impaired testosterone synthesis in primary or late-onset hypogonadism [Citation37]. Although it has been shown that autophagy participates in follicle atresia [Citation18,Citation38], its role in folliculogenesis has not been precisely determined.
Once autophagy is activated, the soluble LC3-I protein forms LC3-II through the covalent conjugation of phosphatidylethanolamine, which is crucial for the generation and elongation of the autophagosome [Citation39]. Therefore, the decreased LC3-II:LC3-I ratio indicates defective autophagy [Citation40]. SQSTM1/p62 (sequestosome 1), is an autophagic receptor and is widely used as a biomarker for autophagic flux. Its abnormal aggregation has been reported in cancers, skeletal and muscular disorders, and neurodegenerative diseases [Citation41]. In the current study, together with downregulation of six autophagy-related genes, including ATG5, BECN1, SIRT1, TRIM13, VMP1, and WDR45, the reduced LC3-II:LC3-I ratio and elevated SQSTM1 level indicated insufficient autophagy activity in the GCs of bPOI patients, which implies a potential contribution of autophagy dysregulation to POI pathology.
The proper proliferation and differentiation of the surrounding GCs is essential for oocyte development and maturation [Citation6]. Up to the preantral stage, GCs respond to FSH (follicle stimulating hormone) and upregulate CYP19A1, thus obtaining the capacity to produce E2, which is a landmark for the differentiation and maturation of GCs [Citation4]. Notably, E2 is one of the most important sex hormones in women and plays a crucial role in promoting follicular development [Citation42]. Autophagy has been reported to participate in the regulation of GC physiology involving FSH function. FSH not only promoted autophagy of GCs by upregulating HIF1A/HIF-1α, and protected GCs from the hypoxia stress caused by rapid proliferation [Citation43], but also could reduce the excessive autophagy mediated by oxidative stress and maintain the survival of GCs [Citation44]. In this study, we found decreased expression of CYP19A1 and FSHR as well as impaired E2 synthesis in autophagy-inhibited GCs, which indicated abnormal differentiation of GCs and adverse effects on female reproduction [Citation45]. A previous study used Cyp19a1-Cre to knockout the Becn1 gene in mice, and observed insufficient progesterone synthesis but no obvious abnormality in follicle development and E2 levels [Citation22], which might be attributed to the expression of Cyp19a1-Cre in a relatively late stage of GC differentiation and the inadequate depletion of BECN1. Future studies could use early-expressed Cre enzymes in GCs, for example, Amh-Cre, to knock out key Atg genes such as Atg5 or Becn1 to illuminate the role of autophagy in the differentiation of GCs in vivo.
As a transcription factor specifically expressed in ovarian GCs, WT1 is gradually downregulated over the course of follicular maturation. It has been reported that WT1 plays an inhibitory role in GC differentiation, and Wt1 mutations lead to premature differentiation of mouse GCs and aberrant follicle development by transcriptionally upregulating the expression of FSHR, CYP19A1, and HSD3B [Citation27]. Accordingly, we previously identified two missense mutations in the WT1 gene in POI patients and demonstrated that these two mutations abolished the inhibitory effects of WT1 on the expression of marker genes of GC differentiation, including FSHR and CYP19A1 [Citation46]. A recent study also showed that inactivation of Wt1 upregulated the mRNA levels of steroidogenesis-associated genes, such as Hsd3b, Cyp11a1, Star, and Nr5a1, resulting in ovarian development disorder [Citation47]. In this study, the level of WT1 was also negatively correlated with the expression of CYP19A1 and FSHR, which further suggested that WT1 inhibited the differentiation of GCs by regulating the expression of its downstream target genes. However, no detection of LHCGR expression or progesterone synthesis strongly suggested that inhibition of autophagy mainly impaired the early differentiation of GCs rather than the late stage of luteinization. We next determined that impaired differentiation of GCs was attributed to WT1 aggregation in autophagy-deficient GCs, because this differentiational dysfunction could be partially rescued by knockdown of WT1 expression in CQ-pretreated GCs. We further demonstrated that activation of autophagy by RAP could promote the differentiation of GCs with decreased WT1, suggesting that autophagy affects the differentiation of GCs by regulating the expression of WT1. Therefore, we conclude that autophagy plays an essential role in the differentiation of GCs by regulating the WT1 level.
In this study, our findings further identified the insufficient degradation of WT1 protein and its accumulation in the nucleus upon autophagy inhibition, which indicates that autophagy is involved in the regulation of the stability of nuclear protein WT1. Although autophagy mainly occurs in the cytoplasm, the important role of autophagy in maintaining nuclear components has also been demonstrated [Citation48]. When the nuclear import of WT1 was blocked pharmacologically, more obvious co-localization of the aggregated WT1 protein and SQSTM1 was observed in the cytoplasm, which could be regarded as evidence for the autophagic degradation of WT1. Based on the conserved LIR motif in the WT1 protein, the degradation of WT1 might be mediated by a selective autophagy pathway. As expected, once this LIR motif of WT1 was mutated, the clearance of WT1 protein was dramatically delayed and the interaction between WT1 and LC3 was attenuated. Therefore, we have revealed a specific mechanism of WT1 protein degradation mediated by the autophagy-lysosome pathway that is important for the proper differentiation of GCs during follicle development.
In summary, we have elucidated the underlying mechanism of autophagy in GC differentiation by regulating WT1 degradation and revealed decreased autophagy levels in the GCs of bPOI patients. Our study clarifies that normal cellular autophagy is critical for GC development and suggests that insufficient autophagy may play a role in ovarian dysfunction.
Materials and methods
Cell culture and transfection
The steroidogenic GC-like tumor cell line KGN [Citation49] was obtained from RIKEN BioResource Center (RCB1154) and cultured with DMEM/F12 (HyClone, SH30023.01) containing 10% FBS (Biological Industries, 04–001-1A) and 1% penicillin-streptomycin (HyClone, SV30010) at 37°C in a humidified atmosphere of 5% CO2. The siRNAs for silencing the expression of ATG5, BECN1, and WT1, as well as negative control siRNA, were designed and produced by Genepharma Inc. (Shanghai, China) and were transfected using Lipofectamine 3000 Reagent (Thermo Fisher Scientific, L3000015) into KGN cells at 80 nM or 100 nM when the cell confluence reached 80%. Information about all siRNAs used in this study is provided in Table S3.
The HEK293T cells (BMCR, 3101HUMSCSP502) were cultured at 37°C in a humidified atmosphere of 5% CO2 in high-glucose DMEM medium (HyClone, SH30243.01) supplemented with 10% FBS (Biological Industries, 04–001-1A) and 1% penicillin-streptomycin (HyClone, SV30010). The plasmids were transfected into HEK293T cells using X-treme GENE HP DNA Transfection Reagent (Roche, 06336236001).
Animals
Three-week-old C57bl/6J female mice were obtained from the Experimental Animal Center of Shandong University. All efforts were made to minimize the pain and suffering of the mice during all the procedures in accordance with the ethical guidelines approved by Animal Care and Research Committee of Shandong University.
Isolation and culture of mouse GCs
In each experiment, a total of six 3-week-old mice were intraperitoneally injected with 5 IU PMSG (Ningbo Sansheng, 110914564). After 24 h, the mice were sacrificed and their ovaries were rapidly isolated under aseptic conditions. To release GCs, all of these ovaries were pooled together and carefully pricked by an insulin injector needle. The GCs were collected by centrifugation and equally divided into the autophagy-inhibition group and the control group, and were further cultured in DMEM/F12 supplemented with 5% FBS and 1% penicillin-streptomycin in a humidified atmosphere of 5% CO2 at 37°C. After 12 h, the GCs were adherent and ready for subsequent treatment. Three independent experiments were conducted.
Inhibition and activation of autophagy
To inhibit autophagy in vitro, KGN cells and mouse GCs were incubated in complete medium containing 50 μM CQ (Sigma, C6628) for 48 h. For the WT1 rescue experiments, after transfection with WT1 siRNAs (siWT1 or siWT1#2) in KGN cells for 48 h, incubation with 50 μM CQ was used to block autophagy in KGN cells. For autophagy activation, KGN cells were treated with 1 μM rapamycin (RAP; Abcam, 53123–88-9) dissolved in complete medium, and HEK293T cells were provided with culture medium containing 100 nM RAP. For inhibition of autophagy in vivo, a total of five mice were injected intraperitoneally with CQ (20 mg/kg body weight) dissolved in PBS (Sangon, B548117-0500) once a day for five days, whereas five control mice were injected with an equivalent volume of PBS only.
LC3 fluorescence microscopy
The autophagic flux was monitored as previously reported [Citation50]. Firstly, KGN cells were transfected with siRNAs (NC, siATG5, siATG5#2, siBECN1, siBECN1#2). After 24 h, infection with the tandem mRFP-GFP-LC3 reporter adenovirus (GeneChem, GTCA1431079923QA) was performed according to the manufacturer’s protocol. After 48 h, the cells were starved with serum-free medium for 6 h. Cell nuclei were stained with Hoechst 33342 (Beyotime, C1029) for 10 min, and the images were captured by a fluorescence microscope (Olympus, Japan).
Adenovirus infection
The recombinant adenoviruses for overexpressing WT1 were provided by Cyagen (Suzhou, China). For infecting KGN cells in vitro, a titer of 2 × 10⁷ plaque-forming units/ml was used.
RNA extraction and quantitative RT-PCR
Total RNA of all samples was extracted with Trizol reagent (Thermo Fisher Scientific, 15596026) with phenol-chloroform precipitation. Total RNA was then reverse transcribed to cDNA using the PrimeScript RT Reagent Kit (Takara, RR047A). The validation of gene expression was performed by real-time polymerase chain reactions following the instructions provided with the LightCycler 480 SYBR Green I Master Mix (Roche, 4707516001) using a LightCycler 480 (Roche, Switzerland). GAPDH was used as the internal control. Data analysis was carried out using the 2−ΔΔCt method. The primers used for qRT-PCR are listed in Table S4.
Protein extraction and Western blot
For the cultured cells and mouse ovaries, total protein was harvested with RIPA Lysis Buffer (Beyotime, P0013B), whereas the total protein of human GCs was extracted from the remaining parts after RNA extraction using Trizol reagent according to the manufacturer’s protocol (Thermo Fisher Scientific, 15596026). The protein concentration was determined using a BCA kit (Thermo Fisher Scientific, 23225). The protein components were separated using SDS-PAGE and transferred to polyvinylidene fluoride membranes (Millipore, IPVH00010). After blocking with 5% skim milk or 5% bovine serum albumin (BSA; Solarbio, A8010), the membranes were incubated with diverse primary antibodies overnight at 4°C and then incubated with horseradish peroxidase-labeled goat anti-mouse or anti-rabbit secondary antibodies for 1 h at room temperature. The detection and analysis of the immunoreactive bands was performed using a ChemiDoc MP imaging system (Bio-Rad, USA). Detailed information on the antibodies used for Western blot is listed in .
Table 1. Antibody information.
CCK8 assay
KGN cells with siRNA transfection or CQ treatment for 48 h were collected and reseeded in 96-well plates for the Cell Counting Kit-8 assay (CCK8; Beyotime, C0042) according to the manufacturer’s instructions.
EdU assay
KGN cells with inhibition of autophagy (by siRNA transfection or CQ treatment) were reseeded in 96-well plates for the EdU assay using a Cell-Light EdU Apollo 567 In Vitro system (Ribobic, C10310-1) according to the manufacturer’s instructions.
Hormone measurement
For E2 detection, DMEM/F-12 without Phenol Red (Gibco, 11039021) and charcoal-stripped FBS (Biological Industries, 04–201-1A) were used. KGN cells were transfected with siRNA or pretreated with CQ or RAP for 48 h, while mouse GCs were pretreated with CQ for 48 h. The cells were then incubated in culture medium containing 10 nM testosterone (Sigma, T1500). After 24 h, the supernatant was collected for E2 detection by electrochemistry, and all remaining cells were collected to extract total protein and to determine the concentration using the BCA kit. Finally, E2 production was evaluated after being normalized to the total amount of protein. For the in vivo analysis, after injection of CQ for 5 days, mice were sacrificed and blood was collected. The blood samples were immediately placed at 4°C and incubated overnight and centrifuged at 1057 × g at 4°C to separate the supernatant. The E2 concentration was measured by radioimmunoassay (Beijing North Institute of Biotechnology, China).
Cycloheximide chase assay
After being transfected with siRNA or pretreated with CQ for 48 h, KGN cells were supplied with culture medium containing 100 ng/ml cycloheximide (CHX; Meilunbio, M0110A) for blocking the translation of new proteins. For HEK293T cells, after transfection with WT1 (WT/Mut) plasmids for 36 h, 100 nM RAP was added to the culture medium, and 12 h later 100 ng/ml CHX was used to inhibit de novo protein synthesis. Cells were harvested for protein extraction at different time points after treatment with CHX, and Western blot was used to detect WT1 protein. Protein degradation rates were obtained and plotted by calculating the WT1:GAPDH ratio.
Separation of nuclear and cytoplasmic proteins
The KGN cells were seeded in 6-cm dishes and autophagy was inhibited by CQ treatment for 48 h. After washing with PBS, the cells were immediately plated on ice. The separated proteins in the nucleus and cytoplasm were acquired following the protocol of the PARIS Kit (Thermo Fisher Scientific, AM1921).
Immunofluorescence
The isolated mouse ovaries were fixed in Bouin’s solution (Sigma, HT10132) and then embedded in paraffin. The ovaries were cut into 5-μm sections and stained with primary and secondary antibodies following standard protocols (). DAPI was used to stain the nuclei. The sections were observed under a fluorescence microscope (Olympus, Japan). For cellular immunofluorescence, KGN cells were seeded on glass cover slips. Following fixation in 4% PFA, the staining was performed as detailed above.
Plasmids
The expression plasmids pcDNA3.1-GFP-LC3, pcDNA3.1–3×Flag-WT1, and pcDNA3.1–3×Flag-WT1-Y407A/L410A were constructed by the Youbio Company (Hunan, China). The gene coding sequences and desired mutations were confirmed by Sanger sequencing.
Inhibition of nuclear import
After transfection with wild-type WT1 plasmids for 48 h, HEK293T cells were reseeded on coverslips and treated with 25 μM CQ and/or 0.2 μM ivermectin (IVM; Sigma, 70288–86-7), which inhibited the processes of autophagy and nuclear import, respectively. Cells were collected 24 h later for immunofluorescence staining of FLAG (WT1) and SQSTM1 proteins.
Co-immunoprecipitation (Co-IP) assay
The Co-IP assay for WT1 and LC3 was performed after plasmid transfection for 48 h. The transfected HEK293T cells were quickly washed in cold PBS twice and lysed in NP-40 (Beyotime, P0013F) lysis buffer (50 mM Tris, pH 7.4, 150 mM NaCl, 1% NP-40) at 4°C for 30 min, and then centrifuged at 14,000 × g for 10 min to harvest the supernatant. Next, the protein concentration was determined using a BCA kit (Thermo Fisher Scientific, 23225) according to the instructions. The samples as input were directly separated for detection. A total of 0.75 mg of protein was used in each Co-IP assay, and all lysate samples were incubated at room temperature with Anti-FLAG antibody (Millipore, F3165) or anti-IgG mouse antibody and Protein A/G Magnetic Beads (Millipore, 16–663) overnight. After washing three times in IP Lysis Buffer (Thermo Fisher Scientific, PI87787), the immunoprecipitates were resuspended with loading buffer and degenerated for 10 min at 100°C for further Western blot assays.
Patients
The bPOI patients and control women were recruited from the Reproductive Hospital affiliated to Shandong University. The inclusion criteria for bPOI patients were basal serum FSH ≥10 IU/L, AMH <1.1 ng/ml, <40 years of age, regularly periodic menstruation (23–35 days), and antral follicle counts <5 unilaterally. Women with serum FSH <10 IU/L and regular menstruation who sought IVF treatment due to tubal obstruction or male disorders were enrolled as the control group. Any women who were diagnosed with chromosomal abnormalities or autoimmune disorders or with a history of ovarian surgery, radiotherapy, or chemotherapy were excluded. All of the participants involved in this study signed an informed consent, and the study was approved by the Institutional Review Board of the Center for Reproductive Medicine, Shandong University.
Human GC isolation and culture
On the day of oocyte retrieval, after the cumulus cells tightly surrounding the oocytes were transferred together with oocytes for subsequent fertilization or preservation, the follicular fluid of large follicles (>14 mm) containing mural GCs was collected from the participants, and the precipitates were harvested after centrifugation followed by incubation with hyaluronidase (80 IU/ml; Solarbio, 37326–33-3) for 30 min at 37°C. The components were then transferred into lymphocyte separation medium (MP Biomedicals, 0850494X) for horizontal centrifugation at 400 × g for 10 min. Once isolated from the interlayer phase, the GCs were washed in phosphate buffered saline (PBS) and were seeded in the dishes for further culture with DMEM/F12 containing 10% FBS and 1% penicillin-streptomycin at 37°C in a humidified atmosphere of 5% CO2.
Microarray analysis
The mRNA and LncRNA expression profiling assays of the GCs from 10 bPOI patients and 10 controls were conducted using Arraystar Human LncRNA Microarrays V3.0 covering a total of 26,109 protein-coding transcripts (GSE135697) (Arraystar, USA) [Citation51]. Both of the microarray experiments and data analyses were carried out by KangChen Bio-tech (Shanghai, China).
Statistical analysis
The statistical analyses were performed with SPSS 16.0 software (IBM, USA). All data are presented as mean ± SD. Unless otherwise noted, the differences between groups were analyzed by two-tailed unpaired Students’ t-test. For the non-normally distributed data, the Mann-Whitney U-test was used. The differences were considered to be significantly different when the P-value was less than 0.05.
Supplemental Material
Download MS Word (2.7 MB)Disclosure statement
No potential conflict of interest was reported by the author(s).
Supplementary material
Supplemental data for this article can be accessed here
Additional information
Funding
References
- McGee EA, Hsueh AJ, et al. Initial and cyclic recruitment of ovarian follicles. Endocr Rev. 2000;21(2):200–214.
- Robker RL, Hennebold JD, Russell DL, et al. Coordination of ovulation and oocyte maturation: a good egg at the right time. Endocrinology. 2018;159(9):3209–3218.
- Regan SLP, Knight PG, Yovich JL, et al. Granulosa cell apoptosis in the ovarian follicle-A changing view. Front Endocrinol (Lausanne). 2018;9:61.
- Matsuda F, Inoue N, Manabe N, et al. Follicular growth and atresia in mammalian ovaries: regulation by survival and death of granulosa cells. J Reprod Dev. 2012;58(1):44–50.
- Hsueh AJ, Kawamura K, Cheng Y, et al. Intraovarian control of early folliculogenesis. Endocr Rev. 2015;36(1):1–24.
- Johnson AL. Ovarian follicle selection and granulosa cell differentiation. Poult Sci. 2015;94(4):781–785.
- Baumgarten SC, Convissar SM, Zamah AM, et al. FSH regulates IGF-2 expression in human granulosa cells in an AKT-dependent manner. J Clin Endocrinol Metab. 2015;100(8):E1046–1055.
- Bennett J, Baumgarten SC, Stocco C, et al. GATA4 and GATA6 silencing in ovarian granulosa cells affects levels of mRNAs involved in steroidogenesis, extracellular structure organization, IGF-I activity, and apoptosis. Endocrinology. 2013;154(12):4845–4858.
- Herndon MK, Law NC, Donaubauer EM, et al. Forkhead box O member FOXO1 regulates the majority of follicle-stimulating hormone responsive genes in ovarian granulosa cells. Mol Cell Endocrinol. 2016;434:116–126.
- Mizushima N, Komatsu M. Autophagy: renovation of cells and tissues. Cell. 2011;147(4):728–741.
- Yin Z, Pascual C, Klionsky DJ, et al. Autophagy: machinery and regulation. Microb Cell. 2016;3(12):588–596.
- Pyo JO, Nah J, Jung YK, et al. Molecules and their functions in autophagy. Exp Mol Med. 2012;44(2):73–80.
- Yu L, Chen Y, Tooze SA, et al. Autophagy pathway: cellular and molecular mechanisms. Autophagy. 2018;14(2):207–215.
- Ravanan P, Srikumar IF, Talwar P, et al. Autophagy: the spotlight for cellular stress responses. Life Sci. 2017;188:53–67.
- Mizushima N, Levine B, Longo DL, et al. Autophagy in human diseases. N Engl J Med. 2020;383(16):1564–1576.
- Mizushima N. A brief history of autophagy from cell biology to physiology and disease. Nat Cell Biol. 2018;20(5):521–527.
- Choi AM, Ryter SW, Levine B, et al. Autophagy in human health and disease. N Engl J Med. 2013;368(7):651–662.
- Gao H, Khawar MB, Li W, et al. Essential role of autophagy in resource allocation during sexual reproduction. Autophagy. 2020;16(1):18–27.
- Peters AE, Mihalas BP, Bromfield EG, et al. Autophagy in female fertility: a role in oxidative stress and aging. Antioxid Redox Signal. 2020;32(8):550–568.
- Choi J, Jo M, Lee E, et al. Induction of apoptotic cell death via accumulation of autophagosomes in rat granulosa cells. Fertil Steril. 2011;95(4):1482–1486.
- Choi J, Jo M, Lee E, et al. AKT is involved in granulosa cell autophagy regulation via mTOR signaling during rat follicular development and atresia. Reproduction. 2014;147(1):73–80.
- Gawriluk TR, Ko C, Hong X, et al. Beclin-1 deficiency in the murine ovary results in the reduction of progesterone production to promote preterm labor. Proc Natl Acad Sci U S A. 2014;111(40):E4194–4203.
- Li R, Albertini DF. The road to maturation: somatic cell interaction and self-organization of the mammalian oocyte. Nat Rev Mol Cell Biol. 2013;14(3):141–152.
- Feng L, Ma Y, Sun J, et al. YY1-MIR372-SQSTM1 regulatory axis in autophagy. Autophagy. 2014;10(8):1442–1453.
- Zhou J, Li C, Yao W, et al. Hypoxia-inducible factor-1alpha-dependent autophagy plays a role in glycolysis switch in mouse granulosa cells. Biol Reprod. 2018;99(2):308–318.
- Stocco C, Telleria C, Gibori G, et al. The molecular control of corpus luteum formation, function, and regression. Endocr Rev. 2007;28(1):117–149.
- Gao F, Zhang J, Wang X, et al. Wt1 functions in ovarian follicle development by regulating granulosa cell differentiation. Hum Mol Genet. 2014;23(2):333–341.
- Park J, Kim DH, Shah SR, et al. Switch-like enhancement of epithelial-mesenchymal transition by YAP through feedback regulation of WT1 and Rho-family GTPases. Nat Commun. 2019;10(1):2797.
- Dietachmayr M, Rathakrishnan A, Karpiuk O, et al. Antagonistic activities of CDC14B and CDK1 on USP9X regulate WT1-dependent mitotic transcription and survival. Nat Commun. 2020;11(1):1268.
- Birgisdottir AB, Lamark T, Johansen T, et al. The LIR motif - crucial for selective autophagy. J Cell Sci. 2013;126(Pt 15):3237–3247.
- Jiao X, Zhang H, Ke H, et al. Premature ovarian insufficiency: phenotypic characterization within different etiologies. J Clin Endocrinol Metab. 2017;102(7):2281–2290.
- De Vos M, Devroey P, Fauser BCJM, et al. Primary ovarian insufficiency. Lancet. 2010;376(9744):911–921.
- Welt CK. Primary ovarian insufficiency: a more accurate term for premature ovarian failure. Clin Endocrinol (Oxf). 2008;68(4):499–509.
- Allen EA, Baehrecke EH. Autophagy in animal development. Cell Death Differ. 2020;27(3):903–918.
- Green DR, Levine B. To be or not to be? How selective autophagy and cell death govern cell fate. Cell. 2014;157(1):65–75.
- Shang Y, Wang H, Jia P, et al. Autophagy regulates spermatid differentiation via degradation of PDLIM1. Autophagy. 2016;12(9):1575–1592.
- Gao F, Li G, Liu C, et al. Autophagy regulates testosterone synthesis by facilitating cholesterol uptake in Leydig cells. J Cell Biol. 2018;217(6):2103–2119.
- Zhou J, Peng X, Mei S, et al. Autophagy in ovarian follicular development and atresia. Int J Biol Sci. 2019;15(4):726–737.
- Rodriguez-Arribas M, Yakhine-Diop SM, Gonzalez-Polo RA, et al. Turnover of lipidated LC3 and autophagic cargoes in mammalian cells. Methods Enzymol. 2017;587:55–70.
- Schaaf MB, Keulers TG, Vooijs MA, et al. LC3/GABARAP family proteins: autophagy-(un)related functions. FASEB J. 2016;30(12):3961–3978.
- Sanchez-Martin P, Komatsu M. p62/SQSTM1 - steering the cell through health and disease. J Cell Sci. 2018;131(21):jcs222836.
- Sugiura K, Su YQ, Li Q, et al. Estrogen promotes the development of mouse cumulus cells in coordination with oocyte-derived GDF9 and BMP15. Mol Endocrinol. 2010;24(12):2303–2314.
- Zhou J, Yao W, Li C, et al. Administration of follicle-stimulating hormone induces autophagy via upregulation of HIF-1alpha in mouse granulosa cells. Cell Death Dis. 2017;8(8):e3001.
- Shen M, Jiang Y, Guan Z, et al. Protective mechanism of FSH against oxidative damage in mouse ovarian granulosa cells by repressing autophagy. Autophagy. 2017;13(8):1364–1385.
- Dierich A, Sairam MR, Monaco L, et al. Impairing follicle-stimulating hormone (FSH) signaling in vivo: targeted disruption of the FSH receptor leads to aberrant gametogenesis and hormonal imbalance. Proc Natl Acad Sci U S A. 1998;95(23):13612–13617.
- Wang H, Li G, Zhang J, et al. Novel WT1 missense mutations in Han Chinese women with premature ovarian failure. Sci Rep. 2015;5(1):13983.
- Cen C, Chen M, Zhou J, et al. Inactivation of Wt1 causes pre-granulosa cell to steroidogenic cell transformation and defect of ovary development. Biol Reprod. 2020;103(1):60–69.
- Anding AL, Baehrecke EH. Cleaning house: selective autophagy of organelles. Dev Cell. 2017;41(1):10–22.
- Nishi Y, Yanase T, Mu Y, et al. Establishment and characterization of a steroidogenic human granulosa-like tumor cell line, KGN, that expresses functional follicle-stimulating hormone receptor. Endocrinology. 2001;142(1):437–445.
- Klionsky DJ, Abdel-Aziz AK, Abdelfatah S, et al. Guidelines for the use and interpretation of assays for monitoring autophagy (4th edition). Autophagy. 2021;17(1):1–382.
- Wang X, Zhang X, Dang Y, et al. Long noncoding RNA HCP5 participates in premature ovarian insufficiency by transcriptionally regulating MSH5 and DNA damage repair via YB1. Nucleic Acids Res. 2020;48(8):4480–4491.