
 ?Mathematical formulae have been encoded as MathML and are displayed in this HTML version using MathJax in order to improve their display. Uncheck the box to turn MathJax off. This feature requires Javascript. Click on a formula to zoom.
ABSTRACT
Mitophagy is a type of selective macroautophagy/autophagy that degrades dysfunctional or excessive mitochondria. Regulation of this process is critical for maintaining cellular homeostasis and has been closely implicated in acquired drug resistance. However, the regulatory mechanisms and influences of mitophagy in cancer are still unclear. Here, we reported that inhibition of CDK9 blocked PINK1-PRKN-mediated mitophagy in HCC (hepatocellular carcinoma) by interrupting mitophagy initiation. We demonstrated that CDK9 inhibitors promoted dephosphorylation of SIRT1 and promoted FOXO3 protein degradation, which was regulated by its acetylation, leading to the transcriptional repression of FOXO3-driven BNIP3 and impairing the BNIP3-mediated stability of the PINK1 protein. Lysosomal degradation inhibitors could not rescue mitophagy flux blocked by CDK9 inhibitors. Thus, CDK9 inhibitors inactivated the SIRT1-FOXO3-BNIP3 axis and PINK1-PRKN pathway to subsequently block mitophagy initiation. Moreover, CDK9 inhibitors facilitated mitochondrial dysfunction. The dual effects of CDK9 inhibitors resulted in the destruction of mitochondrial homeostasis and cell death in HCC. Importantly, a novel CDK9 inhibitor, oroxylin A (OA), from Scutellaria baicalensis was investigated, and it showed strong therapeutic potential against HCC and a striking capacity to overcome drug resistance by downregulating PINK1-PRKN-mediated mitophagy. Additionally, because of the moderate and controlled inhibition of CDK9, OA not led to extreme repression of general transcription and appeared to overcome the inconsistent anti-HCC efficacy and high normal tissue toxicity that was associated with existing CDK9 inhibitors. All of the findings reveal that mitophagy disruption is a promising strategy for HCC treatment and OA is a potential candidate for the development of mitophagy inhibitors.
Abbreviations: BNIP3: BCL2 interacting protein 3; CCCP: carbonyl cyanide p-trichloromethoxy-phenylhydrazone; CDK9: cyclin dependent kinase 9; CHX: cycloheximide; CQ, chloroquine; DFP: deferiprone; DOX: doxorubicin; EBSS: Earle’s balanced salt solution; E64d: aloxistatin; FOXO3: forkhead box O3; HCC: hepatocellular carcinoma; HepG2/ADR: adriamycin-resistant HepG2 cells; MMP: mitochondrial membrane potential; mito-Keima: mitochondria-targeted and pH-sensitive fluorescent protein; MitoSOX: mitochondrial reactive oxygen species; OA: oroxylin A; PB: phosphate buffer; PDX: patient-derived tumor xenograft; PINK1: PTEN induced kinase 1; POLR2A: RNA polymerase II subunit A; p-POLR2A-S2: Ser2 phosphorylation of RNA polymerase II subunit A; PRKN: parkin RBR E3 ubiquitin protein ligase; SIRT1: sirtuin 1.
Introduction
Macroautophagy/autophagy is a catabolic pathway that mediates the degradation and recycling of intracellular components, including whole organelles, to sustain cell homeostasis [Citation1]. Mitophagy is a type of selective macroautophagy that primarily eliminates damaged or dysfunctional mitochondria through the autophagosome-lysosome system [Citation2,Citation3]. Increasing evidence has shown that mitochondrial renewal via mitophagy plays a critical role in determining cancer functionality and fate [Citation4–6]. Tumor cells rely on healthy mitochondria to promote their growth under changing microenvironmental stresses [Citation7]. It has been reported that hepatocytes are enriched with mitochondria, which comprise 13 ~ 20% of the liver volume [Citation8]. Thus, mitochondrial status is especially important for the development of hepatocellular carcinoma (HCC). Recently, a growing consensus has suggested that mitochondrial injury mediated by chemotherapy and targeted agents is attenuated due to increased mitophagy, which is closely associated with tumor therapeutic resistance and recurrence [Citation9–12]. However, the roles and underlying regulatory mechanisms of mitophagy with these anticancer drugs remain largely unclear.
Traditionally, it has been understood that mitophagy is mainly mediated by two molecular pathways. One pathway is activated via HIF1A/HIF-1a (hypoxia inducible factor 1 subunit alpha), and the core components include BNIP3 (BCL2 interacting protein 3), BNIP3L/NIX (BCL2 interacting protein 3 like), and FUNDC1 (FUN14 domain containing 1). The other pathway is the PINK1 (PTEN induced kinase 1)-PRKN (parkin RBR E3 ubiquitin protein ligase) pathway, which is triggered by membrane depolarization [Citation13]. BNIP3 is highly expressed in the liver and directly interacts with MAP1LC3A to initiate mitophagy [Citation3]. Under normal conditions, PINK1 localizes to the mitochondria and translocates to the mitochondrial inner membrane, where it is cleaved by the mitochondrial protease PARL (presenilin associated rhomboid like) and subsequently degraded [Citation14]. Conversely, if the mitochondrial membrane potential (MMP) dissipates, PINK1 stabilizes on the outer membrane of the mitochondria (OMM) and recruits cytosolic PRKN, which is an E3 ubiquitin ligase that ubiquitinates numerous outer membrane of the mitochondria (OMM) proteins, leading to mitophagy [Citation15].
Recently, many reports have shown that wild-type TP53/p53 is an important regulator of mitophagy. TP53 facilitates mitochondrial dysfunction and disturbs the clearance of damaged mitochondria by mitophagy [Citation16,Citation17]. In turn, mitophagy promotes hepatic cancer stem cell (CSC) population maintenance by removing the TP53 protein [Citation18]. CDK9 (cyclin dependent kinase 9) is the catalytic subunit of the transcription elongation factor P-TEFb and is considered a potential target for cancer therapy [Citation19]. In previous studies, we find that CDK9 promotes TP53 stability by suppressing the deacetylation activity of SIRT1 (sirtuin 1) in HCC cells [Citation20]. SIRT1 is an important NAD-dependent deacetylase that plays critical roles in maintaining mitochondrial function, promoting mitochondrial biogenesis and regulating the autophagy–lysosome pathway [Citation21,Citation22]. SIRT1 directly interacts with the transcription factor FOXO3 (forkhead box O3) and mediates its deacetylation [Citation23,Citation24]. It has been reported that FOXO3 also regulates mitochondrial function and integrity by binding to the BNIP3 upstream promoter region and increasing BNIP3 expression [Citation25]. Therefore, CDK9 may be closely associated with the regulation of mitochondrial function and mitophagy. Thus, it is meaningful to explore the underlying mechanism by which CDK9 regulates cancer cell mitophagy.
In this work, we uncovered the underlying regulatory mechanism of CDK9 inhibitors during PINK1-PRKN-mediated mitophagy of HCC cells. Furthermore, a new mitophagy inhibitor named oroxylin A (OA), which is one of the main bioactive flavonoids of Scutellariae radix, was developed. OA is a moderate and controlled CDK9 inhibitor that shows great therapeutic potential against HCC but low toxicity to normal cells [Citation20]. Importantly, OA could overcome HCC drug resistance by suppressing mitophagy. Our study facilitates an understanding of the pathological roles played by mitophagy during HCC treatment and provides strong evidence for a novel strategy targeting the proteins of the mitophagy disruption machinery.
Results
Inhibition of CDK9 induces mitochondrial dysfunction and blocks mitochondrial renewal by suppressing mitophagy
Since the regulation of CDK9 in mitochondrial function and cancer cell mitophagy is still unclear, we investigated the influence of CDK9 on mitochondrial activity in the HCC cell line HepG2 by using the CDK9-specific inhibitor LDC067. MitoSOX (mitochondrial reactive oxygen species) and MMP are key indicators of mitochondrial activity because they reflect the processes of electron transport and oxidative phosphorylation, which are the driving forces behind ATP production in both biological processes and human cancer pathogenesis [Citation26]. Inhibition of CDK9 by LDC067 increased the generation of MitoSOX ( and 1B) and significantly decreased the MMP (), suggesting that LDC067 caused mitochondrial damage and suppressed mitochondrial activity. Normally, dysfunctional mitochondria undergo mitophagy to promote mitochondrial turnover and maintain mitochondrial homeostasis. However, the CDK9 inhibitor LDC067 notably downregulated the protein expression of the autophagosome marker MAP1LC3A-II (). Thus, we hypothesized that inhibition of CDK9 induced substantial mitochondrial damage in HCC cells while suppressing mitophagy. CCCP (carbonyl cyanide 3-chlorophenylhydrazone), a mitochondrial protonophore, has been shown to lead to PRKN-dependent mitophagy [Citation27]. Confocal fluorescence imaging showed that CCCP induced the aggregation of the protein MAP1LC3A around the mitochondria (Figure S1), but LDC067 suppressed this CCCP-induced aggregation (). Both MitoTracker Red and MitoTracker Green stain mitochondria in live cells. The accumulation of MitoTracker Red is dependent upon membrane potential, but MitoTracker Green accumulation is potential independent. Thus, the ratio of MitoTracker Red staining to MitoTracker Green staining reveals the proportion of healthy mitochondria. LDC067 induced mitochondrial depolarization, significantly decreased the ratio of MitoTracker Red to MitoTracker Green staining and aggravated the accumulation of damaged mitochondria in the presence of CCCP (). We then detected the ultrastructure of the mitochondria by TEM (transmission electron microscopy). As shown in , LDC067 caused the accumulation of many damaged mitochondria in HepG2 cells, which displayed matrix swelling and vacuoles (marked with red arrows). CCCP induced mitochondrial dysfunction as well as mitophagy (the mitochondria were surrounded by autophagic vesicles marked as white arrows). Cotreatment of LDC067 and CCCP reduced CCCP-induced mitophagy. Moreover, we measured mitophagic activity by using a mitochondria- targeted and pH-sensitive fluorescent protein (mito-Keima). The acidic autolysosomes cause the excitation of the mito-Keima fluorescent protein to change from 440 nm to 590 nm, and the fluorescent dots at 590 nm can be used to quantify mitophagic activity [Citation28,Citation29]. Compared with the CCCP-induced large acidic puncta, fewer fluorescent dots at 590 nm were observed upon LDC067 treatment, suggesting that LDC067 suppressed the mitophagic activity of HepG2 cells ().
Figure 1. Inhibition of CDK9 induces mitochondrial dysfunction and suppresses mitophagy. (A) HepG2 cells were treated with LDC067 for 24 h. Levels of MitoSOX were measured by flow cytometry. (B) MitoSOX levels were observed by confocal microscopy (15 μM LDC067, 600×, scale bar: 50 μm). (C) MMP was measured using MitoProbe JC-1 by flow cytometry. The ratio of red to green fluorescence intensity, which indicated the level of mitochondrial membrane potential, was quantified. (D) Protein expression of MAP1LC3A, including the MAP1LC3A-I (soluble), and the MAP1LC3A-II (membrane bound) form, was determined by Western blot. Protein expression of the MAP1LC3A-II form was quantified and normalized to ACTB (β-actin). (E-H) HepG2 cells were treated with 15 μM LDC067 with or without 10 μM CCCP for 24 h. (E) MAP1LC3A and mitochondria (TOMM20 marked) were observed by confocal microscopy imaging (1000×, scale bar: 50 μm). (F) MitoTracker Red and MitoTracker Green staining were measured by flow cytometry. The ratio of red to green fluorescence intensity, which indicated the number of heathy mitochondria, was quantified. (G) Detection of mitochondrial ultrastructure by TEM. Black arrow: normal mitochondria. White arrow: mitochondrial autophagosome. Red arrow: damaged mitochondria (mitochondria with swelling, broken cristae and vacuolation). The percent damaged mitochondria was quantified. (H) Fluorescent dots in HepG2 cells transfected with mito-Keima plasmid were observed by fluorescence microscopy (1000×, scale bar: 50 μm). The relative ratio of red to green fluorescence area per cell was quantified. (I) HepG2 cells were treated with 15 μM LDC067 with or without 20 nM bafilomycin A1 for 24 h. The protein levels of MAP1LC3A in whole cells, mitochondria and the cytoplasm were measured. The protein level of the MAP1LC3A-II form in mitochondria was quantified and normalized to COX4I1. (J) HepG2 cells were treated with 15 μM LDC067 for 24 h with or without pepstatin A and E64d (pepstatin A and E64d were both administered at a concentration of 10 μg/mL for 24 h). Then, the fluorescent dots from mito-Keima were observed by fluorescence microscopy (1000×, scale bar: 50 μm). The relative ratio of red to green fluorescence area per cell was quantified. Bar, SD. *P < 0.05 or **P < 0.01. “ns” means not significant (P > 0.05).
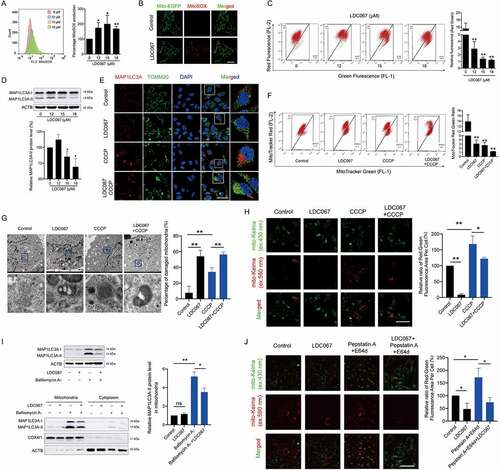
To determine whether the decrease in MAP1LC3A-II protein expression and MAP1LC3A aggregation around the mitochondria were caused by either a reduced engulfment of mitochondrial fragments by autolysosomes or the enhanced degradation of mitolysosomes, we further assayed the influences of LDC067 on mitophagic flux by using the lysosomal degradation inhibitors bafilomycin A1 and pepstatin A+ E64d (aloxistatin). The results showed that the CDK9 inhibitor LDC067 notably reduced the level of MAP1LC3A-II in the mitochondrial fractions in the presence of bafilomycin A1, which significantly promoted the mitochondrial accumulation of MAP1LC3A-II (). Since bafilomycin A1 blocks the fusion of autophagosomes with lysosomes, it use is not suitable in the mito-Keima probe assay [Citation30]. Therefore, we used the lysosomal proteinase inhibitor pepstatin A+ E64d to measure mitophagy flux. Pepstatin A+ E64d blocked mitophagic flux and increased the intensity of the mito-Keima fluorescent protein acidic puncta. However, pepstatin A+ E64d did not influence the suppression of mitophagic activity caused by LDC067, which still reduced the red fluorescence of mito-Keima in the presence of pepstatin A+ E64d (). Therefore, LDC067 did not accelerate the clearance of mitolysosomes but instead blocked mitophagic flux regardless of whether lysosomal degradation was suppressed. These results also suggested that CDK9 inhibition interrupted the initiation of mitophagy rather than inhibiting the degradation of mitophagosomes in the late phase.
Taken together, the inhibition of CDK9 promoted mitochondrial dysfunction and suppressed mitophagy, resulting in the accumulation of many damaged mitochondria in HepG2 cells.
Inhibition of CDK9 suppresses the initiation of mitophagy by disturbing the PINK1-PRKN pathway
PINK1-PRKN is a major pathway involved in mitophagy [Citation3]. Depolarized mitochondria recruit PINK1 and the E3 ubiquitin ligase PRKN, which ubiquitinates mitochondrial membrane proteins and mediates mitophagy [Citation31,Citation32]. Phosphorylation of POLR2A (RNA polymerase II subunit A), a specific substrate of CDK9, reflects CDK9 activity [Citation33]. LDC067 inhibited the p-POLR2A-S2 (Ser2 phosphorylation of POLR2A) without influencing CDK9 protein expression but downregulating PINK1 and PRKN protein expression (). Moreover, higher concentrations of LDC067 decreased the expression of PINK1 mRNA (), which might be caused by the extreme repression of the general transcription of LDC067 [Citation20]. When CDK9 expression was blocked by siRNA targeting CDK9 (siCDK9-315 and siCDK9-881), PINK1 expression decreased significantly as well ( and S2). Therefore, we hypothesized that inhibition of CDK9 suppressed mitophagy by regulating the PINK1-PRKN pathway. CCCP can induce PINK1-PRKN-dependent mitophagy [Citation27]. As shown in , CCCP strongly increased the levels of the PRKN and PINK1 proteins in mitochondria, whereas LDC067 inhibited the CCCP-induced accumulation of PINK1 and PRKN. In addition, LDC067 disturbed the binding between the proteins PINK1 and PRKN (), reduced their colocalization (), and weakened the CCCP-induced translocation of PRKN to the mitochondria (). Although LDC067 continued to strongly inhibit CDK9 activity, the decrease in the levels of p-POLR2A-S2 and PINK1 were weakened by the overexpression of CDK9 in LDC067-treated HepG2 cells, suggesting that the kinase activity of CDK9 is important for the regulation of PINK1-PRKN pathway (). The overexpression of PINK1 weakened the effects of LDC067 and recovered the protein expression of PRKN (). In addition to CCCP-induced mitophagy, we also used DFP (deferiprone; an iron-chelating drug) or EBSS (Earle’s balanced salt solution; causes amino acid starvation) to trigger mitophagy [Citation34] to investigate whether the CDK9 inhibitor LDC067 suppressed mitophagy induced by an alternative mechanism. As shown in Figure S3, after HepG2 cells were treated with 1 mM DFP or EBSS, the relative ratio of the red to green fluorescence areas of the mito-Keima protein suggested that DFP and EBSS strongly induced mitophagy; however, LDC067 failed to inhibit DFP- or EBSS-induced mitophagy. It has been reported that DFP- or EBSS-induced mitophagy is independent of PINK1 and PRKN [Citation34]. Thus, the mitophagy regulated by CDK9 was dependent on the PINK1-PRKN pathway. Inhibition of CDK9 blocked the initiation of mitophagy by downregulating PINK1 and subsequently suppressing the recruitment of PRKN to the mitochondria.
Figure 2. Inhibition of CDK9 suppresses mitophagy via regulation of the PINK1-PRKN pathway. (A and B) HepG2 cells were treated with LDC067 for 24 h. (A) Western blot analysis of protein expression. (B) Quantitative RT-PCR detection of PINK1 mRNA expression. (C) HepG2 cells were transfected with siRNA targeting CDK9 (siCDK9-315), and protein expression was analyzed by Western blot. (D) HepG2 cells were treated with 15 μM LDC067 with or without 10 μM CCCP for 24 h. Protein levels of PINK1 and PRKN in the cytoplasm and mitochondria were measured. Protein expression in the mitochondria was quantified and normalized to COX4I1. (E) The binding of PINK1 with PRKN in HepG2 cells treated with 15 μM LDC067 for 24 h was assayed by immunoprecipitation (IP). Quantitative analysis of PRKN expression normalized to PINK1 from the IP assay. (F and G) HepG2 cells treated with 15 μM LDC067 with or without 10 μM CCCP for 24 h. The colocalization of PINK1 with PRKN (F), and PRKN with mitochondria (TOMM20 marked) (G) was observed by confocal microscopy (1000×, scale bar: 50 μm). Colocalization areas per cell was quantified. (H and I) HepG2 cells were transfected with vectors encoding HA-CDK9 (H) or MYC-PINK1 (I) and then treated with 15 μM LDC067 for 24 h. Samples were immunoblotted for the indicated proteins. The indicated protein expression levels were quantified and normalized to ACTB. (J-L) HepG2 cell xenograft and PDX models were treated with physiological saline (control) or PHA767491 (20 mg/kg, i.v., once a day for 10 days). (J) Immunohistochemical detection of the CDK9, PINK1 and PRKN proteins in tumor tissues (400×, scale bar: 50 μm). (K and L) Tumor tissue immunofluorescence detected with PINK1, PRKN and TOMM20 antibodies (1000×, scale bar: 50 μm). Colocalization areas of PINK1 with PRKN and PRKN with mitochondria (TOMM20 marked) was quantified. Bar, SD. *P < 0.05 or **P < 0.01. “ns” means not significant (P > 0.05).
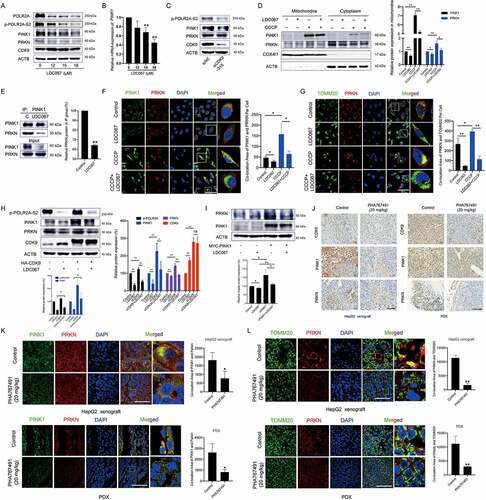
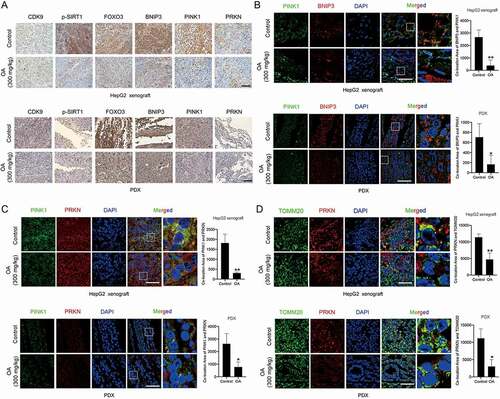
To further validate the influences of CDK9 inhibitors on PINK1-PRKN-mediated mitophagy in vivo, we performed immunohistochemical analysis to investigate the protein expression of CDK9, PINK1 and PRKN in tumor tissues from a HepG2-derived xenograft model and a PDX (patient-derived tumor xenograft) model. Because the in vivo lethality of LDC067 was so high, we used another CDK9 inhibitor, PHA767491, which has less toxicity in animal experiments. PHA767491 showed a weaker growth inhibition than LDC067 in HepG2 cells [Citation20] and downregulated the protein expression of both PINK1 and PRKN (Figure S4). As shown in , PHA767491 significantly decreased the protein expression of CDK9, PINK1 and PRKN in tumor tissues. The immunofluorescence assay showed that PHA767491 reduced the colocalization of PINK1 and PRKN and the mitochondrial localization of PRKN ( a nd L). Collectively, inhibition of CDK9 suppressed mitophagy initiation by modulating the PINK1-PRKN pathway.
Inhibition of CDK9 promotes the degradation of PINK1 by inactivating the SIRT1-FOXO3-BNIP3 axis
Then, we investigated the mechanism by which CDK9 inhibition downregulated PINK1 protein expression. Although higher concentrations of the CDK9 inhibitor LDC067 decreased the mRNA expression of PINK1 (), we were still curious whether CDK9 influenced the post-transcriptional regulation of PINK1. It has been reported that BNIP3 interacts with PINK1 and suppresses its proteolytic cleavage to promote PINK1 mitochondrial accumulation and induce mitophagy [Citation35]. Thus, we transfected HepG2 cells with BNIP3 siRNA and found that BNIP3 knockdown resulted in the downregulation of the PINK1 and PRKN proteins (). LDC067 significantly reduced the exogenous level of the BNIP3 protein in HepG2 cells, and overexpression of BNIP3 weakened the LDC067-induced downregulation of the PINK1 and PRKN proteins (). Immunoprecipitation revealed that LDC067 disturbed the interaction between BNIP3 and PINK1 (). Immunofluorescent staining showed that LDC067 decreased the colocalization between the proteins PINK1 and BNIP3 (). Therefore, in addition to the suppression of PINK1 transcription, inhibition of CDK9 also disturbed the interaction between PINK1 and BNIP3, which impaired the BNIP3-mediated stability of the PINK1 protein and promoted the degradation of the PINK1 protein.
Figure 3. Inhibition of CDK9 promotes the degradation of PINK1 by inactivating the SIRT1-FOXO3-BNIP3 pathway. (A) HepG2 cells were transfected with BNIP3 siRNA, and the protein expression levels of PINK1, PRKN and BNIP3 were assayed by Western blot and then quantified. (B) BNIP3-overexpressing HepG2 cells were treated with 15 μM LDC067 for 24 h and immunoblotted for PINK1, PRKN, and BNIP3. Protein expression was quantified and normalized to ACTB. (C) HepG2 cells were treated with 15 μM LDC067 for 24 h. The lysates were immunoprecipitated against PINK1, and immunoblotting assays for PINK1 and PRKN were performed. (D) The colocalization of BNIP3 and PINK1 was observed (1000×, scale bar: 50 μm). The colocalization area of BNIP3 with PINK1 per cell was quantified. (E and F) HepG2 cells were treated with LDC067 for 24 h (E) or transfected with CDK9 siRNA-315 (F), and Western blot analysis was performed. (G) Quantitative RT-PCR was performed to detect BNIP3 mRNA expression. (H) The transcriptional activity of FOXO3 was determined with a dual-luciferin reporter assay. The firefly luciferase activity was normalized to the Renilla luciferase activity for each sample. (I) Quantitative RT-PCR was performed to detect FOXO3 mRNA expression. (J) HepG2 cells were treated with 15 μM LDC067 with or without 15 μM MG132 and 15 μM CHX for 24 h, and FOXO3 protein expression was assayed and quantified. (K) Immunoprecipitation against FOXO3 was performed in HepG2 cells upon treatment with 15 μM LDC067 for 24 h. The acetylated FOXO3 signal was visualized with a pan acetyl-lysine antibody. Protein quantitative analysis of the acetylated FOXO3 expression was normalized to that of FOXO3 in the IP group. (L) HepG2 cells were transfected with an HA-labeled CDK9 plasmid and then treated with 15 µM LDC067 for 24 h. Western blot analysis was performed. The indicated protein expression levels were quantified and normalized to ACTB. (M and N) HepG2 cell xenograft and PDX models were administrated with physiological saline (control) or PHA76749 (20 mg/kg, i.v., once a day for 10 days). (M) Immunohistochemical detection of the p-SIRT1, FOXO3 and BNIP3 proteins in tumor tissues (400×, scale bar: 50 μm). (N) Tumor tissue immunofluorescence detected by BNIP3 and PINK1 antibodies (1000×, scale bar: 50 μm). The colocalization area of PINK1 with BNIP3 was quantified. Bar, SD. *P < 0.05 or **P < 0.01.
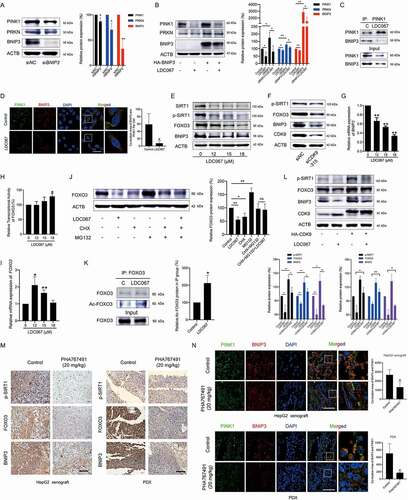
The transcription factor FOXO3 regulates mitochondrial function and integrity by binding to the BNIP3 upstream promoter region and increasing BNIP3 expression [Citation25]. Here, we found that inhibition of CDK9 by LDC067 or siRNA targeting CDK9 decreased the protein expression of FOXO3 and BNIP3 in HepG2 cells (, F and S2). LDC067 also downregulated the mRNA expression of BNIP3, even at lower concentrations (). These results suggested that inhibition of CDK9 by LDC067 decreased BNIP3 transcription by inhibiting CDK9-regulated RNA polymerase and/or the transcription factor FOXO3. However, LDC067 had little influence on the transcriptional activity of FOXO3 and only slightly increased it at high concentration (). Therefore, inhibition of the transcription factor FOXO3 by LDC067 was not caused by changing the transcriptional activity of FOXO3, but instead significantly reducing FOXO3 protein expression. RT-PCR showed that LDC067 increased FOXO3 mRNA expression (). Thus, inhibition of CDK9 downregulated FOXO3 protein expression post-transcriptionally. After HepG2 cells were cotreated with CHX (cycloheximide), MG132 and LDC067, the downregulation of FOXO3 protein expression induced by LDC067 was rescued (), suggesting that LDC067 promoted degradation of the FOXO3 protein. The protein deacetylase SIRT1 is an important upstream regulator of FOXO3 [Citation23,Citation24]. In our previous studies, we showed that SIRT1 was the substrate of CDK9 and phosphorylated by CDK9 at Ser47 [Citation20]. Inhibition of CDK9 promoted SIRT1 dephosphorylation at Ser47, suppressed its deacetylase activity ( and 3F), and then increased FOXO3 acetylation (). The SIRT1-specific inhibitor EX527 increased the content of acetylated FOXO3 and decreased the protein levels of FOXO3 and BNIP3 (Figure S5), which further supported that deacetylation of FOXO3 favored its protein stability. Thus, inhibition of SIRT1-mediated deacetylation of FOXO3 promoted the degradation of the FOXO3 protein and decrease its protein level.
Overall, inhibition of CDK9 decreased the phosphorylation of SIRT1 and SIRT1-mediated deacetylation of FOXO3, leading to degradation of the FOXO3 protein and transcriptional suppression of its targeted gene BNIP3. Subsequently, the decrease in both BNIP3 protein expression and BNIP3-PINK1 binding impaired the BNIP3-mediated stability of the PINK1 protein and downregulated PINK1 protein expression. Notably, the highly specific CDK9 inhibitor LDC067 suppressed POLR2A and decreased the mRNA expression levels of SIRT1 (Figure S6) as well as PINK1 and BNIP3, but increased FOXO3 mRNA expression. We assayed other mitochondrial proteins, including TRAP1 (TNF receptor-associated protein-1), STOML2 (stomatin-like protein 2) and OMA1 (OMA1 zinc metallopeptidase), and found that none of these proteins were influenced by LDC067 lower than 20 μM (Figure S7). Thus, lower concentrations of LDC067 did not result in general transcriptional repression of nuclear genes encoding proteins, and regulation of the SIRT1-FOXO3-BNIP3 and the PINK1-PRKN signaling pathways by CDK9 remained specific. In CDK9-overexpressing HepG2 cells, the dephosphorylation of SIRT1 and downregulation of FOXO3 and BNIP3 protein levels by LDC067 were diluted (). In vivo studies showed that the CDK9 inhibitor PHA767491 decreased the protein levels of p-SIRT1, FOXO3 and BNIP3 in tumor tissues (). Tissue immunofluorescence assays also demonstrated that the colocalization of BNIP3 and PINK1 in tumor tissues was reduced by PHA767491 (). Thus, inhibition of CDK9 promotes the degradation of PINK1 by inactivating the SIRT1-FOXO3-BNIP3 axis, which subsequently damages the BNIP3-modulated protein stability of PINK1 and blocks PINK1-PRKN-mediated mitophagy.
The novel CDK9 inhibitor oroxylin A disturbs mitochondrial homeostasis and blocks PINK1-PRKN-mediated mitophagy
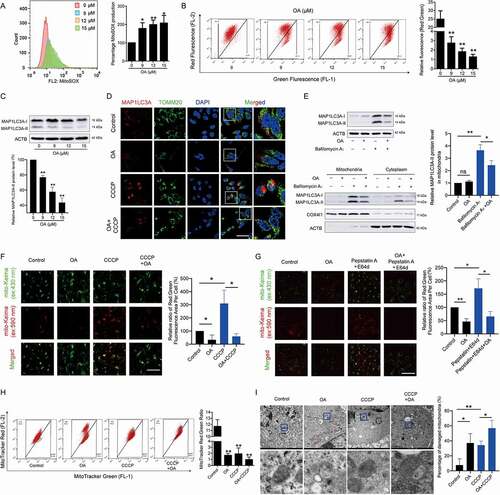
Our results demonstrated that inhibition of CDK9 interrupted mitochondrial function and renewal by suppressing mitophagy. A newly found CDK9 inhibitor OA overcomes the extreme repression of general transcription, restrictive anti-HCC efficacy and high normal tissue toxicity that is associated with existing CDK9 inhibitors via moderate and controlled CDK9 inhibition [Citation20]. In this work, we found that OA had dual effects in the mitochondria of HCC cells. OA significantly increased the generation of MitoSOX () and induced the loss of MMP (). Moreover, OA reduced the protein expression of MAP1LC3A-II and CCCP-induced aggregation of the MAP1LC3A protein around the mitochondria ( and 4D). Similar to LDC067, OA also decreased the bafilomycin A1-promoted accumulation of MAP1LC3A-II in mitochondria (). Furthermore, mito-Keima detection demonstrated that OA decreased the number of mitochondria transported to lysosomes, even when lysosomal activity was inhibited by pepstatin A+ E64d ( and 4G). In addition, MitoTracker Red and MitoTracker Green staining and TEM analysis revealed that OA reduced the number of healthy mitochondria, severely induced the phenomenon of mitochondrial hydration, and decreased the number of mitochondria surrounded by autophagic vesicles, leading to substantial accumulation of damaged mitochondria ( and 4I). Overall, OA destroyed mitochondrial function, blocked mitophagy and inhibited the clearance of damaged mitochondria, leading to the destruction of mitochondrial homeostasis and cell death in HCC cells.
Figure 4. Oroxylin A induces mitochondrial dysfunction and blocks mitophagy. HepG2 cells were treated with OA for 48 h. (A) MitoSOX and (B) MMP were measured by flow cytometry. (C) Protein expression of MAP1LC3A was determined by Western blot analysis. The relative protein expression of the MAP1LC3A-II form was quantified and normalized to ACTB. (D) HepG2 cells were treated with 12 μM OA for 48 h with or without 10 μM CCCP for 24 h. MAP1LC3A and TOMM20 were observed by confocal microscopy imaging (1000×, scale bar: 50 μm). The results of Figures 4D and 1E were obtained from the same experiment batch. The sample of “Control” or “CCCP” group was used in common. (E) HepG2 cells treated with 12 μM OA for 48 h with or without 20 nM bafilomycin A1 for 24 h. The protein levels of MAP1LC3A in whole cells, mitochondria and the cytoplasm were measured. The protein level of the MAP1LC3A-II form in mitochondria was quantified and normalized to COX4I1. (F and G) HepG2 cells were transfected with the mito-Keima plasmid and treated with 12 μM OA for 48 h, with or without 10 μM CCCP for 24 h (F), or with or without pepstatin A+ E64d (both 10 μg/mL) for 24 h (G). Then, the fluorescent dots of mito-Keima were observed by fluorescence microscopy (1000×, scale bar: 50 μm). The relative ratio of red to green fluorescence area per cell was quantified. The results of Figures 4G and 1J were obtained from the same experiment batch. The sample of “Control” or “Pepstatin A E64d” group was used in common. (H) MitoTracker Red and MitoTracker Green staining was measured by flow cytometry. The ratio of red to green fluorescence intensity was quantified. (I) Mitochondrial ultrastructure was observed by TEM. Black arrow: normal mitochondria, white arrow: mitochondrial autophagosome, red arrow: damaged mitochondria (mitochondria with swelling, broken cristae and vacuolation). The percent damaged mitochondria was quantified. The results of Figures 4I and 1G were obtained from the same experiment batch. The sample of “Control” or “CCCP” group was used in common. Bar, SD. *P < 0.05 or **P < 0.01. “ns” means not significant (P > 0.05) .
Further research showed that OA inhibited the activity of CDK9 and inactivated the SIRT1-FOXO3-BNIP3 and PINK1-PRKN pathways by downregulating key proteins (). OA also significantly reduced BNIP3 mRNA expression (). In contrast to the CDK9-specific inhibitor LDC067, OA decreased CDK9 protein expression, suggesting that OA acted through CDK9-independent regulation in HCC cells. However, CDK9 was still critical for the regulation of the SIRT1-FOXO3-BNIP3 and PINK1-PRKN pathways after OA treatment. Overexpression of CDK9 diluted the effects of OA (). OA disturbed the binding of BNIP3 with PINK1, reduced the colocalization of the BNIP3 and PINK1 proteins ( and 5E), and disrupted the interaction between PINK1 and PRKN ( a nd G). OA reduced the localization of PRKN in depolarized mitochondria () and also the recruitment of the PINK1 and PRKN proteins in the mitochondria (). In tumor tissues, OA downregulated the protein expression levels of p-SIRT1, FOXO3, BNIP3, PINK1 and PRKN (), and reduced the colocalization of PINK1 with BNIP3, PINK1 with PRKN, as well as the mitochondrial location of PRKN (–6D). Therefore, OA not only reduced mitochondrial activity but also inhibited PINK1-PRKN-mediated mitophagy by inactivating the SIRT1-FOXO3-BNIP3 axis, resulting in the accumulation of damaged mitochondria and the destruction of mitochondrial homeostasis in HCC cells.
Figure 5. Oroxylin A suppresses mitophagy by inactivating the SIRT1-FOXO3-BNIP3 axis and downregulating the PINK1-PRKN pathway. (A) HepG2 cells were treated with OA for 48 h, and Western blot analysis was performed. (B) Quantitative RT-PCR was performed to detect BNIP3 mRNA expression. (C) HepG2 cells were transfected with an HA-labeled CDK9 plasmid and then treated with 12 µM OA for 48 h. Western blot assays were performed. The indicated protein expression levels were quantified and normalized to ACTB. (D-F) HepG2 cells were treated with 12 μM OA for 48 h. (D) Lysates were immunoprecipitated against PINK1, and immunoblotting assays for BNIP3 and PINK1 were performed. Quantitative analysis of the protein expression of BNIP3 was normalized to that of PINK1 in the IP group. (E) Colocalization of BNIP3 and PINK1 was observed by confocal microscopy imaging (1000×, scale bar: 50 μm). The colocalization area of BNIP3 with PINK1 per cell was quantified. (F) Lysates were immunoprecipitated against PINK1, and IB assays for PINK1 and PRKN were performed. Quantitative analysis of PRKN expression normalized to that of PINK1 in the IP group. (G-I) HepG2 cells were treated with 12 μM OA for 48 h with or without CCCP (10 μM for 24 h). The colocalization of PINK1 with PRKN (G) and PRKN with mitochondria (TOMM20-marked) (H) was observed (1000×, scale bar: 50 μm). The colocalization areas were quantified. (I) PINK1 and PRKN expression in the cytoplasm and mitochondria was measured using Western blot analysis. PINK1 and PRKN expression in mitochondria was quantified and normalized to COX4I1. Bar, SD. *P < 0.05 or **P < 0.01. “ns” means not significant (P > 0.05) .
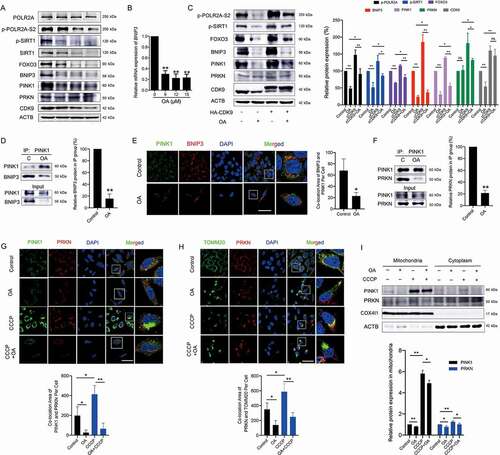
Figure 6. Oroxylin A downregulates the expression and colocalization of the core proteins involved in the SIRT1-FOXO3-BNIP3 axis and the PINK1-PRKN pathway in tumor tissues. HepG2 cell xenograft and PDX models were treated with physiological saline (control) or OA (300 mg/kg, i.g., once every two days). (A) Immunohistochemical detection of related proteins in tumor tissues (400×, scale bar: 50 μm). (B) The colocalization of BNIP3 with PINK1, (C) PRKN with PINK1, (D) and PRKN with mitochondria (TOMM20 marked) in tumor tissues was observed (1000×, scale bar: 50 μm). The colocalization areas were quantified. The samples of “Control” group in Figure 6B–D were the same one used in from the same experiment batch. Bar, SD. *P < 0.05 or **P < 0.01.
Suppression of PINK1-PRKN-mediated mitophagy by oroxylin A enhances efficacy and overcame drug resistance for HCC treatment
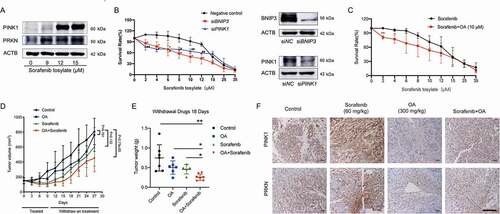
Our previous studies demonstrated that OA has potent anti-hepatoma activity [Citation36]. Here, we further explored the therapeutic potential of OA in HCC. It has been reported that mitophagy promotes sorafenib resistance through a hypoxia-inducible ATAD3A-dependent axis [Citation11]. Our results showed that sorafenib significantly increased the protein expression of PINK1 and PRKN, which are critical executors of mitophagy, in HepG2 cells (). When BNIP3 or PINK1 was silenced, the growth inhibitory effects of sorafenib in HepG2 cells was significantly enhanced (). These results suggested that mitophagy was potentially promoted by sorafenib and closely influenced its treatment efficacy. As expected, after HepG2 cells were pretreated with 10 μM OA for 24 h (no significant cell growth inhibition was observed after treatment with 10 μM OA for 24 h), the anti-HCC efficacy of low concentrations of sorafenib increased significantly (). For in vivo studies, unlike conventional evaluation methods for anticancer effects in xenograft models, we used tumor growth delay as the evaluating indicator to determine anti-HCC activity. Tumor growth delay activity provides stronger evidence of clinical potential than tumor growth inhibition activity [Citation37]. We administered mice xenografted with HepG2 cells and treated them with OA, sorafenib, or their combination for 9 days. Drug administration was then withdrawn and mouse tumor growth was observed tumor for an additional 18 days. The results showed that even after 18 days of drug withdrawal, the combination of OA and sorafenib had stronger tumor growth delay activity than either monotherapy, and the increase in tumor weights was significantly inhibited by this combination therapy ( and 7E). Immunohistochemical assays of tumor tissues obtained before drug withdrawal showed that sorafenib significantly upregulated the protein levels of PINK1 and PRKN in tumor tissues, while OA strongly reduced these levels (). These results demonstrated that OA could delay tumor growth and improve the therapeutic effects of sorafenib by inhibiting PINK1-PRKN-mediated mitophagy.
Figure 7. Oroxylin A delays tumor growth and improved the therapeutic effects of sorafenib by inhibiting PINK1-PRKN-mediated mitophagy. (A) HepG2 cells were treated with sorafenib for 48 h. Protein levels of PINK1 and PRKN were assayed by immunoblotting. (B) HepG2 cells were transfected with negative control, BNIP3 siRNA or PINK1 siRNA and then treated with sorafenib for 48 h. Survival rates were measured by MTT assay, and whole-cell lysates were prepared and subjected to immunoblotting. Bar, SD. #P < 0.05, ##P < 0.01 siPINK1 group versus the untreated control group. (C) HepG2 cells were treated with OA (10 μM for 24 h), OA was then removed, and the cells were treated with sorafenib for 48 h. Survival rates were measured by MTT assay. (D-F) HepG2 cell xenograft model mice were treated with OA (300 mg/kg, i.g., once every two days), sorafenib (60 mg/kg, i.g., once every day), or a combination of OA and sorafenib for 9 days. Three mice were randomly selected and sacrificed for tumor tissue analysis on Day 10, drug administration was then withdrawn, and the remaining mice were sacrificed on Day 27. (D) Tumor volumes and (E) tumor weights after drug withdrawal for the final 18 days. (F) PINK1 and PRKN protein expression in tumor tissues was analyzed by immunohistochemistry (400×, scale bar: 50 μm). Bar, SD. *P < 0.05 or **P < 0.01.
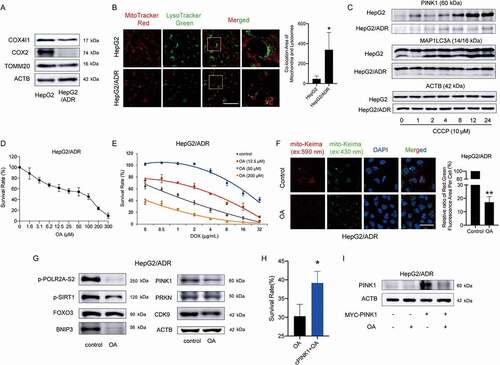
Doxorubicin (DOX)/Adriamycin (ADR) is the most frequently used anticancer drug for chemotherapy. It has been reported that DOX can intercalate into mitochondrial DNA, resulting in mitochondrial injury repair via the induction of mitophagy [Citation38]. Although some studies have demonstrated that mitophagy is closely related to cancer multidrug resistance and recurrence [Citation12,Citation39,Citation40], the roles of mitophagy in different types of cancer therapy remain largely unclear. Compared with HepG2 cells, the mitochondrial protein levels in HepG2/ADR cells (ADR-resistant HepG2 cells) were much lower (), and the colocalization of mitochondria with lysosomes was greater (). After HepG2 cells were treated with CCCP, the protein levels of the MAP1LC3A-II form and PINK1 increased significantly while few changes were observed in HepG2/ADR cells (). These results suggested that HepG2/ADR cells had higher mitophagic activity than HepG2 cells, which might be associated with the drug resistance of these resistant HCC cells. OA showed a strong effect on growth inhibition in HepG2/ADR cells (). We performed combination treatment with OA and DOX in HepG2/ADR cells, and 50 μM OA showed a strong synergic effect with lower concentrations of DOX (). Furthermore, OA reduced the intensity of the mito-Keima protein fluorescent dots excited at 590 nm (), which is an indicator of mitophagic activity, and downregulated the proteins involved in the PINK1-PRKN and SIRT1-FOXO3-BNIP3 pathways in HepG2/ADR cells (). Overexpression of PINK1 in HepG2/ADR cells attenuated the growth inhibition caused by OA ( and 8I). Thus, OA could overcome drug resistance to ADR by inhibiting PINK1-PRKN-mediated mitophagy.
Figure 8. Oroxylin A overcomes ADR drug resistance by downregulating PINK1-PRKN-mediated mitophagy. (A) Whole-cell lysates from HepG2 and HepG2/ADR cells were prepared and subjected to immunoblotting for mitochondrial proteins. (B) MitoTracker Red and LysoTracker Green staining of HepG2 and HepG2/ADR cells was observed by confocal microscopy (1000×, scale bar: 50 μm). The colocalization of mitochondria with lysosomes was quantified. (C) Protein expression of PINK1 and MAP1LC3A in HepG2 and HepG2/ADR cells was measured after treatment with 10 μM CCCP for the indicated times. (D) HepG2/ADR cell survival rates were measured by CCK-8 assay after OA treatment for 48 h. (E) HepG2/ADR cell survival rates were measured by CCK-8 assay after combination treatment with OA and DOX for 48 h. (F) HepG2/ADR cells were transfected with mito-Keima, incubated with 150 μM OA for 48 h, and then observed by fluorescence microscopy (1000×, scale bar: 50 μm). The relative ratio of red to green fluorescence area per cell was quantified. (G) HepG2/ADR cells were treated with 150 μM OA for 48 h, and Western blotting was performed. (H and I) HepG2/ADR cells were transfected with a MYC-labeled PINK1 plasmid and then treated with 150 μM OA for 48 h. (H) CCK-8 assay. The survival rate in the OA-treated group relative to the untreated group was compared with that of the PINK1-overexpressing OA-treated group relative to the PINK1-overexpressing control group. (I) Western blot assay. Bar, SD. *P < 0.05, **P < 0.01.
Discussion
HCC is one of the most common malignancies. The American Cancer Society reported 905,000 new cases of liver cancer worldwide and 830,000 deaths in 2020 [Citation41]. Most of the clinically diagnosed patients have advanced HCC for which surgery is not indicated; thus, these patients can only undergo systematic chemotherapy and molecular targeted therapy. Unfortunately, many chemotherapeutic drugs fail to prolong patient survival due to their severe side effects and acquired resistance, resulting in limitations of their clinical applications [Citation12,Citation42]. Currently, the multikinase inhibitor sorafenib remains the first-line drug to control the unresectable development and progression of HCC. Whereas, the efficacy of sorafenib treatment is frequently transient, and only approximately 30% of HCC patients might benefit from sorafenib due to acquired resistance [Citation43,Citation44].
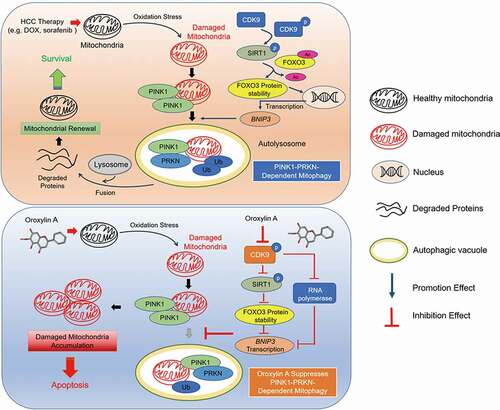
Mitophagy, a highly selective quality-control mechanism that maintains mitochondrial homeostasis, is of special interest in cancer [Citation45]. The rapid clearance of damaged mitochondria by mitophagy is thought to be closely related to drug resistance in cancer cells [Citation46]. Therefore, disrupting mitochondrial homeostasis may become a promising therapeutic strategy for HCC. In the present study, we discovered a correlation between mitophagy and the imperfect outcomes of HCC therapy and identified the new regulatory mechanism of PINK1-PRKN-mediated mitophagy in HCC cells. We demonstrated that CDK9 promoted the stabilization of the PINK1 protein by activating SIRT1 and enhancing SIRT1-mediated deacetylation of FOXO3, which increased FOXO3 protein stability and FOXO3-regulated transcription of BNIP3. Inhibition of CDK9 blocked the initiation of PINK1-PRKN-mediated mitophagy by inactivating the SIRT1-FOXO3-BNIP3 axis and directly inhibiting the transcription of BNIP3, inducing the destabilization of the PINK1 protein and decreasing the recruitment of PRKN to the mitochondria. Notably, the novel CDK9 inhibitor OA from Scutellaria baicalensis was explored and found to significantly enhance the efficacy and overcome drug resistance during HCC treatment by suppressing PINK1-PRKN-mediated mitophagy and promoting mitochondrial dysfunction ().
Figure 9. Schematic representation of oroxylin A blockage of PINK1-PRKN-mediated mitophagy and induction of mitochondrial dysfunction to treat HCC. In response to HCC therapy (e.g., DOX or sorafenib), damaged mitochondria recruit PINK1 and PRKN and are then encapsulated by autophagosomes, resulting in mitophagy. These self-protective mechanisms promote mitochondrial renewal, reduce oxidative stress and finally contribute to cancer cell survival. CDK9 promotes stabilization of the PINK1 protein by activating SIRT1 and enhancing SIRT1-mediated deacetylation of FOXO3, which increases FOXO3 protein stability and FOXO3-regulated transcription of BNIP3. The novel CDK9 inhibitor oroxylin A blocks the initiation of PINK1-PRKN-mediated mitophagy by inactivating the SIRT1-FOXO3-BNIP3 axis and directly inhibiting transcription of BNIP3, inducing destabilization of the PINK1 protein, and decreasing the recruitment of PRKN to mitochondria. Thus, OA leads to the accumulation of damaged mitochondria and apoptosis of HCC cells by inhibiting PINK1-PRKN-mediated mitophagy, showing potent anti-hepatoma activity that can overcome drug resistance.
The PINK1-PRKN ubiquitin conjugation system is the most widely studied regulator of mitophagy [Citation45]. The CDK9 inhibitor LDC067 blocked PINK1-PRKN-mediated mitophagy but failed to inhibit mitophagy induced by iron chelation or amino acid starvation, both of which are independent of PINK1 and PRKN [Citation34]. A growing number of studies have observed a correlation between impaired PRKN activity and enhanced cancer development, leading to the emerging concept that PRKN activity, or mitophagy in general, is a tumor suppression mechanism [Citation47]. Our studies showed that the SIRT1-FOXO3-BNIP3 axis was an important regulatory signaling pathway of the PINK1-PRKN ubiquitin conjugation system, which promoted the proteolytic processing of PINK1. Although BNIP3 itself is a mitochondrial autophagy receptor that interacts with MAP1LC3A, this function is usually initiated under hypoxia. BNIP3-dependent mitophagy is required to limit ROS (reactive oxygen species) levels in growing tumors [Citation7]. It has been reported that SIRT1 silencing alone is sufficient to increase FOXO3 acetylation, reducing the binding of FOXO3 to the BNIP3 upstream promoter region and inhibiting BNIP3 transcription in the kidneys of old or hypoxia-exposed mice [Citation48]. In addition to FOXO3, SIRT1 can deacetylate PPARGC1A/PGC-1α (PPARG coactivator 1 alpha), a master regulator of mitochondrial biogenesis that coactivates nuclear respiratory factors NRF1 (nuclear respiratory factor 1) and NFE2L2/NRF2 (NFE2 like bZIP transcription factor 2), which induce the transcription of genes involved in mitochondrial biogenesis [Citation21]. Therefore, inhibition of SIRT1 activity reduces mitochondrial biosynthesis regulated by PPARGC1A/PGC1α, resulting in the blockade of mitochondrial remodeling. This may be a potential mechanism by which inhibition of CDK9 induces dysfunctional mitochondrial accumulation. These findings provide new insights for the development of compounds that inhibit mitochondrial function.
Due to the crucial role of mitochondria in cell metabolism, mitophagy is more sensitive to metabolic stress signals in tumor cells, and has thus become a tumor therapeutic target with high metabolic activity. PRKN, as the critical executor of mitophagy, plays an important role in cellular metabolism balance. PRKN is a TP53 target gene and contributes to TP53 glucose metabolism regulation and mitochondrial respiration [Citation16]. In nasopharyngeal cancer models, mitophagy-induced metabolic reprogramming toward glycolysis promotes dedifferentiation of cancer cells and offers a stemness status [Citation49]. Accumulating evidence shows that targeting mitophagy has great potential in the development of novel antitumor drugs. Presently, CQ (chloroquine) and its derivatives are currently the only inhibitors of autophagy available for the clinical treatment of patients. Unfortunately, the autophagy-independent pathway of CQ limits its clinical application [Citation50,Citation51]. For instance, CQ has been shown to reduce tumor growth but improve the tumor milieu [Citation51]. Therefore, consideration of the metabolic activities of tumor cells and mitochondrial quality control mechanisms is necessary for cancer treatment strategies targeting mitophagy.
Our newly found CDK9 inhibitor OA was an effective mitophagy inhibitor. A body of evidence indicates that OA has a strong anti-hepatoma effect and can protect normal liver tissue [Citation36,Citation52]. We found that OA not only markedly inhibited the growth of HCC cells but also helped other drugs treat HCC, enhancing their efficacy and overcoming drug resistance by suppressing the initiation of PINK1-PRKN-mediated mitophagy. These characteristics of OA against HCC will greatly expand its development potential. Our previous studies indicated that OA shows higher therapeutic potential against HCC and lower normal tissue toxicity than the existing CDK9 inhibitors due to its moderate and controlled inhibition of CDK9 and regulation of multiple pathways [Citation20]. We found that overexpression of CDK9 in HLE cells that normally express low levels of CDK9 upregulates p-SIRT1, FOXO3 and BNIP3 protein expression but did not influence PINK1 or PRKN protein expression (Figure S8A, S8B). Notably, the protein expression of PINK1 and PRKN in HLE cells was lower than that in HepG2 cells (Figure S8C), suggesting that mitophagy might not be active or that some CDK9-independent mechanisms dominate the modulation of PINK1-PRKN-mediated mitophagy in HLE cells with low CDK9 expression. Therefore, the anti-HCC mechanism of OA that was dependent on mitophagy suppression needs further investigation, especially the CDK9-independent regulation of mitophagy and mitochondrial homeostasis. In addition, OA regulates glycolysis, oxidative phosphorylation and the synthesis of fatty acids in cancer cells [Citation53–55]. The crosstalk between metabolic regulation and mitophagy still needs to be explored in depth.
In summary, our findings demonstrated that mitophagy was frequently upregulated in HCC cells with mitochondrial dysfunction and helped cancer cells survive drug treatment or other stresses. CDK9 was a critical regulator of mitophagy, and its suppression blocked PINK1-PRKN-mediated mitophagy by inactivating the SIRT1-FOXO3-BNIP3 axis. Moreover, the CDK9 inhibitor OA significantly enhanced the therapeutic effects of sorafenib and DOX, suggesting a potential novel treatment strategy for HCC.
Materials and methods
Reagents
Oroxylin A (C16H12O5, MW: 284.263, purity≥99%) was isolated from the root of Radix Scutellariae Georgi and synthesized by Prof. Zhiyu Li at China Pharmaceutical University. OA was dissolved in DMSO (dimethyl sulfoxide; Sigma-Aldrich, D2650), made into a 0.2 M stock solution and stored at −80°C. LDC067 (C18H18N4O3S, MW: 370.43, purity: 99.51%; Selleck Chemicals, S7461) was dissolved in DMSO to prepare a 0.05 M stock solution. CCCP (carbonyl cyanide p-trichloromethoxyphenylhydrazone, C9H5ClN4, MW: 204.62; MedChem Express, HY-100941) was dissolved in DMSO to prepare a 0.2 M stock solution. CHX (Cycloheximide, C15H23NO4, MW: 281.35, purity: 99.86%; MedChem Express, HY-12320) was dissolved in DMSO to prepare a 0.05 M stock solution, which was stored at −80°C. MG132 (C26H41N3O5, MW: 475.62, purity: >97%; Selleck Chemicals, S2619) was dissolved in DMSO to prepare a 0.2 M stock solution, which was stored at −80°C. EX527 (selisistat, C13H13ClN2O, MW: 248.71; Selleck Chemicals, S1541) was dissolved in DMSO to prepare a 0.1 M stock solution. PHA767491 hydrochloride (C12H12ClN3O, MW: 249.70; MedChem Express, HY-13461A) was dissolved in DMSO to prepare a 0.05 M stock solution. For animal studies, the PHA767491 solvent was consisted of 30% PEG400 (Solarbio Life Sciences, P8530), 2% Tween 80 (Solarbio Life Sciences, T8360), 5% DMSO and physiological saline. The final concentration of PHA767491 used in vivo is 2 mg/mL. A stock solution of doxorubicin hydrochloride (2 mg/mL; MedChem Express, HY-15142) was prepared in physiological saline. Sorafenib tosylate (C28H24ClF3N4O6S, MW: 637.03) was a gift from CHIA TAI TIAN QING Pharmaceutical Industry and dissolved in DMSO to prepare a 0.01 M stock solution. For animal studies, the solvent consisted of 12.5% Cremophor EL (MedChem Express, HY-Y1890) and 12.5% ethanol diluted in physiological saline. Pepstatin A (C34H63N5O9, MW: 685.89, purity: 98%; CSNpharm, CSN11678) and E64d (aloxistatin; C17H30N2O5, MW: 342.43, purity: 99.02%; CSNpharm, CSN16047) were respectively dissolved in DMSO to prepare a 20 mg/mL stock solution. Bafilomycin A1 (C35H58O9, MW: 622.83, purity: 98%; CSNpharm, CSN10374) was prepared as a 0.1 mΜ stock solution. DFP (Deferiprone; C7H9NO2, MW: 139.15, purity: 99.98%; CSNpharm, CSN25406) was prepared as a 0.05 M stock solution. EBSS (Earle’s balanced salt solution; Solarbio Life Sciences, H2020) was stored at 4°C.
Cell culture
The human hepatocellular carcinoma cell line HepG2 (National Collection of Authenticated Cell Cultures, TCHu 72) were maintained in MEM (Minimum Essential Medium; Gibco, 41500034), added 31.5 g/L NaHCO3 (Thermo Fisher Scientific, Gibco™, 25080094) and 0.11 g/L Sodium Pyruvate (Thermo Fisher Scientific, Gibco™, 11360070). The human hepatocellular carcinoma cell line HLE (Procell Life Science & Technology Co., Ltd, CL-0651) were maintained in DMEM (Dulbecco’s Modified Eagle Medium; Thermo Fisher Scientific, Gibco™, 12100061). HepG2/ADR cells was developed by culturing HepG2 cells in the presence of increasing concentrations of ADR (DOX, 0.05, 0.1, 0.5, 1, 2 μg/mL; Selleck Chemicals, S1208). Resistant cells were selected and resistance was maintained by culturing the cells in RPMI-1640 medium (Thermo Fisher Scientific, Gibco™, 31870082) supplemented with 2 μg/mL ADR and labeled HepG2/ADR. All the cells were supplemented with 10% fetal bovine serum (Wisent Bio Products, 080–910), Penicillin-Streptomycin (×100, containing 10,000 units/mL of penicillin and 10,000 μg/mL of streptomycin; Thermo Fisher Scientific, Gibco™, 15140148) and cultured in a humidified environment with 5% CO2 at 37°C.
Detection of MitoSOX generation
MitoSOX was detected with the MitoSOX Red Mitochondrial Superoxide Indicator dye (Yeasen Biotechnology, 40778ES50). HepG2 cells were cultured in 6-well plates overnight and treated as described. For the determination of MitoSOX by flow cytometry, cells were gently collected and detected in accordance with the instructions of the FACSCalibur flow cytometry instrument (Becton Dickinson). The data are presented as a histogram of the mean intensity of MitoSOX fluorescence. For MitoSOX and Mito-EGFP imaging (Inovogen Biotechnology, VL3506), we stained MitoSOX in accordance with the instructions and acquired images using the FV1000 confocal laser scanning biological microscope (Olympus, Tokyo, Japan).
Detection of mitochondrial membrane potential
Detection of the mitochondrial membrane potential was performed using a JC-1 Apoptosis Detection Kit (KeyGen BioTech, KGA604) according to the manufacturer’s instructions. A total of 10,000 cells/sample were analyzed for their fluorescence intensity (488 nm excitation and 530 nm emission) using FACSCalibur flow cytometry instrument (Becton Dickinson, Franklin Lakes, NJ, USA).
MitoTracker straining assay
Cells were stained with MitoTracker Red (Invitrogen, M7521) and MitoTracker Green (Yeasen Biotech, 40742ES50) according to the manufacturer’s instructions. A total of 10,000 cells/sample were analyzed for their fluorescence intensity using a FACSCalibur flow cytometry instrument.
Colocalization of mitochondria and lysosomes
Cells were stained with MitoTracker Red and LysoTracker Green (Yeasen Biotech, 40738ES50) according to the manufacturer’s instructions, and then pictures were taken using the FV1000 confocal laser scanning biological microscope (Olympus, Tokyo, Japan).
Transmission electron microscopy
HepG2 cells were harvested, washed twice with phosphate buffered saline (PBS; Thermo Fisher Scientific, Gibco™, 10010031) and fixed in 2.5% ice-cold glutaraldehyde (SPI Supplies, 111–30-8) in 0.1 M phosphate buffer (PB; Biomat, 100-1-1000) overnight at 4°C. The fixed cells were washed in 0.1 M PB and postfixed in 2% osmic acid (Glentham Life Sciences, 20816–12-0) for 2 h at 4°C. After washing with 0.1 M PB three times, the cells were treated in a series of dehydration processes (50%, 70%, 80% and 90% alcohol, 90% alcohol-90% acetone (1:1, v:v), 90% acetone and 100% acetone) and embedded in epoxy resin (Solarbio Life Sciences, G8590). The epoxy resin was polymerized in a dry oven at 60°C for 48 h. Ultrathin sections of embedded samples were cut by a cryo-ultramicrotome Leica UC6-FC6 (Leica, Wetzlar, Germany) and then stained by uranyl acetate and lead citrate. The samples were observed under HT7700 TEM (Hitachi, Tokyo, Japan).
Western blot assay
Proteins were resolved on Tris-glycine acrylamide gels followed by Western blot analysis. Primary antibodies included those against ACTB/β-actin (ABclonal Technology, AC026; 1:200000), POLR2A (ABclonal, A11181; 1:2000), p-POLR2A-S2(ABclonal, AP0749; 1:2000), CDK9 (Cell Signaling Technology, 2316; 1:2000), SIRT1 (Cell Signaling Technology, 2493; 1:2000), p-SIRT1 (Abcam, ab76039; 1:2000), FOXO3 (Proteintech, 66428-1-lg; 1:2000), BNIP3 (ABclonal, A5683; 1:2000), PINK1 (Cell Signaling Technology, 6946; 1:2000), PRKN/parkin (Cell Signaling Technology, 4211; 1:2000), TOMM20 (Proteintech, 11802-1-AP; 1:2000), COX4I1 (ABclonal, A6564; 1:2000), pan acetyl-lysine polyclonal antibody (ABclonal, A2391; 1:2000), and MAP1LC3A (Cell Signaling Technology, 4108; 1:2000). Each assay was repeated three times.
Mitochondria protein extraction and detection
Mitochondrial protein extraction from HepG2 cells was performed with a Mitochondria Isolation Kit for Cultured Cells (Thermo Fisher Scientific, 89874) according to the manufacturer’s instructions. Then, the mitochondrial and cytoplasmic proteins were analyzed by Western blotting.
Small interfering RNA (siRNA), plasmid extraction and transient transfection
CDK9 and BNIP3 siRNA were designed and provided by GenePharma (Shanghai, China). The following siRNA sequences were used:
siRNA-CDK9-315 sense: 5ʹ- GGGAGAUCAAGAUCCUUCATT-3ʹ
siRNA-CDK9-315 antisense: 5ʹ-UGAAGGAUCUUGAUCUCCCTT-3ʹ
siRNA-CDK9-881 sense: 5ʹ- GGCCAAACGUGGACAACUATT-3ʹ
siRNA-CDK9-881 antisense: 5ʹ-UAGUUGUCCACGUUUGGCCTT-3ʹ
siRNA-BNIP3 sense: 5ʹ-GCCUCGGUUUCUAUUUAUATT-3ʹ
siRNA-BNIP3 antisense: 5ʹ-UAUAAAUAGAAACCGAGGCTT-3ʹ
siRNA-PINK1 sense: 5ʹ- GCUAACCUGGAGUGUGAAATT-3ʹ
siRNA-PINK1 antisense: 5ʹ-UUUCACACUCCAGGUUAGCTT-3ʹ
HA-CDK9 (14640; deposited by Matija Peterlin), HA-BNIP3 (100781; deposited by Joseph Gordon), MYC-PINK1 (13314; deposited by Mark Cookson) and mito-Keima (56018; deposited by Michael Davidson) plasmids were obtained from Addgene. An EndoFree Plasmid Midi Kit (CWBIO, CW2015S) was used to extract plasmids, which were stored at 20°C.
For transfection, cells were cultured in 6-well plates at a density of 60% overnight attachment. Fresh medium was added one hour before transfection. Then, the plasmid (3 μg per well) or siRNA (400 pmol per well) was introduced to the cells with Lipofectamine 2000 (Invitrogen, 11668019) according to the manufacturer’s instructions. All steps were performed using antibiotic-free medium.
Immunoprecipitation
Cell lysates were incubated overnight with the corresponding antibodies. Primary antibodies included those against PINK1 (Cell Signaling Technology, 6946, 1:250; BioLegend, 846201, 1:150) and FOXO3 (Proteintech, 66428-1-lg; 1:250). Incubation was carried out at 4°C with gentle rotation overnight. The next day, immunogen-antibody complexes were captured by incubation with protein A/G magnetic beads (MedChem Express, HY-K0202) for 1 h at 4°C with gentle rotation. Then, the beads were washed 3 times with RIPA buffer (Thermo Fisher Scientific, 89900). Immunocomplexes were analyzed by Western blot. In the immunoprecipitation assay, we used protein A to pull down protein B. Because drug treatment significantly decreased the expression of protein A, to eliminate the probability that the reduction in binding between these proteins was caused by the reduction in protein A expression, we adjusted the sample loading volume of protein A of the IP assay to ensure that the level of protein A in the control group was consistent with that in the drug-treated group. Under these conditions, the reduction in binding between protein A and protein B was independent of the reduction in protein A input.
Dual-luciferase reporter assay
HepG2 cells were plated in 12-well plates for attachment overnight, and FOXO3-Luc (2 μg/well) (Addgene, 1789; deposited by Michael Greenberg) and pRL-TK Renilla (0.2 μg/well) (Promega, E2231) were transfected with Lipofectamine 2000 (Invitrogen, 11668019). Then, HepG2 cells were treated with LDC067 for 24 h. Assays were performed with the Dual-Luciferase Reporter Gene Assay kit (Promega, E1910). The data are presented as the ratio of the fluorescence of FOXO3 and TK.
Quantitative real-time reverse transcription-polymerase chain reaction (RT–PCR) assay
Total RNA was extracted using Total RNA Extraction Reagent (Vazyme BioTech, R401-01) and then amplified by PCR (polymerase chain reaction). A 1 μg aliquot of total RNA was used to transcribe first-strand cDNA with a HiScript III 1st Strand cDNA Synthesis Kit (Vazyme BioTech, R312-01/02). Real-time PCR was completed on an ABI PRISM Sequence Detector 7500 (PerkinElmer, Branchburg, NJ) using Sequence Detector version 1.7 software (Applied Biosystems, Foster City, CA). SYBR Green PCR Master Mix was purchased from Vazyme BioTech (Q131-02/03). The primer sets used for PCR amplification were as follows:
SIRT1-sense: 5ʹ- TAGCCTTGTCAGATAAGGAAGGA-3ʹ
SIRT1-antisense: 5ʹ- ACAGCTTCACAGTCAACTTTGT-3ʹ
BNIP3-sense: 5ʹ-CAGGTAGCTGCTGGGCTC-3ʹ
BNIP3-antisense: 5ʹ-GCTCGACGCTAGGATCTGAC-3ʹ
FOXO3-sense: 5ʹ- TGCGTGCCCTACTTCAAGGATAA-3ʹ
FOXO3-antisense: 5ʹ- ACAGGTTGTGCCGGATGGA-3ʹ
PINK1-sense: 5ʹ- GCCTCATCGAGGAAAAACAGG-3ʹ
PINK1-antisense: 5ʹ- GTCTCGTGTCCAACGGGTC-3ʹ
GAPDH-sense: 5ʹ- TAGTGGAAGGACTCATGACC-3ʹ
GAPDH-antisense: 5ʹ-TCCACCACCCTGTTGCTGTA-3ʹ
Gene expression was analyzed using quantitative RT-PCR with GAPDH as an internal control.
Xenograft model
All mouse experiments were in compliance with the policies of the SFDA (State Food and Drug Administration) of China on Animal Care. All animals received humane care according to the criteria outlined in the Guide for the Care and Use of Laboratory Animals prepared by the National Academy of Sciences and published by the National Institutes of Health. Female athymic nude mice (4–6 weeks old) weighing 18–22 g were purchased from the Academy of Military Medical Sciences of the Chinese People’s Liberation Army (Certificate No. SCXK(ZHE)2018–0001). Animals were placed in IVC cages with adequate high-temperature sterilized water, sterile feed and regular light. The room temperature was controlled at 24–26°C, and the humidity was 40–60%.
For the HepG2 transplantation tumor model, HepG2 cells (2 × 10⁶) were subcutaneously (s.c.) injected into each mouse. Tumor-bearing mice were grouped according to the tumor volume after one week. For patient-derived hepatoma tumor xenograft (PDX) models, tumor specimens were obtained (approximately 2 × 2 × 2 mm3/fragment) from one hepatoma patient after obtaining informed consent. All fragments were subcutaneously inoculated into one flank of the experimental 5-week-old nude mice. Tumor growth was measured twice weekly using a Vernier caliper. The established PDX model was called passage 1 (P1). When the tumor size of P1 reached approximately 750 mm3, the tumor was separated and sliced into small fragments (approximately 3 × 3 × 3 mm3/fragment) and reinoculated into mice to obtain the subsequent passages P2, P3, P4, and so on.
The tumor-bearing mice were randomly divided into treatment different groups as follows:
For conventional evaluation, OA was administered at a dose of 300 mg/kg (i.g.) once every two days. PHA767491 was administered at a dose of 20 mg/kg (i.v.) once a day for 10 days, then withdrawn. All mice were fed and sacrificed together after 22 days.
To evaluate tumor growth delay, OA was administered at a dose of 300 mg/kg (i.g.) once every two days, and sorafenib tosylate was administered at a dose of 60 mg/kg (i.g.) once every day for 9 days. Then, all treatments were withdrawn, and the mice were fed and sacrificed after 27 days.
Tumor volumes were recorded twice a week using an electronic Vernier caliper. Tumor volumes were calculated using the following formula: Tumor volume (mm3) = d2 × D/2, in which d and D are the shortest and longest diameters, respectively. Tumor tissues were used for immunohistochemistry and immunofluorescence assays.
Immunohistochemical staining
Tumor tissue sections were heated, fixed, deparaffinized and rehydrated with a graded alcohol to distilled water series. The prepared slides were heated in citric acid buffer for antigen repair. Then, tissue section permeabilization was performed with 0.5% Triton X-100 (Solarbio Life Sciences, T8200) in PBS (Solarbio Life Sciences, P1022). The slides were treated with 5% goat serum (Solarbio Life Sciences, SL038) and 0.5% BSA (Solarbio Life Sciences, A8010) at room temperature for 1 h and incubated overnight with primary antibodies at 4°C. Primary antibodies included those against CDK9 (Cell Signaling Technology, 2316; 1:400), p-SIRT1 (Abcam, ab76039; 1:400), FOXO3 (Proteintech, 66428-1-lg; 1:400), BNIP3 (ABclonal, A5683; 1:200), PINK1 (Proteintech, 23274-1-AP; 1:250), and PRKN/parkin (Santa Cruz Biotechnology, sc-32282; 1:50).
Immunofluorescence
HepG2 cells were fixed with 4% paraformaldehyde fix solution (Beyotime Biotechnology, P0099) or 30 min and then washed 2 times with 0.5% Triton X-100 for 10 min. The cells were blocked with 5% goat serum and 0.5% BSA at room temperature for 1 h and incubated overnight with primary antibodies at 4°C. The next day, the cells were washed 4 times with 0.5% Triton X-100 for 10 min each time, stained with FITC-conjugated anti-rabbit (Thermo Fisher Scientific, A-11008, A-11010; 1:500) and anti-mouse (Thermo Fisher Scientific, A-11001, A-11003; 1:500) IgG antibodies at room temperature for 1 h, and washed 4 times with 0.5% Triton X-100 for 10 min.
Tumor tissue samples were heated, fixed, deparaffinized and rehydrated with a graded alcohol to distilled water series. The slides were heated in 0.01 M citric acid buffer (Thermo Fisher Scientific, 005000) for antigen repair. Samples were permeabilized with 0.5% Triton X-100 for 20 min and then blocked. The primary antibody and FITC-conjugated antibody were added for incubation as described for the cell immunofluorescence assay. Finally, the samples were stained with DAB dye (ZSGB Biotech, SP-9000), sealed with neutral resin (Solarbio Life Sciences, G8590) and observed under a microscope for image acquisition (Olympus FV1000, Tokyo, Japan). The fluorescent spot pixel value was used to quantify the fluorescent images. The primary antibodies for immunofluorescence staining were as follows: BNIP3 (ABclonal, A5683; 1:400), PINK1 (BioLegend, 846201, 1:150; Proteintech, 23274-1-AP, 1:250), PRKN/parkin (Santa Cruz Biotechnology, sc-32282; 1:100), TOMM20 (Proteintech, 11802-1-AP, 1:500; Abcam, ab56783, 1:300), and MAP1LC3A (Cell Signaling Technology, 4108; 1:300).
Cell viability assay
HepG2 or HepG2/ADR cells were seeded in 96-well plates and treated according to the indicated methods. Cell viability was measured by both MTT (Solarbio Life Sciences, M8180) assay and CCK-8 (Vazyme BioTech, A311-02) assay. First, 20 μL of MTT solution or CCK-8 solution was added to each well followed by incubation for 4 h (MTT assay) or 1 h (CCK-8 assay) at 37°C. Cells treated with an equivalent amount of DMSO were used as a negative control. The absorbance of each well was measured at 470 nm (MTT assay) or 450 nm (CCK-8 assay) with a SynergyTM HT multimode reader (BioTek, Winooski, VT). The average value of the optical density of three replicate wells was used to determine cell viability according to the following formula:
Statistical analysis
Data are presented as the mean± SD from triplicate, parallel, independent experiments unless otherwise indicated. Statistical analyses were performed using one-way ANOVA, with P values < 0.05 being considered significant. Significance levels *P < 0.05 and **P < 0.01 were considered as relatively significant levels.
Supplemental Material
Download MS Word (2.3 MB)Disclosure statement
No potential conflict of interest was reported by the author(s).
Supplementary material
Supplemental data for this article can be accessed here
Additional information
Funding
References
- Esteban-Martinez L, Sierra-Filardi E, McGreal RS, et al. Programmed mitophagy is essential for the glycolytic switch during cell differentiation. EMBO J. 2017;36:1688–1706.
- Prieto-Dominguez N, Ordonez R, Fernandez A, et al. Melatonin-induced increase in sensitivity of human hepatocellular carcinoma cells to sorafenib is associated with reactive oxygen species production and mitophagy. J Pineal Res. 2016;61:396–407.
- Chang JY, Yi HS, Kim HW, et al. Dysregulation of mitophagy in carcinogenesis and tumor progression. Biochim Biophys Acta Bioenerg. 2017;1858:633–640.
- Tabish TA, Zhang S, Winyard PG, et al. Developing the next generation of graphene-based platforms for cancer therapeutics: the potential role of reactive oxygen species. Redox Biol. 2018;15:34–40.
- Zhou H, Wang J, Zhu P, et al. NR4A1 aggravates the cardiac microvascular ischemia reperfusion injury through suppressing FUNDC1-mediated mitophagy and promoting Mff-required mitochondrial fission by CK2alpha. Basic Res Cardiol. 2018;113:23.
- Zhou H, Zhu P, Wang J, et al. Pathogenesis of cardiac ischemia reperfusion injury is associated with CK2alpha-disturbed mitochondrial homeostasis via suppression of FUNDC1-related mitophagy. Cell Death Differ. 2018;25:1080–1093.
- Chourasia AH, Macleod KF. Tumor suppressor functions of BNIP3 and mitophagy. Autophagy. 2015;11:1937–1938.
- Chen LY, Yang B, Zhou L, et al. Promotion of mitochondrial energy metabolism during hepatocyte apoptosis in a rat model of acute liver failure. Mol Med Rep. 2015;12:5035–5041.
- Braggio D, Koller D, Jin F, et al. Autophagy inhibition overcomes sorafenib resistance in S45F-mutated desmoid tumors. Cancer. 2019;125:2693–2703.
- Fan S, Price T, Huang W, et al. PINK1-dependent mitophagy regulates the migration and homing of multiple myeloma cells via the MOB1B-mediated Hippo-YAP/TAZ pathway. Adv Sci (Weinh). 2020;7:1900860.
- Wu H, Wang T, Liu Y, et al. Mitophagy promotes sorafenib resistance through hypoxia-inducible ATAD3A dependent Axis. J Exp Clin Cancer Res. 2020;39:274.
- Yan C, Luo L, Guo CY, et al. Doxorubicin-induced mitophagy contributes to drug resistance in cancer stem cells from HCT8 human colorectal cancer cells. Cancer Lett. 2017;388:34–42.
- Chourasia AH, Boland ML, Macleod KF, et al. Mitophagy and cancer. Cancer Metab. 2015;3:4.
- Jin SM, Lazarou M, Wang C, et al. Mitochondrial membrane potential regulates PINK1 import and proteolytic destabilization by PARL. J Cell Biol. 2010;191:933–942.
- Zhang C, Liu Z, Bunker E, et al. Sorafenib targets the mitochondrial electron transport chain complexes and ATP synthase to activate the PINK1-Parkin pathway and modulate cellular drug response. J Biol Chem. 2017;292:15105–15120.
- Hoshino A, Mita Y, Okawa Y, et al. Cytosolic p53 inhibits Parkin-mediated mitophagy and promotes mitochondrial dysfunction in the mouse heart. Nat Commun. 2013;4:2308.
- Dashzeveg N, Yoshida K. Cell death decision by p53 via control of the mitochondrial membrane. Cancer Lett. 2015;367:108–112.
- Liu K, Lee J, Kim JY, et al. Mitophagy controls the activities of tumor suppressor p53 to regulate hepatic cancer stem cells. Mol Cell. 2017;68:281–92 e5.
- Morales F, Giordano A. Overview of CDK9 as a target in cancer research. Cell Cycle. 2016;15:519–527.
- Yao JY, Xu S, Sun YN, et al. Novel CDK9 inhibitor oroxylin A promotes wild-type P53 stability and prevents hepatocellular carcinoma progression by disrupting both MDM2 and SIRT1 signaling. Acta Pharmacol Sin. 2021. DOI: https://doi.org/10.1038/s41401-021-00708-2
- Price NL, Gomes AP, Ling AJ, et al. SIRT1 is required for AMPK activation and the beneficial effects of resveratrol on mitochondrial function. Cell Metab. 2012;15:675–690.
- Ou X, Lee MR, Huang X, et al. SIRT1 positively regulates autophagy and mitochondria function in embryonic stem cells under oxidative stress. Stem Cells. 2014;32:1183–1194.
- Motta MC, Divecha N, Lemieux M, et al. Mammalian SIRT1 represses forkhead transcription factors. Cell. 2004;116:551–563.
- Eijkelenboom A, Burgering BM. FOXOs: signalling integrators for homeostasis maintenance. Nat Rev Mol Cell Biol. 2013;14:83–97.
- Lu P, Kamboj A, Gibson SB, et al. Poly(ADP-ribose) polymerase-1 causes mitochondrial damage and neuron death mediated by Bnip3. J Neurosci. 2014;34:15975–15987.
- Ma X, McKeen T, Zhang J, et al. Role and mechanisms of mitophagy in liver diseases. Cells. 2020;9:837.
- Georgakopoulos ND, Wells G, Campanella M, et al. The pharmacological regulation of cellular mitophagy. Nat Chem Biol. 2017;13:136–146.
- Katayama H, Kogure T, Mizushima N, et al. A sensitive and quantitative technique for detecting autophagic events based on lysosomal delivery. Chem Biol. 2011;18:1042–1052.
- Sun N, Malide D, Liu J, et al. A fluorescence-based imaging method to measure in vitro and in vivo mitophagy using mt-Keima. Nat Protoc. 2017;12:1576–1587.
- Klionsky DJ, Abdelmohsen K, Abe A, et al. Guidelines for the use and interpretation of assays for monitoring autophagy (3rd edition). Autophagy. 2016;12:1–222.
- Soutar MPM, Kempthorne L, Annuario E, et al. FBS/BSA media concentration determines CCCP’s ability to depolarize mitochondria and activate PINK1-PRKN mitophagy. Autophagy. 2019;15:2002–2011.
- Niu K, Fang H, Chen Z, et al. USP33 deubiquitinates PRKN/parkin and antagonizes its role in mitophagy. Autophagy. 2020 Apr;16:724–734.
- Zhang H, Pandey S, Travers M, et al. Targeting CDK9 reactivates epigenetically silenced genes in cancer. Cell. 2018;175:1244–58 e26.
- Allen GF, Toth R, James J, et al. Loss of iron triggers PINK1/Parkin-independent mitophagy. EMBO Rep. 2013;14:1127–1135.
- Zhang T, Xue L, Li L, et al. BNIP3 protein suppresses PINK1 kinase proteolytic cleavage to promote mitophagy. J Biol Chem. 2016;291:21616–21629.
- Wei L, Dai Y, Zhou Y, et al. Oroxylin A activates PKM1/HNF4 alpha to induce hepatoma differentiation and block cancer progression. Cell Death Dis. 2017;8:e2944.
- Teicher BA. Tumor models for efficacy determination. Mol Cancer Ther. 2006;5:2435–2443.
- Yan, C, Luo, L, Guo, CY, et al. Doxorubicin-induced mitophagy contributes to drug resistance in cancer stem cells from HCT8 human colorectal cancer cells. Cancer Lett. 2017;388:34–42.
- Yao N, Wang C, Hu N, et al. Inhibition of PINK1/Parkin-dependent mitophagy sensitizes multidrug-resistant cancer cells to B5G1, a new betulinic acid analog. Cell Death Dis. 2019;10:232.
- Alexa-Stratulat T, Pesic M, Gasparovic AC, et al. What sustains the multidrug resistance phenotype beyond ABC efflux transporters? Looking beyond the tip of the iceberg. Drug Resist Updat. 2019;46:100643.
- Sung H, Ferlay J, Siegel RL, et al. Global cancer statistics 2020: GLOBOCAN estimates of incidence and mortality worldwide for 36 cancers in 185 countries. CA Cancer J Clin. 2021;71:209–249.
- Sheng J, Shen L, Sun L, et al. Inhibition of PI3K/mTOR increased the sensitivity of hepatocellular carcinoma cells to cisplatin via interference with mitochondrial-lysosomal crosstalk. Cell Prolif. 2019;52:e12609.
- Song J, Zhao W, Lu C, et al. LATS2 overexpression attenuates the therapeutic resistance of liver cancer HepG2 cells to sorafenib-mediated death via inhibiting the AMPK-Mfn2 signaling pathway. Cancer Cell Int. 2019;19:60.
- Zheng L, Li C, Huang X, et al. Thermosensitive hydrogels for sustained-release of sorafenib and selenium nanoparticles for localized synergistic chemoradiotherapy. Biomaterials. 2019;216:119220.
- Amaravadi RK, Kimmelman AC, Debnath J, et al. Targeting autophagy in cancer: recent advances and future directions. Cancer Discov. 2019;9:1167–1181.
- Yan C, Li TS. Dual role of mitophagy in cancer drug resistance. Anticancer Res. 2018;38:617–621.
- Bernardini JP, Lazarou M, Dewson G, et al. Parkin and mitophagy in cancer. Oncogene. 2017;36:1315–1327.
- Kume S, Uzu T, Horiike K, et al. Calorie restriction enhances cell adaptation to hypoxia through Sirt1-dependent mitochondrial autophagy in mouse aged kidney. J Clin Invest. 2010;120:1043–1055.
- Naik PP, Birbrair A, Bhutia SK, et al. Mitophagy-driven metabolic switch reprograms stem cell fate. Cell Mol Life Sci. 2019;76:27–43.
- Maycotte P, Aryal S, Cummings CT, et al. Chloroquine sensitizes breast cancer cells to chemotherapy independent of autophagy. Autophagy. 2012;8:200–212.
- Maes H, Kuchnio A, Peric A, et al. Tumor vessel normalization by chloroquine independent of autophagy. Cancer Cell. 2014;26:190–206.
- Kai J, Yang X, Wang Z, et al. Oroxylin a promotes PGC-1alpha/Mfn2 signaling to attenuate hepatocyte pyroptosis via blocking mitochondrial ROS in alcoholic liver disease. Free Radic Biol Med. 2020;153:89–102.
- Wei L, Zhou Y, Qiao C, et al. Oroxylin A inhibits glycolysis-dependent proliferation of human breast cancer via promoting SIRT3-mediated SOD2 transcription and HIF1alpha destabilization. Cell Death Dis. 2015;6:e1714.
- Ni T, He Z, Dai Y, et al. Oroxylin A suppresses the development and growth of colorectal cancer through reprogram of HIF1alpha-modulated fatty acid metabolism. Cell Death Dis. 2017;8:e2865.
- Dai Q, Yin Q, Wei L, et al. Oroxylin A regulates glucose metabolism in response to hypoxic stress with the involvement of Hypoxia-inducible factor-1 in human hepatoma HepG2 cells. Mol Carcinog. 2016;55:1275–1289.