
ABSTRACT
Early events during development leading to exit from a pluripotent state and commitment toward a specific germ layer still need in-depth understanding. Autophagy has been shown to play a crucial role in both development and differentiation. This study employs human embryonic and induced pluripotent stem cells to understand the early events of lineage commitment with respect to the role of autophagy in this process. Our data indicate that a dip in autophagy facilitates exit from pluripotency. Upon exit, we demonstrate that the modulation of autophagy affects SOX2 levels and lineage commitment, with induction of autophagy promoting SOX2 degradation and mesendoderm formation, whereas inhibition of autophagy causes SOX2 accumulation and neuroectoderm formation. Thus, our results indicate that autophagy-mediated SOX2 turnover is a determining factor for lineage commitment. These findings will deepen our understanding of development and lead to improved methods to derive different lineages and cell types.
Abbreviations: ACTB: Actin, beta; ATG: Autophagy-related; BafA1: Bafilomycin A1; CAS9: CRISPR-associated protein 9; CQ: Chloroquine; DE: Definitive endoderm; hESCs: Human Embryonic Stem Cells; hiPSCs: Human Induced Pluripotent Stem Cells; LAMP1: Lysosomal Associated Membrane Protein 1; MAP1LC3: Microtubule-Associated Protein 1 Light Chain 3; MTOR: Mechanistic Target Of Rapamycin Kinase; NANOG: Nanog Homeobox; PAX6: Paired Box 6; PE: Phosphatidylethanolamine; POU5F1: POU class 5 Homeobox 1; PRKAA2: Protein Kinase AMP-Activated Catalytic Subunit Alpha 2; SOX2: SRY-box Transcription Factor 2; SQSTM1: Sequestosome 1; ULK1: unc-51 like Autophagy Activating Kinase 1; WDFY3: WD Repeat and FYVE Domain Containing 3.
Introduction
Macroautophagy (hereafter autophagy) is a conserved cellular catabolic pathway involving lysosomal degradation of cytoplasmic material. Autophagy is important for cellular homeostasis, but is also activated under various intrinsic and extrinsic conditions leading to cellular stress to facilitate cell survival [Citation1,Citation2]. Animal models lacking essential autophagy genes are characterized by increased tumorigenesis, neurodegeneration and developmental defects, indicating that autophagy plays an important role in development [Citation2,Citation3]. Additionally, studies have shown an important role for autophagy in embryo development, as well as during erythropoiesis, lymphopoiesis and adipogenesis [Citation4]. The exact roles of autophagy in the early events of development are however not clear.
Induction of autophagy is tightly regulated by several autophagy related (ATG) proteins, including the ULK1 (unc-51 like autophagy activating kinase 1) complex, the class III phosphatidylinositol 3-kinase (PtdIns3K) complex and the ATG12–ATG5-ATG16L1 complex [Citation5,Citation6]. The activity of the ULK1 kinase is tightly regulated by the MTOR (mechanistic target of rapamycin kinase) and PRKAA2 (protein kinase AMP-activated catalytic subunit alpha 2)/ AMP-activated protein kinase (AMPK). The activated ULK1 complex facilitates production of PtdIns3P at early autophagic membranes, leading to recruitment of the ATG12–ATG5-ATG16L1 complex through its interaction with the PtdIns3P binding protein WIPI2 (WD repeat domain, phosphoinositide interacting 2) [Citation7] and direct membrane interactions [Citation8,Citation9]. The ATG12–ATG5-ATG16L1 complex further facilitates the conjugation of Atg8 homolog proteins of the MAP1LC3/LC3 (microtubule associated protein 1 light chain 3) and GABARAP (GABA type A receptor-associated protein) subfamilies to phosphatidylethanolamine (PE) in the autophagic membrane to allow cargo selection and autophagic flux [Citation10,Citation11]. During selective autophagy, cargo to be degraded is recognized by specific autophagy receptors that can bind to cargo (often ubiquitinated) and Atg8 proteins in the autophagic membrane [Citation12,Citation13]. One such autophagy receptor is the ubiquitin-binding protein SQSTM1/p62 (sequestosome 1) that also facilitates recruitment of the ULK1 complex and the PtdIns3P binding protein WDFY3/ALFY (WD repeat and FYVE domain containing 3) to stimulate formation of the autophagosomal membrane around the cargo to be degraded [Citation14–16]. After its completion, the autophagosome fuses with acidic lysosomes to generate an autolysosome where the sequestered cargo becomes degraded. The latter can be effectively blocked by lysosomal inhibitors, such as BafilomycinA1 (BafA1) and chloroquine (CQ), thus inhibiting downstream cargo degradation and recycling of sugars, amino acids or nucleic acids [Citation17,Citation18].
During embryonic development, cells undergo a number of changes including the initiation of organogenesis and differentiation of functional tissues. The development of the early embryo involves a pluripotent cell population within the inner cell mass differentiating to the epiblast and then to the three germ layers, ectoderm, mesoderm and endoderm, being choreographed through both nodal growth differentiation factor (NODAL) and WNT signaling pathways [Citation19]. There is considerable insight into the role of autophagy during the differentiation into erythrocytes, lymphocytes, adipocytes, keratinocytes, osteoclast, etc., and also in human embryonic stem cells (hESCs) [Citation4,Citation20–22]. However, our knowledge about the role of autophagy in germ layer specification is sparse. hESCs and hiPSCs serve as a potentially limitless source of cells to facilitate studies related to cellular reprogramming [Citation23]. These cells offer a unique window to explore the earliest events of differentiation during early human development [Citation24]. To date, researchers have developed differentiation procedures that mimic the developmental trajectory, coaxing human pluripotent stem cells (hPSCs) to cell types that are representative of the three germ layers, using either growth factors, a combination of growth factors and small molecules or solely small molecules [Citation25–30].
POU5F1/OCT4 (POU class 5 homeobox 1), SOX2 (SRY-box transcription factor 2) and NANOG (Nanog homeobox) are intrinsic factors that regulate pluripotency and the modulation of their levels is associated with lineage commitment [Citation31,Citation32]. For example, SOX2 has been shown to be important for neuroepithelial formation, while POU5F1 acts as a lineage specifier for mesendoderm [Citation4,Citation33]. Interestingly, both POU5F1 and SOX2 counteract the formation of definitive endoderm (DE), while NANOG activates the transcriptional network required for DE formation [Citation34]. A recent study utilizing cancer stem cells reported that SOX2, after post-translational modification, is exported from the nucleus and targeted for degradation by autophagy [Citation35,Citation36]. The impact of autophagy on the levels of SOX2 during lineage commitment has however yet to be explored.
In this study, we elucidate the role of autophagy during the formation of the three germ layers, using hiPSCs as our model system. We show that downregulation of autophagy is important for hiPSCs to exit pluripotency. A further upregulation of autophagy facilitates mesoderm and endoderm formation, while continuous downregulation of autophagy takes cells toward neuroectoderm. Importantly, we find that SOX2, but not the other pluripotency factors, is selectively degraded by autophagy during endoderm differentiation. In conclusion, we show that autophagy-mediated degradation of SOX2 determines lineage specificity during hiPSC differentiation.
Results
Autophagy is induced during DE differentiation from hiPSCs
To investigate the kinetics and role of autophagy during early events of germ layer specification, we used well established procedures that have been shown to effectively differentiate human iPSCs to cell types representative of the three lineages, definitive endoderm (DE), mesoderm (cardiomyocytes) and ectoderm (neuroepithelial stem cells) [Citation28,Citation29,Citation37].
DE is one of the three primary germ layers (innermost), contributing to the formation of endodermal-related organs, including the liver, thyroid, stomach, lungs, pancreas and intestine [Citation38,Citation39]. To efficiently differentiate hiPSCs toward DE, we took advantage of a growth-factor-free protocol that employs the GSK3 (glycogen synthase kinase 3) inhibitor CHIR99021 (WNT agonist) [Citation28,Citation40,Citation41]. In short, the hiPSC line AG27 [Citation42] was treated with CHIR99021 for 24 h, which drives the cells toward primitive streak (PS/mesendoderm) (Fig. S1A). Upon the withdrawal of CHIR99021, the cells transit to DE over the next 24 h. The cells were confirmed for pluripotency using immunofluorescence before setting up differentiations (Fig. S1B). The various stages of differentiation toward DE were confirmed morphologically over the 48 h (Fig. S1C). This was further verified by immunofluorescence microscopy, showing high expression levels of the DE markers FOXA2 (forkhead box A2) and SOX17 (SRY-box transcription factor 17) (Fig. S1D), in line with previous reports describing an average DE differentiation efficiency of 80% or greater using this protocol [Citation28,Citation40,Citation41,Citation43]. The observed changes in morphology were supported by expected changes in gene expression, as assessed by expression analysis of stage specific markers by real-time quantitative PCR (RTqPCR). Increased mRNA levels of MIXL1 (Mix paired-like homeobox) at 24 h indicated the progression through a PS/mesendoderm stage [Citation44,Citation45], while elevated expression levels of FOXA2 and SOX17 were observed at 48 h (Fig. S1E) [Citation46–48].
To examine the role of autophagy in DE formation, we analyzed transcript and protein levels of various autophagy-related genes involved in bulk and selective autophagy in AG27 cells. The transcript levels of LC3B and SQSTM1 remained stable throughout, whereas WDFY3, ATG5 and ATG7 showed an increase in transcript levels by the 48 h differentiation of AG27 cells to endoderm (Fig. S1F–J). Similarly, the levels of several autophagy related proteins were modulated during DE formation of AG27 cells as analyzed by Western blotting. While the total level of the ULK1 kinase remained stable during DE differentiation, the levels of AMPK- mediated ULK1 phosphorylation at Ser555 fluctuated during DE differentiation, dipping at 4 h and 24 h (). Also, the levels of WDFY3, involved in selective autophagy, showed a transient dip at 4 h and increased again from 8 h, while SQSTM1 levels decreased at both 24 and 48 h of differentiation, indicating an upregulation of autophagy (). In line with this, protein levels of the PIK3C3/VPS34 kinase increased while the levels of phosphorylated RPS6KB1/p70S6K (ribosomal protein S6 kinase B1; a direct target of MTOR) decreased during DE formation (Fig. S1K). There were no significant differences in the protein levels of LC3B and GABARAP during DE differentiation ( ,D and S1K), but it is difficult to conclude about the autophagic flux as these blots represent steady state levels of these autophagy markers.
Figure 1. Autophagy is induced during DE differentiation. (A) Cell lysates from AG27 hiPSCs were collected at the indicated time points until DE formation (confirmed by RTqPCR and fluorescence microscopy) and analyzed by Western blotting using the indicated antibodies. The blots are representative of three independent experiments (n = 3). ACTB/beta actin was used as a loading control. (B–D) Quantification of the indicated protein levels during DE formation (0 and 48 h) in AG27 cells. The relative expression levels were normalized to that at 0 h and are presented as the mean of three independent experiments (n = 3); error bars represent SD. *P < 0.1, **P < 0.01, ***P < 0.001; (B) WDFY levels (relative to ACTB) and phospho-ULK1 (Ser-555):total ULK1 levels, (C) SQSTM1 levels (relative to ACTB), (D) LC3B-I and LC3B-II levels (relative to ACTB). (E) The human ESC line, H1, was differentiated to DE and lysed in RIPA buffer at 0 and 48 h, followed by Western blotting using the indicated antibodies. The blots are representative of three independent experiments. ACTB was used as a loading control. * represents RPS6KB p85 and ** represents phosphorylated RPS6KB p85 that are both recognized by the anti-RPS6KB kinase antibody. (F) Quantification of p-ULK1:ULK1 and p-RPS6KB:RPS6KB levels (relative to ACTB) during DE formation from H1 cells (0–48 h). The relative expression levels were normalized to that at 0 h and are presented as the mean of three independent experiments (n = 3); error bars represent SD. *P < 0.1, **P < 0.01, ***P < 0.001. (G) Quantification of SQSTM1 and LC3B-II levels (relative to ACTB) during DE formation from H1 cells (0–48 h). The relative expression levels were normalized to that at 0 h and are presented as the mean of three independent experiments (n = 3); error bars represent SD. *P < 0.1, **P < 0.01, ***P < 0.001. (H) Schematic diagram showing the principle of the mCherry-EGFP double-tag (dt) approach to monitor autophagic flux. mCherry-EGFP-tagged LC3B is visualized as yellow puncta in both phagophore and autophagosome structures, while after lysosomal fusion only red puncta are observed due to quenching of the EGFP signal in the acidic lysosome. (I) AG27 hiPSCs with stable doxycycline-inducible expression of mCherry-EGFP-LC3B were grown in full media or starved (EBSS) for 1 h in the absence or presence of the ULK1 inhibitor MRT68921 (EBSS+MRT) to study autophagosome formation and autophagic flux. Arrowheads indicate autolysosomes (red only structures). Image is representative of three independent experiments. Scale bar: 10 µm. (J) AG27 hiPSCs expressing mCherry-EGFP-LC3B were seeded as single cells and differentiated to DE. The cells were fixed at different time points after induction of differentiation and processed for microscopy. Images are representative of three independent experiments. Scale bar: 10 µm. (K) Quantification of the number of red-only puncta formed during DE differentiation from images as shown in (J). A minimum of 20 images at each time point (n = 20) were used for quantification with ImageJ analysis. Error bars represent SD. **P < 0.01. (L) AG27 iPSCs were fixed before (0 h) and after (48 h) DE formation and processed for immunofluorescence microscopy using an anti-LC3B antibody. Representative images with endogenous LC3B spots (green, arrowheads) are shown. Nuclei were counterstained with DAPI. Images are representative of three independent experiments. Scale bar: 10 µm. (M) The number of LC3B puncta formed during DE formation were quantified from a minimum of 20 images from each time point as shown in (L) using ImageJ analysis. Error bars represent SD. **P < 0.01.
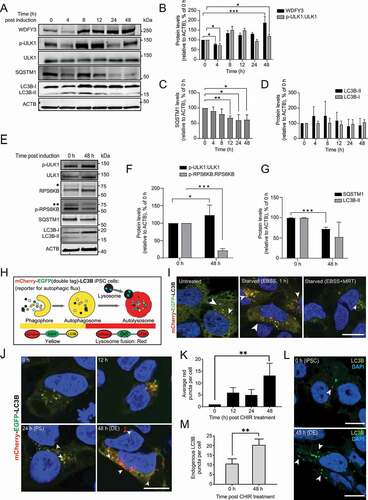
An induction of autophagy upon DE differentiation was also seen in the human ESCs line H1. DE differentiation was induced by treating the cells with CHIR99021 for 24 h, followed by 24 h incubation in the absence of CHIR99021 (Fig. S1L). Increased autophagy levels at 48 h was demonstrated by increased ULK1 phosphorylation, reduced MTOR activity and reduced SQSTM1 levels (–G; Fig. S1M).
As autophagy is a dynamic process where cargo and membrane-bound LC3-II become rapidly degraded in the autolysosome, it is difficult to evaluate levels of autophagic flux at steady state. We therefore generated a stable iPSCs line containing a doxycycline (Dox) inducible mCherry-EGFP-tagged LC3B reporter (hereafter referred to as double-tagged LC3B, dt-LC3B), which can be visualized as yellow puncta in early autophagic structures and as red-only puncta upon autophagosome fusion with a lysosome, due to quenching of the EGFP signal in the low pH environment of the autolysosome (). Both yellow and red puncta were seen upon induction of dt-LC3B expression in iPSCs, indicating basal levels of autophagy for pluripotency maintenance (, left panel). The dt-LC3B line was validated for the expression of the pluripotency factors POU5F1, SOX2 and NANOG using immunofluorescence microscopy (Fig. S2A). To demonstrate that the dt-LC3B iPSC cell line responded to known autophagy modulators, the cells were starved for 1 h (EBSS media) to induce autophagy in the absence or presence of an inhibitor of ULK1 activation (MRT68921 dihydrochloride) [Citation49]. As expected, starvation caused an increase in the total number of both yellow and red puncta (, middle panel), while MRT68921 drastically reduced the number of red puncta (, right panel), demonstrating that the dt-LC3B iPSC line responded to autophagy modulation. To study the kinetics of autophagic flux during DE formation, cells were fixed, and analyzed by confocal microscopy at 0, 12, 24 or 48 h during DE differentiation and the relative number of red-only puncta was quantified. In line with our Western blot data, an increased autophagic flux was observed at 12 h with increasing numbers of red-only puncta present by the end of DE differentiation at 48 h (). This was further confirmed by an increased number of endogenous LC3B puncta at 48 h after induction of DE differentiation (). Taken together, our data indicate that autophagy is upregulated during differentiation of hiPSCs and hESCs toward DE formation.
Opposite roles of autophagy during differentiation of hiPSCs to cardiomyocytes and neuroectoderm
To investigate the kinetics of autophagy in mesoderm specification, AG27 iPSCs were treated with a protocol that leads to generation of beating cardiomyocytes after 12−17 days [Citation29] (Video SV1 and SV2) that were positive for the sarcomere marker ACTN1 (actinin alpha 1) (Fig. S2B). This was further confirmed by qRT-PCR data from beating cardiomyocytes showing a strong increase in the levels of cardiomyocyte-specific markers, NKX2.5 (NK2 homeobox) and TNNT2 (troponin T2, cardiac type) (Fig. S2C).
The levels of WDFY, p-ULK1 (Ser555), SQSTM1 and LC3B proteins were determined by immunoblotting of cell lysates at different time points throughout cardiomyocyte formation until beating was observed. Enhanced protein levels of WDFY3 and the phosphorylated form of ULK1 (Ser555), as well as reduced levels of SQSTM1 and increased LC3B-II levels (–C) indicated an induction of autophagy during cardiomyocyte differentiation. To further corroborate our findings, the mCherry-EGFP-LC3B iPSC line was stimulated toward cardiomyocyte differentiation and the level of yellow and red-only puncta was analyzed by confocal imaging at different days during differentiation. Indeed, the total number of LC3B puncta, as well as red-only puncta increased upon mesoderm differentiation (), in line with previous findings showing that both endoderm and mesoderm follow a common path until the formation of mesendoderm where there is a bifurcation to either endoderm or mesoderm [Citation50].
Figure 2. Kinetics of autophagy during differentiation to mesoderm and neuroectoderm. (A) Autophagy kinetics during cardiac differentiation. AG27 human iPSCs were seeded and treated with CHIR on day 3 (8 µM). On day 6, cells were treated with IWP2 (5 µM). Cells started beating between day 8 and 17. Cell lysates were collected at different time points and processed for Western blotting using the indicated antibodies. The blots are representative of three independent experiments (n = 3). ACTB was used as a loading control. (B) Quantification of SQSTM1 and LC3B-II levels (relative to ACTB) during mesoderm (cardiomyocyte) formation from AG27 cells. The relative expression levels were normalized to that at day 0 and are presented as the mean of three independent experiments (n = 3); error bars represent SD. *P < 0.1, **P < 0.01, ***P < 0.001. (C) Quantification of WDFY and p-ULK1 (Ser-555):total ULK1 levels (relative to ACTB) during mesoderm (cardiomyocyte) formation from AG27 cells. The relative expression levels were normalized to that at day 0 and are presented as the mean of three independent experiments (n = 3); error bars represent SD. *P < 0.1, **P < 0.01, ***P < 0.001. (D) AG27 hiPSCs with stable Dox-inducible expression of mCherry-EGFP-LC3B were seeded as single cells and differentiated to cardiomyocytes. The cells were fixed at different days after induction of cardiomyocytes differentiation until day 7 and processed for microscopy. Images are representative of three independent experiments. Scale bar: 10 µm (day 0–5), 100 µm (day 7). (E) The number of LC3B puncta formed during DE formation were quantified from a minimum of 100 cells from each time point (except day 7) as shown in (D) using ImageJ analysis. Error bars represent SD. ***P < 0.001. (F) Autophagy kinetics during neuroectoderm differentiation. AG27 cells were collected at the indicated time points during neuroectoderm differentiation and processed for Western blotting using the indicated antibodies (n = 3). ACTB was used as a loading control. (G) Quantification of WDFY, p-ULK1:ULK1 and LC3B-II levels (relative to ACTB) during neuroectoderm formation (day 0-day 6) from AG27 cells. The relative expression levels were normalized to that at day 0 and are presented as the mean of three independent experiments (n = 3); error bars represent SD. *P < 0.1, **P < 0.01, ***P < 0.001. (H) AG27 hiPSCs with stable Dox-inducible expression of mCherry-EGFP-LC3B were seeded as colonies (EDTA splitting) and differentiated to neuroectoderm. The cells were fixed at different days after induction of neuroectoderm differentiation and processed for microscopy. Images are representative of three independent experiments. Scale bar: 10 µm. (I) The number of red puncta were quantified from a minimum of 100 cells from each time point as shown in (H) using ImageJ analysis. Error bars represent SD.
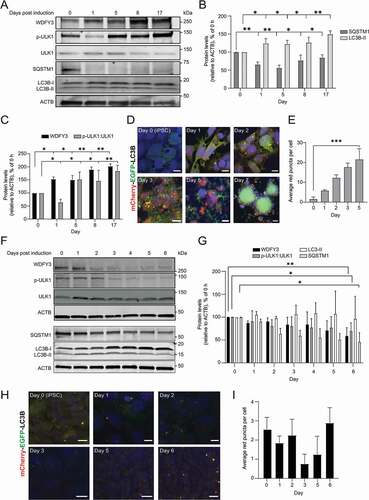
In contrast to DE and mesoderm differentiation, the formation of the ectoderm does not involve the PS/mesendoderm stage [Citation51]. We therefore assessed whether the kinetics of autophagy during ectoderm formation would differ from that seen during endoderm and mesoderm formation. Ectoderm formation was initiated using a well-established procedure of dual SMAD inhibition, leading to the generation of neuroectoderm over a 6-day period [Citation37]. The successful formation of the neuroectoderm was confirmed at day 6 by assessing both the protein and mRNA levels of the ectodermal lineage markers NES (nestin) and PAX6 (paired box 6) (Fig. S2D-F). Importantly, the protein levels of WDFY3 and active p-ULK1 (Ser555), were reduced over the 6-day period (), while LC3B lipidation and SQSTM1 levels remained rather stable during ectoderm formation. To further characterize the autophagic flux during ectoderm differentiation, the mCherry-EGFP-LC3B iPSC line was treated to induce the formation of ectoderm. In contrast to what was observed during endoderm and mesoderm formation, no significant increase in red-only puncta was observed during the 6 days treatment protocol (), indicating that autophagic flux is kept at a low level during neuroectoderm formation.
Short-term inhibition of autophagy facilitates exit from pluripotency
Autophagy has been shown to be essential for both attaining and maintaining a pluripotent state [Citation52,Citation53]. In line with this, our data show a transient dip in the protein levels of several proteins involved in autophagy (p-ULK1[Ser555], PIK3C3 and WDFY3) at 4 h during DE formation compared to the iPSC state (; Fig. S1K), indicating that a transient inhibition of autophagy brings iPSCs out of pluripotency. This was confirmed by experiments showing that hiPSCs treated with the lysosomal inhibitors bafilomycin A1 (BafA1) and chloroquine (CQ) [Citation17,Citation18] for 4 h displayed a change in cell morphology commencing as early as 8 h (data not shown) and within 24 h the cells had lost their typical compact pluripotent morphology, becoming looser and in some cases flatter, with increased cytoplasmic volume and were more elongated (). Corroborating these morphological findings, we found that mRNA levels of the pluripotency factors SOX2, NANOG and KLF4 (Kruppel like factor 4) were significantly reduced in both BafA1 and CQ treated hiPSCs (), indicating that inhibition of autophagy was sufficient to drive cells out of pluripotency.
Figure 3. Inhibition of autophagy facilitates exit from pluripotency and drives hiPSC cells toward neuroectoderm. (A) AG27 iPSCs were treated or not with the autophagy inhibitors bafilomycin A1 (BafA1) or chloroquine (CQ) for 4 h before replacing with E8 medium. Representative images of the cell morphology at the 24 h time point are shown (n = 3). Scale bar: 50 µm. (B) AG27 iPSCs were treated as in (A) and processed for RTqPCR analysis at 24 h using TaqMan probes for major pluripotency genes (KLF4, SOX2, NANOG). Untreated iPSCs served as control. The graph shows the average of three independent experiments (n = 3). Error bars represent SD. **P < 0.01, ***P < 0.001. (C) AG27 iPSCs were treated as in (A) and processed for RTqPCR analysis at 24 h using an array card (Fig. S3A) to analyze the transcript levels of genes of various germ layers. The most significant changes in transcript levels are shown and graphs represent an average of three independent experiments (n = 3). Error bars represent SD. *P < 0.05, **P < 0.01, ***P < 0.001. (D) AG27 iPSCs were treated or not with BafA1 or CQ for 24 h and then processed for RTqPCR analysis using an array card (Fig. S3A) to analyze the transcript levels of genes of various germ layers. The graph shows PAX6 expression levels and represents an average of three independent experiments (n = 3). Error bars represent SD. ***P < 0.001. (E) AG27 iPSCs cells were electroporated with guide RNA for ATG7 (). The tracr-RNA was fluorescently labeled with ATTO dye. Clones were screened using restriction fragment length polymorphism (RFLP). Cell lysates from wild type (WT) and ATG7± hiPSC clones were analyzed by immunoblotting against LC3B to confirm the effect of ATG7 depletion on LC3B lipidation (LC3B-I to LC3B-II conversion) (n = 3). (F) Cells from wild type (WT) and ATG7± hiPSC were differentiated into neuroectoderm using SMAD inhibitors. Lysate was collected daily until day 6 and processed for Western blotting (n = 3). ACTB was used as a loading control. (G) WT and ATG7+/ -AG27 cells were grown as single cells in a 90 mm dish in E8 medium and observed for morphological changes over 30 days post-seeding. Medium was changed every day. Representative images of three independent experiments, taken at different time-points post-seeding are shown. Scale bar: 50 µm. (H) AG27 WT (upper panels) and ATG7± cells (lower panels) were seeded and stained with PAX6 antibodies 3 days after seeding. Nuclei were stained with Hoechst. Images are representative of three independent experiments. Scale bar: 100 µm. (I) RNA was isolated from WT and ATG7±hiPSCs cells grown in cultures for 2 weeks and then analyzed by RTqPCR (TaqMan assay) against PAX6. The graph is a representative of three independent experiments (n = 3). Error bars represent SD. ***P < 0.001. (J) AG27 WT (upper four panels) or ATG7± cells (lower four panels) were grown in cultures for 2 weeks, then fixed and stained with antibodies against TUBB3 and LC3B and analyzed by confocal microscopy. Nuclei were stained with DAPI. Images are representative of three independent experiments. Scale bar: 50 µm.
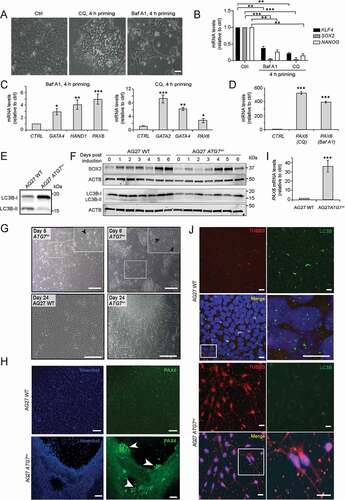
To further understand how inhibition of autophagy affected the state of the hiPSCs, we performed RTqPCR against a panel of various pluripotency and lineage-specific markers in an array card format (Fig. S3A) [Citation42]. Concomitant with the observed morphological changes, we found elevated transcript levels of markers of all the three germ layers in iPSCs treated with autophagy inhibitors, including GATA4 (GATA binding protein 4),HAND1 (heart and neural crest derivatives expressed 1) and GATA2 as well as PAX6 (), which are markers for endoderm, mesoderm and ectoderm, respectively [Citation54–57]. These results indicate that a short 4 h inhibition of autophagy in pluripotent stem cells results in their exit from a pluripotent state, allowing commitment toward the three germ layers.
Prolonged inhibition of autophagy drives hiPSC cells toward Neuroectoderm
We next investigated how prolonged inhibition of autophagy could influence the fate of hiPSCs. In brief, hiPSCs were incubated with BafA1 or CQ for 24 h, followed by RTqPCR analysis of the resulting population of cells against our panel of markers as described above (Fig. S3A). Interestingly, the levels of PAX6 (neuroectoderm) were greatly elevated (up to 500-fold as compared to control) after 24 h following treatment with either BafA1 or CQ (), indicating that extended inhibition of autophagy may drive hiPSCs to a neuroectodermal fate. This is supported by our protein kinetics data, showing that autophagy is downregulated during neuroectoderm formation (–I).
To further assess the effect of inhibition of autophagy on lineage commitment, we used clustered regularly interspaced short palindromic repeats (CRISPR)-mediated genome editing to construct an ATG7 hiPSC knockout line. ATG7 functions as an E1-like enzyme in the lipidation of LC3 and GABARAP proteins and its disruption will thus inhibit autophagic flux [Citation58,Citation59]. For the depletion of ATG7 protein production, we targeted the region close to the start codon of the ATG7 sequence. The CAS9-induced cleavage led to a 32 bp deletion resulting in a premature stop codon (Fig. S3B-C). Interestingly, while a number of heterozygous (ATG7±) clones were obtained, no homozygotes (ATG7−/−) clones were found, suggesting that ATG7 is essential for survival of hiPSCs. Importantly, LC3B lipidation was substantially reduced in the heterozygous ATG7± hiPSC lines as compared to the isotype control (), indicating a reduction of ATG7 activity in the heterozygous clones. When ATG7± hiPSC was subjected to neuroectoderm formation, an early induction (by day 4) of neuroectoderm marker SOX2 was observed as compared to wild-type AG27 cells (, Fig. S3D). The levels of pluripotency markers in the ATG7± hiPSC were reduced as compared to the parental AG27 cells, indicating relatively less stability of these cells in pluripotency state (Fig. S3E). Moreover, when taken toward the endoderm, the level of the DE marker SOX17 was reduced in ATG7± hiPSC as compared to wild-type AG27 cells at 48 h, indicating a possible delay toward endoderm differentiation (Figure S3F). Intriguingly, when the hiPSCs were grown under standard culture conditions, we observed that a distinct cell population began to migrate from the ATG7± hiPSC colonies and not from the isotype controls, when the cells became more confluent (6–7 days in culture) (). In line with this, we noted a loss of typical pluripotent stem cell morphology by day 5 and the appearance of neural “rosettes-like” structures in the ATG7± hiPSCs by phase contrast microscopy. By day 8, the number of “rosette-like” structures had further increased (, upper right panel). A similar morphology was observed in many other ATG7± hiPSC clones, confirming that this was not an artifact (Fig. S3G). By day 24, we noted the formation of several neurosphere-like structures with putative neuron-like cells emerging (, lower right panel) in contrast to wildtype control (, lower left panel). As long-term chemical inhibition of autophagy was found to drive iPSCs toward neuroectoderm (), we speculated that the cells migrating from the ATG7± hiPSC colonies might be neuroectodermal in nature. Indeed, PAX6 positive cells were detected as early as 3 days post plating and these cells corresponded to the cells that migrated from the colony or close to the leading edge of the colony (). Moreover, strong upregulation of PAX6 was detected in the ATG7± hiPSCs (day 5) by RTqPCR (). The neuron-like cells derived from the ATG7± hiPSCs were positive for the neuronal marker TUBB3 (tubulin beta 3 class III) [Citation60], as analyzed by immunofluorescence microscopy at day 15 (). As expected, the formation of endogenous LC3B puncta was strongly reduced in ATG7± hiPSC compared to WT cells (, zoom). Taken together, our results indicate that while a brief inhibition of autophagy facilitates exit from pluripotency, extended inhibition of autophagy appears to drive the cells toward an ectodermal fate.
SOX2 is degraded by autophagy during DE differentiation
Having confirmed that autophagy is upregulated during DE differentiation, we next asked whether induction of autophagy would facilitate differentiation of iPSCs to DE. To investigate this, iPSCs were treated with the autophagy inducer rapamycin for the first 24 h of DE differentiation. Interestingly, rapamycin-treated cells showed typical DE morphology by 48 h, with reduced areas of undifferentiated cells as compared to the standard protocol (Fig. S4A). Moreover, both the mRNA and protein levels of SOX17 increased upon rapamycin treatment as compared to control (), suggesting that induction of autophagy may improve DE formation.
Figure 4. Autophagy modulation affects DE differentiation through SOX2 degradation. (A) AG27 iPSCs were treated with CHIR to induce DE formation in the absence or presence of the MTOR inhibitor rapamycin. After 48 h, SOX17 levels were assessed by RTqPCR. The graph is representative of three independent experiments (n = 3). Error bars represent SD. ***P < 0.001. (B) AG27 iPSCs were treated as in (A) and processed for Western blotting using a SOX17 antibody (n = 3). ACTB was used as a loading control. (C) AG27 cells were treated with CHIR to induce DE differentiation in the absence or presence of the ULK1 inhibitor MRT68921. Cell lysates were collected at different timepoints of DE differentiation and analyzed by Western blotting using antibodies against the pluripotency factors POU5F1, SOX2 and NANOG (n = 3). ACTB was used as a loading control. (D) Quantification of SOX2 levels (relative to ACTB) in lysates from cells treated as in (C) at 0, 12 and 48 h during DE differentiation. The relative expression levels were normalized to that at day 0 and are presented as the mean of three independent experiments (n = 3); error bars represent SD. *P < 0.1, **P < 0.01, ***P < 0.001. (E) Cell lysates from AG27 cells treated or not with autophagy inhibitor, BafA1 or autophagy inducer, rapamycin and were collected at different timepoints (0, 12 and 48 h) of DE differentiation, followed by immunoblotting with the indicated antibodies (n = 3). ACTB was used as loading control. (F) Quantification of SQSTM1, SOX2 and SOX17 levels (relative to ACTB) in cell lysates from BafA1 and rapamycin treated cells during DE differentiation (0, 12 and 48 h). The relative expression levels were normalized to that at day 0 and are presented as the mean of three independent experiments (n = 3); error bars represent SEM. *P < 0.1, **P < 0.01, ***P < 0.001, ****P < 0.0001. (G) Cell lysates from ATG7±cells directed toward DE differentiation at different time points (0, 12 and 48 h) were analyzed by Western blotting using antibodies against FOXA2 and SOX2. ACTB was used as loading control. Blot is representative of three independent experiments. (H) Quantification of SOX2, FOXA2 and SOX17 levels (relative to ACTB) in cell lysates from ATG7± cells during DE differentiation (0, 12 and 48 h). The relative expression levels were normalized to that at day 0 and are presented as the mean of three independent experiments (n = 3); error bars represent SD. *P < 0.1, **P < 0.01, ***P < 0.001. (I) AG27 with stable Dox-inducible expression of mCherry-EGFP-tagged SOX2 were treated with CHIR or CHIR+MRT to induce DE formation. MRT was removed after 8 h of treatment. The cells were fixed at 24 h (left panels) or 48 h (right panels) post treatment and processed for microscopy. Red puncta represent SOX2 in autolysosomes. Images are representative of three independent experiments. Scale bar: 10 µm. (J) Quantification of the number of red-only puncta formed (autophagic flux) during DE differentiation from images as shown in (J). A minimum of 20 images at each time point (n = 20) were used for quantification with ImageJ analysis. Error bars represent SD. **P < 0.01. (K) AG27 were treated with CHIR or CHIR+MRT to induce DE formation. MRT was removed after 8 h of treatment. Cells were fixed at 24 (upper left two panels) or 48 h (upper right two panels) post differentiation, followed by immunofluorescence analysis against endogenous SOX2 and LAMP1 (lysosome marker). Nuclei were counterstained with DAPI. The lower panel represents zoomed images on the indicated region. Images are representative of three independent experiments. Scale bar: 10 µm. (L) AG27 hiPSCs were treated with CHIR to induce DE formation and fixed 24 h post differentiation, followed by immunofluorescence analysis against endogenous SOX2 and SQSTM1. Nuclei were counterstained with Hoechst. Arrowheads show colocalization. Image is representative of three independent experiments. Scale bar: 10 µm.
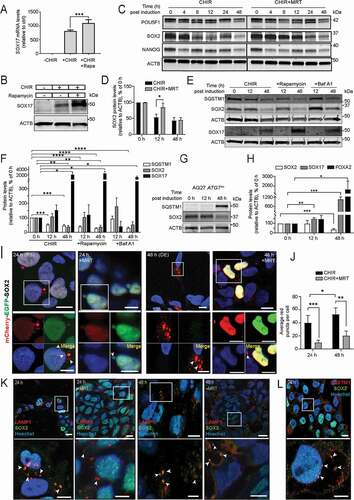
To further elucidate the role of autophagy during DE formation, we asked whether autophagy might facilitate degradation of a pluripotency factor (POU5F1, SOX2 or NANOG) during DE formation. As expected, we observed a strong reduction in the levels of SOX2, NANOG and POU5F1 by 48 h of DE differentiation in control cells (). Remarkably, SOX2 degradation was delayed (up to 12 h) under DE differentiation in cells treated with the ULK1 inhibitor MRT68921 as compared to control cells (), indicating that SOX2 might be a potential cargo for autophagy. This was further confirmed in cells treated with Bafilomycin A1 (BafA1) for 2 h before collection at 12 or 48 h during DE formation, showing increased levels of SOX2 at both time points as compared to control cells (), as well as decreased level of SOX17 at 12 h, indicating a possible delay in DE formation upon blocking autophagy. Importantly, SOX2 was also stabilized at 12 h of DE differentiation in ATG7± hiPSCs compared to WT cells (; Fig. S4B), further indicating that SOX2 is processed through autophagy. ATG7± hiPSCs were able to make DE, but the level of SOX17 was reduced at 48 h compared to WT cells (Fig. S3F). Further supporting the role of autophagy in SOX2 degradation, we found a reduction in the levels of SOX2 at 12 h in cells treated with the autophagy inducer rapamycin (MTORC1 inhibitor) (). As rapamycin treatment also enhanced mRNA and protein levels of SOX17 (), our data indicate that enhanced autophagy facilitates SOX2 processing and DE formation.
To further confirm these findings, we generated stable hiPSC lines carrying inducible double-tagged (Cherry-EGFP) pluripotency factors (dt-POU5F1, dt-SOX2 or dt-NANOG). As expected, all cell lines showed nuclear localization of the double-tagged proteins under pluripotent conditions (Fig. S4C). Next, the double-tagged lines were subjected to DE differentiation to assess if any of the pluripotency factors were substrates for autophagy. Indeed, the autophagic degradation of dt-SOX2 was indicated by the clear formation of red-only puncta outside the nucleus within 24 h (mesendoderm), which increased further by 48 h (). The number of red-only puncta were significantly reduced upon treatment with the ULK1 inhibitor MRT68921 at both time points, indicating that SOX2 is a cargo for autophagy during DE differentiation (). By 48 h, the nuclear expression of SOX2 was undetectable (as compared to both 24 h and control), indicating that the majority of SOX2 was targeted to lysosomes. In contrast, we observed no significant formation of red puncta for dt-NANOG or dt-POU5F1 during DE formation (data not shown). Lysosomal degradation of SOX2 was further supported by demonstrating that endogenous SOX2 colocalized extensively with LAMP1 (lysosomal associated membrane protein 1) at the perinuclear region, at both 24 and 48 h in control cells, which also was prevented by inhibition of ULK1, majorly at 24 h (). Furthermore, some colocalization between SOX2 and SQSTM1 was detected at 24 h, suggesting that the selective autophagy machinery might be involved in degradation of SOX2 (). Taken together, these data indicate that SOX2 is degraded through the process of autophagy during DE formation.
To investigate whether the degradation of SOX2 by autophagy is specific for DE formation, dt-SOX2 iPSCs were differentiated to neuroectoderm. According to the literature, SOX2 is required for neuroectoderm formation and should therefore not be degraded [Citation61]. As expected, the nuclear expression of dt-SOX2 were maintained upon neuroectoderm formation and no red dt-SOX2 puncta were observed over the 6 days differentiation protocol (Fig. S4D). Interestingly, a continuous overexpression of dt-SOX2 hiPSCs resulted into a morphology similar to ATG7± hiPSCs, indicating that increased SOX2 levels drive iPSCs toward neuroectoderm (Fig. S5).
Discussion
It is well established that autophagy is required for the reprogramming of somatic cells to a pluripotent state and for maintenance of pluripotency [Citation53,Citation62,Citation63]. However, little is known about the molecular programs, including autophagy, that regulate exit from pluripotency and entry to germ layer commitment. As expected, we found that a transient inhibition of autophagy stimulate exit from pluripotency, toward a differentiated state as evident by the expression of markers of all the three germ layers. Remarkably, upon extended inhibition of autophagy, or when reducing the levels of the autophagy-specific gene ATG7, cells differentiated toward the neuronal lineage. In line with this, the autophagy levels were reduced during neuronal differentiation. In contrast, an increase in autophagy was seen when pluripotent stem cells transit toward mesoderm and endoderm, both derived from a common mesendoderm population [Citation64,Citation65]. The role of autophagy in mesendoderm differentiation was further supported by improved DE differentiation in cells treated with Rapamycin or Torin, drugs known to induce autophagy by inhibition of mTOR activity.
The transcription factors POU5F1, SOX2, and NANOG are known master regulators of self-renewal and pluripotency and skewing of the levels of these factors can lead to exit from pluripotency and ultimately differentiation [Citation31,Citation32]. Previous studies have indicated that SOX2 is a lineage specifier toward neuroectoderm differentiation [Citation61,Citation66], but the factors that regulate the level of SOX2 as well as the other master transcription factors remain largely unknown. We here show that SOX2 is a target for autophagy during DE formation, but is stabilized during neuroectoderm differentiation when autophagy levels are low. In line with this, SOX2 levels were increased at an earlier timepoint in ATG7± hiPSC compared to WT cells when differentiated into neuroectoderm. Thus, we propose that autophagy-mediated SOX2 turnover may contribute to lineage commitment ().Citation67
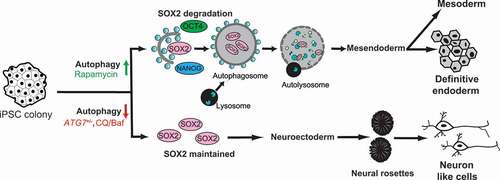
Figure 5. Schematic illustration of the proposed model. Based on our data we propose a model where autophagy-mediated degradation of SOX2 facilitates differentiation toward mesendoderm, whereas downregulation of autophagy leads to SOX2 maintenance, promoting neuroectoderm differentiation. Thus, autophagy functions as a determining factor for lineage commitment.
Our data indicate that autophagy-specific turnover of SOX2 facilitates DE differentiation, as inhibition of the ULK1 kinase or lysosomal degradation (by BafA1 or chloroquine) delayed SOX2 turnover and SOX17 expression, a marker for endoderm. Furthermore, the levels of SOX2 were also stabilized at 12 h as compared to the AG27 parental cells when ATG7± hiPSCs were differentiated into DE. The mechanisms involved in autophagy of SOX2 remains elusive, but we could detect SOX2 colocalization with the ubiquitin-binding autophagy receptor SQSTM1 and LAMP1 positive lysosomes found in close proximity to the nucleus. Interestingly, only red puncta (no yellow) were observed outside the nucleus in the mCherry-EGFP-SOX2 hiPSC line, with the majority of red-only structures observed in the juxtanuclear region. A similar phenomenon was observed for the degradation of nuclear lamina in human senescent cells [Citation68]. In yeast, a unique micro-autophagic process termed piecemeal micro-autophagy of the nucleus has been reported, which involves the pinching-off and degradation of nonessential portions of the nucleus [Citation69,Citation70]. During this process, a nuclear bleb is formed that instead of being initially packaged into an autophagosome becomes directly engulfed by the vacuole, the yeast equivalent of the lysosome [Citation68]. Whether a similar process is involved in the autolysosomal degradation of SOX2 is worthy of future investigation. Also, it will be interesting to explore the contribution of the proteasomal machinery in SOX2 processing during DE formation, if any. A recent study suggested that SOX2 serves as a target for autophagy in cancer stem cells [Citation36]. It was found that MAPK3 (mitogen-activated protein kinase 3)/ERK1 kinase promoted autophagic degradation of SOX2 via phosphorylation of SOX2 at Ser251, but the underlying mechanisms are unclear. Interestingly, the activation of ERK signaling during DE differentiation has been observed [Citation71] and it will be interesting to explore whether ERK-mediated phosphorylation of SOX2 facilitates its autophagic degradation during DE specification. It has also been reported that p300-mediated acetylation of SOX2 induces its nuclear export in ESCs [Citation35], but a possible link to autophagy is unknown.
Interestingly, we did not observe any evidence for autophagy-mediated degradation of SOX2 during neuroectoderm formation. Further supporting this, we found that hiPSCs overexpressing the mCherry-EGFP-SOX2 for a week lost pluripotency and showed a neuronal morphology similar to hiPSCs depleted of ATG7 (ATG7±hiPSCs). In contrast, POU5F1 has been proposed as a lineage specifier for mesendoderm [Citation4,Citation33], which is supported by our data showing the presence of POU5F1 protein until DE formation with no evidence of autophagy-mediated degradation of dt-POU5F1. Although we cannot rule out that the modulation of autophagy is a result of the small molecules being used to induce differentiation rather than a reflection of the cells progressing through differentiation, we demonstrate the importance of autophagy for linage commitment using different inducers and inhibitors as well as by genetic downregulation of autophagy. One could speculate that a crosstalk of the WNT pathway and autophagy may facilitate these linage commitment decisions, but this would require more work.
The main findings of our study can be compared to a junction on a highway, one leading uphill (mesendoderm) the other downhill (ectoderm) (). The vehicle at the junction (a pluripotent state) comes to a transient stop (mimicked by the early dip in autophagy) at which point, it is free to go in any direction, either up or downhill. While autophagy is required to drive uphill, thus directing pluripotent stem cells to a mesendoderm fate, an inhibition or downregulation of autophagy will cause the cells to travel downhill (to a neuroectodermal fate). Autophagic degradation of SOX2 is one of the determining factors of these events, where its turnover is the driver of a mesendoderm fate, while its accumulation drives cells toward a neuronal fate.
Taken together, our results show for the first time the importance of autophagy in cell fate decisions during differentiation of hiPSCs. These findings will not only pave the way for a deeper understanding of the molecular mechanism and cargo involved in cell fate decisions, but could also be relevant to understand the tight regulation of maintenance and exit from pluripotency.
Materials and methods
Cell culture
H1 hESCs (WiCell) [Citation72] and the Sendai virus-derived hiPSC line AG05836B [Citation42] clone #27 (AG27) were cultured under feeder-free conditions in Essential 8 Medium (E8) on Geltrex-coated plates at 37°C/5% CO2. The cultures were routinely passaged 1:3 ratio every 4–5 days.
Electroporation of human iPSCs
For optimal results, human pluripotent stem cells at 75–80% confluency and no evidence of differentiation were used. Note that 1 million per reaction is required. The cells were pre-treated with Y27632 (final concentration 10 μM) for 2–3 h. For the electroporation, 82 µl of Human stem cell Nucleofector solution 2 was combined with 18 µl of Supplement 1 (reaction A hereafter) and incubated at 37 degrees for at least 5 min. While reaction A was incubating, the cells were washed with 4 ml of PBS, followed by 1 ml of accutase, when the cells detached easily on gentle mixing the accutase was neutralized in E8 supplemented with Y27632. The cells were then passed through a cell strainer (a small aliquot was removed prior to pelleting to assess the cell number), followed by centrifugation at 300 g for 3 min. After centrifugation the cell pellet was resuspended in E8 supplemented with Y27632 to give 1 million cells/ml. Next, 1 ml of cells were transferred to a sterile 1.5 ml microcentrifuge tube and pelleted, the supernatant was aspirated and the resulting pellet was in resuspended in 100 µl of reaction A. DNA or RNA was added directly to the cell suspension and the cells were transferred to a cuvette and electroporated using A-023 program on the Amaxa 2D machine. The electroporated cells were carefully resuspended in E8 medium supplemented with Y27632 and seeded at the required density.
Generation of human iPSC lines harboring a double tag reporter
AG27 hiPSCs were processed for single-cell seeding as described above. For each electroporation, 1 million cells were combined with 5 µg of the respective PiggyBac reporter construct. The cells were seeded at low density to aid downstream picking of colonies and were selected under puromycin. Colonies formed were picked, cultured and then replica plated. The replica plate was supplemented with doxycycline and colonies exhibiting the expected fluorescence (EGFP and mCherry) were further expanded and validated.
Generation of ATG7± human iPSC cells
CRISPOR (http://crispor.tefor.net) was used to identify potential ATG7 guides (). In a PCR tube, 5 µl of guide crRNA (100 µM, IDT) was mixed with 5 µl of tracr RNA (100 µM, IDT). The complex was annealed using a PCR block with the following conditions: 95°C, 5 min, 70°C 10 min, 45°C, 5 min and 4°C hold (gradual cooling, ramp rate 0.1°C per sec). For RNP formation, 2 µl of the annealed crRNA-tracr complex was mixed with 4 µg of CAS9 protein (stock 10 µg/µl). The mixture was incubated for 1 h at room temp. The cells were prepared when the RNP complexes were forming, the hiPSC line AG27 was processed for single-cell seeding and electroporated as described above. When colonies appeared, they were picked, expanded and screened. Screening was performed as follows, genomic DNA was isolated with the Phire animal tissue direct PCR kit and the resulting genomic was subjected to PCR with ATG7 specific primers (). The amplified DNA was then digested with BamH1 enzyme and resolved on an agarose gel. The colonies that generated the expected restriction pattern were validated by sequencing. Positive clones were then expanded, validated, banked and used for subsequent experiments.
Table 1. Cells, antibodies and other reagents used in the study are indicated below.
Endoderm differentiation
hiPSCs or HsESCs were plated as single cells at a density of 47,500/cm2 in E8 supplemented with Y27632, the cells were culture overnight and differentiated [Citation28,Citation40,Citation41]. In brief, the differentiation was initiated when the cells reach approximately 30% confluent (approximately 18–20 h post plating). Differentiation to definitive endoderm was achieved by a 24 h treatment with RPMI-B27 ± insulin supplemented with CHIR99021, after 24 h the medium was exchanged to RPMI-B27 ± insulin alone.
Mesoderm differentiation
hiPSC cells were plated as single cells at a density of 40,000/cm2 in E8 supplemented with Y27632. A slightly modified protocol described by Lian and colleagues [Citation29] was used. Briefly, the cells were cultured in E8 for 2 days. On day 3 post seeding, (approximately 75–80% confluency), cells were cultured in RPMI/B27-minus insulin supplemented with 8 µM CHIR99021 (WNT agonist) for 24 h. The next day, cells medium was exchanged to RPMI/B27-minus insulin and cultured for 48 h. The cells were then treated with RPMI/B27 (minus insulin) supplemented with IWP2 (5 µM) (WNT antagonist working through the inactivation of PORCN (porcupine O-acyltransferase) [Citation29]), for another 48 h. After this, the cells were cultured in RPMI/B27-minus insulin for another 48 h. Finally, the medium was exchanged RPMI/B27-with insulin until beating was observed in the culture.
Ectoderm differentiation
The protocol described by Maroof and colleagues was followed [Citation37]. In brief, high-quality hiPSCs at a confluency of 75–80% were passaged 1:3 as described above. The next day, the cells were treated every alternate day with Neural Phase I Base Medium (Advanced DMEM/F12 with 1% Glutamax, 1% penicillin–streptomycin and 1% N2 base) supplemented with 10 µM SB431542, 100 nM LDN 193189, and 2 µM XAV-939 until day 6.
Immunofluorescence staining
Cells were fixed with 4% formaldehyde for 15 min, permeabilized with 0.05% saponin in PBS, and blocked with 10% goat serum. The cells were incubated with the appropriate dilution of primary antibody for 1 h at room temperature. After 1 h the antibody was removed and cells were washed three times with 0.05% saponin in PBS. The respective secondary antibodies (1:500 dilution) were applied and incubated for 45 min at room temperature. To visualize the nucleus, samples were either incubated with Hoechst (1 µg/ml) and then mounted in ProLong Diamond Antifade or mounted directly with Fluoroshield with DAPI. Antibodies used are listed in . Cells were imaged using a confocal microscope (Zeiss LSM 710) with a 63x objective lens or with a high throughput fluorescent microscope (Zeiss Axiovert Observer Z1).
Western blot analysis
Cell extracts were generated by manually scraping the cells from the culture well and homogenized in RIPA buffer (50 mM Tris-Cl, pH 7.4, 120 mM NaCl, 1 mM EDTA pH 8.0, 1% NP-40, 0.25% Triton X-100). After protein quantification by Pierce BCA Protein Assay Kit, 20 µg of protein was applied to a SDS gel (4–20%, Bio-Rad Criterion) and separated by electrophoresis. Then the resulting gel was blotted onto a PVDF Immobilon FL membrane, 0.45 µm pore size. The membrane was blocked with casein buffer for 1 h and then incubated in the appropriate dilution of primary antibody overnight at 4°C. After three washes in PBST (PBS+0.01% Tween 20), each of 5 min, the membrane was incubated with the appropriate dilution of the secondary antibody for 1 h at room temperature. Protein bands were visualized using the Odyssey imager (LI-COR). The antibodies used are listed in .
RNA isolation and RTqPCR
RNA was isolated using TRIzol as per the manufacturer’s recommendations and the resulting RNA quantified using a Nanodrop spectrophotometer. cDNA was generated using the High Capacity Complementary DNA Reverse-Transcription kit following the manufacturer’s recommendations. Gene expression was determined by quantitative real-time PCR (RTqPCR) on the Taqman Viia7 either using optimized array cards with SYBR green master mix (Thermo Fisher Scientific) or with validated Taqman Gene expression assays along with Taqman Gene expression Master Mix (Life Technologies). Individual gene expression was normalized using GAPDH (glyceraldehyde-3-phosphate dehydrogenase) as endogenous housekeeping gene. The expression level of each gene was determined by using the comparative Ct method (2−ΔΔCt). Samples were normalized to undifferentiated pluripotent control samples or untreated pluripotent control samples in case of drug treatment experiments. The primers used are detailed in . For array card based RTqPCR, cDNA was added to the wells containing lyophilized SYBR green linked primers against various genes (detailed in Fig. S3A). GAPDH was used as a control. Statistical analyses and graphics were carried out with GraphPad Prism 5 software and Microsoft Excel.
Characterization of the fluorescent reporter human iPSC cell lines
The fluorescent double tag reporter lines were characterized for pluripotency by immunofluorescence analysis of stemness cell markers NANOG, SOX2 and POU5F1. The cells were processed for immunofluorescence staining as described above. In addition, we assessed each line by RTqPCR for the above markers and their ability to differentiate the three germ layers (data not shown). Only lines that passed these criteria were used for subsequent experiments.
Autophagy flux analysis
The AG27 mCherry-EGFP reporter lines were induced with doxycycline and processed for various treatments. The cells were fixed and mounted. Confocal microscopy was used to acquire images and cells were scored for red puncta, readout of autophagic flux. A minimum of 20 fields were used for the quantification. Quantification of red puncta per cell was acquired using a pipeline based on ImageJ.
Cloning details
The double tag (dt) constructs were generated by fusing the following genes, LC3B, POU5F1, SOX, and NANOG with a dt fluorescent protein reporter based on mCherry and EGFP. Each of the above genes were synthesized as gBlock Gene Fragments. The sequences for MAP1LC3, POU5F1, SOX2, and NANOG were based on the original RefSeq sequences. A codon optimized dt-mCherry-EGFP gBlock Gene Fragment was synthesized, containing restriction sites to allow the in-frame cloning with the recipient gene as either a C-terminal fusion with respect to dt-mCherry-EGFP for MAP1LC3 or as N-terminal fusions for the pluripotency factors. In all cases, the gBlock Gene Fragments were codon optimized and had engineered restriction sites introduced to allow seamless cloning downstream into a PiggyBac vector backbone (gift from Gang Wang, Harvard). The PiggyBac vector was based upon the vector described in Wang et al., 2017 [Citation73]. In short, the gBlock Gene Fragments were cloned into pCRBluntII-TOPO vector and validated by sequencing. Sequence verified clones were digested with NcoI and AgeI and subcloned onto the inducible PiggyBac vector restricted with the same enzymes. Positive clones were validated by restriction with multiple enzymes.
Quantification and statistical analysis
Results are expressed as the arithmetic mean ± standard deviation of the mean (SD). All the experiments were performed with n ≥ 3, which means three independent experiments, each performed with replicates, from at least three independent differentiations. Statistical analysis comparisons between groups were determined by unpaired Student’s t test. A P value of <0.05 was considered significant and was represented by *. Very significant and extremely significant values were represented by ** and *** with P values of <0.01 and <0.001, respectively. Densitometric quantification of Western blots was performed using ImageJ software (https://imagej.nih.gov/ij/). Analyses were carried out using GraphPad Prism 5.0 (GraphPad Software Inc., La Jolla, CA).
Supplemental Material
Download Zip (85 MB)Acknowledgments
We thank Michael Munson for help with image analysis and Carina Knudsen for the illustrations. We thank Narasimha Swamy Telugu from MDC, Berlin for his help related to CRISPR experiments. This work was partly supported by the Research Council of Norway through its Centres of Excellence funding scheme (project number 262652 to AS and project number 262613 to GS), Helse EU program (project number 269881) and FRIPRO grants (project number 221831 to AS and project number 247624 to GS), and the Norwegian Cancer Society (project number 171318 to AS). We also acknowledge Prof Tormod Fladby and Prof Hilde Nilsen for help in doing experiments at Epigen, Akershus University Sykehus.
Disclosure statement
No potential conflict of interest was reported by the author(s).
Supplementary material
Supplemental data for this article can be accessed here.
Additional information
Funding
Related Research Data
References
- Dikic I, Elazar Z. Mechanism and medical implications of mammalian autophagy. Nat Rev Mol Cell Biol. 2018;19:349–364.
- Levine B, Kroemer G. Biological functions of autophagy genes: a disease perspective. Cell. 2019;176:11–42.
- Morishita H, Mizushima N. Diverse cellular roles of autophagy. Annu Rev Cell Dev Biol. 2019;35:453–475.
- Mizushima N, Levine B. Autophagy in mammalian development and differentiation. Nat Cell Biol. 2010;12:823–830.
- Galluzzi L, Baehrecke EH, Ballabio A, et al. Molecular definitions of autophagy and related processes. EMBO J. 2017;36:1811–1836.
- Mercer TJ, Gubas A, Tooze SA. A molecular perspective of mammalian autophagosome biogenesis. J Biol Chem. 2018;293:5386–5395.
- Dooley HC, Razi M, Polson HE, et al. WIPI2 links LC3 conjugation with PI3P, autophagosome formation, and pathogen clearance by recruiting Atg12-5-16L1. Mol Cell. 2014;55:238–252.
- Dudley LJ, Cabodevilla AG, Makar AN, et al. Intrinsic lipid binding activity of ATG16L1 supports efficient membrane anchoring and autophagy. EMBO J. 2019;38.
- Lystad AH, Carlsson SR, de La Ballina LR, et al. Distinct functions of ATG16L1 isoforms in membrane binding and LC3B lipidation in autophagy-related processes. Nat Cell Biol. 2019;21:372–383.
- Lystad AH, Simonsen A. Mechanisms and pathophysiological roles of the ATG8 conjugation machinery. Cells. 2019;8.
- Shpilka T, Weidberg H, Pietrokovski S, et al. Atg8: an autophagy-related ubiquitin-like protein family. Genome Biol. 2011;12:226.
- Johansen T, Lamark T. Selective autophagy: ATG8 family proteins, LIR motifs and cargo receptors. J Mol Biol. 2019;432(1):80–103.
- Khaminets A, Behl C, Dikic I. Ubiquitin-dependent and independent signals in selective autophagy. Trends Cell Biol. 2016;26:6–16.
- Clausen TH, Lamark T, Isakson P, et al. p62/SQSTM1 and ALFY interact to facilitate the formation of p62 bodies/ALIS and their degradation by autophagy. Autophagy. 2010;6:330–344.
- Lystad AH, Ichimura Y, Takagi K, et al. Structural determinants in GABARAP required for the selective binding and recruitment of ALFY to LC3B-positive structures. EMBO Rep. 2014;15:557–565.
- Turco E, Witt M, Abert C, et al. FIP200 claw domain binding to p62 promotes autophagosome formation at ubiquitin condensates. Mol Cell. 2019;74:330–46 e11.
- Mauthe M, Orhon I, Rocchi C, et al. Chloroquine inhibits autophagic flux by decreasing autophagosome-lysosome fusion. Autophagy. 2018;14:1435–1455.
- Yamamoto A, Tagawa Y, Yoshimori T, et al. Bafilomycin A1 prevents maturation of autophagic vacuoles by inhibiting fusion between autophagosomes and lysosomes in rat hepatoma cell line, H-4-II-E cells. Cell Struct Funct. 1998;23:33–42.
- Kiecker C, Bates T, Bell E. Molecular specification of germ layers in vertebrate embryos. Cell Mol Life Sci. 2016;73:923–947.
- Aymard E, Barruche V, Naves T, et al. Autophagy in human keratinocytes: an early step of the differentiation? Exp Dermatol. 2011;20:263–268.
- Tra T, Gong L, Kao LP, et al. Autophagy in human embryonic stem cells. PLoS One. 2011;6:e27485.
- Zhao Y, Chen G, Zhang W, et al. Autophagy regulates hypoxia-induced osteoclastogenesis through the HIF-1alpha/BNIP3 signaling pathway. J Cell Physiol. 2012;227:639–648.
- Robinton DA, Daley GQ. The promise of induced pluripotent stem cells in research and therapy. Nature. 2012;481:295–305.
- Pera MF, Trounson AO. Human embryonic stem cells: prospects for development. Development. 2004;131:5515–5525.
- Li C, Zhang S, Lu Y, et al. The roles of Notch3 on the cell proliferation and apoptosis induced by CHIR99021 in NSCLC cell lines: a functional link between Wnt and Notch signaling pathways. PLoS One. 2013;8:e84659.
- Ye S, Tan L, Yang R, et al. Pleiotropy of glycogen synthase kinase-3 inhibition by CHIR99021 promotes self-renewal of embryonic stem cells from refractory mouse strains. PLoS One. 2012;7:e35892.
- Sullivan GJ, Hay DC, Park IH, et al. Generation of functional human hepatic endoderm from human induced pluripotent stem cells. Hepatology. 2010;51:329–335.
- Siller R, Greenhough S, Naumovska E, et al. Small-molecule-driven hepatocyte differentiation of human pluripotent stem cells. Stem Cell Reports. 2015;4:939–952.
- Lian X, Zhang J, Azarin SM, et al. Directed cardiomyocyte differentiation from human pluripotent stem cells by modulating Wnt/beta-catenin signaling under fully defined conditions. Nat Protoc. 2013;8:162–175.
- Chambers SM, Fasano CA, Papapetrou EP, et al. Highly efficient neural conversion of human ES and iPS cells by dual inhibition of SMAD signaling. Nat Biotechnol. 2009;27:275–280.
- Yang Z, Klionsky DJ. Mammalian autophagy: core molecular machinery and signaling regulation. Curr Opin Cell Biol. 2010;22:124–131.
- Mizushima N, Komatsu M. Autophagy: renovation of cells and tissues. Cell. 2011;147:728–741.
- Xia P, Wang S, Du Y, et al. WASH inhibits autophagy through suppression of Beclin 1 ubiquitination. EMBO J. 2013;32:2685–2696.
- Teo AK, Arnold SJ, Trotter MW, et al. Pluripotency factors regulate definitive endoderm specification through eomesodermin. Genes Dev. 2011;25:238–250.
- Baltus GA, Kowalski MP, Zhai H, et al. Acetylation of sox2 induces its nuclear export in embryonic stem cells. Stem Cells. 2009;27:2175–2184.
- Ji J, Yu Y, Li ZL, et al. XIAP limits autophagic degradation of Sox2 and is a therapeutic target in nasopharyngeal carcinoma stem cells. Theranostics. 2018;8:1494–1510.
- Maroof AM, Keros S, Tyson JA, et al. Directed differentiation and functional maturation of cortical interneurons from human embryonic stem cells. Cell Stem Cell. 2013;12:559–572.
- Luo X, Wang H, Leighton J, et al. Generation of endoderm lineages from pluripotent stem cells. Regen Med. 2017;12:77–89.
- Zorn AM, Wells JM. Vertebrate endoderm development and organ formation. Annu Rev Cell Dev Biol. 2009;25:221–251.
- Mathapati S, Siller R, Impellizzeri AA, et al. Small-molecule-directed hepatocyte-like cell differentiation of human pluripotent stem cells. Curr Protoc Stem Cell Biol. 2016;38:1G 6 1–G 6 18.
- Siller R, Naumovska E, Mathapati S, et al. Development of a rapid screen for the endodermal differentiation potential of human pluripotent stem cell lines. Sci Rep. 2016;6:37178.
- Pisal RV, Suchanek J, Siller R, et al. Directed reprogramming of comprehensively characterized dental pulp stem cells extracted from natal tooth. Sci Rep. 2018;8:6168.
- Siller R, Sullivan GJ. Rapid screening of the endodermal differentiation potential of human pluripotent stem cells. Curr Protoc Stem Cell Biol. 2017;43:1G 7 1–G 7 23.
- Peale FV Jr., Sugden L, Bothwell M. Characterization of CMIX, a chicken homeobox gene related to the Xenopus gene mix.1. Mech Dev. 1998;75:167–170.
- Stein S, Roeser T, Kessel M. CMIX, a paired-type homeobox gene expressed before and during formation of the avian primitive streak. Mech Dev. 1998;75:163–165.
- Ang SL, Wierda A, Wong D, et al. The formation and maintenance of the definitive endoderm lineage in the mouse: involvement of HNF3/forkhead proteins. Development. 1993;119:1301–1315.
- Kanai-Azuma M, Kanai Y, Gad JM, et al. Depletion of definitive gut endoderm in Sox17-null mutant mice. Development. 2002;129:2367–2379.
- Monaghan AP, Kaestner KH, Grau E, et al. Postimplantation expression patterns indicate a role for the mouse forkhead/HNF-3 alpha, beta and gamma genes in determination of the definitive endoderm, chordamesoderm and neuroectoderm. Development. 1993;119:567–578.
- Petherick KJ, Conway OJ, Mpamhanga C, et al. Pharmacological inhibition of ULK1 kinase blocks mammalian target of rapamycin (mTOR)-dependent autophagy. J Biol Chem. 2015;290:28726.
- Loh KM, Ang LT, Zhang J, et al. Efficient endoderm induction from human pluripotent stem cells by logically directing signals controlling lineage bifurcations. Cell Stem Cell. 2014;14:237–252.
- Murry CE, Keller G. Differentiation of embryonic stem cells to clinically relevant populations: lessons from embryonic development. Cell. 2008;132:661–680.
- Gong J, Gu H, Zhao L, et al. Phosphorylation of ULK1 by AMPK is essential for mouse embryonic stem cell self-renewal and pluripotency. Cell Death Dis. 2018;9:38.
- Wang G, Yang L, Grishin D, et al. Efficient, footprint-free human iPSC genome editing by consolidation of Cas9/CRISPR and piggyBac technologies. Nat Protoc. 2017;12:88–103.
- Callaerts P, Halder G, Gehring WJ. PAX-6 in development and evolution. Annu Rev Neurosci. 1997;20:483–532.
- Barnes RM, Firulli BA, Conway SJ, et al. Analysis of the Hand1 cell lineage reveals novel contributions to cardiovascular, neural crest, extra-embryonic, and lateral mesoderm derivatives. Dev Dyn. 2010;239:3086–3097.
- Zaret K. Developmental competence of the gut endoderm: genetic potentiation by GATA and HNF3/fork head proteins. Dev Biol. 1999;209:1–10.
- Minegishi N, Suzuki N, Yokomizo T, et al. Expression and domain-specific function of GATA-2 during differentiation of the hematopoietic precursor cells in midgestation mouse embryos. Blood. 2003;102:896–905.
- Kim J, Dalton VM, Eggerton KP, et al. Apg7p/Cvt2p is required for the cytoplasm-to-vacuole targeting, macroautophagy, and peroxisome degradation pathways. Mol Biol Cell. 1999;10:1337–1351.
- Tanida I, Mizushima N, Kiyooka M, et al. Apg7p/Cvt2p: a novel protein-activating enzyme essential for autophagy. Mol Biol Cell. 1999;10:1367–1379.
- Ferreira A, Caceres A. Expression of the class III beta-tubulin isotype in developing neurons in culture. J Neurosci Res. 1992;32:516–529.
- Zhang S, Cui W. Sox2, a key factor in the regulation of pluripotency and neural differentiation. World J Stem Cells. 2014;6:305–311.
- Cho YH, Han KM, Kim D, et al. Autophagy regulates homeostasis of pluripotency-associated proteins in hESCs. Stem Cells. 2014;32:424–435.
- He J, Kang L, Wu T, et al. An elaborate regulation of Mammalian target of rapamycin activity is required for somatic cell reprogramming induced by defined transcription factors. Stem Cells Dev. 2012;21:2630–2641.
- Gouon-Evans V, Boussemart L, Gadue P, et al. BMP-4 is required for hepatic specification of mouse embryonic stem cell-derived definitive endoderm. Nat Biotechnol. 2006;24:1402–1411.
- Tada S, Era T, Furusawa C, et al. Characterization of mesendoderm: a diverging point of the definitive endoderm and mesoderm in embryonic stem cell differentiation culture. Development. 2005;132:4363–4374.
- Cimadamore F, Fishwick K, Giusto E, et al. Human ESC-derived neural crest model reveals a key role for SOX2 in sensory neurogenesis. Cell Stem Cell. 2011;8:538–551.
- Dou Z, Xu C, Donahue G, et al. Autophagy mediates degradation of nuclear lamina. Nature. 2015;527:105–109.
- Kvam E, Goldfarb DS. Nucleus-vacuole junctions and piecemeal microautophagy of the nucleus in S cerevisiae. Autophagy. 2007;3:85–92.
- Pan X, Roberts P, Chen Y, et al. Nucleus-vacuole junctions in Saccharomyces cerevisiae are formed through the direct interaction of Vac8p with Nvj1p. Mol Biol Cell. 2000;11:2445–2457.
- Roberts P, Moshitch-Moshkovitz S, Kvam E, et al. Piecemeal microautophagy of nucleus in Saccharomyces cerevisiae. Mol Biol Cell. 2003;14:129–141.
- Kaitsuka T, Kobayashi K, Otsuka W, et al. Erythropoietin facilitates definitive endodermal differentiation of mouse embryonic stem cells via activation of ERK signaling. Am J Physiol Cell Physiol. 2017;312:C573–C82.
- Thomson JA, Itskovitz-Eldor J, Shapiro SS, et al. Embryonic stem cell lines derived from human blastocysts. Science. 1998;282:1145–1147.
- Wang S, Xia P, Ye B, et al. Transient activation of autophagy via Sox2-mediated suppression of mTOR is an important early step in reprogramming to pluripotency. Cell Stem Cell. 2013;13:617–625.