
ABSTRACT
In dry age-related macular degeneration (AMD), LCN2 (lipocalin 2) is upregulated. Whereas LCN2 has been implicated in AMD pathogenesis, the mechanism remains unknown. Here, we report that in retinal pigmented epithelial (RPE) cells, LCN2 regulates macroautophagy/autophagy, in addition to maintaining iron homeostasis. LCN2 binds to ATG4B to form an LCN2-ATG4B-LC3-II complex, thereby regulating ATG4B activity and LC3-II lipidation. Thus, increased LCN2 reduced autophagy flux. Moreover, RPE cells from cryba1 KO, as well as sting1 KO and Sting1Gt mutant mice (models with abnormal iron chelation), showed decreased autophagy flux and increased LCN2, indicative of CGAS- and STING1-mediated inflammasome activation. Live cell imaging of RPE cells with elevated LCN2 also showed a correlation between inflammasome activation and increased fluorescence intensity of the Liperfluo dye, indicative of oxidative stress-induced ferroptosis. Interestingly, both in human AMD patients and in mouse models with a dry AMD-like phenotype (cryba1 cKO and KO), the LCN2 homodimer variant is increased significantly compared to the monomer. Sub-retinal injection of the LCN2 homodimer secreted by RPE cells into NOD-SCID mice leads to retinal degeneration. In addition, we generated an LCN2 monoclonal antibody that neutralizes both the monomer and homodimer variants and rescued autophagy and ferroptosis activities in cryba1 cKO mice. Furthermore, the antibody rescued retinal function in cryba1 cKO mice as assessed by electroretinography. Here, we identify a molecular pathway whereby increased LCN2 elicits pathophysiology in the RPE, cells known to drive dry AMD pathology, thus providing a possible therapeutic strategy for a disease with no current treatment options.
Abbreviations: ACTB: actin, beta; Ad-GFP: adenovirus-green fluorescent protein; Ad-LCN2: adenovirus-lipocalin 2; Ad-LCN2-GFP: adenovirus-LCN2-green fluorescent protein; LCN2AKT2: AKT serine/threonine kinase 2; AMBRA1: autophagy and beclin 1 regulator 1; AMD: age-related macular degeneration; ARPE19: adult retinal pigment epithelial cell line-19; Asp278: aspartate 278; ATG4B: autophagy related 4B cysteine peptidase; ATG4C: autophagy related 4C cysteine peptidase; ATG7: autophagy related 7; ATG9B: autophagy related 9B; BLOC-1: biogenesis of lysosomal organelles complex 1; BLOC1S1: biogenesis of lysosomal organelles complex 1 subunit 1; C57BL/6J: C57 black 6J; CGAS: cyclic GMP-AMP synthase; ChQ: chloroquine; cKO: conditional knockout; Cys74: cysteine 74; Dab2: DAB adaptor protein 2; Def: deferoxamine; DHE: dihydroethidium; DMSO: dimethyl sulfoxide; ERG: electroretinography; FAC: ferric ammonium citrate; Fe2+: ferrous; FTH1: ferritin heavy chain 1; GPX: glutathione peroxidase; GST: glutathione S-transferase; H2O2: hydrogen peroxide; His280: histidine 280; IFNL/IFNλ: interferon lambda; IL1B/IL-1β: interleukin 1 beta; IS: Inner segment; ITGB1/integrin β1: integrin subunit beta 1; KO: knockout; LC3-GST: microtubule associated protein 1 light chain 3-GST; C-terminal fusion; MAP1LC3/LC3: microtubule associated protein 1 light chain 3; LCN2: lipocalin 2; mAb: monoclonal antibody; MDA: malondialdehyde; MMP9: matrix metallopeptidase 9; NLRP3: NLR family pyrin domain containing 3; NOD-SCID: nonobese diabetic-severe combined immunodeficiency; OS: outer segment; PBS: phosphate-buffered saline; PMEL/PMEL17: premelanosome protein; RFP: red fluorescent protein; rLCN2: recombinant LCN2; ROS: reactive oxygen species; RPE SM: retinal pigmented epithelium spent medium; RPE: retinal pigment epithelium; RSL3: RAS-selective lethal; scRNAseq: single-cell ribonucleic acid sequencing; SD-OCT: spectral domain optical coherence tomography; shRNA: small hairpin ribonucleic acid; SM: spent medium; SOD1: superoxide dismutase 1; SQSTM1/p62: sequestosome 1; STAT1: signal transducer and activator of transcription 1; STING1: stimulator of interferon response cGAMP interactor 1; TYR: tyrosinase; VCL: vinculin; WT: wild type.
Introduction
LCN2 (lipocalin 2), a member of the adipokine family of proteins, can regulate several cellular processes in eukaryotes [Citation1]. Though secreted primarily by adipose tissue, adipokines are also upregulated and secreted by other cell types such as macrophages, epithelial cells, and neutrophils during inflammation [Citation2]. Human LCN2 protein was initially identified in activated neutrophils as a 25-kDa protein bound to MMP9 (matrix metallopeptidase 9)/gelatinase [Citation3]. As a known iron chelator with a strong binding affinity for bacterial catecholate-type ferric siderophores [Citation4], LCN2 is sequestered in lysosomes where it regulates iron to maintain cellular homeostasis [Citation5]. By chelating siderophore-bound iron and making it unavailable for bacterial utilization, LCN2 confers a bactericidal effect against a number of bacterial species [Citation4].
LCN2 binds to specific cell-surface receptors and is transported into cells through receptor-mediated endocytosis [Citation6]. It is also upregulated by specific intracellular signaling pathways [Citation1,Citation7–9]. Importantly, LCN2 exists as either a monomer or a homodimer variant [Citation10,Citation11]. While the monomer is a potent iron chelator, the homodimer variant, which has a longer half-life, is unable to chelate iron [Citation11,Citation12]. In addition, LCN2 is involved in acute and chronic inflammation and plays a critical pathogenic role in several diseases including cancer, diabetes, obesity, and multiple sclerosis [Citation1]. Increased levels of the LCN2 homodimer variant have been linked with several diseases [Citation13,Citation14]. Previous findings from our lab as well as from other groups have also shown that increased expression of LCN2 is associated with retinal degenerative diseases such as age-related macular degeneration (AMD) and Stargardt disease [Citation7,Citation8,Citation15–17].
We previously showed that LCN2 is upregulated in aged retinal pigment epithelium (RPE) cells from a mouse model with a dry AMD-like phenotype and in early/dry human AMD donor samples due to the activation of the AKT2-IFNλ-STAT1 signaling axis [Citation8,Citation15]. Moreover, we were the first to document the involvement of neutrophils in dry AMD pathogenesis [Citation7,Citation15]. Neutrophils are innate immune cells that express high levels of LCN2 compared to other peripheral immune cells [Citation18]. We found that upregulation of LCN2 by the RPE activated neutrophil homing into the retina during disease progression induces inflammation and retinal degeneration [Citation7]. While neutrophils contain both the monomeric and homodimeric LCN2 variants in the intracellular pool, they secrete only the homodimer variant upon activation, thereby triggering tissue inflammation [Citation13,Citation19].
Here, we have made the novel observation that LCN2 binds to ATG4B (autophagy related 4B cysteine peptidase), a protease that catalyzes MAP1LC3B/LC3B (microtubule associated protein 1 light chain 3 beta) processing (lipidation and delipidation) and forms a complex with both ATG4B and LC3B, thereby regulating autophagosome maturation [Citation20]. RPE cells that have increased LCN2 exhibit decreased autophagy flux. This autophagy dysregulation led to an abnormality in iron homeostasis, causing elevation in the levels of redox-sensitive iron (Fe+2). Further, increased iron levels in cells have been documented to activate the CGAS (cyclic GMP-AMP synthase)-STING1 (stimulator of interferon response cGAMP interactor 1) pathway [Citation21]. Our studies on RPE cells from cryba1 KO [Citation15,Citation22], sting1 KO and Sting1 Goldenticket (Sting1Gt) mutant mice showed that iron accumulation and reduced autophagy flux trigger inflammasome activation through activation of the CGAS-STING1 pathway. This led to oxidative stress and subsequent lipid peroxidation in RPE cells. Our data suggests that increased LCN2 in the RPE potentiates dry AMD pathogenesis by inhibiting autophagy flux and deregulating iron homeostasis, resulting in inflammasome activation, oxidative stress and ferroptosis in the RPE cells. We further show that NOD-SCID mice injected with the LCN2 homodimer variant secreted from RPE cells develop retinal degeneration. A monoclonal antibody (clone #6 mAb) directed against LCN2 that neutralizes both the monomer and homodimer variants was shown to rescue autophagy, inflammasome, and ferroptosis processes, along with retinal function, in the dry AMD-like mouse model [Citation7,Citation8,Citation23], and could represent a novel targeted therapy for dry AMD.
Results
LCN2 binds to ATG4B and modulates autophagy in the RPE
Elevated LCN2 can deregulate autophagy in several cell types [Citation24,Citation25]. Thus, we were intrigued that in a human proteome high-throughput array on RPE cells, we found that LCN2 interacts with ATG4B, a cysteine protease that regulates LC3B processing (lipidation and delipidation) during autophagy, a process crucial for cellular homeostasis [Citation7,Citation20,Citation26]. We showed that LCN2 binds with ATG4B in RPE cells by overexpressing adenovirus-LCN2-green fluorescent protein (Ad-LCN2-GFP) and adenovirus-GFP (Ad-GFP, vector control) constructs in cultured C57BL6/J mouse RPE explants. In an affinity-isolation assay with anti-GFP magnetic beads, we confirmed that ATG4B binds to LCN2 in the lysates of Ad-LCN2-GFP infected cells, but not those from Ad-GFP-infected cells ()). Furthermore, ARPE19 cells infected with Ad-LCN2-GFP and subsequently immunostained with an ATG4B antibody showed a similar association of the proteins ()). In addition, we performed a thermal shift assay with sypro orange dye, which assesses the stability of a protein-protein complex upon heat denaturation, thereby indicating the binding ability/strength of the complex [Citation27,Citation28]. The melting temperature (Tm) shift in human recombinant ATG4B upon incubation with human recombinant LCN2 is consistent with binding between the two proteins ()). A complex involving ATG4B, LCN2, and LC3 is also predicted by molecular modeling ()). LCN2 (orange) can interact with the catalytic site of ATG4B (purple), including residues cysteine 74 (Cys74; yellow), aspartate 278 (Asp278; red), and histidine 280 (His280; red), where LC3 (green) is cleaved ()). The affinity-isolation assays and molecular docking suggest that LCN2 binds to the ATG4B catalytic site. Therefore, it is highly likely that LCN2 can modulate the C-terminal end cleavage of pro-LC3 to generate LC3-I, which is subsequently lipidated to generate active LC3-II.
Figure 1. LCN2 binds to and regulates ATG4B-mediated LC3 processing. (a) Floxed RPE explants infected with adenovirus-GFP (Ad-GFP) or adenovirus-LCN2-GFP (Ad-LCN2-GFP) constructs were lysed followed by co-immunoprecipitation using GFP-trap magnetic beads and western blotting for ATG4B, showed binding between LCN2 and ATG4B. n = 4. (b) Immunofluorescence studies and Pearson’s coefficient analysis on individual ARPE19 cells infected with Ad-LCN2-GFP and then stained with ATG4B antibody (red) showed colocalization between the two proteins (yellow fluorescence; arrows), in the merged image, compared to Rabbit IgG (ATG4B antibody isotype) stained cells. Scale bar: 10 μm. n = 15. (c) Thermal shift assay showing an increase in the melting temperature (Tm) of recombinant human ATG4B, when it was incubated at a dose of 0.5 μg/ml with 1 μg/ml human LCN2 protein (gray line), compared to only ATG4B protein (Orange line), indicating a binding affinity between the two proteins. The melting temperature is reflective of the change in sypro orange fluorescence (arbitrary unit) which was added (5 μM) to each reaction mixture. n = 4. (d) Molecular modeling showing possible complex formation involving ATG4B, LCN2 and LC3 proteins. LCN2 (Orange) could interact with the catalytic site of ATG4B (purple), including residues cysteine 74 (Cys74; yellow), aspartate 278 (Asp278; red), and histidine 280 (His280; red), where LC3 (green) binds and is cleaved by ATG4B. (e) Western blot showing cleavage of GST in a cell-free Atg4B activity assay in vitro using recombinant human LC3-GST protein (20 μg/ml) incubated with recombinant human ATG4B (0.5 μg/ml), in the presence or absence of human recombinant LCN2 (1.0 μg/ml) for 15 min at room temperature. Cleavage of GST was inhibited upon LCN2 addition. The blot was over-exposed to allow evaluation of the levels of cleaved GST in the different conditions. n = 4. (f) ATG4B-mediated lipidation (LC3 processing) activity was assessed by transfecting ARPE19 cells with a GFP-LC3-RFP-LC3∆G construct and treating with recombinant LCN2 (1.0 μg/ml) for 24 h as a positive control or infecting with an Ad-LCN2 construct for 48 h, followed by flow cytometry. An increased GFP:RFP ratio, which indicates decreased lipidation, was evident in recombinant LCN2 treated and Ad-LCN2 infected cells, relative to untreated controls. n = 4. All values are Mean ± SD, while the results from the flow cytometry experiment are represented as Median ± SD. Significant changes are indicated by *P < 0.05, **P < 0.01, ***P < 0.001.
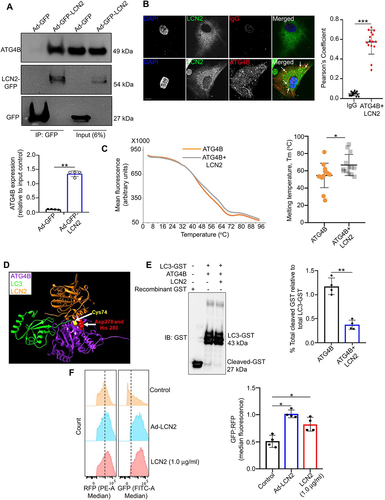
Since molecular docking suggested that LCN2 binds at the ATG4B catalytic site, we performed a cell-free ATG4B activity assay using recombinant human LC3-glutathione S-transferase (LC3-GST) protein. LC3-GST was incubated with recombinant human ATG4B (0.5 μg/ml), and the efficiency of GST-cleavage in the presence or absence of human recombinant LCN2 (1.0 μg/ml, 15 min, room temperature), was quantified by western blotting with anti-GST antibody. Decreased GST cleavage at the C-terminal end of LC3 was observed in the presence of LCN2 compared to controls ()). Further, we transfected ARPE19 cells with a GFP-LC3-RFP-LC3∆G fluorescent construct, a probe that specifically evaluates ATG4B-mediated LC3 processing (ATG4B activity) and autophagy flux in cells by measuring the GFP:RFP signal as previously described [Citation29]. Post transfection, when cells were either untreated, treated with recombinant LCN2 (1.0 μg/ml) for 24 h as a positive control, or infected with an Ad-LCN2 construct for 48 h and then analyzed by flow cytometry, GFP fluorescence was increased in the recombinant LCN2 and Ad-LCN2 treated cells ()), indicating impaired LC3 processing/lipidation.
Increased LCN2 attenuates autophagy in RPE cells
To further evaluate the functional connection between LCN2 and autophagy in the RPE, we investigated the underlying signaling cascades in our genetically engineered animal model which lacks the cryba1 (crystallin, beta A3/A1; an endolysosomal protein) gene specifically in the RPE (conditional knockout; cKO) [Citation7,Citation8,Citation23]. Loss of cryba1 decreases lysosomal function by activating MTORC1 signaling and decreasing autophagy [Citation22,Citation23]. The cryba1 cKO is a well-characterized mouse model with an age-dependent dry-AMD like phenotype (Fig. S1A). In the RPE cells of the cryba1 cKO mouse, as well as in human AMD donor samples, autophagy is inhibited [Citation23,Citation30]. Herein, we show increased accumulation of undigested photoreceptor outer segments (arrow; Fig. 2Aii) and double membrane autophagosomes in aged (20-months old) cryba1 cKO mice (arrows; Fig. 2Aiii- iv), relative to age-matched floxed controls (Fig. 2Ai). It is highly likely that this abnormal accumulation of autophagosomes, which have not fused with lysosomes, results from alterations in autophagosome processing. Therefore, we investigated whether autophagosome processing in the RPE of aged cryba1 cKO mice is compromised by increased LCN2. We performed single cell RNA sequencing (scRNAseq) analysis of cells in the sub-retinal space (which includes the RPE), between the photoreceptors and the choroid in 15-month-old cryba1-floxed and cKO mice (Fig. S1B-D), when LCN2 is upregulated in the RPE cells of the cKO animals [Citation8]. It is now well-established that the dynamic interactions between different immune cells and the RPE cells in the sub-retinal space contribute to AMD pathogenesis [Citation31,Citation32]. While the scRNAseq analysis identified several cell clusters, we focused on the autophagy-specific gene expression in the RPE cell cluster by identifying the expression of RPE-specific markers like Rpe65 and Rlbp1 (Fig. S1C-D). Interestingly, AMBRA1, ATG4C, ATG9B, ATG7 as well as LC3A and LC3B were downregulated in the RPE of cryba1 cKO mice ()), and several other autophagy-related genes were noticeably differentially expressed ()). These results were confirmed by quantitative PCR analysis ()), suggesting that LCN2 might also play a pivotal role in the autophagy process of cryba1 cKO.
Figure 2. LCN2 triggers alterations in autophagy. (a) Electron microscopy images of RPE cells showing abnormal accumulation of undigested outer segments (arrow in Aii) and double membrane autophagosomes in aged (20 months old) cryba1 cKO mice (arrows in Aiii- iv), relative to age-matched floxed controls (Ai). Scale bar: 500 nm. n = 6. (b) Dot representation of scRNAseq analysis from the sub-retinal region of 15-month-old cryba1 cKO mice showing differential expression of several autophagy genes. In particular, genes which are required for autophagosome processing like AMBRA1, ATG4C, ATG9B, ATG7 and LC3A and B are downregulated in the RPE cell cluster, compared to age-matched floxed controls n = 4. (c) qPCR analysis showing decreased gene expression of Atg7, Atg9 and LC3b in 10-month-old cryba1 cKO mice, compared to controls. n = 4. (d) Western blot analysis for LC3-I and LC3-II in floxed RPE explants treated with an Ad-LCN2 construct (107 vg/ml for 48 h) showed decreased autophagy flux (indicated by increased LC3-II) in chloroquine (ChQ) treated cells, compared to untreated controls. n = 4. (e) ARPE19 cells infected with an Ad-LCN2 construct or left untreated (control) for 48 h, followed by an overnight infection with an Adenovirus-GFP-RFP-LC3B construct to label the autophagosomes (yellow) and autolysosomes (red). The number of autolysosomes (red puncta) was significantly decreased in Ad-LCN2 infected cells (arrows showing decrease in the number of red puncta) when compared to controls, further suggesting decline in autophagy flux in RPE cells overexpressing LCN2. “X” indicates mean of the box plot. Scale bar: 20 μm. All values are Mean ± SD. Significant change between control and Ad-LCN2 infected cells is indicated by *P < 0.05 and **P < 0.01.
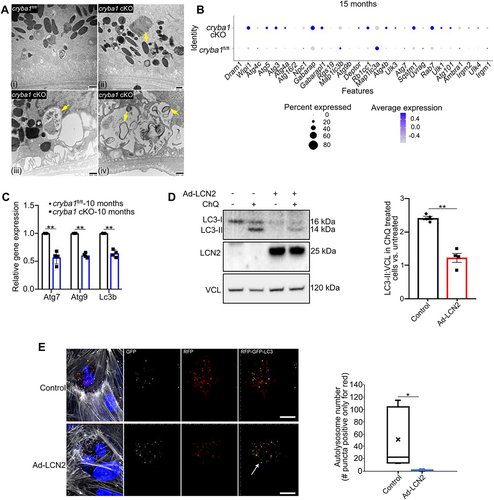
We also explored whether LCN2 in RPE cells could alter autophagy flux because it modulates ATG4B activity. We infected WT RPE explants in culture with Ad-LCN2 for 48 h or left them untreated, with or without addition of chloroquine (ChQ) [Citation33], a lysosomotropic agent known to inhibit autophagy for the last 6 h of the experiment. As seen in the histogram, LC3-II flux in the Ad-LCN2 treated explants was significantly decreased relative to untreated controls ()). To determine if LCN2 specifically affects autophagosome formation, human ARPE19 cells were infected with the Ad-LCN2 construct or left untreated (control). An overnight infection with an Adenovirus-GFP-RFP-LC3B construct was performed to label the autophagosomes (yellow) and autolysosomes (red). The number of red puncta (autolysosomes) was significantly decreased in Ad-LCN2 infected cells when compared with controls ()), consistent with decreased autophagy flux in RPE cells overexpressing LCN2. To provide additional evidence that LCN2 can modulate autophagy flux, we cultured RPE explants from 10-month-old cryba1 KO mice, which show elevated LCN2, and infected them with either lentiviral-LCN2-shRNA or lentiviral control-shRNA particles for 72 h. Assessment of LC3-II levels by western blot showed that LCN2 knockdown significantly restored the autophagy flux in cryba1 KO RPE cells in vitro compared to control-shRNA treated cells (Fig. S1E).
Alterations in autophagosome processing and iron regulation in the RPE trigger inflammasome activation through the CGAS-STING1 pathway
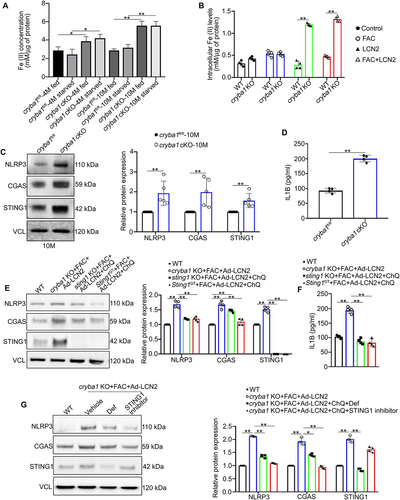
The effect of impaired autophagy on iron accumulation and the consequent iron-induced inflammasome activation is well-documented in several diseases, including AMD [Citation34–39]. Inflammasome mediators are cleared by autophagy, thereby promoting resolution of inflammation in cells [Citation40]; conversely, their accumulation has been reported to be associated with the progression of several diseases [Citation41]. Moreover, LCN2 is a potent iron chelator that is sequestered in lysosomes [Citation5]. We speculated that increased LCN2 and dysfunctional lysosomes in the aged cryba1 cKO RPE along with consequent decrease in autophagy might alter iron homeostasis and trigger iron-mediated inflammasome activation in RPE cells. Consistent with our premise, we found redox sensitive iron (ferrous ion; Fe2+) levels to be elevated in cryba1 cKO RPE cells, compared to age-matched controls ()). Interestingly, autophagy induction in vivo following fasting did not produce any noticeable decrease in iron accumulation in the cryba1 cKO RPE ()). To determine if functional lysosomes are required for LCN2 dependent iron homeostasis, we harvested RPE explants from 4-month-old mice (WT and cryba1 complete knockout; KO). We have used this approach in our in vitro experiments since in cryba1 KO mice, βA3/A1-crystallin is completely absent in all RPE cells, but only 85% of the RPE cells lack βA3/A1-crystallin in the cKO because of the mosaic expression of Best1 (Best1-Cre mice were used to generate cryba1 cKO) [Citation23,Citation42]. The explants were cultured with or without ferric ammonium citrate (FAC; 250 μM) for 72 h, followed by infection with Ad-LCN2 for 48 h (Fig. S2A). Ferrous ion levels were significantly higher in cryba1 KO RPE cells even in the presence of the iron chelator, LCN2 ()). However, WT cells treated with FAC and LCN2 did not show any noticeable increase in intracellular ferrous iron compared to untreated controls ()). Interestingly, when WT cells were treated with ChQ, for 6 h following FAC and Ad-LCN2 treatment, ferrous ion accumulated (Fig. S2B). Furthermore, we tried to determine if lysosomal dysfunction and LCN2 upregulation are required for iron accumulation in vivo. To overexpress LCN2 in the RPE, we injected an Ad-LCN2 construct sub-retinally to one eye of NOD-SCID mice with the contralateral eyes receiving empty vector; after 5 days, the animals were given intraperitoneal ChQ to disrupt lysosomal function as described previously [Citation43]. The ferrous iron levels were estimated in the RPE cells after 3 h of ChQ treatment. Our results revealed that the combination of LCN2 upregulation and ChQ treatment resulted in accumulation of ferrous iron in the RPE cells, while either treatment alone had no such effect (Fig. S2C), indicating that in vivo accumulation of iron occurs only when lysosomal function in RPE is abnormal, and LCN2 is upregulated. Thus, we can postulate that functional lysosomes are critical for maintaining cellular iron homeostasis.
Figure 3. Iron deregulation in RPE cells potentiates inflammasome activation via the CGAS-STING1 pathway. (a) Intracellular redox sensitive (ferrous, Fe+2) iron levels in RPE cells from young (4-months old) and aged (10-months old) cryba1 cKO mice showed increase in both fed and starved (16 h) conditions compared to age-matched floxed controls. n = 4. (b) RPE explants from WT and cryba1 KO mice were cultured in the presence of iron-rich medium containing 250 μM ferric ammonium citrate (FAC) for 72 h and infected with an Ad-LCN2 (107 vg/ml, 48 h) construct to simulate an iron rich and high LCN2 environment as is prevalent in vivo. Assessment of iron levels in these cells revealed an increase in iron levels in cryba1 KO RPE cells treated with FAC or infected with the LCN2 construct, compared to WT cells subjected to the same treatments, indicating that appropriate lysosomal function is essential for maintaining iron homeostasis in RPE cells. n = 4. (c) Western blot analysis and densitometry showing increased levels of NLRP3, CGAS and STING1 in the RPE cells of aged (10 months old) cryba1 cKO mice when compared to age-matched controls. n = 4. (d) ELISA levels of IL1B were increased in the RPE cells of 10-month-old cryba1 cKO in comparison with age-matched floxed cells. n = 4. (e) RPE explants from WT and cryba1 KO mice, along with sting1 KO and Sting1GT mutant mice, which are animal models with global knockout of STING1, were cultured in presence of FAC, Ad-LCN2, or both with and without ChQ. Western blot analysis and densitometry showed increase in NLRP3, CGAS and STING1 expression in the cryba1 KO RPE cells treated with FAC and Ad-LCN2; similar treatment along with ChQ addition to block lysosomal function in sting1 KO or Sting1GT mutant RPE cells did not show an increase in these proteins. n = 4. (f) ELISA analysis showing elevated levels of IL1B in cryba1 KO RPE explants treated with FAC and Ad-LCN2, while there was a decrease in the level of the cytokine in sting1 KO and Sting1GT mutant RPE explants cultured in presence of FAC, Ad-LCN2 and ChQ. n = 4. (g) Western blot analysis showing that treatment with deferoxamine (Def; 100 μM for 24 h), a known iron chelator, rescued the levels of NLRP3, CGAS, STING1 expression in cryba1 KO RPE cells treated with FAC and Ad-LCN2 in vitro. Also, STING1 inhibitor treatment (H-151; 1 μM for 6 h) in KO RPE cells exposed to FAC and Ad-LCN2 could rescue the levels of NLRP3 but did not produce noticeable change in STING1 expression, as the inhibitor specifically modulates STING1 activity but does not regulate the expression of STING1. n = 4. All values are Mean ± SD. Significant changes are indicated by *P < 0.05, **P < 0.01.
In addition to functional lysosomes, melanosomes in RPE cells have also been documented to be important in iron regulation, mainly due to the ability of the melanin in these organelles to bind to and sequester labile intracellular iron [Citation44–47]. Moreover, it is also known that in the RPE cells, autophagy plays a pivotal role in melanosome development and maturation (melanogenesis) and that the number of melanosomes decreases with age, as functional lysosomes engulf and degrade them [Citation23,Citation48,Citation49]. In cryba1 cKO mice, with known abnormalities in the autophagy/lysosomal-mediated clearance processes, we have shown accumulation of melanosomes in the RPE [Citation23]. Therefore, we investigated if increased iron in the cKO RPE cells could also impede the normal melanogenesis process. We performed western blot analysis on RPE lysates from aged (10 months old) floxed and cryba1 cKO RPE cells to assess the expression of PMEL17, an early melanosome (Stage I and II) marker, and the late melanosome (Stage III and Stage IV) marker TYR, as described previously [Citation50,Citation51]. We found no significant changes in the levels of these proteins in the cKO RPE compared to controls (Fig. S2D). Taken together, our data implies that the alterations in the melanogenesis process seen in the cKO RPE are probably not due to the increased iron levels.
Previous studies have elegantly shown that in AMD iron accumulation in the RPE activates the inflammasome [Citation38,Citation39]. Since ferrous iron levels are elevated in aged cryba1 cKO RPE, we looked for inflammasome activation and found increased levels of CGAS, STING1, and NLRP3 proteins, along with increased cleavage of pro-IL1B into active IL1B, an indicator of inflammasome activity [Citation52], relative to age-matched floxed controls ()). To provide further evidence that accumulated iron in RPE cells with impaired lysosomes activates inflammasomes, we cultured RPE explants from 4-month-old mice (WT and cryba1 KO), which at this age show no increase in either LCN2 or the inflammasome. We treated the explants with FAC for 72 h, infecting them with an Ad-LCN2 construct for the last 48 h of the experiment, and found increased levels of NLRP3, IL1B, and STING1 protein in FAC+LCN2 treated RPE cells from the cryba1 KO, but not in RPE cells from WT mice ()), consistent with our hypothesis that functional lysosomes are critical for maintaining cellular iron homeostasis.
Inflammasome activation through the CGAS-STING1 pathway is observed in several neurodegenerative diseases, including AMD [Citation53,Citation54]. To test if iron-induced inflammasome activation in RPE cells is driven by the CGAS-STING1 pathway, we cultured 4-month-old RPE explants from WT, sting1 KO and Sting1Gt mutant (a mutation in exon 6 of the Sting1 gene) mice (Fig. S2A, E). The explants were either untreated or treated with FAC for 72 h and Ad-LCN2 (for the last 48 h) and then ChQ was added for the last 6 h. FAC, LCN2 and ChQ treatment to WT, sting1 KO, Sting1Gt mutants induced iron accumulation (Fig. S2B). However, the treatment failed to activate the NLRP3 inflammasome ()) and IL1B ()) secretion in sting1 KO or Sting1Gt mutant RPE cells due to the lack of functional Sting1 ()). To evaluate the effect of lysosome function in inflammasome activation in sting1 KO or Sting1Gt mutant RPE cells, we cultured RPE explants from these mice in presence of FAC (72 h) and infected them with Ad-LCN2 (for the last 48 h) without treatment with ChQ. As expected, our results revealed no significant upregulation of the CGAS-STING1 signaling or IL1B levels compared to controls (Fig. S2F, G). In addition, we also found that LCN2 overexpression in sting1 KO or Sting1Gt mutant RPE explants in culture could reduce autophagy flux (Fig. S2H). These results indicate that even though LCN2 decreases autophagy flux in cells and iron accumulates with the loss of lysosomal function, the lack of a functional Sting1 gene prevents inflammasome activation in these cells.
To further prove that the iron accumulation triggers inflammasome activation via the CGAS-STING1 pathway, cryba1 KO RPE explant cultures from 4-month-old mice were pre-treated with the chelator deferoxamine (Def; 100 μM for 24 h) [Citation55], a specific inhibitor of STING1 (H-151; 1 μM for 6 h) [Citation56], or vehicle control (DMSO). The cultures were then exposed to FAC and Ad-LCN2. Either chelation of intracellular iron with Def or STING1 inhibition significantly reduced the levels of NLRP3. While both STING1 and CGAS levels were reduced upon Def treatment in cryba1 KO RPE cells cultured in the presence of FAC and Ad-LCN2, such changes were not observed in KO RPE cells treated with the STING1 inhibitor ()). Collectively, these results provide evidence that altered lysosomal function and dysregulated LCN2-dependent iron homeostasis activates the inflammasome via the CGAS-STING1 pathway in RPE cells.
Deregulated LCN2-iron axis triggers oxidative damage and lipid peroxidation in RPE cells
To ascertain if elevated iron and inflammasome activation can cause oxidative damage in our mouse model with an AMD-like phenotype [Citation7,Citation8,Citation23], we evaluated the levels of redox regulators in RPE cells from aged (10-month-old) cryba1 cKO mice. We found elevated levels of SOD1 (superoxide dismutase-1) in RPE cells from the cKO mice relative to controls ()) that was accompanied by elevated superoxide anion, as visualized by dihydroethidium (DHE) fluorescence ()). These results indicate that SOD1, which neutralizes superoxide anion, is upregulated while catalase, a regulator of H2O2 [Citation57], did not show any noticeable change in the aged cryba1 cKO RPE ()). Thus, our data indicate that the redox changes might be driven by superoxide and not H2O2. Moreover, to further establish that iron-induced inflammasome activation is responsible for the oxidative damage in RPE cells, cryba1 KO RPE explant cultures from 4-month-old mice were pre-treated with Def, STING1 inhibitor or vehicle control (DMSO), and were then exposed to FAC and Ad-LCN2. We found that treatment with Def and the STING1 inhibitor decreased SOD1 ()) and reactive oxygen species (ROS) levels ()) in the explants treated with FAC and Ad-LCN2, suggesting that iron accumulation and inflammasome activation drive the redox imbalance in these cells. It is known that cellular iron accumulation and subsequent oxidative damage can induce lipid peroxidation and ferroptosis [Citation58,Citation59]. However, the role of lipid peroxidation and ferroptosis in AMD is unclear. To address the hypothesis that the abnormal iron-mediated inflammasome activation and oxidative stress in the RPE triggers lipid peroxidation and ferroptosis, we quantified the levels of known ferroptosis and lipid peroxidation markers, such as ferritin heavy chain 1 (FTH1) and malondialdehyde (MDA) [Citation51], along with the activities of antioxidant enzymes GPX (glutathione peroxidase) [Citation57] and SOD, in RPE cells from cryba1 cKO mice. We found that FTH1 protein expression ()) and MDA levels ()) are highly elevated in 10-month-old cryba1 cKO RPE. But the activities of antioxidant enzymes like GPX ()) and SOD activity ()) were decreased in the cKO RPE, compared to controls. Such reciprocal effects on antioxidant enzyme activity and expression have been previously shown in other age-related diseases like Alzheimer disease [Citation60]. It is documented that the reduced activity along with the increased expression may be explained by inactivation of excess protein that has been synthesized under conditions of high oxidative stress [Citation60]. These results further implicate iron accumulation in the aged cKO RPE as a trigger of oxidative stress, which is known to be a key driver of AMD pathogenesis [Citation39].
Figure 4. Iron-mediated inflammasome activation triggers oxidative stress and ferroptosis in RPE cells. (a) Western blot analysis and densitometry showing increased levels of the redox sensitive protein, SOD1, but no noticeable change in CAT levels, in the RPE cells of 10-month-old cryba1 cKO mice, compared to age-matched controls. n = 5. (b) Elevated levels of reactive oxygen species (ROS) were observed in RPE lysates from 10-month-old cryba1 cKO mice, compared to age-matched controls. n = 4. (c) Western blot analysis and densitometry showing that treatment with Def (100 μM for 24 h) or STING1 inhibitor (H-151; 1 μM for 6 h) rescued the levels of SOD1 protein in cryba1 KO RPE cells treated with FAC and Ad-LCN2 in vitro. n = 4. (d) ROS levels were also rescued in Def and STING1 inhibitor-treated cultured cryba1 KO RPE explants that were exposed to FAC and Ad-LCN2, compared to vehicle treated group. n = 4. (e) Western blot analysis and densitometry showing increased ferroptosis marker protein, FTH1, in the RPE cells of aged (10 months old) cryba1 cKO mice, compared to age-matched controls. n = 4. (f) Increased levels of malondialdehyde (MDA), a known marker of ferroptosis activation in cells, were observed in the RPE cells of 10-month-old cryba1 cKO mice, compared to age-matched controls. n = 4. Decreased levels of the antioxidant enzyme (g) glutathione peroxidase and (h) SOD activity were also observed in 10-month-old cryba1 cKO mice, compared to controls. n = 4. (i) Live cell imaging in ARPE19 cells loaded with the fluorescent indicator, Liperfluo, which recognizes lipid peroxides that are markers for ferroptosis activation, showed higher liperfluo emission intensity (green) in RSL3 (3 μM for 12 h, positive control; Iii) and FAC+Ad-LCN2+ ChQ (FLC; Iiii) treated cells compared to control (Ii). The ferroptosis inhibitor ferrostatin-1 (25 μM; 12 h) abrogated the changes in the FLC-treated cells (Iiv). (j) Live cell imaging in ARPE19 cells loaded with liperfluo dye showed increased liperfluo fluorescent emissions (green) in FLC (Jii) or FLC+IgG (mouse immunoglobulin, 1 μg/ml for 1 h) treated cells (Jiii), compared to control (Ji). However, treatment with the monoclonal antibody (clone #6 mAb) targeting LCN2 (1 μg/ml for 1 h) could reduce such changes in the FLC-treated cells (Jiv). Scale bar: 50 μm. All values are Mean ± SD or Mean ± SEM (for the live cell imaging assay). n = 2. Significant changes are indicated by *P < 0.05, **P < 0.01.
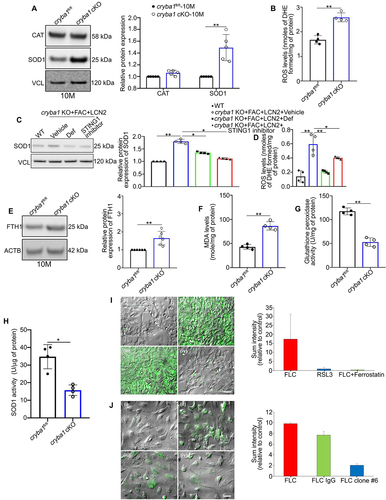
To further show that iron accumulation accompanied by dysregulation of LCN2 dependent iron chelation in RPE cells could trigger lipid peroxidation, a known trigger for ferroptosis induction [Citation61], we cultured ARPE19 cells in the presence of iron-rich medium containing FAC and infected them with an Ad-LCN2 construct in the presence of ChQ, followed by live cell imaging with Liperfluo dye to assess the extent of lipid peroxidation [Citation62]. Our results showed that FAC and Ad-LCN2 treatment in the presence of ChQ induced lipid peroxidation in RPE cells (-ii)) and also in RAS-selective lethal (RSL3)-treated cells (positive control) (-iii)) [Citation63], relative to control ( -i)). However, pre-treatment with ferrostatin-1 [Citation64], a known inhibitor of lipid peroxidation and ferroptosis followed by treatment with FAC, Ad-LCN2 and ChQ in the RPE cells could rescue the lipid peroxidation increase and possibly, the ferroptosis induction in these cells ( iv)). Further, to evaluate if targeting LCN2 can rescue lipid peroxidation in vitro, we generated monoclonal antibodies (mAbs) against human recombinant LCN2. In this study we chose a specific clone (clone #6) from our mAbs pool that neutralizes both the monomer and homodimer variants. Interestingly, when the Liperfluo fluorescence intensities for each group were compared to the control cells ( i)), it was observed that treatment with the monoclonal antibody (1 μg/ml) could decrease lipid peroxidation in RPE cells ( iv)), relative to untreated and mouse IgG treated cells (-iii)). These results suggest that iron accumulation in RPE cells induces oxidative stress and increases lipid peroxidation, which can be rescued by neutralizing LCN2.
The LCN2 homodimer variant is predominant in an AMD-like mouse model and in dry AMD patients
LCN2 is known to exist in both monomeric and dimeric variants with their relative abundance differing amongst cell types and diseases [Citation10,Citation11]. Previous reports suggest that the LCN2 homodimer is linked to the pathogenesis of several diseases [Citation13,Citation14]. We have previously shown that sub-retinal injection of recombinant LCN2 protein to immune-compromised NOD-SCID mice triggers retinal degeneration [Citation7]. To further investigate whether the LCN2 homodimer variant plays a pathologic role in dry AMD, we performed western blot analysis using RPE lysates from aged (12-month-old) cryba1 cKO and cryba1-floxed mice with the neutralizing mAb under both non-reducing and reducing conditions, to confirm the presence of the homodimer. We found that the LCN2 homodimer variant is increased in the RPE from cryba1 cKO mice compared to floxed controls ()). Interestingly, the homodimer to monomer ratio is significantly increased in the cKO RPE ()). Further, after overexpressing Adenovirus-LCN2 (Ad-LCN2 construct) in floxed RPE explants, only the homodimer variant was secreted into the spent medium (SM) ()), indicating that the homodimer variant is formed when LCN2 is upregulated in RPE cells. We also observed increased LCN2 homodimer in the non-denatured lysates from human AMD donor RPE, compared to age-matched controls. Interestingly, the homodimer to monomer ratio is also increased in these lysates ()). Taken together, these results indicate that the LCN2 homodimer variant is significantly upregulated in the RPE of both cryba1 cKO mice and human AMD patients.
Figure 5. Elevated levels of LCN2 monomer and homodimer in the RPE cells trigger retinal degeneration. (a) Non-denaturing (native) PAGE followed by western blot showing an elevated homodimer: monomer ratio of LCN2 in the RPE cells from 12-month-old cryba1 cKO mice, compared to floxed controls (cryba1fl/fl), n = 4. (b) SDS-PAGE followed by western blot analysis using LCN2 mAb (clone #6) showing elevated levels of the LCN2 homodimer in RPE cells from 12-month-old cryba1 cKO mice, compared to floxed controls, which is reduced to the monomer form upon beta-mercaptoethanol treatment. (c) SDS-PAGE followed by western blot on the SM from floxed RPE explants overexpressing LCN2 showed elevated levels of the LCN2 homodimer only, which was further reduced upon beta-mercaptoethanol treatment. n = 4. (d) Native PAGE followed by western blot showing an increased in homodimer:monomer ratio of LCN2 in the RPE cells from human AMD donors compared to age-matched controls. n = 3. (e) SD-OCT images and a spider plot showing changes in the IS/OS+RPE layer (arrows) in NOD-SCID mice, keeping the optic nerve head (ONH) as the center position, one month after the mice received sub-retinal injections with the SM from LCN2 overexpressing floxed RPE explants. Pre-treatment of the SM with monoclonal antibody against LCN2 (clone #6 mAb), which targets and shows neutralizing property against both variants of LCN2 at a dose of 1 μg/ml for 1 h, followed by sub-retinal injection to the contralateral eye of the same mouse, could partially prevent the structural alterations. n = 4. (f) Representative electroretinography (ERG) wave front on 24 h dark adapted mice showed alterations in both (g) scotopic a- and (h) b-wave responses measured at three different light intensities (0.01, 0.1 and 1 cd*s/m2), suggesting alterations in retinal function in the LCN2 overexpressing SM injected NOD-SCID mice, which was rescued partially, only after exposure to the highest light intensity upon treatment with clone #6 mAb. n = 4. (I) Molecular modeling showing that the LCN2 homodimer (Orange) fails to form the putative complex with ATG4B (purple) and LC3 (green) since the homodimer would compete with LC3 for the same binding area at the ATG4B surface. All values are Mean ± SD. Significant changes is indicated by *P < 0.05, **P < 0.01.
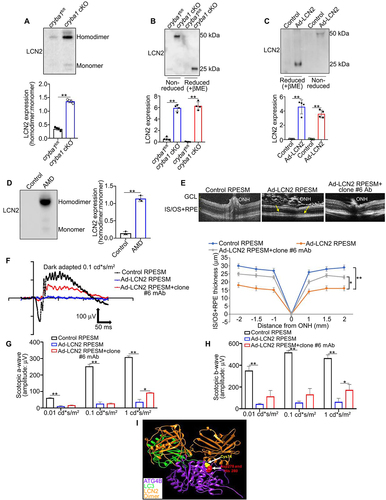
To evaluate further if the LCN2 homodimer contributes to retinal degeneration, we first cultured floxed RPE explants that were either infected with Ad-LCN2 construct or left untreated. The RPE SM from the LCN2 overexpressing explants, which contains only the homodimer variant, was collected and then sub-retinally injected into NOD-SCID mice. Similar mice were injected with RPE SM from untreated explants, or RPE SM from explants infected with Ad-LCN and pre-treated with the mAb (1 μg/ml for 1 h). After one month, using spectral domain optical coherence tomography (SD-OCT) imaging, Ad-LCN2 SM-treated eyes had altered retinal structure with changes in inner segment (IS)/outer segment (OS)+RPE layer thickness, when compared to control RPE SM-treated eyes (arrows; )). Importantly, Ad-LCN2 RPE SM pretreated with the mAb did not produce alterations in the IS/OS+RPE layer ()). These changes correlated with retinal function as assessed by electroretinography (ERG), showing decreased scotopic a- and b-wave responses in retinas from mice treated with Ad-LCN2 SM ()), whereas mAb pretreatment partially rescued such changes ()). Moreover, computer modeling confirmed that the LCN2 homodimer (orange) would not form the complex with ATG4B (purple) and LC3 (green) since the dimeric molecule would compete with LC3 for the same binding area at the ATG4B surface ()), thereby blocking LC3 lipidation. It has been previously shown that LCN2 inhibition has been attributed to both induction and suppression of autophagy in cells [Citation24,Citation65]. To test if the monomeric (basal) LCN2 is important for autophagy owing to its regulation of ATG4B-mediated LC3 lipidation, we evaluated autophagy flux in WT RPE explants after knockdown of Lcn2 with shRNA. Our results revealed that knocking down LCN2 could inhibit autophagy flux in RPE cells (Fig. S3). This result supports the idea that LCN2 monomer is required for autophagy regulation, whereas in disease the upregulation of the homodimer variant blocks the critical binding site to form the ATG4B-LCN2-LC3 complex, resulting in altered LC3 lipidation and compromise of subsequent autophagosome processing. This prompted us to further investigate if targeting LCN2 variants with the mAb in vivo could alleviate the early/dry AMD-like phenotype in a mouse model.
A monoclonal antibody (clone #6) revives autophagy, diminishes inflammasome activation and lipid peroxidation, and restores retinal function in an AMD-like mouse model
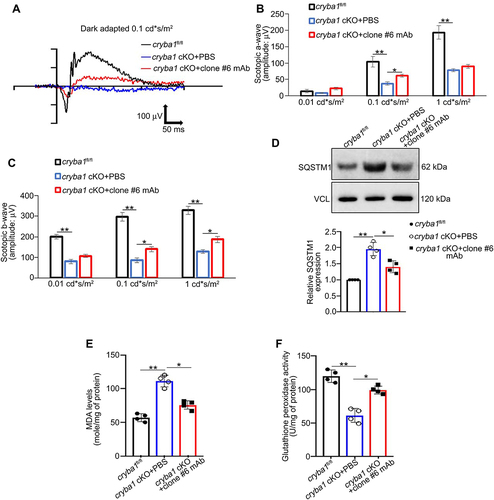
The mAb recognizes both LCN2 variants and shows neutralizing potency along with a noticeable in vitro efficiency in limiting ferroptosis in RPE cells following iron accumulation. We subretinally injected 1 μl of the mAb (1 μg/μl) into one eye of 5-month-old cryba1 cKO mice, with the contralateral eye receiving phosphate-buffered saline (PBS) vehicle. Since we previously showed that retinal function (ERG) in the cryba1 cKO mouse model is altered from 7 months of age relative to age-matched floxed littermate controls [Citation23], we performed ERGs 2.5 months post-injection and found that the LCN2 antibody improved the scotopic a- and b-waves in the cKO animals ()). We also found that the accumulation of the autophagosome marker [Citation22], SQSTM1 ()), along with the upregulation of lipid peroxidation marker, MDA ()) and the decrease in the antioxidant enzyme glutathione peroxidase activity ()) were rescued to near normal levels in the RPE of cryba1 cKO eyes that were treated with the mAb as compared to the PBS-treated contralateral eyes ()).
Figure 6. A monoclonal antibody targeting LCN2 rescues salient features of dry AMD in a mouse model. (a) Representative ERG wave form from a 24 h dark adapted 7.5-month-old cryba1 cKO mouse after 2.5 months of treatment with either 1 μg/μl clone #6 mAb or PBS, injected subretinally in the contralateral eyes of the same mouse, respectively. The ERG analysis showed alterations in both (b) scotopic a- and (c) b-wave responses measured at three different light intensities (0.01, 0.1 and 1 cd*s/m2), suggesting significant rescue of the a- and b-wave response after the monoclonal antibody treatment. n = 4. (d) Western blot analysis showing that subretinal injection with the clone #6 mAb in the cryba1 cKO mouse model decreased expression of the autophagosome marker SQSTM1, compared to contralateral eyes that were injected with PBS. n = 4. (e, f) Sub-retinal injection of the clone #6 mAb to 7.5-month-old cryba1 cKO mice for 2.5 months also significantly improved the RPE levels of (e) MDA and (f) glutathione peroxidase activity, compared to the RPE harvested from the PBS-treated contralateral eye of the same mouse. All values are Mean ± SD. Significant changes are indicated by *P < 0.05, **P < 0.01.
Discussion
AMD is one of the leading causes of blindness in the elderly and represents a major socio-economic burden on society at large. The dry or atrophic form of AMD comprises about 90% of all AMD cases, but unfortunately, no treatment is available for patients with early disease [Citation66]. AMD is a complex and progressive degenerative eye disease involving multiple genetic and environmental factors [Citation39,Citation67]. Recently, the RPE has been identified to be among the first cells affected in human dry AMD [Citation68]. We previously showed that upregulation of LCN2 occurs in the RPE both in a mouse model with a dry AMD-like phenotype as well as in human AMD donor eyes [Citation8,Citation15].
In this study, we have uncovered a previously unknown cellular function of LCN2 in autophagy regulation. This discovery is important because the RPE serves two crucial physiological roles that are vital for normal retinal function and vision [Citation30]. One such function, phagocytosis of shed photoreceptor outer segments, is critical to the well-being of the photoreceptors, the light sensitive cells of the retina. Along with phagocytosis, autophagy, a process in which damaged proteins or organelles from within the cell are degraded, is essential for maintaining normal RPE homeostasis [Citation30]. When these functions are impaired in RPE cells, they may die, causing secondary damage to photoreceptors and vision loss [Citation30,Citation39]. In the RPE, LCN2 binds to ATG4B to form the LCN2-ATG4B-LC3 complex, which is essential for LC3 lipidation. ATG4B cleaves pro-LC3 to enable lipids to deconjugate from LC3 (deLC3ylation), a key protein in autophagosome formation and maturation [Citation20]. Interestingly, Atg4B−/− mice showed systemic reduction in autophagy flux [Citation69]. Surprisingly, Atg4B KO mice are also linked to the decreased biogenesis of lysosomal organelles complex 1 (BLOC-1) [Citation69]. Intriguingly, a polymorphism in the lysosomal gene Bloc1s1 (biogenesis of lysosomal organelles complex 1 subunit 1), a component of the BLOC-1 multisubunit protein complex, has been linked with AMD risk [Citation70]. Our data suggest that monomer LCN2 (basal) can form a complex with ATG4B-LC3 and regulate ATG4B-mediated LC3 lipidation, thereby modulating autophagosome processing. However, the LCN2 homodimer variant, which is significantly increased in AMD, is incapable of forming this complex, thereby inhibiting ATG4B activity and subsequently triggers abnormalities in autophagosome processing and decline in autophagy flux. Moreover, based on molecular modeling, we speculate that the homodimer variant will mask the active site of ATG4B and thereby prevent it from efficiently processing LC3.
There is now a large body of published data, which suggests that autophagy and the inflammasome engage in mutual regulation [Citation40]. LCN2 is a potent iron chelator, but, the homodimer variant, which is significantly upregulated in the RPE during AMD progression, is unable to chelate iron, which would likely facilitate the downstream toxic effects of iron accumulation [Citation4,Citation12]. Several studies have linked iron accumulation and toxicity with AMD [Citation38,Citation71]. Using genetically engineered mouse models as tools, we showed that deregulated iron homeostasis in the RPE could activate the NLRP3 inflammasome through the CGAS-STING1 pathway, likely due to the dual effect of defective autophagy and general lysosomal dysfunction in the RPE. Iron-mediated inflammasome activation and the CGAS-STING1 pathway are critical in several diseases including AMD [Citation38,Citation53,Citation54]. Moreover, NLRP3 inflammasome activation has been reported to trigger activation of autophagosome formation, which is dependent on the presence of the inflammasome sensor [Citation40]. Autophagy inhibition has been shown to potentiate inflammasome activity, as opposed to stimulating autophagy, which inhibits it [Citation72]. Moreover, STING1 itself is trafficked to the lysosomes for degradation, dampening inflammation by eliminating this important signaling component [Citation73]. Loss of lysosomal function has also been reported to boost STING1 signaling in cells [Citation74].
Inflammasome activation has previously been shown to trigger oxidative stress, which can lead to cell death [Citation75,Citation76]. We found that in RPE cells with elevated LCN2 accompanied by lysosomal dysfunction and high intracellular iron, there was a marked increase in oxidative stress, in particular, in the level of superoxide anion; SOD1 the enzyme that eliminates superoxide was also increased [Citation57]. ROS can inhibit the delipidation activity of ATG4B [Citation77], probably leading to autophagy-dependent lipid peroxidation and ferroptosis. It is now well-documented that ferroptosis requires the autophagy machinery for its execution and is distinct from other types of cell death [Citation78]. While evidence has been building that ferroptosis triggers numerous human diseases [Citation79], no studies have yet linked ferroptosis to dry AMD. We have discovered a molecular pathway that could induce lipid peroxidation and ferroptosis in dry AMD, however future studies on AMD tissue will be needed to provide decisive evidence that this happens in vivo. Moreover, we have previously reported that mediators of canonical cell death pathways, such as CASP3 are also activated in the cryba1 cKO RPE cells with age [Citation8], suggesting multi-factorial influences, culminating in RPE cell death during disease pathogenesis that perhaps also occurs in human AMD [Citation39,Citation67].
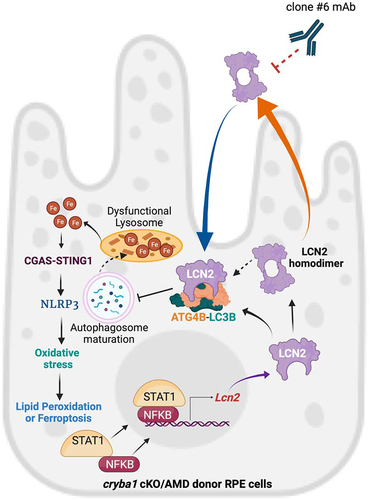
AMD is a disease that will be difficult to treat since several factors/pathways are involved in the disease pathogenesis [Citation39,Citation67]. Here, we show that LCN2 is a critical factor for maintaining RPE homeostasis. Our breakthrough finding that LCN2 modulates the autophagy process in RPE cells, links two cellular homeostatic pathways (autophagy and inflammasome activation) leading to ferroptosis, provides further evidence that dry AMD disease is associated with lysosomal/autophagy dysfunction. During aging, immune responses become exaggerated, suggesting that para-inflammation is required for maintenance of cellular homeostasis [Citation39,Citation67,Citation80]. The conversion from para-inflammation to chronic inflammation as seen in AMD may be due to a decline in autophagy, which can trigger inflammasome activation. Thus, besides autophagy, our studies link LCN2 with iron regulation, oxidative stress and inflammasome-mediated chronic inflammation, all of which participate in AMD pathogenesis [Citation38,Citation39,Citation54,Citation71]. While the RPE may die from ferroptosis, to the best of our knowledge, direct evidence of ferroptosis in AMD is lacking. Based on our results, it is a worthwhile future research direction. Most importantly, a mAb that neutralizes both the monomer and homodimer variants rescued retinal function as well as autophagy, inflammasome activation, lipid peroxidation, and ferroptosis activity in cryba1 cKO mice, an animal model with a dry AMD-like phenotype (). In conclusion, we have identified a molecular pathway whereby LCN2 promotes RPE degeneration, providing a possible therapeutic approach for a disease lacking treatment options at present.
Figure 7. LCN2 deregulates the autophagy process in RPE cells and targeting LCN2 variants with a monoclonal antibody can significantly diminish an AMD-like phenotype in a mouse model. LCN2 upregulation in RPE cells occurs through the activation of the NFκB-STAT1 signaling axis both in the cryba1 cKO mouse model and in human AMD donor samples. Here, we show that LCN2 binds to and regulates the activity of ATG4B by forming a complex with ATG4B and LC3, thereby modulating autophagosome processing (autophagy flux). LCN2 monomer and dimer variants are upregulated in RPE cells from the cryba1 cKO mouse model and human dry AMD donors, while the homodimer variant, the only form secreted from the RPE cells, can trigger retinal degeneration. Further, the homodimer variant is unable to form the complex with ATG4B and LC3. Alterations in autophagosome processing due to LCN2 upregulation accompanied with abnormal lysosomal function in RPE cells trigger abnormal iron accumulation. Alterations in iron homeostasis in RPE cells trigger inflammasome activation through the upregulation of the CGAS-STING1 pathway leading to oxidative stress and ferroptosis. Targeting LCN2 with a monoclonal antibody (clone #6 mAb) that recognizes and neutralizes both LCN2 variants can mitigate the changes in autophagy, lipid peroxidation or ferroptosis and diminish the AMD-like phenotype in a mouse model.
Materials and methods
Antibodies
The primary antibodies used in this study were: LCN2 mAb clone #6 (generated in our laboratory), ATG4B (Thermo Fisher, 701882), GFP (Cell Signaling Technology, 2555S), GST (Cell Signaling Technology, 2622S), FTH1 (Cell Signaling Technology, 4393S), LC3B (Cell Signaling Technology, 2775S), NLRP3 (Cell Signaling Technology, 15101S), SQSTM1 (Cell Signaling Technology, 5114S), CGAS (Sigma Aldrich, ABF124), STING1 (Novus Biologicals, NBP2-24683), IL1B/IL-1β (Abcam, ab9722), CAT/catalase (Abcam, ab209211), SOD1 (Cell Signaling Technology, 37385S), PMEL/PMEl17 (Novus Biologicals, NBP1-69571), TYR/tyrosinase (Thermo Fisher, 35–600-0), VCL/vinculin (Abcam, ab129002) and ACTB/actin, beta (Sigma Aldrich, A2066). The secondary antibodies used in this study were anti-rabbit (KPL, 074–1506) and anti-mouse (KPL, 074–1806).
Animals
Both male and female cryba1 conditional knockout mice (cryba1 cKO C57Bl/6 J mice) and cryba1 KO were generated as previously explained [Citation23]. sting1 knockout (KO), Sting1 Goldenticket (Sting1GT) mutant and NOD-SCID mice (4-week-old NOD.CB17-Prkdescid/J mice) were purchased from The Jackson Laboratory (036638, 017537, and 001303). The sting1 KO and Sting1GT were bred to generate the animals required for this study and was maintained at 12:12 LD cycle. To avoid circadian effects on autophagy, all in vivo experiments (euthanasia and procurement of RPE for downstream experiments) were conducted between 7–8 AM, at the onset of light, using our previously published protocols [Citation22,Citation23]. All animal studies were conducted in accordance with the Guide for the Care and Use of Animals (National Academy Press) and were approved by the University of Pittsburgh Animal Care and Use Committee.
RPE explant culture
RPE flat mount culture was done as previously described [Citation81]. Briefly, eyeballs were enucleated from WT, cryba1 KO, sting1 KO or Sting1GT mice respectively, immediately after euthanasia by putting in CO2 chamber. The posterior eyecups were cut into four petals after the removal of anterior segments and the neural retina was carefully removed. The resulting RPE-choroid-sclera (RCS) complexes were flattened onto PVDF membranes with the RPE cells facing up and cultured as previously described. For experiments involving iron regulation, RPE explants from different genotypes were cultured in presence of ferric ammonium citrate (FAC; Sigma Aldrich, RES20400-A702X) at a dose of 250 μM for 72 h [Citation71,Citation82], adenovirus-LCN2 (107 vg/ml, Ad-LCN2; Vector Biolabs, ADV-263329) construct for 48 h and with or without chloroquine (ChQ; Sigma Aldrich, C6628-25 G), a known lysosomal blocker at a dose of 50 μM for the last 6 h of the experimental duration. For rescue experiments, cryba1 KO explants were cultured and pre-treated with either Def (100 μM for 24 h; Sigma Aldrich, D9533-1 G) or STING1 inhibitor (H-151; 1 μM for 6 h; Invitrogen, inh-h151) which was followed by FAC and Ad-LCN2 treatment as explained above.
Sub-retinal injections, electroretinography and spectral domain-optical coherence Tomography (SD-OCT)
Sub-retinal injection was performed on 4-week-old NOD-SCID and 5-month-old cryba1 cKO mice [Citation7]. Mice were anaesthetized and sub-retinal injections of either RPESM from floxed RPE flat mount culture overexpressing LCN2 or the same SM pre-treated with 1 μg/ml of the monoclonal antibody (LCN2 mAb clone #6) for 1 h, were given to the contralateral eyes of the same NOD-SCID mice, respectively [Citation7,Citation83]. The cryba1 cKO mice were also subretinally injected with either PBS (Thermo Fisher, 10010–023) in one eye or the monoclonal antibody in contralateral eyes of the same mouse [Citation7]. For the NOD-SCID mice, treatment was done for one month, whereas the cryba1 cKO mice were treated for 2.5 months. Both the treated and untreated mice were dark adapted for 24 h and then were anaesthetized by intraperitoneal injection (100 μl) of ketamine (50 mg/kg body weight)-xylazine (10 mg/kg body weight) was used for anesthesia, and then subjected to electroretinography to evaluate retinal function by estimating the scotopic a- and b-wave responses using the Celeris Diognosys System, USA [Citation23]. Responses were measured at three different light intensities (0.01, 0.1 and 1 cd*s/m2). After the experiment, the cryba1 cKO animals were euthanized with CO2 gas and the eyes were harvested for further experiments to evaluate the expression of protein levels by western blot or other biochemical experiments. NOD-SCID mice were also subjected to SD-OCT analysis using a Bioptigen Envisu R2210, USA system. OCT images were analyzed keeping the optic nerve head (ONH) at the 0 position and then the optical sections (100 sections per retina) were measured from each eye ranging from −2.0 to +2.0 mm with respect to the ONH using the FIJI-ImageJ (NIH) plugin provided with the instrument along with Diver 2.4 software (Bioptigen) [Citation7].
Sub-retinal injection of Adenoviral LCN2 construct and ChQ treatment in vivo
Sub-retinal injection was performed on 4-week-old NOD-SCID with Adenovirus-LCN2 (109 vg/ml, Ad-LCN2; Vector Biolabs, ADV-263329) [Citation7,Citation84] in one eye whereas the contralateral eye received empty vector. The animals were intraperitoneally injected with 100 mg/kg body weight of ChQ 5 days after Ad-LCN2 injection [Citation43]. The mice were euthanized 3 h after ChQ injection [Citation43] and then RPE was collected for subsequent experiments.
Co-immunoprecipitation
cryba1 floxed RPE flat mount cultures were infected with Adenovirus-LCN2-GFP (Ad-LCN2-GFP, Vector Biolabs, 2000) or Adenovirus-GFP constructs (Ad-GFP; Vector Biolabs, 1060) at a dose of 107 vg/ml for 48 h and lysed in RIPA buffer (EMD Milipore, 20–188) supplemented with a protease inhibitor cocktail (Sigma Aldrich, I3786-1ML). The cell lysates were incubated with GFP magnetic beads (Chromotek, gtd-10) for 2 h at 4°C. Collected beads were washed with washing buffer and eluted with 2x SDS-sample buffer as previously explained [Citation85]. The eluted samples were analyzed on a SDS-PAGE gel followed by western blot to assess the binding of ATG4B. The affinity-isolation was confirmed by re-probing the membrane with an anti-GFP antibody (Cell Signaling Technology, 2555S) which showed two distinct molecular weight bands-one for the LCN2 fused to GFP in cells infected with the Ad-LCN2-GFP construct and the other for a lower molecular weight band for GFP protein only in cells that were infected with the Ad-GFP construct.
Immunofluorescence
ARPE19 cells (ATCC, CRL-2302) were grown to 60% confluency as described by the manufacturer. The cells were infected with an Ad-LCN2-GFP construct (mentioned above) (107 vg/ml) for 48 h, where the media was changed after 24 h of infection. The cells were fixed with 2% paraformaldehyde (PFA; Alfa Aesar, J61899-AP) for 30 mins at 4°C, then permeabilized and blocked with 5% donkey serum (Sigma Aldrich, D9663-10ML) in 1X PBS containing 0.1% Triton X-100 (Sigma Aldrich, T8787-250ML) for 30 min at room temperature (RT). The cells were washed twice with PBS and then stained with anti-ATG4B antibody (Thermo Fisher, 701882) diluted to 1:100 in the blocking buffer without Triton-X100 overnight in 4°C. The cells were then washed with PBS+0.1% Tween 20 (PBST; Sigma Aldrich, P7949-100ML) thrice and incubated in 1 μM DAPI (Southern Biotech, 0100–20), to stain the nucleus for 10 min at RT. The cells were again washed with PBST five times and visualized on an Olympus IX81 confocal microscope. Analysis of colocalization between LCN2 (green) and ATG4B (red) was done using the JACoP plugin of ImageJ software and the Pearson’s co-efficient was calculated to quantify the level of colocalization between the two proteins as previously described [Citation86].
Thermal shift assay
Changes in melting temperature (Tm) were assessed to evaluate the binding propensity of LCN2 and ATG4B. Human ATG4B (Abcam, ab188707) at a dose of 0.5 μg/ml with or without 1 μg/ml of human LCN2 (R&D Systems, 1757-LC-050) and 5 μM sypro orange (Thermo Fisher, S-6650) were incubated for 30 min at 4°C. The change in Tm was evaluated in a quantitative PCR machine (ABI Systems, USA) using a previously published method [Citation27,Citation28].
Single cell RNA sequencing (scRNAseq) and bioinformatics
The sub-retinal region was carefully dissected out from enucleated eyes harvested from 3- and 15- month-old cryba1fl/fl and cryba1 cKO mice perfused with saline, to remove peripheral blood from the body. The tissues were then subjected to single cell preparation as previously described. scRNAseq was performed as a paid service from the Genomics Research Core of University of Pittsburgh, to identify the RNA expression profile of different cells, particularly of the RPE. Bioinformatics analysis was performed by creating Seurat objects for each sample by the function “CreateSeuratObject” in Seurat package (min.cells = 3, min.features = 200), and cells were further filtered out with nFeature_RNA > 8000 or with a mitochondrial rate > 20%. Scrublet to remove predicted doublets with default parameters was used. As a result, 10455 cells were used for downstream analysis. After clustering the cells, cell type identities were assigned based on the top marker genes of each cluster as well as visualizing the expression of canonical marker genes of candidate cell types. Average expression values of the genes in each cell type and each sample were then calculated by the function “AverageExpression” in Seurat package [Citation87].
Quantitative PCR
qRT-PCR was performed as previously described [Citation22] using Taqman probes (Life Technologies, USA) for mouse Atg7 (Mm00512209_m1), Atg9 (Mm01264420_m1), Lc3b (Mm00782868_sH).
Estimation of autophagosome number in RPE cells
ARPE19 cells were infected for 12 h with 108 vg/ml of an Adenovirus-GFP-RFP-LC3 construct (Vector Biolabs, 2001). The cells were then treated with 107 vg/ml of an Ad-LCN2 construct (as described above) for 48 h. The cells were fixed with 2% PFA for 30 min at 4°C and then the cells were labeled for F-actin with Alexa Fluor 647 phalloidin (Invitrogen, A22287) and nuclei with Hoechst (Sigma, B2883) 1 mg/100 ml dH2O. Confocal images were acquired at 60x using Nikon NIS Elements v5.3 (Nikon, Melville NY). 3D spot detection was used to segment positive structures for size, shape and intensity for RFP/GFP, and RFP only puncta were identified.
Western blot
Whole cells lysates were made from RPE cells harvested from cryba1fl/fl or cryba1 cKO mice or from in vitro RPE flat mount cultures from different experimental conditions as explained previously [Citation7,Citation81]. The lysates were either made in 1X RIPA buffer (EMD Milipore, 20–188) or NATIVE lysis buffer (Abcam, ab156035) containing 0.1% of a protease inhibitor cocktail (Sigma Aldrich, I3786) and 0.1% phosphatase inhibitor cocktail (Sigma Aldrich, P0044-5ML). The protein extracts were subjected to quantification by using the Pierce BCA Protein Assay Kit (Thermo Fisher, 23225). The RIPA protein samples were mixed with 4X protein sample buffer (Life Technologies, NP0007) containing 5% 2-mercaptoethanol (Sigma Aldrich, M6256) and heated at 95°C for 10 min to denature. The native protein samples were mixed with NATIVE sample buffer (Bio-Rad, 1610738) at a 1:1 ratio. The native samples were loaded on NATIVE-PAGE gels (Thermo Fisher, BN1002BOX) and run using NATIVE-PAGE running buffer (Thermo Fisher, BN2001). Samples were loaded onto a 4–12% Bis-Tris Nu-PAGE gel (Invitrogen, NP0323BOX) and run with MES buffer (Invitrogen, NP0002). Proteins were transferred to nitrocellulose membranes (Invitrogen, IB23001), which were then blocked in 5% blocking grade skim milk (Bio-Rad, 170–6404) or 5% BSA (Sigma Aldrich, A3912-50 G) for phosphorylated proteins. The membranes were incubated with the appropriate primary antibody overnight followed by horseradish peroxidase-conjugated anti-rabbit (KPL, 074–1506) or anti-mouse (KPL, 074–1806) secondary antibodies for 1 h at RT. A chemiluminescence development technique was utilized to develop the blots (GE Healthcare, RPN2209) and the blots were imaged using the Azure imaging system (Azure Biosystems, USA). Densitometry was performed to estimate the protein expression relative to the loading control (ACTB or VCL) using ImageJ software (National Institutes of Health, USA) [Citation15,Citation22].
Human samples
The human RPE donor samples (~78 years old, both male and female) from AMD patients and age-matched control subjects (with no noticeable ophthalmological abnormalities) were procured from Lions Gift of Sight, Minnesota. The inferior region of the total RPE was lysed in NATIVE lysis buffer (Abcam, ab156035) containing 0.1% protease inhibitor cocktail (Sigma Aldrich, I3786) and 0.1% phosphatase inhibitor cocktail (Sigma Aldrich, P0044-5ML). Western blot was performed as previously described to for LCN2 using a monoclonal antibody (mLCN2 clone #6) [Citation15,Citation22].
Assessment of autophagy flux
Autophagy flux in RPE cells was assessed as previously described. Briefly, cryba1fl/fl RPE explants were infected with either Ad-LCN2 at a dose of 107 vg/ml for 48 h (medium was changed after 24 h of infection) or left untreated. ChQ (50 μM) was added for the last 6 h of the experimental duration. Cells were lysed in 1X RIPA containing 0.1% each of protease and phosphatase inhibitor cocktails and western blot was performed to evaluate the levels of LC3-I and LC3-II. Autophagy flux was estimated by calculating the ratio of LC3-II in chloroquine (ChQ)-treated cells with respect to untreated cells [Citation23,Citation88].
Cell free ATG4B activity assay
ATG4B activity assay was measured by incubating recombinant human LC3-GST (Enzo, BML-UW1155-0500) at a dose of 20 μg/ml with 0.5 μg/ml of human ATG4B (Abcam, ab188707) with or without human LCN2 (R&D Systems, 1757-LC-050) at a dose of 1 μg/ml for 15 min at room temperature [Citation89]. The protein samples were then mixed with 4X protein sample buffer (Life Technologies, NP0007) containing 5% 2-mercaptoethanol (Sigma Aldrich, M6256) and heated at 95°C for 10 min to denature. The samples were then subjected to western blot using the anti-GST primary antibody (Cell Signaling USA, 2622S) as previously explained [Citation15,Citation22].
Enzyme-linked immunosorbent assay (ELISA)
ELISA was performed using 10-month-old cryba1fl/fl and cKO RPE lysates as explained previously. Briefly, the RPE choroid complexes were homogenized in 300 μl of complete extraction buffer (Abcam, ab193970). This was followed by performing the ELISA in 96-well microtiter plates (Sigma Aldrich, M9410-1CS) coated with tissue lysates and incubated overnight at 4°C. The plates were then blocked with 5% BSA for 2 h and after washing with PBS, 50 μl of IL1B antibody (Abcam, ab9722) diluted to 1:1000 was added to each well and incubated for 2 h at RT. Bound cytokines were detected with secondary IgG-HRP (KPL, 074–1506). The color was developed with TMB substrate solution (Thermo Fisher, 34021). The reaction was stopped with 2 N H2SO4 solution, and absorbance was measured at 450 nm using a microplate reader [Citation7].
Intracellular iron levels
The intracellular iron levels in RPE cells from in vivo and in vitro experiments were evaluated by following the manufacturer’s protocol of the Iron Assay kit (Abcam, ab83366).
Intracellular reactive oxygen species
The ROS generation in 10-month-old RPE cells from cryba1fl/fl and cryba1 cKO mice was evaluated as described previously [Citation90]. Briefly, a 10% tissue homogenate was prepared in PBS and centrifuged at 1800 × g for 10 min, followed by centrifugation at 31,500 × g for 10 min to obtain the pellet. The obtained pellet was dissolved in HEPES buffer, pH 7.4 (Sigma Aldrich, H7006-100 G). The sample was incubated for 15 min at 37°C with 5 μM dihydroethidium (DHE; Fisher Scientific, D11347). Fluorescent signals were recorded from the conversion of DHE to 2-hydroxyethidium at the end of the incubation period, at an excitation wavelength of 480 nm and an emission wavelength of 525 nm in a spectrofluorometer (Jasco, USA). The ROS levels in the samples were estimated against a standard curve for an increasing concentration of DHE and were represented as nmoles of DHE formed/mg of protein [Citation90].
Live cell imaging
To assess the levels of lipid peroxidation in RPE cells, ARPE19 cells were cultured on four chambered dishes (VWR, 627871) and then either left untreated (control) or treated with 250 μM of ferric ammonium citrate (FAC) for 72 h to mimic the increased iron levels in vivo, followed by Ad-LCN2 (107 vg/ml) for the last 48 h and chloroquine (50 μM) for the last 6 h of the experimental duration respectively. RSL3 (3 μM, overnight; Cayman Chemicals, 19288) was used as a positive control for ferroptosis activation. The clone #6 monoclonal antibody targeting LCN2 (mAb; 1 μg/ml, 24 h) antibody and 25 μM (overnight) of ferrostatin-1 (Cayman Chemicals, 17729) were added to the culture to rescue ferroptosis induction in the RPE cells. Prior to imaging, the cells were incubated with Liperfluo (10 μM; Fisher Scientific, L24810) for 30 min and washed twice with PBS before replacing the original media in each chamber. The dishes were then inserted into a closed, thermo-controlled (37°C) stage top incubator (Tokai Hit Co.) above the motorized stage of an inverted Nikon TiE fluorescent microscope equipped with a 20x optic (Nikon, CFI Plan Fluor, NA 0.75). Liperfluo was excited using a diode-pumped light engine (SPECTRA X, Lumencor) and detected using a Prime95b sCMOS camera (Photometrics) and excitation and emission filters from Chroma. Data were collected every 15 min for 4 h, on approximately 250–500 cells per stage position, by acquiring a large area stitched montage image of each of the 4 separate experimental conditions. Data was collected and Liperfluo emissions were analyzed using NIS Elements (Nikon, Inc. Melville, NY).
Transfection with GFP-LC3-RFP-LC3∆G construct and flowcytometry
ARPE19 cells were cultured up to 60% confluency and then transfected with the GFP-LC3-RFP-LC3∆G construct (Addgene, 84572; deposited by Noboru Mizushima), to assess ATG4B activity, using the manufacturer’s protocol of the Lipofectamine 3000 Transfection Reagent (Thermo Fisher, L3000008) for 72 h [Citation85]. The transfection efficiency was confirmed by visualizing the GFP and RFP signals in the transfected cells using a fluorescence microscope. This was followed by infection with an Ad-LCN2 construct (as described above) for 48 h and treatment with recombinant human LCN2 protein (R&D Systems, 1757-LC-050) at a dose of 1 μg/ml for 24 h in separate experiments. The cells were then scraped off the plates and were analyzed by flow cytometry using the LSR-II platform (Beckman Coulter, USA). The results were analyzed using the FlowJo software (v10.8) and the data from each group was represented as the ratio of median GFP fluorescence to RFP fluorescence [Citation29,Citation85].
Glutathione peroxidase, superoxide dismutase activities and malondialdehyde levels
RPE cell lysates from in vivo experimental groups were subjected to assessment of glutathione peroxidase and SOD activities as well as MDA levels by following the manufacturer’s protocols of the Glutathione Peroxidase Assay Kit (Abcam, ab102530), Superoxide Dismutase Activity Assay Kit (Abcam, ab65354), and Lipid Peroxidation Assay Kit (Thermo Fisher, MAK085-1KT), respectively.
LCN2 knockdown in RPE explants
Lcn2 shRNA lentiviral (Santa Cruz Biotechnology, sc-60044-V) and control shRNA (Santa Cruz Biotechnology, sc-108080) were used at a concentration of 108 vg/ml to infect 10-month-old cryba1 KO and WT RPE explants, respectively for 72 h as previously described [Citation7]. Western blot was performed to assess the levels of the LC3-II:LC3-I ratio in these cells relative to control, as previously explained [Citation15,Citation22].
Computer modeling of protein binding
The crystal structure of human ATG4B-LC3 (1–120) complex (PDB: 2z0d.pdb) and LCN2 homodimer (PDB: 1qqs.pdb) were obtained from the RCSB PDB database (https://www.rcsb.org/). The possible interaction between LCN2 or ATG4B and LC3 was tested using an interactive protein docking and molecular superposition program HEX protein docking program, version 6.3 (http://hex.loria.fr/dist63/) as explained previously. Models of proteins were visualized using UCSF Chimera (https://www.cgl.ucsf.edu/chimera).
Statistical analysis
All analyses were performed using the GraphPad 8.0 software was used to perform statistical analysis. Students’ t-test and one-way ANOVA followed by Tukey post hoc test to measure the differences between groups (for experiments involving more than two groups) was performed. The significance was set at P < 0.05 and all p-values less than 0.05 (*P < 0.05) and 0.01 (**P < 0.01) were considered significant. The analyses were performed on triplicate technical replicates. Results are presented as mean ± standard deviation (SD) [Citation7,Citation15,Citation22,Citation85].
Data Availability
All data generated or analyzed during this study are included in this published article (and its Supplementary Information files). The schematic () is original and was created at BioRender.com and its raw illustration is available at https://app.biorender.com/illustrations/615c5606e511b000a6bd3dc5.
Supplemental Material
Download MS Word (929.3 KB)Acknowledgments
This work was supported by National Institutes of Health (R01EY031594-01A1) (to DS & JTH) and R01EY019037-S (to DS), Wiegand Entrepreneurial Award (to DS), UPMC Enterprises (to DS), Jennifer Salvitti Davis Chair in Ophthalmology (to DS), Research to Prevent Blindness, NY (to DS and Department of Ophthalmology, UPMC), BrightFocus Postdoctoral Fellowship Program in Macular Degeneration Research (to SG) and National Institutes of Health P30EY08098 (to Department of Ophthalmology Molecular Biology Core, UPMC). The human samples were obtained with funds for dry AMD research provided by Dr. Patricia Cayne and Mr. James Cayne (to DS).
Disclosure statement
SG, SH, DS and NS are inventors in a US patent filed by the University of Pittsburgh. The remaining authors declare no competing interests.
Supplementary material
Supplemental data for this article can be accessed here
Additional information
Funding
References
- Ghosh S, Stepicheva N, Yazdankhah M, et al. The role of lipocalin-2 in age-related macular degeneration (AMD). Cell Mol Life Sci. 2020 Mar;77(5):835–851. PMID: 31901947.
- Ouchi N, Parker JL, Lugus JJ, et al. Adipokines in inflammation and metabolic disease. Nat Rev Immunol. 2011 Feb;11(2):85–97. PMID: 21252989.
- Jaberi SA, Cohen A, D’Souza C, et al. Lipocalin-2: structure, function, distribution and role in metabolic disorders. Biomed Pharmacother. 2021 Oct;142:112002. PMID: 34463264.
- Golonka R, Yeoh BS, Vijay-Kumar M. The Iron Tug-of-War between Bacterial Siderophores and Innate Immunity. PMID: 30605903. J Innate Immun. 2019 Jan;11(3):249–262.
- Halaas O, Steigedal M, Haug M, et al. Intracellular Mycobacterium avium intersect transferrin in the Rab11(+) recycling endocytic pathway and avoid lipocalin 2 trafficking to the lysosomal pathway. J Infect Dis. 2010 Mar;201(5):783–792. PMID: 20121435.
- Hvidberg V, Jacobsen C, Strong RK, et al. The endocytic receptor megalin binds the iron transporting neutrophil-gelatinase-associated lipocalin with high affinity and mediates its cellular uptake. FEBS Lett. 2005 Jan;579(3):773–777. PMID: 15670845.
- Ghosh S, Padmanabhan A, Vaidya T, et al. Neutrophils homing into the retina trigger pathology in early age-related macular degeneration. Commun Biol. 2019 Sep;2(1):348. PMID: 31552301.
- Valapala M, Edwards M, Hose S, et al. Increased Lipocalin-2 in the retinal pigment epithelium of Cryba1 cKO mice is associated with a chronic inflammatory response. Aging Cell. 2014 Dec;13(6):1091–1094. PMID: 25257511.
- Viau A, El Karoui K, Laouari D, et al. Lipocalin 2 is essential for chronic kidney disease progression in mice and humans. J Clin Invest. 2010 Nov;120(11):4065–4076. PMID: 20921623.
- Santiago-Sánchez GS, Pita-Grisanti V, Quiñones-Díaz B, et al. Biological functions and therapeutic potential of lipocalin 2 in cancer. Int J Mol Sci. 2020 Jun;21(12):4365. PMID: 32575507.
- Barasch J, Hollmen M, Deng R, et al. Disposal of iron by a mutant form of lipocalin 2. Nat Commun. 2016 Oct;7(1):12973. PMID: 27796299.
- Axelsson L, Bergenfeldt M, Ohlsson K. Studies of the release and turnover of a human neutrophil lipocalin. PMID: 8633182. Scand J Clin Lab Invest. 1995 Nov;55(7):577–588.
- Singh V, Yeoh BS, Chassaing B, et al. Microbiota-inducible Innate Immune, siderophore binding protein lipocalin 2 is critical for intestinal homeostasis. Cell Mol Gastroenterol Hepatol. 2016 Jul;2(4):482–498.e6. PMID: 27458605.
- Rehwald C, Schnetz M, Urbschat A, et al. The iron load of lipocalin-2 (LCN2) defines its pro-tumour function in clear-cell renal cell carcinoma. Br J Cancer. 2020 Feb;122(3):421–433. PMID: 31772326.
- Ghosh S, Shang P, Yazdankhah M, et al. Activating the AKT2-nuclear factor-?B-lipocalin-2 axis elicits an inflammatory response in age-related macular degeneration. J Pathol. 2017 Apr;241(5):583–588. PMID: 28026019.
- Parmar T, Parmar VM, Arai E, et al. Acute stress responses are early molecular events of retinal degeneration in Abca4-/-Rdh8-/- mice after light exposure. Invest Ophthalmol Vis Sci. 2016 Jun;57(7):3257–3267. PMID: 27315541.
- Chen M, Yang N, Lechner J, et al. Plasma level of lipocalin 2 is increased in neovascular age-related macular degeneration patients, particularly those with macular fibrosis. Immun Ageing. 2020 Nov;17(1):35. PMID: 33292361.
- Schroll A, Eller K, Feistritzer C, et al. Lipocalin-2 ameliorates granulocyte functionality. Eur J Immunol. 2012 Dec;42(12):3346–3357. PMID: 22965758.
- Chakraborty S, Kaur S, Guha S, et al. The multifaceted roles of neutrophil gelatinase associated lipocalin (NGAL) in inflammation and cancer. Biochim Biophys Acta. 2012 Aug;1826(1):129–169. PMID: 22513004.
- Maruyama T, Noda NN. Autophagy-regulating protease Atg4: structure, function, regulation and inhibition. PMID: 28901328. J Antibiot (Tokyo). 2017 Sep;71(1):72–78.
- Wang C, Zhang R, Wei X, et al. Metalloimmunology: the metal ion-controlled immunity. Adv Immunol. 2020 PMID: 32081198;145:187–241.
- Shang P, Valapala M, Grebe R, et al. The amino acid transporter SLC36A4 regulates the amino acid pool in retinal pigmented epithelial cells and mediates the mechanistic target of rapamycin, complex 1 signaling. Aging Cell. 2017 Apr;16(2):349–359. PMID: 28083894.
- Valapala M, Wilson C, Hose S, et al. Lysosomal-mediated waste clearance in retinal pigment epithelial cells is regulated by CRYBA1/ßA3/A1-crystallin via V-ATPase-MTORC1 signaling. Autophagy. 2014 Mar;10(3):480–496. PMID: 24468901.
- Chan YK, Sung HK, Jahng JW, et al. Lipocalin-2 inhibits autophagy and induces insulin resistance in H9c2 cells. Mol Cell Endocrinol. 2016 Jul;430:68–76. PMID: 27090568.
- Sung HK, Chan YK, Han M, et al. Lipocalin-2 (NGAL) attenuates autophagy to exacerbate cardiac apoptosis induced by myocardial ischemia. J Cell Physiol. 2017 Aug;232(8):2125–2134. PMID: 27800610.
- Dikic I, Elazar Z. Mechanism and medical implications of mammalian autophagy. PMID: 29618831. Nat Rev Mol Cell Biol. 2018 Jun;19(6):349–364.
- Huynh K, Partch CL. Analysis of protein stability and ligand interactions by thermal shift assay. PMID: 25640896. Curr Protoc Protein Sci. 2015 Feb;79(1):28.9.1–28.9.14.
- Layton CJ, Hellinga HW. Quantitation of protein-protein interactions by thermal stability shift analysis. PMID: 21674662. Protein Sci. 2011 Aug;20(8):1439–1450.
- Kaizuka T, Morishita H, Hama Y, et al. An Autophagic Flux Probe that releases an internal control. Mol Cell. 2016 Nov 17;64(4):835–849. PMID: 27818143.
- Intartaglia D, Giamundo G, Conte I. Autophagy in the retinal pigment epithelium: a new vision and future challenges. FEBS J. 2021 May; Epub ahead of print. PMID: 33993621. 10.1111/febs.16018
- Tan W, Zou J, Yoshida S, et al. The role of inflammation in age-related macular degeneration. Int J Biol Sci. 2020 Sep;16(15):2989–3001. PMID: 33061811.
- Yu C, Roubeix C, Sennlaub F, et al. Microglia versus monocytes: distinct roles in degenerative diseases of the retina. Trends Neurosci. 2020 Jun;43(6):433–449. PMID: 3245999.
- Mauthe M, Orhon I, Rocchi C, et al. Chloroquine inhibits autophagic flux by decreasing autophagosome-lysosome fusion. Autophagy. 2018;14(8):1435–1455. PMID: 29940786.
- Jacomin AC, Geraki K, Brooks J, et al. Impact of autophagy and aging on iron load and ferritin in drosophila brain. Front Cell Dev Biol. 2019 Jul;7:142. PMID: 31404236.
- Masaldan S, Clatworthy SAS, Gamell C, et al. Iron accumulation in senescent cells is coupled with impaired ferritinophagy and inhibition of ferroptosis. Redox Biol. 2018 Apr;14:100–115. PMID: 28888202.
- Hedbrant A, Andersson L, Bryngelsson IL, et al. Quartz dust exposure affects NLRP3 inflammasome activation and plasma levels of IL-18 and IL-1Ra in iron foundry workers. Mediators Inflamm. 2020 Jan;2020:8490908. PMID: 32256196.
- Li C, Zhang Y, Cheng X, et al. PINK1 and PARK2 suppress pancreatic tumorigenesis through control of mitochondrial iron-mediated immunometabolism. Dev Cell. 2018 Aug;46(4):441–455.e8. PMID: 30100261.
- Gelfand BD, Wright CB, Kim Y, et al. Iron toxicity in the retina requires alu RNA and the NLRP3 inflammasome. Cell Rep. 2015 Jun;11(11):1686–1693. PMID: 26074074.
- Handa JT, Bowes Rickman C, Dick AD, et al. A systems biology approach towards understanding and treating non-neovascular age-related macular degeneration. Nat Commun. 2019 Jul;10(1):3347. PMID: 31350409.
- Biasizzo M, Kopitar-Jerala N. Interplay between NLRP3 inflammasome and autophagy. Front Immunol. 2020 Oct;11:591803. PMID: 33163006.
- Zhao S, Li X, Wang J, et al. The role of the effects of autophagy on NLRP3 inflammasome in inflammatory nervous system diseases. Front Cell Dev Biol. 2021 May;9:657478. PMID: 34079796.
- Iacovelli J, Zhao C, Wolkow N, et al. Generation of Cre transgenic mice with postnatal RPE-specific ocular expression. Invest Ophthalmol Vis Sci. 2011 Mar;52(3):1378–1383. PMID: 21212186.
- Vodicka P, Lim J, Williams DT, et al. Assessment of chloroquine treatment for modulating autophagy flux in brain of WT and HD mice. J Huntingtons Dis. 2014;3(2):159–174. PMID: 25062859.
- Hong L, Simon JD. Current understanding of the binding sites, capacity, affinity, and biological significance of metals in melanin. PMID: 17580858. J Phys Chem B. 2007 Jul;111(28):7938–7947.
- Wiriyasermkul P, Moriyama S, Nagamori S. Membrane transport proteins in melanosomes: regulation of ions for pigmentation. PMID: 32333855. Biochim Biophys Acta Biomembr. 2020 Dec;1862(12):183318.
- Wolkow N, Song Y, Wu TD, et al. Aceruloplasminemia: retinal histopathologic manifestations and iron-mediated melanosome degradation. Arch Ophthalmol. 2011 Nov;129(11):1466–1474. PMID: 22084216.
- Wolkow N, Li Y, Maminishkis A, et al. Iron upregulates melanogenesis in cultured retinal pigment epithelial cells. Exp Eye Res. 2014 Nov;128:92–101. PMID: 25277027.
- Zhu W, Zhao Z, Cheng B. The role of autophagy in skin pigmentation. PMID: 33262098. Eur J Dermatol. 2020 Dec;30(6):655–662.
- Juuti-Uusitalo K, Koskela A, Kivinen N, et al. Autophagy regulates proteasome inhibitor-induced pigmentation in human embryonic stem cell-derived retinal pigment epithelial cells. Int J Mol Sci. 2017;18(5):1089. PMID: 28534814.
- Berson JF, Harper DC, Tenza D, et al. Pmel17 initiates premelanosome morphogenesis within multivesicular bodies. Mol Biol Cell. 2001 Nov;12(11):3451–3464. PMID: 11694580.
- Lopes VS, Wasmeier C, Seabra MC, et al. Melanosome maturation defect in Rab38-deficient retinal pigment epithelium results in instability of immature melanosomes during transient melanogenesis. Mol Biol Cell. 2007 Oct;18(10):3914–3927. PMID: 17671165.
- Martín-Sánchez F, Diamond C, Zeitler M, et al. Inflammasome-dependent IL-1ß release depends upon membrane permeabilisation. Cell Death Differ. 2016 Jul;23(7):1219–1231. PMID: 26868913.
- Decout A, Katz JD, Venkatraman S, et al. The CGAS-STING1 pathway as a therapeutic target in inflammatory diseases. Nat Rev Immunol. 2021 Sep;21(9):548–569. PMID: 33833439.
- Kerur N, Fukuda S, Banerjee D. CGAS drives noncanonical-inflammasome activation in age-related macular degeneration. PMID: 29176737. Nat Med. 2018 Jan;24(1):50–61.
- Cappellini MD, Musallam KM, Taher AT. Overview of iron chelation therapy with desferrioxamine and deferiprone. Hemoglobin. 2009;33(Suppl sup1):S58–69. PMID: 20001633.
- Hong Z, Mei J, Li C, et al. STING inhibitors target the cyclic dinucleotide binding pocket. Proc Natl Acad Sci U S A. 2021 Jun 15;118(24):e2105465118. PMID: 34099558.
- He L, He T, Farrar S, et al. Antioxidants maintain cellular redox homeostasis by elimination of reactive oxygen species. Cell Physiol Biochem. 2017;44(2):532–553. PMID: 29145191.
- Mazhar M, Din AU, Ali H, et al. Implication of ferroptosis in aging. Cell Death Discov. 2021 Jun;7(1):149. PMID: 34226536.
- Li C, Liu J, Hou W, et al. STING1 promotes ferroptosis through MFN1/2-dependent mitochondrial fusion. Front Cell Dev Biol. 2021 Jun;9:698679. PMID: 34195205.
- Omar RA, Chyan YJ, Andorn AC, et al. Increased expression but reduced activity of antioxidant enzymes in alzheimer’s disease. J Alzheimers Dis. 1999 Oct;1(3):139–145. PMID: 12213999.
- Li J, Cao F, Yin HL, et al. Ferroptosis: past, present and future. Cell Death Dis. 2020 Feb;11(2):88. PMID: 32015325.
- Luchi K, Nishimaki K, Kamimura N, et al. Molecular hydrogen suppresses free-radical-induced cell death by mitigating fatty acid peroxidation and mitochondrial dysfunction. Can J Physiol Pharmacol. 2019 Oct;97(10):999–1005. PMID: 31295412.
- Yang WS, SriRamaratnam R, Welsch ME, et al. Regulation of ferroptotic cancer cell death by GPX4. Cell. 2014 Jan;156(1–2):317–331. PMID: 24439385.
- Miotto G, Rossetto M, Di Paolo ML, et al. Insight into the mechanism of ferroptosis inhibition by ferrostatin-1. Redox Biol. 2020 Jan;28:101328. PMID: 31574461.
- Jin D, Zhang Y, Chen X. Lipocalin 2 deficiency inhibits cell proliferation, autophagy, and mitochondrial biogenesis in mouse embryonic cells. PMID: 21234651. Mol Cell Biochem. 2011 May;351(1–2):165–172.
- Wong WL, Su X, Li X, et al. Global prevalence of age-related macular degeneration and disease burden projection for 2020 and 2040: a systematic review and meta-analysis. Lancet Glob Health. 2014 Feb;2(2):e106–16. PMID: 25104651.
- Whitcup SM, Sodhi A, Atkinson JP, et al. The role of the immune response in age-related macular degeneration. Int J Inflam. 2013 PMID: 23762772;2013:348092.
- Wang J, Zibetti C, Shang P, et al. ATAC-Seq analysis reveals a widespread decrease of chromatin accessibility in age-related macular degeneration. Nat Commun. 2018 Apr;9(1):1364. PMID: 29636475.
- Mariño G, Fernández AF, Cabrera S, et al. Autophagy is essential for mouse sense of balance. J Clin Invest. 2010 Jul;120(7):2331–2344. PMID: 20577052.
- Ratnapriya R, Sosina OA, Starostik MR, et al. Retinal transcriptome and eQTL analyses identify genes associated with age-related macular degeneration. Nat Genet. 2019 Apr;51(4):606–610. PMID: 30742112.
- Hadziahmetovic M, Song Y, Wolkow N, et al. Bmp6 regulates retinal iron homeostasis and has altered expression in age-related macular degeneration. Am J Pathol. 2011 Jul;179(1):335–348. PMID: 21703414.
- Shi CS, Shenderov K, Huang NN, et al. Activation of autophagy by inflammatory signals limits IL-1ß production by targeting ubiquitinated inflammasomes for destruction. Nat Immunol. 2012 Jan;13(3):255–263. PMID: 22286270.
- Gonugunta VK, Sakai T, Pokatayev V, et al. Trafficking-Mediated STING degradation requires sorting to acidified endolysosomes and can be targeted to enhance anti-tumor response. Cell Rep. 2017 Dec;21(11):3234–3242. PMID: 29241549.
- Chu TT, Tu X, Yang K, et al. Tonic prime-boost of STING signalling mediates Niemann-Pick disease type C. Nature. 2021 Aug;596(7873):570–575. PMID: 34290407.
- Lv H, Zhu C, Wei W, et al. Enhanced Keap1-Nrf2/Trx-1 axis by daphnetin protects against oxidative stress-driven hepatotoxicity via inhibiting ASK1/JNK and Txnip/NLRP3 inflammasome activation. Phytomedicine. 2020 Jun;71:153241. PMID: 32454347.
- Cheng YC, Chu LW, Chen JY, et al. Loganin attenuates high glucose-induced schwann cells pyroptosis by inhibiting ROS generation and NLRP3 inflammasome activation. Cells. 2020 Aug;9(9):1948. PMID: 32842536.
- Ligeon LA, Pena-Francesch M, Vanoaica LD, et al. Oxidation inhibits autophagy protein deconjugation from phagosomes to sustain MHC class II restricted antigen presentation. Nat Commun. 2021 Mar;12(1):1508. PMID: 33686057.
- Zhou B, Liu J, Kang R, et al. Ferroptosis is a type of autophagy-dependent cell death. Semin Cancer Biol. 2020 Nov;66:89–100. PMID: 30880243.
- Han C, Liu Y, Dai R, et al. Ferroptosis and its potential role in human diseases. Front Pharmacol. 2020 Mar;11:239. PMID: 32256352.
- Chen M, Xu H. Parainflammation, chronic inflammation, and age-related macular degeneration. PMID: 26292978. J Leukoc Biol. 2015 Nov;98(5):713–725.
- Shang P, Stepicheva N, Teel K, et al. ßA3/A1-crystallin regulates apical polarity and EGFR endocytosis in retinal pigmented epithelial cells. Commun Biol. 2021 Jul;4(1):850. PMID: 34239035.
- Chothe PP, Gnana-Prakasam JP, Ananth S, et al. Transport of hepcidin, an iron-regulatory peptide hormone, into retinal pigment epithelial cells via oligopeptide transporters and its relevance to iron homeostasis. Biochem Biophys Res Commun. 2011 Feb;405(2):244–249. PMID: 21219868.
- Liddelow SA, Guttenplan KA, Clarke LE, et al. Neurotoxic reactive astrocytes are induced by activated microglia. Nature. 2017 Jan;541(7638):481–487. PMID: 28099414.
- Sweigard JH, Cashman SM, Kumar-Singh R. Adenovirus vectors targeting distinct cell types in the retina. PMID: 19892875. Invest Ophthalmol Vis Sci. 2010 Apr;51(4):2219–2228.
- Ghosh S, Liu H, Yazdankhah M, et al. ßA1-crystallin regulates glucose metabolism and mitochondrial function in mouse retinal astrocytes by modulating PTP1B activity. Commun Biol. 2021 Feb;4(1):248. PMID: 33627831.
- Bolte S, Cordelières FP. A guided tour into subcellular colocalization analysis in light microscopy. PMID: 17210054. J Microsc. 2006 Dec;224(Pt 3):213–232.
- Hao Y, Hao S, Andersen-Nissen E, et al. Integrated analysis of multimodal single-cell data. Cell. 2021 Jun;184(13):3573–3587.e29. PMID: 34062119.
- Yazdankhah M, Ghosh S, Shang P, et al. BNIP3L-mediated mitophagy is required for mitochondrial remodeling during the differentiation of optic nerve oligodendrocytes. Autophagy. 2021 Oct;17(10):3140–3159. PMID: 33404293.
- Pengo N, Agrotis A, Prak K, et al. A reversible phospho-switch mediated by ULK1 regulates the activity of autophagy protease ATG4B. Nat Commun. 2017 Aug;8(1):294. PMID: 28821708.
- Ghosh S, Choudhury S, Chowdhury O, et al. Inflammation-induced behavioral changes is driven by alterations in Nrf2-dependent apoptosis and autophagy in mouse hippocampus: role of fluoxetine. Cell Signal. 2020 Apr;68:109521. PMID: 31881324.