
ABSTRACT
Macroautophagy/autophagy is a cellular and energy homeostatic mechanism that contributes to maintain the number of primordial follicles, germ cell survival, and anti-ovarian aging. However, it remains unknown whether autophagy in granulosa cells affects oocyte maturation. Here, we show a clear tendency of reduced autophagy level in human granulosa cells from women of advanced maternal age, implying a potential negative correlation between autophagy levels and oocyte quality. We therefore established a co-culture system and show that either pharmacological inhibition or genetic ablation of autophagy in granulosa cells negatively affect oocyte quality and fertilization ability. Moreover, our metabolomics analysis indicates that the adverse impact of autophagy impairment on oocyte quality is mediated by downregulated citrate levels, while exogenous supplementation of citrate can significantly restore the oocyte maturation. Mechanistically, we found that ACLY (ATP citrate lyase), which is a crucial enzyme catalyzing the cleavage of citrate, was preferentially associated with K63-linked ubiquitin chains and recognized by the autophagy receptor protein SQSTM1/p62 for selective autophagic degradation. In human follicles, the autophagy level in granulosa cells was downregulated with maternal aging, accompanied by decreased citrate in the follicular fluid, implying a potential correlation between citrate metabolism and oocyte quality. We also show that elevated citrate levels in porcine follicular fluid promote oocyte maturation. Collectively, our data reveal that autophagy in granulosa cells is a beneficial mechanism to maintain a certain degree of citrate by selectively targeting ACLY during oocyte maturation.
Abbreviations: 3-MA: 3-methyladenine; ACLY: ATP citrate lyase; AMA: advanced maternal age; CG: cortical granule; CHX: cycloheximide; CQ: chloroquine; CS: citrate synthase; COCs: cumulus-oocyte-complexes; GCM: granulosa cell monolayer; GV: germinal vesicle; MII: metaphase II stage of meiosis; PB1: first polar body; ROS: reactive oxygen species; shRNA: small hairpin RNA; SQSTM1/p62: sequestosome 1; TCA: tricarboxylic acid; TOMM20/TOM20: translocase of outer mitochondrial membrane 20; UBA: ubiquitin-associated domain; Ub: ubiquitin; WT: wild-type
Introduction
The impact of oocyte quality on reproductive outcomes is well established. Whereas assisted reproductive technologies (ART) have been developed continuously over the past decades, the fundamental issue of oocyte quality decline with advanced maternal age (AMA) still remains unresolved [Citation1,Citation2]. Due to declined oocyte quality, pregnant women of AMA are experiencing a dramatic increase in miscarriage, embryonic lethality, and congenital defects [Citation3,Citation4]. In agricultural animals like the pig, low rates of pronuclear formation and high incidences of polyspermy are commonly occurring in in vitro matured oocytes [Citation5]. The probable reason relates to oocyte in vivo maturation that is a complex and rigorous physiological process in which multiple factors and multiple cells play a role, that cannot be adequately imitated in vitro. Therefore, revealing the basic molecular mechanisms during oocyte maturation has become a key task to improve oocyte quality and subsequent embryonic development, which can greatly improve its application in both human clinical medicine and agricultural animal reproduction.
For an oocyte to optimally progress through the dynamic processes of nuclear and cytoplasmic maturation, enormous energy from various substrates is required, including glucose, amino acids and lipids [Citation6,Citation7]. Among these, the glucose metabolism pattern is most important but still needs further exploration. Since oocytes have a limited capacity to utilize glucose due to lack of glucose transport receptors [Citation8], cumulus granulosa cells serve as the nurse cells to transfer primary energy substrates through monocarboxylate transporters [Citation9]. Recently, a report indicated that cumulus granulosa cells could promote oocyte maturation through the pentose phosphate pathway [Citation10], strengthening the diversity and complexity of glucose metabolism during oocyte maturation. Notably, the fully grown oocytes are able to stimulate and activate the glycolysis and tricarboxylic acid (TCA) cycle in granulosa cells [Citation11], implying that the bidirectional regulatory mechanism of glucose metabolism between granulosa cells and the oocyte is essential for normal follicular development and oocyte maturation.
Autophagy is a biological process that plays a housekeeping role in eukaryotic cells for the degradation and recycling of biological macromolecules or damaged organelles [Citation12]. Extensive studies on autophagy regulation in reproductive capacity maintenance highlight the contribution of protecting against the exogenous stresses [Citation13], preserving primary follicle numbers [Citation14], regulating the pregnancy process by hormone synthesis participation [Citation15], and improving age-related diminished ovary reserve [Citation16]. Recently, the identification of autophagy receptors which have high affinity to the special cargos for lysosome degradation has accelerated our understanding of selective autophagy. Importantly, growing evidences suggest that SQSTM1/p62, a selective autophagy adaptor protein, can recognize the crucial glycolytic enzyme for the process of selective degradation [Citation17] and is essential for maintaining female fertility [Citation18]. However, the involvement of autophagy regulation in oocyte maturation through glucose metabolism is still little known.
In the present study, we demonstrate that the autophagy level is potentially correlated with reproductive aging, which is a major risk factor for declined oocyte quality. We established a co-culture system and provide evidence that granulosa cell autophagy can regulate the proteostasis of ACLY (ATP citrate lyase), which in turn maintains the homeostasis of citrate and provides metabolism substrates for oocyte meiotic resumption, and further improving oocyte maturation and embryo developmental potential.
Results
The autophagy level was reduced in human granulosa cells from women with AMA
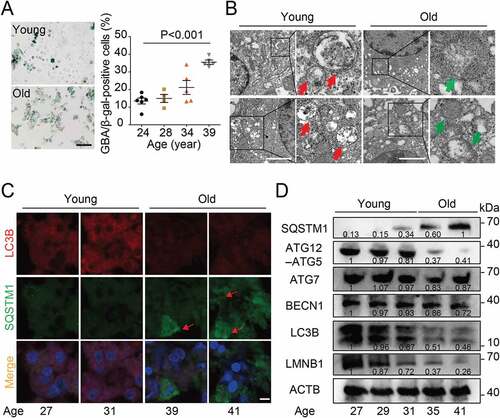
Our previous study showed that advanced maternal age was accompanied by a significant reduction in clinical pregnancy and live birth rates, indicative of a downregulation of oocyte quality with AMA [Citation19]. To investigate the involvement of autophagy regulation in oocyte quality, we collected granulosa cells from women of different ages and compared the autophagy levels between young and older individuals. By immunostaining, cells obtained from women with AMA showed increased activity of the cellular senescence marker lysosomal GBA/β-galactosidase [Citation20] and this trend was particularly pronounced in women over 39 years of age ()). Autophagosomes and mitochondria were measured by using transmission electron microscopy (TEM), and the results showed that granulosa cells in advanced-age women possessed less autophagosomes but more swollen mitochondria (), indicating that the autophagy level in granulosa cells was downregulated with maternal aging. Immunofluorescence staining showed reduced levels of the autophagy marker protein MAP1LC3B/LC3B in aged granulosa cells, while the autophagy adaptor protein SQSTM1 was accumulated ()). Consistently, western blot results showed that the ratio of LC3-II to LC3-I expression was decreased and the levels of SQSTM1 was upregulated in aged granulosa cells, accompanied by downregulation of the cellular senescence marker LMNB1 (lamin B1) ()). We also demonstrated that ATG12–ATG5, which is a canonical autophagy marker, showed a suppressed expression in granulosa cells during reproductive aging ()). These results indicate that the autophagy level was reduced in human granulosa cells from women with AMA.
Figure 1. The autophagy level was reduced in human granulosa cells from women with AMA. (A) Senescence-associated GBA/β-galactosidase (SA-GBA/β-gal) staining was performed in granulosa cells from young and old groups. Means and S.E.M of SA-GBA/β-gal-positive cells from at least three independent experiments are indicated. (B) Transmission Electron Microscopy results showed the change in autophagosome number and mitochondrial morphology. Red arrowheads represent autophagosome, and green arrowheads represent mitochondria. Scale bar: 1 μm. (C) Immunofluorescence staining of autophagy markers in ovarian granulosa cells from young and old groups. The accumulation of SQSTM1 is marked in red. Scale bar: 20 μm. (D) Western blot analysis of autophagy related protein expression in ovarian granulosa cells from young and old groups. Normalized quantification of mean gray intensity was determined from 3 separate experiments.
Blocking the autophagy in the granulosa cells decreased the quality of oocytes
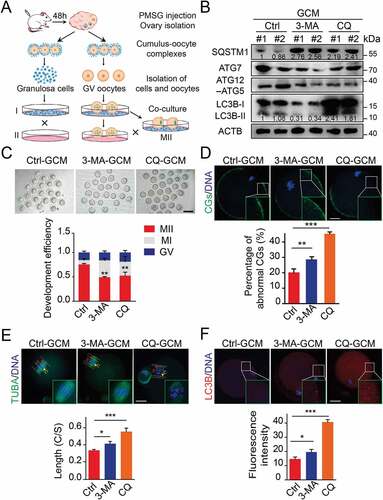
To further specify the effects of autophagy on oocyte maturation, we established a cumulus granulosa cell dependent oocyte maturation system as previously reported [Citation21]. With this system, pharmacological inhibition or gene manipulation can be easily performed in cumulus granulosa cell monolayers (GCM) without affecting the growth condition of oocytes ()). We indicated that more than 80% of the denuded oocytes co-cultured with GCM were matured, as judged by expulsion of the first polar body (PB1), while none of the denuded oocytes cultured without GCM were matured. Therefore, the co-culture system was used in all further experiments. We first introduced the autophagy inhibitors chloroquine (CQ) and 3-methyladenine (3-MA). Western blot results showed that 3-MA treatment resulted in a decreased LC3 conversion and significant increase in SQSTM1 protein level. CQ treatment can inhibit the degradation of autolysosomes, thereby blocking the autophagic degradation of LC3 and SQSTM1 proteins. The results reflected that autophagy was inhibited at the early stage by 3-MA treatment or at the late stage by CQ supplementation ()). Furthermore, we found that the GV oocytes co-cultured with inhibitor-treated GCM exhibited decreased maturation efficiency when compared to oocytes co-cultured with control GCM, as indicated with decreased percentages of M II oocytes ()). Moreover, these oocytes displayed abnormal cortical granule (CG) distribution, lost their normal localization because of abnormal migration of CGs and weak signals in oocytes co-cultured with autophagy-impaired granulosa cells ()). Since meiotic arrest is mainly due to defects in spindle/chromosome structure, the spindle was further detected. In contrast to control oocytes, which have a standard morphology of barrel-shaped spindles and well-aligned chromosomes, a significantly increased incidence of abnormal spindle/chromosome structure was observed in oocytes cultured with autophagy-deficiency granulosa cells ()). To quantify difference in oocyte chromosome alignment, we measured the width of the spindle intermediate plate and the length of the spindle. The middle plate of oocytes co-cultured with autophagy-inhibited groups was significantly wider than that of control oocytes ()). Interestingly, we found that the expression of autophagy marker LC3B in oocytes was significantly enhanced ()), indicating that autophagy impairment in granulosa cells might trigger compensatory response mechanisms in the oocytes. Taken together, these observations suggest that autophagy in granulosa cells effectively improves the oocyte maturation rate and oocyte quality, accompanied by correct CGs arrangement and spindle/chromosome structure.
Figure 2. Blocking the autophagy in the granulosa cell decreased the quality of oocyte. (A) The sketch of experimental design for co-cultures. (B) Western blot analysis of autophagy related protein expression in the cells subjected to 3-MA and CQ treatment. Each lane corresponds to an independent biological sample. Normalized quantification of mean gray intensity was determined from 3 separate experiments. (C) Representative images of matured oocytes cultured in vitro from control (n = 30), 3-MA (n = 35), and CQ (n = 35) treatment cumulus granulosa cells. The rate of PB1 was recorded in three independent biological replicates. Scale bar: 80 mm. (D, E, and F) Representative images of cortical granule (CG) distribution (D), meiotic spindle and chromosomes (E), and autophagosomes (F) attachment in control, 3-MA, and CQ treatment groups. Oocytes were immunoassayed with indicated antibody to show the CG, spindles, and LC3-II, respectively. The rate of mis-localized CGs (n = 11) (D), the thickness of spindle middle plate (n = 11). C indicates maximal span of chromosomes; S indicates maximal spindle lengths (E), and the fluorescence intensity of LC3-II (n = 8) (F) were recorded in control, 3-MA, and CQ treated groups. Scale bar: 20 μm. Data in (D), (E) and (F) are presented as mean percentage (mean ± SEM) of at least three independent experiments. *p < 0.05, **p < 0.01, ***p < 0.001 by unpaired two-tailed Student’s t test.
Atg5-mediated autophagy promotes oocyte maturation and embryonic development
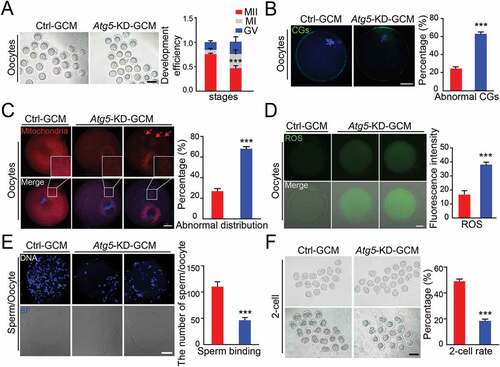
To further elucidate the role of granulosa cell autophagy in oocyte maturation, we used a short hairpin RNA (shRNA) approach to silence the expression of autophagy-related genes Atg5, which was highly correlated with reproductive aging ()). Results demonstrated that knockdown of Atg5 was accompanied by a decelerated LC3 conversion (Fig. S1A) and a significant accumulation of the SQSTM1 (Fig. S1A and S1B), indicating a functional block in the autophagy process. In line with the results shown in maternally aged human granulosa cells ()), we also observed that Atg5 knockdown GCM exhibited a cellular senescence phenotype, as suggested by a decreased proliferation ability (Fig. S1C), upregulated cell apoptosis (Fig. S1D), induced the accumulation of dysfunctional mitochondria (Fig. S1E), and increased GBA/β-galactosidase activity (Fig. S1F). When co-culturing knockdown GCM with the GV oocytes, we observed less than 50% of the oocytes displayed PB1 extrusion ()). Correspondingly, more than 60% of oocytes co-cultured with Atg5 knockdown GCM showed incorrect CGs localization, such as aberrant distribution or appearance of signals in the CG-free domain ()). Since we observed a compensation mechanism in oocytes when the autophagy level was inhibited in GCM ()), we speculated that the energy supply in oocytes may be insufficient. Expectedly, mitochondrial abundance was significantly reduced, a great number of mitochondria partially lost their location around chromosomes and presented aggregated distribution in the cytoplasm. Quantitatively, more than 60% of the oocytes exhibited abnormal distribution of mitochondria ()). Fluorescence imaging and intensity measurements showed that much stronger ROS signals appeared in oocytes co-cultured with autophagy-impaired granulosa cells compared to control oocytes ()). Because abnormal CG distribution resulted in a high frequency of abnormal fertilization, we further performed a sperm-oocyte binding assay to determine the oocyte developmental potential. Compared with the control, the oocytes co-cultured with the Atg5 knockdown GCM showed a significantly lower number of sperm with zona binding ()). With further cultivation of the oocytes after fertilization, only 17% could develop to the 2-cell stage, which was significantly lower than that of the controls ()). Therefore, we conclude that Atg5-mediated autophagy in granulosa cells exerts a favorable role in oocyte maturation, and further affects the developmental competence by maintaining the stabilization of cortical granules as well as facilitating sperm-oocyte binding.
Figure 3. Atg5-mediated cell autophagy promotes oocyte maturation and improves embryo development. (A) Representative images of matured oocytes co-cultured in control and Atg5 knockdown cumulus granulosa cells. The rate of PB1 was recorded from three independent biological replicates to indicate oocyte maturation, n = 40 oocytes in each group. Scale bar: 80 mm. (B, C, and D) Representative images of CG distribution (B), mitochondrial distribution, aggregated mitochondrial in the cytoplasm is marked in red (C), and ROS levels (D) stained with indicated antibody in control and Atg5 knockdown groups. Scale bar: 20 μm. (E) Representative images of sperm binding to the zona pellucida of matured oocytes co-cultured in control and Atg5 knockdown cumulus granulosa cells. The sperm binding to the surface of the zona pellucida surrounding oocytes were counted from control and Atg5 knockdown groups. Scale bar: 20 μm. (F) Representative images of early embryos developed from control (n = 16; n = 20) and Atg5 knockdown (n = 16; n = 23) groups and the rate of 2 cell embryos was recorded. The rate of 2 cell was recorded from three independent biological replicates. Scale bar: 50 μm. The data in (B), (C), (D), and (E) are presented as mean percentage (mean ± SEM) of at least three independent experiments, n = 30 oocytes in each group. ***p < 0.001 by unpaired two-tailed Student’s t test.
Autophagy is required for the regulation of metabolic homeostasis of granulosa cells
To investigate changes in gene expression caused by Atg5 knockdown, we performed RNA sequencing (RNA-seq) in Atg5 knockdown and control GCM. Principal-component analysis (PCA) showed a clear separation of Atg5 knockdown and control GCM (Fig. S2A), indicating distinct transcriptome and expression patterns between these two populations. Analysis of differentially expressed genes (DEGs) revealed that 281 genes were downregulated, while 332 genes were up-regulated in Atg5 knockdown GCM compared to the control (Fig. S2B). Gene ontology (GO) analysis showed that downregulated genes were enriched in the energy metabolism regulation, such as transmembrane receptor proteins and transmembrane transport of glucose (Fig. S2C). Kyoto Encyclopedia of Genes and Genomes (KEGG) analysis revealed that Atg5 knockdown affected the activity of protein digestion and absorption pathways (Fig. S2E). Notably, the upregulated differentially expressed genes in Atg5 knockdown granulosa cells were also enriched in genes associated with cellular senescence (Fig. S2D and S2F), consistent with the high GBA/β-galactosidase activity in Atg5 knockdown GCM. Collectively, our results showed that Atg5 knockdown in GCM led to global changes in gene expression, which might be an important cause for impaired oocyte maturation. In addition, the transcriptome in Atg5 knockdown GCM displayed a trend for dysregulation of metabolic homeostasis and protein homeostasis.
Citrate supplementation restores the quality of oocytes co-cultured with autophagy-impaired granulosa cells
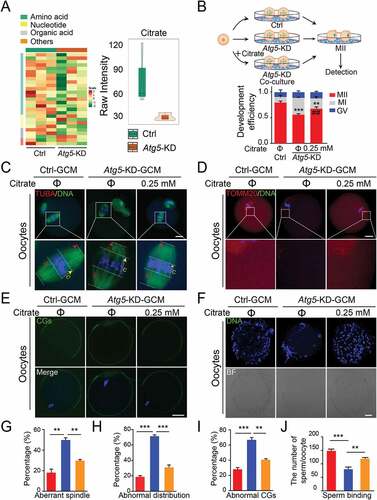
Given that granulosa cells are specialized cells to support oocyte development by providing substrates for energy production, we asked whether autophagy affects oocyte maturation through regulating energy metabolism. Because the co-culture media only contains 5.6 mM glucose, which can barely be catalyzed by the oocyte, we therefore performed cell culture metabolomics analysis by LC-MS/MS under co-culture system conditions to specifically elucidate the level of glucose metabolites released from granulosa cells. The metabolomics data across three biological replicates of each individual sample were highly correlated (Spearman’s correlation > 0.99; Fig. S3A). Among 27 identified metabolites of carbohydrate metabolism, 14 differential metabolites were observed based on a variable importance in projection (VIP) analysis (VIP ≥ 1.00) (Fig. S3B; Table S3). We grouped metabolites into four categories (amino acid, nucleotide, organic acid and others), and the majority of which were amino acids and their derivatives, indicating that the reduction in autophagic flux affected the supply of anabolic precursors for TCA cycle (), left panel). After ranking by fold change, we found that the most significantly differential metabolite was citrate (log2fc = −2.0905) (), right panel). We further examined the levels of citrate and other TCA intermediates, and the data showed that the levels of citrate and α-KG were significantly decreased after Atg5 knockdown (Fig. S3C and S3D), in line with the previous report showing that the citrate was required for oocyte maturation and its concentration increased more than five-fold in matured oocytes [Citation22]. To characterize whether oocyte maturation was regulated by autophagy through the citrate pathway, we assessed the oocyte maturation by exogenous citrate supplementation (), left panel). As expected, we found that the decreased percentage of M II oocytes caused by Atg5 knockdown was significantly rescued upon citrate supplementation (), right panel). In addition, citrate supplementation significantly improved the oocyte quality, as suggested by restored spindle morphology and the thickness of the spindle middle plate () and (G)), increased the proportion of mitochondrial abundance and decreased mis-localized mitochondria () and (4H)). Correspondingly, the cortical granule distribution was also significantly improved upon citrate supplementation () and (I)), accompanied by enhanced sperm-oocyte binding capacity () and (J)). Taken together, our study reveals that autophagy regulates oocyte maturation through the citrate metabolism pathway.
Figure 4. Citrate supplementation improves the quality of oocytes. (A) Heatmap illustration displaying cell culture metabolites of control and Atg5 knockdown groups, classified by metabolic pathways. (Right panel) Violin plots showing the metabolomic level of citrate in control and Atg5 knockdown groups. Mean Raw intensity are indicated by the numerical value. (B) Schematic protocols for citrate supplementation experiment. (Right panel) The rate of PB1 was recorded in control (n = 30), Atg5 knockdown (n = 40), and Atg5 knockdown + citrate (n = 45) groups after maturation for 15 h in vitro, Data are presented as mean percentage (mean ± SEM) of at least three independent experiments. (C, D, and E) Representative images of meiotic spindle and chromosomes (C), mitochondrial distribution (D), and CG distribution (E) in control, Atg5 knockdown and Atg5 knockdown + citrate groups. Oocytes were immunoassayed with indicated antibody to show the spindle, C indicates maximal span of chromosomes; S indicates maximal spindle lengths (C), TOMM20 (D), and CG (E), respectively. Scale bar: 20 μm. (f) Representative images of sperm binding to the zona pellucida of matured oocytes co-cultured in control, Atg5 knockdown and Atg5 knockdown + citrate groups. Scale bar: 20 μm. (G, H, I and J) The rate of aberrant spindles (G), abnormal mitochondria distribution (H), mis-localized CGs (I) and the number of sperm binding to the surface of the zona pellucida surrounding oocytes were recorded in groups, respectively. Data in (G), (H), (I), and (J) are presented as mean percentage (mean ± SEM) of at least three independent experiments. **p < 0. 01, ***p < 0.001 by unpaired two-tailed Student’s t test.
Metabolic synthesis of citrate by granulosa cells is essential for oocyte maturation
The balance of the citrate efflux is regulated by CS (citrate synthase) and ACLY [Citation23]. To verify that the citrate metabolic synthesis by granulosa cells is directly responsible for oocyte maturation, we inhibited citrate metabolic synthesis by shRNA-mediated Cs knockdown. Metabolite assays showed that the level of citrate was reduced in the culture media of Cs knockdown granulosa cells (Fig. S4A). Knockdown of Cs significantly reduced the PB1 extrusion of co-cultured oocytes, while citrate supplementations resulted in a significant restoration of oocyte maturation (Fig. S4B), reflecting the important role of citrate synthesis by granulosa cells in promoting oocyte maturation. In addition, compared with oocytes co-cultured with Atg5 knockdown GCM, which showed an upregulation of autophagy levels, a reduced level of LC3B was observed upon citrate supplementation (Fig. S4C). Accordingly, the mitochondrial marker TOMM20 also showed a better colocalization with the spindle, demonstrating the recovery of energy supply upon citrate supplementation (Fig. S4D). Together, these findings indicate the requirement of citrate synthesis in granulosa cells for oocyte maturation.
Autophagic degradation of ACLY maintains citrate concentration
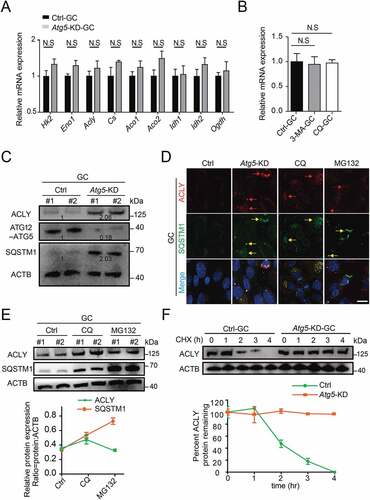
In contrast to the function of Cs, which catalyzes the synthesis of citrate to fuel TCA, ACLY promotes the degradation of efflux citrate. Given that autophagy is a protein degradation mechanism, we asked whether ACLY could be regulated by autophagy at the post-translational level. As expected, the mRNA levels of key enzymes of TCA that may regulate citrate homeostasis were not altered ()). In contrast, accompanied by an accumulated SQSTM1 expression, the protein expression of ACLY was significantly increased in granulosa cells upon Atg5 knockdown ()). Lysosomes and proteasomes are two major pathways for protein degradation. With the treatment of lysosome inhibitor CQ or proteasome inhibitor MG132, we found that Atg5 knockdown or CQ treated granulosa cells exhibited abnormal ACLY accumulation compared with the control, along with a significant colocalization with SQSTM1. However, there was no accumulation of ACLY in MG132 treated cells, even though significant SQSTM1 accumulation was detected ()). These results suggested that ACLY degradation was mediated by the autophagy-lysosome pathway, but not the proteasome pathway. To further monitor the protein stability of ACLY, cycloheximide (CHX) was used to inhibit protein translation. In contrast to the control, which showed a 50% decrease at 2 h after CHX treatment, the ACLY had a prolonged protein half-life upon Atg5 knockdown ()), suggesting the ACLY degradation was impaired. Correspondingly, we found that the citrate concentration was significantly reduced in Atg5 knockdown GCM. Further knockdown of ACLY could largely rescue the citrate level (Fig. S4E and S4F). Together, these data reveal that Atg5-mediated autophagy could maintain the proteostasis of ACLY and achieve the homeostasis of citrate through the autophagic degradation pathway.
Figure 5. Atg5-mediated autophagy targets ACLY for lysosomal degradation. (A) The mRNA levels of TCA cycle-related genes in the control and Atg5 knockdown cumulus granulosa cells. The values are presented as the means ± SEM, n = 3. N.S represents not significant. (B) The levels of Acly mRNA in the granulosa cells subjected to 3-MA and CQ treatment. The values are presented as the means ± SEM, n = 3. N.S represents not significant. (C) Depletion of the autophagy essential gene Atg5 affects the expression levels of ACLY- SQSTM1 complex. Each lane corresponds to an independent biological sample. Normalized quantification of mean gray intensity was determined from 3 separate experiments. (D) The expression and subcellular location of ACLY and SQSTM1. Granulosa cells co-transfected with or without Atg5 shRNA were treated as indicated inhibitors for 6 h. Confocal images of transfected cells representing the colocalization of ACLY with SQSTM1. ACLY are marked in red, and SQSTM1 are marked in yellow. The merged images and relative arrows reveal the colocalization. Scale bar: 10 μm. (E) Autophagy promotes the degradation of ACLY. Immunoblot analysis of ACLY in granulosa cells with CQ (50 μM) or MG132 (10 μM) treatment for 6 h. Quantification of protein by calculating the ratio of ACLY:SQSTM1 with ACTB. Error bars indicate the SD (n = 3). Each lane corresponds to an independent biological sample. (F) ACLY is stabilized in Atg5 knockdown cells. Granulosa cells silenced with control, Atg5 shRNA were then treated with CHX for the indicated time. The percentage of remaining ACLY protein was calculated from the intensity of CHX treatment immunoblots, measured in three biological replicates.
K63-linked polyubiquitination of ACLY facilitates its selective autophagic degradation via interacting with SQSTM1
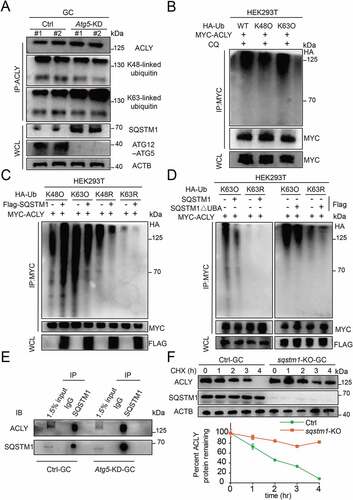
Previous reports indicated that the ubiquitination of cargos is the most prevalent autophagy-targeting signal [Citation24,Citation25]. We next explored the possibility that ACLY degradation is mediated by ubiquitination. We demonstrated that ACLY could be marked by both lysine 48 (K48)- and lysine 63 (K63)-linked polyubiquitin chains ()). However, Atg5 knockdown did not result in an accumulation of the K48-linked polyubiquitinated ACLY, while K63-linked polyubiquitination of endogenous ACLY was significantly upregulated ()). Accordingly, a similar accumulation trend was also observed when autophagy was inhibited upon CQ treatment, but remained upon MG132 treatment (Fig. S5A and S5B). These observations demonstrated that ACLY with K63-linked polyubiquitin chains was targeted for autophagy-dependent degradation. To further ascertain which kind of ubiquitin chain targets ACLY for degradation, we performed ubiquitination assays by utilizing K63-only, K48-only ubiquitin in 293 T cells, and found that both K63-linked ubiquitin chains and K48-linked ubiquitin chains interacted with ACLY. Consistently, the accumulation of K63-ubiquintinated ACLY was observed upon autophagy inhibition by CQ ()). These results suggested that ACLY ubiquitination involved mixed linkage specificity, with a preference for K63-linked polyubiquitin chains. We next determined whether SQSTM1 could bind K63-ubiquintinated ACLY and promote its degradation. With K63-linked ubiquitin chains, ubiquitination of ACLY was significantly downregulated by overexpression of SQSTM1. In contrast, upon introducing K63 mutant variant, we did not observe either ACLY binding or ACLY degradation ()), indicating the positive effect of SQSTM1 for the degradation of K63-linked polyubiquitinated ACLY. Given that SQSTM1 recognizes and interacts with ubiquitinated proteins through its ubiquitin binding domain (UBA) [Citation26], we therefore constructed a SQSTM1ΔUBA variant, which could no longer recognize the ubiquitinated ACLY protein; nor could this variant promote ACLY degradation. As expected, only WT SQSTM1 was able to degrade K63-linked ubiquitinated ACLY, while SQSTM1 lacking the UBA domain lost its function to degrade ubiquitinated ACLY ()), further underscoring the importance of SQSTM1 for ACLY degradation. Similarity, endogenous co-immunoprecipitation (IP) analysis in granulosa cells also confirmed the partnership between SQSTM1 and ACLY () and S5C). Importantly, SQSTM1 depletion completely prevented the degradation of ACLY, and the extension of ACLY half-life could be significantly shortened by SQSTM1 overexpression () and S5D). Correspondingly, we found that the citrate concentration was significantly reduced in sqstm1 knockout granulosa cells and accompanied by a significant increase in ACLY activity. The citrate levels were largely rescued by further overexpression of WT SQSTM1 but not SQSTM1ΔUBA variants (Fig. S5E and S5F). Taken together, these results confirm that SQSTM1 connects K63-polyubiquitinated ACLY through its UBA domain for the process of selective autophagic degradation, further achieving the homeostasis of citrate.
Figure 6. K63-linked polyubiquitination of ACLY facilitates its selective autophagic degradation by interacting with SQSTM1. (A) ACLY with Lys63-linked poly-ubiquitin chains were stabilized after inhibition of autophagy. Granulosa cells were co-transfected with or without Atg5 shRNA, and the cell lysates were immunoprecipitated to affinity isolate the endogenous ACLY protein, and the polyubiquitinated linkage site was detected using indicated antibodies. Each lane corresponds to an independent biological sample. (B) ACLY is preferentially tagged by Lys63-linked poly-ubiquitin chains. HEK293T cells were co-transfected with plasmids expressing MYC-ACLY together with either wild-type, Lys63, or Lys48 HA-Ub. (C) Ubiquitination levels of ACLY after SQSTM1 overexpression. HEK293T cells were transfected with MYC-ACLY along with the indicated plasmids. 24 h after transfection, immunoprecipitation and immunoblot analysis were performed with the indicated antibodies. (D) SQSTM1 targets K63-linked ACLY for degradation by its UBA domain. Granulosa cells were transfected with MYC-tagged ACLY and FLAG-tagged wild-type SQSTM1 or its UBA domain deletion variant. (E) SQSTM1 interacts with ACLY. Endogenous SQSTM1 was immunoprecipitated with an antibody against SQSTM1. ACLY was detected by western blotting. (F) ACLY is stabilized in sqstm1 knockout cells. Control or CRISPR/Cas9-mediated sqstm1 KO granulosa cells were then treated with CHX for the indicated time. The percentage of remaining ACLY protein was calculated from the intensity of CHX treatment immunoblots, measured in three biological replicates.
Elevated citrate levels in mammalian follicular fluid promote oocyte maturation
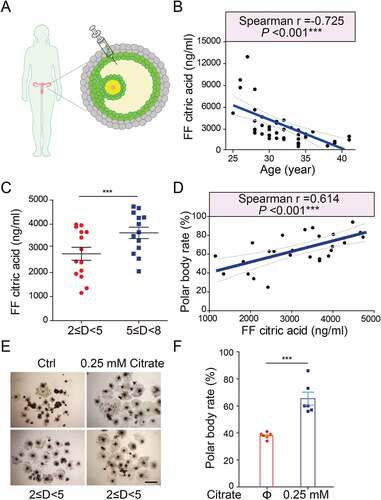
Because our proceeding results showed downregulated autophagy levels in human granulosa cells of aged females (), we reasoned that the citrate level regulated by autophagy might serve as a critical and clinically relevant biomarker for human fertility. To test this possibility, we assessed the citrate levels in human follicular fluid from healthy women ranging from 25 to 41 years old ()), since follicular fluid provides a very important microenvironment for the intercellular communication between granulosa cells and oocytes. We observed a marked suppression of citrate levels in human follicular fluid correlated with the age ()). In pigs, we also revealed that the follicular citrate concentrations varied in different sizes of follicles, and the follicles with large diameters showed higher follicular citrate concentrations ()). To examine whether the citrate levels in porcine follicular fluid correlated with oocyte maturation, both the citrate level and the oocyte maturation efficiency were measured in different sizes of follicles, respectively. As expected, porcine follicles with high citrate levels had a relevantly higher oocyte maturation rate compared to those with low citrate levels (); Table S4). Moreover, citrate supplementation significantly elevated the maturation rate of oocytes released from small follicles ()). Altogether, these results indicate that citrate concentrations in mammalian follicular fluid are positively correlated with follicular development and oocyte maturation.
Figure 7. Elevated citrate levels in mammalian follicular fluid promote oocyte maturation. (A) A schematic showing the procedure for human follicular fluid (hFF) isolation. (B) The negative correlation of citric acid levels with age in hFF. n = 42. (C) The porcine follicular fluid (pFF) citric acid levels in different sizes of porcine follicles. n = 27. D indicated diameter of follicle. Data are expressed as mean ±SEM. ***p < 0.001. (D) The positive correlation of citric acid levels with porcine oocyte maturation. n = 27. Correlation and corresponding statistical significance were calculated based on Spearman’s rank correlation coefficient (R) in R language. (E) Representative images of porcine oocytes in vitro maturation. (F) Average polar body rate of porcine oocytes in control (n = 6) and citrate treated groups (n = 6). Data are expressed as mean ±SEM. ***p < 0.001. The lines in (b) and (d) indicates the 0.95 confidence interval around smooth. ***p < 0.001 by unpaired two-tailed Student’s t test with R language.
Discussion
In this study, we propose a regulatory relationship between granulosa cell autophagy and oocyte quality, and suggest a novel mechanism during oocyte maturation from the perspective of citrate metabolism. This study mainly provides three notable contributions. First, we elucidated that the level of autophagy in granulosa cells was negatively correlated with reproductive aging (). Second, autophagy in granulosa cells promotes oocyte maturation by regulating the proteostasis of ACLY, which in turn maintains the citrate level (). Third, the level of citrate in human follicular fluid was significantly reduced with age, which was closely associated with oocyte quality decline (). In addition, porcine follicles with higher citrate levels had a correspondingly higher oocyte maturation rate (). Together, our findings provide new insights into mammalian oocyte maturation and reveal a new diagnostic biomarker and potential therapeutic intervention for treatment of autophagy-deficient reproductive disorders.
Citrate is well-recognized for its role in the TCA cycle and a key precursor for de novo fatty acid synthesis [Citation27], and aberrant citrate activity also links to pathological and oncological conditions [Citation28,Citation29]. During oocyte maturation, the cumulus granulosa cells progress through glycolysis both for their own ATP production and to provide energy to the oocyte [Citation30], and the importance of upregulated citrate and other TCA cycle enzyme activities have been highlighted for generating the matured oocytes [Citation22]. Consistently, our study showed that reduced citrate metabolism due to autophagy depletion affected both nuclear and cytoplasmic maturation of oocytes. In particular, decreased mitochondrial abundance and increased mis-localized mitochondria, as well as upregulated autophagy levels in oocytes were observed (), )), indicating insufficient citrate levels mainly affects the metabolism of oocytes. Since the granulosa cells and oocytes were metabolically interdependent, there remain challenges to discriminate between which cells released a given metabolite. Here, we also demonstrated that the oocytes have limited capability to produce citrate, as the citrate level in granulosa cell-conditional medium cultured with oocytes (1357.72 ± 358.71 ng/ml) is not significantly changed compared to that of the conditional medium (1086.91 ± 155.44 ng/ml) (Fig. S6). In contrast, the medium of the granulosa cells co-cultured with oocytes (2131.13 ± 194.69 ng/ml, Fig. S4F) showed higher citrate levels compared to the cells-conditional medium cultured with oocytes, likely due to oocytes being able to further stimulate and activate the glycolysis and tricarboxylic acid (TCA) cycle in cumulus granulosa cells [Citation11]. Hence, our study for the first time suggests that the cumulus granulosa cell is a major supplier of citrate and the well-balanced citrate level is critical for oocyte maturation ( and S6).
To our knowledge, the maintenance of citrate homeostasis is mainly accomplished via two major pathways: (1) Citrate is formed by the condensation of oxaloacetate and acetyl-CoA in the CS reaction [Citation31], and (2) Cytoplasmic citrate released from mitochondria can be cleaved by ACLY, generating acetyl-CoA and oxaloacetate [Citation32]. To this end, we identified the upstream and downstream of citrate production and showed that both the two critical enzymes in granulosa cells have profound effects on oocyte maturation (Fig. S4). Knockdown of Cs significantly reduced the PB1 extrusion of co-cultured oocytes, reflecting the important role of citrate synthesis by granulosa cells in promoting oocyte maturation (Fig. S4B). Meanwhile, the inhibition of citrate cleavage by ACLY should lead to an increase in the citrate pool. Previous reports showed that inhibition of ACLY also effectively prevented the accumulation of citrate by facilitating citrate oxidation in the TCA cycle [Citation33], consistent with our result that inhibition of ACLY in Atg5 knockdown cells contributed to a moderate upregulation of citrate levels (Fig. S4F). Notably, more dysfunctional mitochondria were observed in autophagy-deficiency granulosa cells (Fig. S1E), and there exists the possibility that the reduced citrate synthesis may also be due to an impaired mitochondrial TCA cycle [Citation34]. Overall, our study provides novel insights into the physiological relationship between oocyte maturation and citrate homeostasis that is precisely regulated by selective autophagic degradation through a ubiquitination-mediated mechanism (). Moreover, our findings reveal a universal mechanism that a certain degree of citrate concentration in follicular fluid has a positive role in the maintenance of mammalian reproductive capacity ().
The molecular machinery for selective autophagy must ensure efficient recognition and sequestration of the cargo within autophagosomes [Citation35]. By excluding the possibility that autophagy regulates TCA enzymes at the transcriptional level ()), here we defined a novel protein-interacting mechanism that SQSTM1 could bind with ACLY at the post-translational level (). In support of the protein interaction, we also observed the coordinated expression and subcellular colocalization of SQSTM1 and ACLY ()), indicating the formation of SQSTM1-ACLY complex upon autophagy inhibition. Recently, a growing number of protein substrates for selective autophagy have been identified [Citation36,Citation37], and various degradation pathways are pointed out to reflect the essential role of SQSTM1 in the degradation of K63-ubiquitinated proteins. In this study, we showed that ACLY exhibited much stronger binding affinity to K63-linked polyubiquitinated ACLY and SQSTM1 facilitates the degradation of ACLY through its C-terminal UBA domain ()). Hence, our data provide new evidences of selective autophagic degradation of ACLY to maintain the citrate level, which helps to expand the role of selective autophagy in regulating metabolic enzymes.
Of note, our study provides several insights into the therapeutic treatment of ovulation disorders depending on the manipulation of citrate and autophagy. Our work provides a potential correlation between autophagy levels and advanced maternal aging (), which is mostly related to impaired quality of oocytes. Autophagy has been recognized as a protective regulator that functions principally through effects on apoptosis, cell cycle arrest, and DNA repair. A single-cell transcriptomic analysis revealed that the major cause of ovarian aging is increased oxidative stress by excessive reactive oxygen species (ROS) and inactivated anti-oxidative pathways [Citation38], which can result in part from weakened autophagy levels. In addition, we attribute oocyte maturation to the high citrate level in follicular fluid (). Several physiological and pathological links between citrate and fertility have been previously reported [Citation39,Citation40]. However, the regulation of citrate homeostasis and its associated biological and physiological significance are poorly understood. Here, we demonstrated the high coordination between citrate levels and oocyte maturation, and we investigated the underlying mechanism in citrate metabolism during oocyte maturation. This study can provide clinical strategies for patients who suffer from autophagy deficient-induced ovulation disorders or may benefit from treatment with a certain dose of citrate.
In summary, our investigation demonstrates that granulosa cells maintain citrate homeostasis by selective autophagy, contributing to improved oocyte maturation and embryonic developmental competence. These results reveal an interactive mechanism between granulosa cells and oocytes, and oocyte maturation may be attributed to selective autophagic degradation of ACLY and maintaining of the TCA cycle and lipid synthesis homeostasis (). Our data further explain the relationship between the energy requirements of oocyte meiosis resumption and the energy supply of granulosa cells, which not only help optimize the conditions for obtaining good quality gametes, but also provide a research rationale for targeted treatment of ovulation disorders. In addition, the mechanistic insights generated by this study can inform the predicted oocyte quality as well as defining better culture systems for human assisted reproduction.
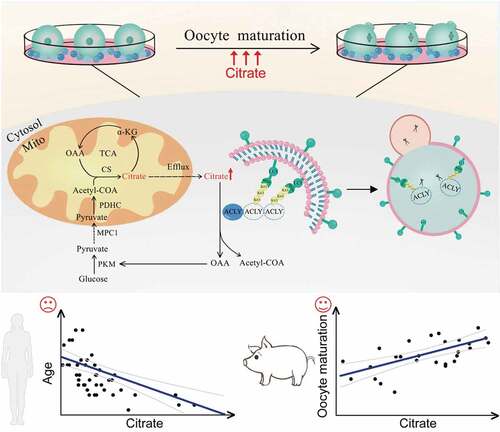
Figure 8. A proposed model for the selective autophagic degradation of ACLY and oocyte maturation regulated by citrate metabolism. During the oocyte maturation process, autophagy in granulosa cells was highly activated to selectively degrade K63-linked ubiquitinated ACLY in an SQSTM1-dependent manner, which further raises the concentration of citrate and promotes mouse oocyte maturation. The citrate concentration in human follicular fluid was negatively correlated with age, while porcine follicles with higher citrate levels had a correspondingly higher oocyte maturation rate.
Materials and methods
Ethics statement
Mice were housed under specific pathogen-free (SPF) conditions in The Experimental Animal Center of Huazhong Agricultural University. The animal procedures were approved by The Animal Care and Use Committee of Huazhong Agricultural University (HZAUMO-2019-073). The human study and all experimental procedures were approved by the Ethics Committee of Huangshi Central Hospital according to the Council for International Organizations of Medical Sciences. All subjects were recruited from Huangshi Central Hospital (2021-SZK-K008). Written informed consent was obtained from all participants. The human follicle fluid was collected from volunteers after egg retrieval.
Cell culture and transfection
Three-week-old Kun-Ming (KM) females (Vital River Laboratories, 202) injected intraperitoneally with 10 units of PMSG (Ningbo Hormone Product, China) were sacrificed, and the large follicles on the ovary were ruptured in M2 medium (Sigma, M7167) to release cumulus-oocyte-complexes (COCs). Primary cumulus granulosa cells were released from COCs mechanically by a small-bore pipette (Jitian Bio, BJ-40). Cells were harvested, washed, counted with the automatic cell analyzer (Cellometer, USA), and seeded in 96-well plates (2x10⁴ cells per well with 100 μl medium) in DMEM-F12 (Gibco, 11,330,032) supplemented with 10% fetal bovine serum (Vistech, SE200-ES), 1 μg/ml of β-estradiol (Sigma, E2758), 0.22 mM sodium pyruvate, 0.05 IU/ml FSH (Sigma, F2293), 0.05 IU/ml LH (Sigma, L5269), and 10 ng/ml EGF (Thermo Fisher Scientific, 53,003–018). Primary human granulosa cells (HGCs) were obtained from donors undergoing an assisted reproductive technology procedure. The HGCs were isolated from the follicular fluid using density gradient centrifugation at 376 x g for 30 min. Following centrifugation, the middle layer was collected and exposed to 0.2% hyaluronidase (Sigma, H4272) for 2 min, then washed twice with D10 medium (DMEM; [Gibco, 11,965–084] supplemented with 10% FBS, 1% antibiotics [Gibco, 15,070,063]) and the separated HGCs were used for subsequent detection. For HGCs culture, cells were seeded into 24-well plates in 1 mL D10 medium supplemented with 50% follicular fluid. Human embryonic kidney (HEK) 293 cells (Institute of Biochemistry and Cell Biology, China, GNHu17) were cultured in DMEM high-glucose medium with 10% FBS following previously reported protocols. Transfections were performed by using JetPRIME (Ployplus, 114–01) following the manufacturer’s instructions. The medium was replaced 6 h after transfection.
Chemical treatment
All chemicals used in this study were purchased from Sigma Aldrich. For autophagy inhibition, 3-MA (5 mM; Selleck, S2767) and chloroquine (50 µM; Sigma, C6628) were used at the indicated day. For half-time detection, 10 µg/ml cycloheximide (Sigma, C1988) was used for the indicated hours. For protein degradation inhibition and ubiquitination detection, mouse granulosa cells (MGCs) were treated with chloroquine (50 µM) or MG132 (10 µM; Sigma, M7449) for 6 h before western blot and immunofluorescent detection.
Plasmid construction
The cDNA of Acly, and Sqstm1 were amplified from MGCs and subcloned into the pLVX vector (Addgene, 125,839; deposited by Boyi Gan). SQSTM1ΔUBA was generated by subcloning corresponding fragments of Sqstm1 cDNA. Ubiquitin plasmids including K63-only, K48-only, K63R, and K48R mutant were gifts from Prof. Hong-Bing Shu at Wuhan University, China. Small hairpin RNAs (shRNAs) for ACLY knock-down were designed, synthesized and subcloned into pLKO.1 vectors (Addgene, 10,878; deposited by David Root) expressing an mCherry reporter. sgRNAs pairs for sqstm1 knockout were subcloned into a lentiviral backbone vector pX330 (Addgene, 110,403; deposited by Sandra Martha Gomes Dias). The shRNA and sgRNA sequences are provided in Table S1B.
Oocyte collection and oocyte maturation in vitro
Only COCs with more than three layers of cumulus granulosa cells and containing oocytes >70 mm in diameter were selected. Denuded oocytes were prepared by mechanically removing granulosa cells from COCs with a small-bore mouth pipette. For in vitro maturation, the GV oocytes were washed twice with maturation medium and transferred to the 96 wells plated with GCM for 15 h at 37.5°C in a humidified atmosphere of 5% CO2. GV oocytes and granulosa cells were cultured in 100 μl simplified α-MEM medium [Citation41] containing 1.8 mM CaCl2, 0.81 mM MgSO4, 5.3 mM KCl, 26.2 mM NaHCO3, 117.2 mM NaCl, 1.0 mM NaH2PO4, pH 7.4, 2 mM glutamine, 4 mg/ml bovine serum albumin (Sigma, A3311), 5.56 mM glucose, 10 IU/ml eCG (Sigma, G4877), 0.03 mM phenol red, 50 IU/ml penicillin, and 50 μg/ml streptomycin. Oocyte maturation (MII stage) was judged by expulsion of the PB1. Oocytes arrested at the MI stage were counted and judged by spindle morphology and chromosomes aligned at the equatorial plate, without polar body extrusion.
For porcine oocyte maturation, porcine follicular fluid with cumulus oocyte complexes (COCs) was aspirated from antral follicles in different size (2–4 mm or 5–7 mm). COCs with uniform oocyte cytoplasm and several layers of granulosa cells were then picked and rinsed three times in in vitro maturation (IVM) medium [Citation42,Citation43]. About 30 COCs were transferred in 96-well microplates containing 150 μL IVM medium covered with mineral oil, and cultured for 44 h at 38.5°C in a 5% CO2 incubator (Thermo Fisher Scientific). Germinal vesicle (GV) oocytes were harvested by removing cumulus granulosa cells from COCs in 0.1% hyaluronidase for a 5-min vortex. Porcine oocyte maturation (MII stage) was judged by expulsion of the PB1.
In vitro fertilization and embryo culture
IVF assays were conducted as previously described [Citation44]. Briefly, sperm was obtained from dissected epididymis of Kun-Ming mice aged 10–20 weeks, and left to capacitate for 1 h in HTF fertilization medium (Millipore, Merck, MR-070-D). For sperm binding assay, capacitated sperm were incubated with oocytes in 100 μL HTF for 1 h and zygotes were fixed with 4% paraformaldehyde for 15 min at room temperature and stained with DAPI (Beyotime Biotechnology, P0131) to analyze the number of sperm binding to the surface of the zona pellucida surrounding oocytes. For insemination, capacitated sperm were incubated with ovulated oocytes in 100 μL HTF for 4 h. The zygotes were cultured in G1-Plus medium at 37°C in a humidified atmosphere of 5% CO2.
Antibodies
Anti-ACLY (ab40793), anti-LMNB1 (ab16048), anti-TOMM20 (ab40793), anti-ACTB (ab8227), anti-HA-tag (ab9110), anti-K48-linkage polyubiquitin (ab140601), anti-K63-linkage polyubiquitin (ab179434), goat anti-rabbit-HRP (ab6721), and goat anti-mouse-HRP (ab6789) were purchased from Abcam. Anti-LC3B (3868), anti-SQSTM1 (23,214), anti-ATG7 (8558), and anti-MYC-tag (2276) were purchased from Cell Signaling Technology. Anti-ATG12–ATG5 (A2859), rabbit anti-LC3B (L7543), FITC-anti-PNA (L7381), FITC-anti-TUBA/tubulin (F2168), and monoclonal anti-FLAG (F1804) were purchased from Sigma. Anti-BECN1 (bs-1353 R), donkey anti-rabbit Alexa Flour 555 (bs-0295D-A555), and rabbit anti-mouse Alexa Flour 488 (bs-0296 R-A488) were purchased from Bioss.
Transmission electron microscopy
Fixation was performed in 2.5% glutaraldehyde for at least 2 days at 4°C. Cells were then treated with 1% agar for 40 min and dehydrated in ascending series of ethanol. After that, cells were immersed in propylene oxide for solvent substitution, embedded in Epon 812 (Agar Scientific, R1045) and sectioned. Ultrathin sections (60–80 nm) were cut with a diamond knife, mounted on copper grids and contrasted with saturated uranyl acetate followed by lead citrate. Grids were examined and photographed using a FEI Tecnai 8482 Electron Microscope operating at 200 KV.
Senescence-associated GBA/β-galactosidase staining
GBA/β-galactosidase staining was performed with a commercial GBA/β-Galactosidase test Kit (Beyotime Biotechnology, C0602). Cells were fixed with 4% paraformaldehyde for 15 min at room temperature. After washing twice in PBS (Gibco, 20,012,027), the cells were incubated overnight at 37°C in darkness containing 0.05 mg/ml 5-bromo-4-chloro-3-indolyl-b-d-galactopyranoside (X-gal; C0602).
Cell apoptosis detection
Cell apoptosis was analyzed with the one step TUNEL kit (Beyotime Biotechnology, C1089). Briefly, cells were washed with PBS twice and fixed with 4% paraformaldehyde for 30 min, followed by permeabilization with 0.05% Triton X-100 (Sigma, 93,443) for 25 min. The TUNEL reaction mixture prepared as indicated by the instructions was applied to cells for 1 h at 37°C in the dark. Nuclei were stained with DAPI for 10 min. Randomly chosen fields were examined at ×400 magnification using confocal microscopy. The cells with red fluorescence were defined as apoptotic cells.
Immunofluorescence and confocal microscopy
The Reactive Oxygen Species Assay Kit (Beyotime Biotechnology, S0033S) was used to measure the level of ROS. Briefly, the oocytes were seeded in 96-well plates incubated with DCFH-DA for 20 min at 37°C. Then oocytes were washed three times in DPBS (Gibco, 14,190,144) containing 0.1% BSA and placed on glass slides then observed using fluorescence microscopy and measured at 488-nm excitation.
For active mitochondria staining, cells and oocytes were co-cultured in a simplified α-MEM medium containing 500 nM cell permeant Mito-Tracker Red CMXRos (Beyotime Biotechnology, C1035) for 30 min at 37°C in a dark environment and 5% CO2 in air. Then oocytes were washed three times in M2 medium and placed on glass slides. Cells were washed three times in DPBS containing 0.1% BSA. Finally, cells and oocytes were observed under the laser scanning confocal microscope. Complete or partial loss of uniform localization of mitochondria around chromosomes and the appearance of clusters in the cytoplasm were considered abnormal distributions of mitochondria.
For the measurement of fluorescence intensity, signals from both control and treatment oocytes were acquired using the same immunostaining procedure with the same parameters set for confocal microscopy. Region of interest (ROI) was defined using ImageJ (NIH, Bethesda, MD, USA) and the average fluorescence intensity per unit area within the ROI was determined.
Co-immunoprecipitation and western blot
Cell lysis in IP lysis buffer (50 mM Tris HCl, pH 7.4, 150 mM NaCl, 1% NP-40 [Roche, 11,332,473,001], 0.5% sodium deoxycholate [Sigma, D6750], 0.1% SDS and protease inhibitor cocktail [Roche, 4,693,116,001]). The lysates were immunoprecipitated with 1–3 µg of specific antibody and 25 µl A/G agarose beads (Sigma, 88,804) 2 h at room temperature. The precipitates were washed three times with lysis buffer, and the immune complexes were boiled with loading buffer for 10 min before analysis by SDS-PAGE. For western blot, cells were lysed in lysis buffer (50 mM Tris-HCl, pH 7.4, 150 mM NaCl, 1% NP-40, 0.5% sodium deoxycholate, 0.1% SDS and protease inhibitor cocktail). Protein concentration was detected with the BCA method (Beyotime Biotechnology, P0009). Equivalent protein quantities were subjected to SDS-PAGE, and transferred to PVDF membranes (Millipore, IPVH00010). Membranes were blocked with 5% BSA (Beyotime Biotechnology, ST023) for 1 h at room temperature and then probed with the indicated primary antibodies overnight at 4°C, followed by the appropriate HRP-conjugated secondary antibodies for 2 h at room temperature. After washing with TBST three times, the blotted membranes were visualized with SuperSignal West Pico chemiluminescent substrate (Pierce Chemical, 34,580). All original western blot images are provided in Data S1.
Immunofluorescence detection
Cells or oocytes were fixed with 4% paraformaldehyde for 1 h and permeabilized with 0.5% Triton X-100 in PBS for 30 min at room temperature. Following blocking in 1% BSA-supplemented PBS for 1 hour, samples were incubated overnight at 4°C with primary antibodies as follows: anti-ACLY antibody, anti-SQSTM1/p62 antibody, anti-LC3B antibody, anti-ATG12–ATG5 antibody, anti-TOMM20 antibody, FITC-anti-PNA antibody and FITC-anti-TUBA/tubulin antibody. The samples were washed with PBS containing 0.1% Triton X-100 and incubated with the secondary antibody for 1 h at room temperature. Nuclei were stained with DAPI for 10 min. The images were taken with a LSM800 confocal microscope system (Zeiss) and processed using Zen 2.3 lite software and Adobe Photoshop CS6.
RNA extraction, reverse transcription and quantitative real-time PCR
Total RNA was isolated using TRIzol (Invitrogen, 15,596–018), and the reactions were performed with cDNA Synthesis Kit (Vazyme, R212-01) according to the manufacturer’s protocol. Quantitative real-time PCR was performed with AceQ Universal SYBR qPCR Master Mix (Vazyme, Q511-02) in a reaction volume of 10 μl and the Bio-Rad CFX96 ConnectTM Real-Time PCR Detection System (Bio-Rad). Primers were selected according to Primer Bank (http://pga.mgh.harvard.edu/primerbank) and listed in Table S1A. Melting curves were analyzed to verify amplification specificity. Delta-Delta Ct value represented the mRNA expression, and the data were normalized to Actb/β-actin.
RNA-Seq and data analysis
Two micrograms of total RNA were used for RNA sample preparation. Sequencing libraries were generated using NEBNext® Ultra™ RNA Library Prep Kit for Illumina® (NEB, E7530L) following the manufacturer’s recommendations and index codes were added to attribute sequences to each sample. RNA concentration of library was measured using Qubit® RNA Assay Kit in Qubit® 3.0 to preliminary quantify and then dilute to 1 ng/μl. Library quality was assessed using the Agilent Bioanalyzer 2100 system. After cluster generation, the library preparations were sequenced on the Illumina platform. RNA-seq libraries were sequenced with a 2 × 150 bp strand-specific protocol on a HiSeq 2500 sequencer (Illumina). Reads of RNA-seq were mapped to the mm10 genome (GRCm38) with STAR [Citation45] using the ENCODE standard options. Gene expression levels were quantified by Stringtie [Citation46] using the refFlat database from the UCSC genome browser. Expression level of each gene was quantified with normalized FPKM (Fragments per kilobase of exon per million mapped reads). Gene differential expression analysis using DESeq2 [Citation47] based on the reads count file was obtained by featureCounts [Citation48]. Spearman’s r coefficient was calculated using the cor function in R. The GO (Gene ontology) and KEGG (Kyoto Encyclopedia of Genes and Genomes) enrichment analyses were performed by using clusterProfiler [Citation49] R package. Differentially expressed gene was listed in Table S2.
Metabolomics analysis
Oocyte maturation medium was collected to vortex for 30s, and then centrifuged at 845 x g and 4°C for 5 min. After 5 min incubation on ice, supernatant was neutralized by the addition of 150 μL methanol, then centrifuged at 12,000 x g and 4°C for 5 min. The supernatant was pipetted into a new centrifuge tube and allowed to stand for 30 min at −20°C. After centrifugation for 21,130 x g and 4°C for 20 min, 140 μl supernatants were transferred for Ultra Performance Liquid Chromatography (UPLC, ExionLCTMAD, https://sciex.com.cn/) analysis. Briefly, experiments were performed on an HPLC, Shim-pack UFLC SHIMADZU CBM20A system coupled to a Q-Exactive mass spectrometer (Thermo Fisher Scientific, Bremen, Germany). The analytical conditions were as follows, HPLC: column, shim-pack VP-ODS C18 (pore size 5.0 μm, length 2 × 150 mm); solvent system, water (0.04% acetic acid): acetonitrile (0.04% acetic acid); gradient program, 100:0 V:V at 0 min, 5:95 V:V at 20.0 min, 5:95 V:V at 22.0 min, 95:5 V:V at 22.1 min, 95:5 V:V at 28.0 min; flow rate, 0.25 ml min–1; temperature, 40°C; injection volume: 5 μl. The variable importance in projection (VIP) value > 1.00 and P value < 0.05 of each metabolite were used as the combined cutoffs of the statistical significance. All metabolites were listed in Table S3.
Metabolite measurements
MGCs were grown in six-well plates and incubated for 72 h in cell culture media. Media was removed and the cells were washed twice with PBS. Cells were extracted with ice-cold PBS. After 5 min incubation on ice, cells were collected from culture dishes after scraping. The cell lysates were broken in an ultrasonic disruptor (Bioruptor Plus, Diagenode) for 5 min, then the lysates were centrifuged at 13,000 x g and 4°C for 15 min, and the supernatant was collected for mouse ATP citrate lyase (ACLY) ELISA Kit (FANKEWEI, F30624-A). Oocyte maturation medium and follicular fluid were collected for metabolites identification, and the medium was centrifuged at 12,000 x g at 4°C for 15 min. The supernatant was collected for subsequent citrate concentration identification (FANKEWEI, ADS-W-S002). Levels of citrate in human and porcine follicular fluid and first polar body rate in oocytes retrieved from porcine follicular fluid are shown in Table S4.
Statistical analysis
Data were analyzed using SPSS version 16.0 (SPSS Inc, USA) or R (http://www.r-project.org). Statistical significance was calculated with two-tailed unpaired Student’s t test (p < 0.05 was considered statistically significant). All experiments were repeated at least three times unless otherwise stated. Results were expressed as the mean ± s.e.m. Values of p < 0.05 or were considered statistically significant.
Data availability
All sequencing data related to this study have been deposited at Gene Expression Omnibus (GEO, https://www.ncbi.nlm.nih.gov/geo/) under the accession number GSE190697.
Supplemental Material
Download Zip (4.7 MB)Acknowledgments
We thank Dr. Heide Schatten (University of Missouri) for helping us to improve our English language. We are grateful to Fangke Wang for her assistance in the pattern diagram drawing.
Disclosure statement
No potential conflict of interest was reported by the author(s).
Supplementary material
Supplemental data for this article can be accessed here.
Additional information
Funding
Related Research Data
References
- Liu XJ. Targeting oocyte maturation to improve fertility in older women. Cell Tissue Res. 2016;363(1):57–68.
- Hourvitz A, Machtinger R, Maman E, et al. Assisted reproduction in women over 40 years of age: how old is too old? Reprod Biomed Online. 2009;19(4):599–603.
- Eijkemans MJ, van Poppel F, Habbema DF, et al. Too old to have children? Lessons from natural fertility populations. Hum Reprod. 2014;29(6):1304–1312.
- Ciancimino L, Lagana AS, Chiofalo B, et al. Would it be too late? A retrospective case-control analysis to evaluate maternal-fetal outcomes in advanced maternal age. Arch Gynecol Obstet. 2014;290(6):1109–1114.
- Suzuki H, Saito Y, Kagawa N, et al. In vitro fertilization and polyspermy in the pig: factors affecting fertilization rates and cytoskeletal reorganization of the oocyte. Microsc Res Tech. 2003;61(4):327–334.
- Warzych E, Lipinska P. Energy metabolism of follicular environment during oocyte growth and maturation. J Reprod Dev. 2020;66(1):1–7.
- Dubeibe Marin DF, da Costa NN, Di Paula Bessa Santana P, et al. Importance of lipid metabolism on oocyte maturation and early embryo development: can we apply what we know to buffalo? Anim Reprod Sci. 2019;211:106220.
- Roberts R, Stark J, Iatropoulou A, et al. Energy substrate metabolism of mouse cumulus-oocyte complexes: response to follicle-stimulating hormone is mediated by the phosphatidylinositol 3-kinase pathway and is associated with oocyte maturation. Biol Reprod. 2004;71(1):199–209.
- Lin RY, Vera JC, Chaganti RSK, et al. Human monocarboxylate transporter 2 (MCT2) is a high affinity pyruvate transporter. J Biol Chem. 1998;273(44):28959–28965.
- Gutnisky C, Dalvit GC, Thompson JG, et al. Pentose phosphate pathway activity: effect on in vitro maturation and oxidative status of bovine oocytes. Reprod Fertil Dev. 2014;26(7):931–942.
- Sugiura K, Pendola FL, Eppig JJ. Oocyte control of metabolic cooperativity between oocytes and companion granulosa cells: energy metabolism. Dev Biol. 2005;279(1):20–30.
- Klionsky DJ, Emr SD. Cell biology - autophagy as a regulated pathway of cellular degradation. Science. 2000;290(5497):1717–1721.
- Hale BJ, Hager CL, Seibert JT, et al. Heat stress induces autophagy in pig ovaries during follicular development. Biol Reprod. 2017;97(3):426–437.
- Song ZH, Yu HY, Wang P, et al. Germ cell-specific Atg7 knockout results in primary ovarian insufficiency in female mice. Cell Death Dis. 2015;6(1):e1589.
- Gawriluk TR, Ko C, Hong X, et al. 3rd. Beclin-1 deficiency in the murine ovary results in the reduction of progesterone production to promote preterm labor. Proc Natl Acad Sci U S A. 2014;111(40):E4194–203.
- Huang P, Zhou Y, Tang W, et al. Long-term treatment of nicotinamide mononucleotide improved age-related diminished ovary reserve through enhancing the mitophagy level of granuloas cellsin mice. J Nutr Biochem. 2021;101:108911.
- Jiao L, Zhang HL, Li DD, et al. Regulation of glycolytic metabolism by autophagy in liver cancer involves selective autophagic degradation of HK2 (hexokinase 2). Autophagy. 2018;14(4):671–684.
- Li X, Zhou L, Peng G, et al. Pituitary P62 deficiency leads to female infertility by impairing luteinizing hormone production. Exp Mol Med. 2021;53(8):1238–1249.
- Zhang JJ, Liu XY, Chen L, et al. Advanced maternal age alters expression of maternal effect genes that are essential tor human oocyte quality. Aging-Us. 2020;12(4):3950–3961.
- Dimri GP, Lee XH, Basile G, et al. A biomarker that identifies senescent human-cells in culture and in aging skin in-Vivo. Proc Natl Acad Sci U S A. 1995;92(20):9363–9367.
- Xie HL, Wang YB, Jiao GZ, et al. Effects of glucose metabolism during in vitro maturation on cytoplasmic maturation of mouse oocytes. Sci Rep-Uk. 2016;6:1–11.
- Li L, Zhu S, Shu WJ, et al. Characterization of metabolic patterns in mouse oocytes during meiotic maturation. Mol Cell. 2020;80(3):525.
- Hu XW, Wang DD, Sun LY, et al. Disturbed mitochondrial acetylation in accordance with the availability of acetyl groups in hepatocellular carcinoma. Mitochondrion. 2021;60:150–159.
- Kirkin V, McEwan DG, Novak I, et al. A role for ubiquitin in selective autophagy. Mol Cell. 2009;34(3):259–269.
- Pankiv S, Clausen TH, Lamark T, et al. p62/SQSTM1 binds directly to Atg8/LC3 to facilitate degradation of ubiquitinated protein aggregates by autophagy. J Biol Chem. 2007;282(33):24131–24145.
- Pankiv S, Lamark T, Bruun JA, et al. Nucleocytoplasmic Shuttling of p62/SQSTM1 and Its Role in Recruitment of Nuclear Polyubiquitinated Proteins to Promyelocytic Leukemia Bodies. J Biol Chem. 2010;285(8):5941–5953.
- Sun QS, Niu Q, Guo YT, et al. Regulation on Citrate Influx and Metabolism through Inhibiting SLC13A5 and ACLY: a Novel Mechanism Mediating the Therapeutic Effects of Curcumin on NAFLD. J Agr Food Chem. 2021;69(31):8714–8725.
- Zhao YJ, Liu X, Si FS, et al. Citrate promotes excessive lipid biosynthesis and senescence in tumor cells for tumor therapy. Adv Sci. 2021;9:e2101553.
- Mycielska ME, Milenkovic VM, Wetzel CH, et al. Extracellular citrate in health and disease. Curr Mol Med. 2015;15(10):884–891.
- Harris SE, Leese HJ, Gosden RG, et al. Pyruvate and oxygen consumption throughout the growth and development of murine oocytes. Mol Reprod Dev. 2009;76(3):231–238.
- MacDonald MJ, Longacre MJ, Stoker SW, et al. Differences between human and rodent pancreatic islets low pyruvate carboxylase, ATP citrate lyase, and pyruvate carboxylation and high glucose-stimulated acetoacetate in human pancreatic islets. J Biol Chem. 2011;286(21):18383–18396.
- Zhao S, Torres A, Henry RA, et al. ATP-citrate lyase controls a glucose-to-acetate metabolic switch. Cell Rep. 2016;17(4):1037–1052.
- Li Y, Li YC, Liu XT, et al. Blockage of citrate export prevents TCA cycle fragmentation via Irg1 inactivation. Cell Rep. 2022;38(7):110391.
- Corbet C, Feron O. Cancer cell metabolism and mitochondria: nutrient plasticity for TCA cycle fueling. Biochim Biophys Acta. 2017;1868(1):7–15.
- Johansen T, Lamark T. Selective autophagy mediated by autophagic adapter proteins. Autophagy. 2011;7(3):279–296.
- Feng LJ, Zhang J, Zhu N, et al. Ubiquitin ligase SYVN1/HRD1 facilitates degradation of the SERPINA1 Z variant/alpha-1-antitrypsin Z variant via SQSTM1/p62-dependent selective autophagy. Autophagy. 2017;13(4):686–702.
- Jang J, Wang YD, Lalli MA, et al. Primary cilium-autophagy-Nrf2 (PAN) axis activation commits human embryonic stem cells to a neuroectoderm fate. Cell. 2016;165(2):410–420.
- Wang S, Zheng YX, Li JY, et al. Single-cell transcriptomic atlas of primate ovarian aging. Cell. 2020;180(3):585.
- Baskind NE, Mcrae C, Sharma V, et al. Understanding subfertility at a molecular level in the female through the application of nuclear magnetic resonance (NMR) spectroscopy. Hum Reprod Update. 2011;17(2):228–241.
- Sung LY, Du FL, Xu J, et al. The differential requirement of albumin and sodium citrate on the development of in vitro produced bovine embryos. Reprod Nutr Dev. 2004;44(6):551–564.
- Xie HL, Zhu S, Zhang J, et al. Glucose metabolism during in vitro maturation of mouse oocytes: an study using RNA interference. J Cell Physiol. 2018;233(9):6952–6964.
- Liu X, Hao Y, Li Z, et al. Maternal cytokines CXCL12, VEGFA, and WNT5A promote porcine oocyte maturation via MAPK activation and canonical WNT inhibition. Front Cell Dev Biol. 2020;8:578.
- Lai LX, Prather RS. Production of cloned pigs by using somatic cells as donors. Cloning Stem Cells. 2003;5(4):233–241.
- Han LS, Ren C, Li L, et al. Embryonic defects induced by maternal obesity in mice derive from Stella insufficiency in oocytes (vol 50, pg 432, 2018). Nat Genet. 2018;50(5):768.
- Dobin A, Gingeras TR. Mapping RNA-seq Reads with STAR. Curr Protoc Bioinformatics. 2015;51(1): 11 4 1- 4 9. doi:10.1002/0471250953.bi1114s51.
- Pertea M, Pertea GM, Antonescu CM, et al. StringTie enables improved reconstruction of a transcriptome from RNA-seq reads. Nat Biotechnol. 2015;33(3):290–295.
- Love MI, Huber W, Anders S. Moderated estimation of fold change and dispersion for RNA-seq data with DESeq2. Genome Biol. 2014;15(12):550.
- Liao Y, Smyth GK, Shi W. featureCounts: an efficient general purpose program for assigning sequence reads to genomic features. Bioinformatics. 2014;30(7):923–930.
- Yu GC, Wang LG, Han YY, et al. clusterProfiler: an R package for comparing biological themes among gene clusters. Omics. 2012;16(5):284–287.