
 ?Mathematical formulae have been encoded as MathML and are displayed in this HTML version using MathJax in order to improve their display. Uncheck the box to turn MathJax off. This feature requires Javascript. Click on a formula to zoom.
ABSTRACT
Dietary restriction (DR) is known to promote autophagy to exert its longevity effect. While SAMS-1 (S-adenosyl methionine synthetase-1) has been shown to be a key mediator of the DR response, little is known about the roles of S-adenosyl methionine (SAM) and SAM-dependent methyltransferase in autophagy and DR-induced longevity. In this study, we show that DR and SAMS-1 repress the activity of SET-2, a histone H3K4 methyltransferase, by limiting the availability of SAM. Consequently, the reduced H3K4me3 levels promote the expression and activity of two transcription factors, HLH-30/TFEB and PHA-4/FOXA, which both regulate the transcription of autophagy-related genes. We then find that HLH-30/TFEB and PHA-4/FOXA act collaboratively on their common target genes to mediate the transcriptional response of autophagy-related genes and consequently the lifespan of the animals. Our study thus shows that the SAMS-1-SET-2 axis serves as a nutrient-sensing module to epigenetically coordinate the activation of HLH-30/TFEB and PHA-4/FOXA transcription factors to control macroautophagy/autophagy and longevity in response to DR.
Abbreviations: ChIP: chromatin immunoprecipitation; ChIP-seq: chromatin immuno precipitation-sequencing; COMPASS: complex of proteins associated with Set1; DR: dietary restriction; GO: gene ontology; SAM: S-adenosyl methionine; SAMS-1: S-adenosyl methionine synthetase-1; TSS: transcription start site; WT: wild-type.
Introduction
Proteostatic collapse is a hallmark of aging manifested as the accumulation of damaged proteins and dysfunctional organelles [Citation1]. Autophagy is a key proteostatic mechanism that degrades damaged proteins and organelles to promote cellular health [Citation2]. Age-related decline in autophagy is proposed to be one of the causes of proteostatic collapse observed during aging and in multiple age-related diseases [Citation3–5]. In support of this notion, various interventions that extend lifespan require autophagy activation. Furthermore, enhancing autophagy activity is sufficient to extend lifespan of many model organisms spanning from yeast to mice [Citation6–8].
Dietary restriction (DR) utilizes multiple mechanisms to promote homeostasis and extend the lifespan of organisms [Citation9]. Autophagy is one of the cellular processes activated by DR [Citation6]. Nutrient availability modulates nutrient-sensing pathways which act on the autophagy pathway to directly control the autophagy activity [Citation2]. However, autophagy activity can also be controlled at the transcriptional level, implicating the necessity of indirect and long-term autophagy responses [Citation10]. Notably, the transcription factor HLH-30/TFEB has emerged as a master regulator of autophagy and lysosomal biogenesis by controlling the transcription of multiple autophagy-related and lysosomal-related genes [Citation11–13]. In DR as well as in other conserved longevity paradigms, HLH-30/TFEB translocates into the nucleus and induces the expression of multiple autophagy-related and lysosomal genes [Citation14]. Crucially, hlh-30/TFEB is essential to DR-mediated longevity in C. elegans. Therefore, the transcriptional responses of autophagy-related genes play an important role in DR to extend lifespan.
HLH-30/TFEB is not the only transcription factor implicated in the regulation of autophagy-related genes. Similar to HLH-30/TFEB, the FOXA transcription factor PHA-4 is required to upregulate autophagy-related genes and autophagy activity upon DR and germline removal in C. elegans [Citation15,Citation16]. Consistently, PHA-4/FOXA is also essential to the long lifespan of DR and germline-ablated worms [Citation16,Citation17]. However, it remains unknown how HLH-30/TFEB and PHA-4/FOXA interact to coordinate the regulation of autophagy and aging.
We previously carried out a genome-wide RNAi screening and found that sams-1, which encodes S-adenosyl methionine synthetase-1 (SAMS-1), is a crucial regulator of DR-induced longevity [Citation18]. It has been shown that depletion of sams-1 is sufficient to extend lifespan of wild-type (WT) but not eat-2 animals [Citation18], a genetic model of DR. Furthermore, sams-1 expression is found to be lower in the DR animals [Citation18]. SAMS-1 synthesizes S-adenosyl methionine (SAM), which is a key methyl group donor for methyltransferase reactions. However, the downstream effectors of SAMS-1 that mediate longevity are largely unknown. We thus set out to further investigate the role of SAMS-1 and SAM-dependent methylation in DR-induced autophagy activation and lifespan extension. In this study, we found that, in response to DR, the activities of two key autophagy-related transcription factors HLH-30/TFEB and PHA-4/FOXA are coordinately regulated through an epigenetic mechanism that involves SAMS-1 and histone methylation. DR represses the activity of SET-2, a histone H3K4 methyltransferase, by reducing the availability of SAM. Consequently, the reduced H3K4me3 levels promote the activation of HLH-30/TFEB and PHA-4/FOXA. Therefore, our study provides an epigenetic-based mechanism that underlies how DR modulates autophagy to regulate the rate of aging.
Results
Autophagy activation is required for longevity of sams-1 mutants
To ask if sams-1 controls autophagy to modulate the rate of aging, we first used animals expressing GFP-tagged LGG-1, an ortholog of Atg8/LC3, to monitor autophagy [Citation19]. Autophagosome is a double-membraned organelle that engulfs autophagic substrates [Citation2]. Atg8 is conjugated to phosphatidylethanoamine of the phagophore membrane and thus is used as a marker for autophagosomes. We found an increased number of GFP::LGG-1 puncta in the sams-1(ok2946) mutants across different tissues, including hypodermal seam cells, muscle cells, pharyngeal bulb and intestinal cells ( and Fig. S1A). To determine if these punctate structures are indeed autophagosomes, we also used animals expressing GFP::LGG-1G116A which cannot be conjugated to autophagosomes. The number of punctate structures was significantly reduced in the sams-1 mutants expressing GFP::LGG-1G116A (Fig. S1A), strongly suggesting that the increased GFP::LGG-1 puncta observed in sams-1(ok2946) mutants were autophagosomes.
Figure 1. Autophagy activation is required for longevity of sams-1 mutants. (a) GFP::LGG-1-positive puncta were quantified in the hypodermal seam cells (top panel) and body-wall muscle (bottom panel) of day 1 adult WT and sams-1(ok2946) animals expressing lgg-1p::gfp::lgg-1. Graphs show mean SEM of GFP::LGG-1 puncta in hypodermal seam cells (WT: N = 124; sams-1(ok2946): N = 97 cells) and body-wall muscles (WT: N = 78; sams-1(ok2946): N = 53 worms) combined from three independent experiments. Scale bar: 25 µm. ****P < 0.0001, Student’s t-test. (b) GFP and mCherry fluorescent images of day 1 adult worms expressing gfp::lgg-1::mcherry::lgg-1ΔG fed with empty vector (EV) or sams-1 RNAi bacteria from hatching. Scale bar: 100 µm. Graph shows the relative GFP:mCherry fluorescence signal ratio of individual worms, normalized to the mean of EV. Mean
SD are shown (EV: N = 23; sams-1 RNAi: N = 27 worms). ****P < 0.0001, Student’s t-test. (c) Lifespan analyses of N2 and sams-1(ok2946) worms fed with EV or bec-1 RNAi (left panel), vps-34 RNAi (middle panel), lgg-1/lgg-2 RNAi (right panel) bacteria from day 1 adulthood at 20°C. Please see Table S1 for detailed statistics.
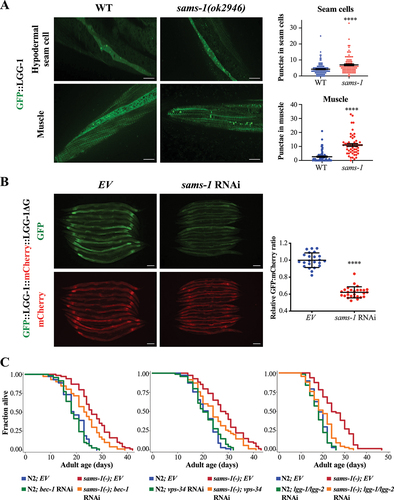
Kaizuka et al. previously developed a GFP::LC3::RFP::LC3ΔG probe to evaluate autophagic flux in mammalian cells [Citation20]. Atg4 cleaves the probe to produce equimolar amounts of GFP::LC3 and RFP::LC3ΔG. GFP::LC3 is then degraded by autophagy, whereas RFP::LC3ΔG does not have the C-terminal glycine required to be eventually degraded by autophagy, thus serves as an internal control for GFP::LC3. Therefore, the GFP:RFP signal ratio can be used to assess autophagic flux. This reporter has been utilized in cell culture, zebrafish and mice, but not in C. elegans. We thus created a strain expressing a nematode version of this probe, by replacing LC3 with the nematode ortholog LGG-1, and replaced RFP with a more stable mCherry to create a GFP::LGG-1::mCherry::LGG-1ΔG probe. To validate that this reporter probe is applicable to worms, we first tested it in various autophagy-alternating conditions. We found that the GFP:mCherry ratio was reduced, which reflects an increased autophagic flux, in autophagy-stimulating conditions, such as starvation and ragc-1 RNAi which inhibits MTORC1 (Fig. S1B, C). Conversely, knockdown of core autophagic machinery components such as bec-1 and vps-34 reduced autophagic flux (Fig. S1D). Taken together, this reporter appears to be a feasible tool for measuring autophagic flux in C. elegans. It is worth noting, however, that this reporter system may be limited by the Atg4 activity. At low Atg4 activity level, changes in GFP:mCherry ratio in response to changes in autophagy flux may be masked by high level of uncleaved probe. Here, we found that compared to the control, sams-1 RNAi significantly increased autophagic flux (). Together, our results from these different assays suggest that knockdown or knockout of sams-1 markedly increases autophagy activity in C. elegans. Consistent with this idea, the transcriptomic profiling of sams-1 mutants by RNA-sequencing has identified “lysosomes” as one of the top GO terms enriched among 704 differentially expressed genes (Fig. S2A). Moreover, several autophagy-related genes, such as sqst-1/p62 and atg-4.1, were found to be upregulated in sams-1 mutants (File S1).
Thus, we next asked whether autophagy-related genes are required for the longevity of sams-1 mutants. We found that knockdown of several autophagy-related genes, such as bec-1, vps-34, or lgg-1/lgg-2/Atg8, suppressed the longevity of sams-1(ok2946) mutants (). Collectively, these results show that the inactivation of sams-1 stimulates autophagy to promote longevity.
HLH-30/TFEB and PHA-4/FOXA mediate the autophagy and longevity phenotypes of sams-1 mutants
HLH-30 and PHA-4 have been reported to control the expression of numerous autophagy-related genes to regulate autophagy [Citation12,Citation13,Citation16,Citation21,Citation22]. We thus asked if HLH-30/TFEB and PHA-4/FOXA could mediate autophagy activation upon sams-1 depletion. HLH-30 translocates into the nucleus in several long-lived mutants to activate autophagy and promote longevity [Citation14]. In contrast, PHA-4 constitutively localizes to the nucleus irrespective of nutrient status, while its expression is elevated in the long-lived DR and germline-less animals [Citation16,Citation17].
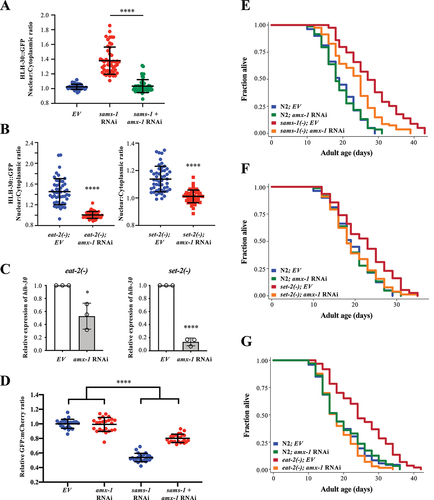
Interestingly, we found that the protein and mRNA expressions of both HLH-30 and PHA-4 were upregulated upon sams-1 depletion (), suggesting that sams-1 may regulate the transcription of hlh-30 and pha-4. Moreover, we found that HLH-30 nuclear translocation was enhanced in sams-1 knockout mutants, by measuring the nuclear:cytoplasmic ratio of HLH-30 (). Consistently, the expression levels of several autophagy-related genes, including lgg-1, lgg-2, sqst-1/p62, atg-4.1, atg-11, epg-3, epg-5, allo-1, and vps-34, were all found to be increased in sams-1(ok2946) mutants ().
Figure 2. HLH-30/TFEB and PHA-4/FOXA mediate autophagy and longevity of sams-1 mutants. (a) Representative HLH-30::GFP immunoblot of worms expressing hlh-30::gfp fed with empty vector (EV) or sams-1 RNAi bacteria. Worms were fed with respective bacteria from hatching and the whole-cell extracts of adult day 1 worms were subjected to immunoblotting using anti-GFP or anti-actin antibodies. Graph shows abundance of HLH-30::GFP normalized to actin. Mean SD of three independent experiments are shown. **P < 0.01, Student’s t-test. (b) Representative PHA-4::GFP immunoblot of worms expressing pha-4::gfp fed with EV or sams-1 RNAi bacteria. Worms were fed with respective bacteria from hatching and the whole-cell extracts of adult day 1 worms were subjected to immunoblotting using anti-GFP or anti-actin antibodies. Graph shows abundance of PHA-4::GFP normalized to actin. Mean
SD of three independent experiments are shown. *P < 0.05, Student’s t-test. (c) Relative mRNA abundance of hlh-30, pha-4, autophagy-related genes and sodh-1, an HLH-30 and PHA-4 target gene, in N2 and sams-1(ok2946) worms at L4 larvae stage by QPCR analysis. Mean
SD of three to five independent experiments are shown. *P < 0.05, ***P < 0.001, ****P < 0.0001, Student’s t-test. (d) Nuclear localization of HLH-30::GFP was visualized in day 1 adult worms expressing hlh-30::gfp. Eggs of worms expressing hlh-30::gfp were placed on plates supplemented with H2O (left panel). Eggs of sams-1(ok2946) worms expressing hlh-30::gfp were placed on plates supplemented with H2O (middle panel) or 20 µM SAM (right panel). Representative images are shown. Scale bar: 25 µm. HLH-30::GFP nuclear:cytoplasmic ratio in int1 intestinal cells of WT and sams-1(ok2946) worms expressing hlh-30::gfp was calculated. Mean
SD (N = 50 cells) are shown. ****P < 0.0001, Student’s t-test. (e and f) Graphs show the relative GFP:mCherry fluorescence signal ratio of WT or sams-1(ok2946) (E), eat-2 (ad1116) (F) worms expressing gfp::lgg-1::mcherry::lgg-1ΔG fed with EV, hlh-30 or pha-4 RNAi bacteria. Worms were fed with EV, hlh-30 or pha-4 RNAi bacteria from hatching, and L4 worms were imaged. The relative GFP:mCherry fluorescence signal ratio of individual worms was normalized to the mean of WT worms fed with EV bacteria. (e) Graph shows mean
SD of WT (EV: N = 30; hlh-30 RNAi: N = 30; pha-4 RNAi: N = 28 worms) and sams-1(ok2946) mutants (EV: N = 40; hlh-30 RNAi: N = 26; pha-4 RNAi: N = 21 worms). (f) Graph shows mean
SD of WT (EV: N = 28; hlh-30 RNAi: N = 29; pha-4 RNAi: N = 23 worms) and eat-2(ad1116) mutants (EV: N = 49; hlh-30 RNAi: N = 32; pha-4 RNAi: N = 52 worms). ***P < 0.001, ****P < 0.0001, Two-way ANOVA with Tukey’s multiple comparison test. (g and h) Lifespan analyses of N2 and sams-1(ok2946) worms fed with EV or hlh-30 RNAi (G), pha-4 RNAi (H) bacteria from day 1 adulthood at 20°C. Please see Table S1 for detailed statistics.
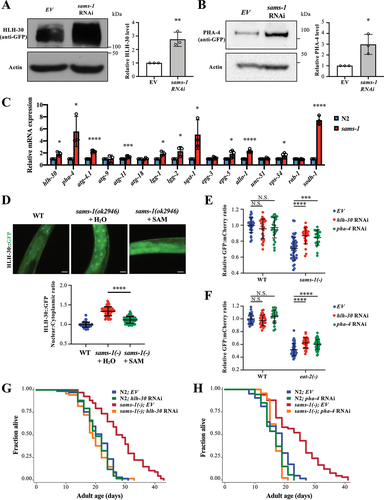
To investigate whether SAM-dependent methylation is involved in the regulation of HLH-30 and PHA-4, we supplemented the diet of sams-1 RNAi mutants with additional SAM. We found that SAM supplementation significantly abolished the HLH-30 nuclear translocation and the increased hlh-30 and pha-4 expression induced by sams-1 depletion ( and Fig. S2B). Moreover, SAM supplementation largely reversed the upregulation of autophagy-related gene expression in sams-1(ok2946) mutants (Fig. S2B), suggesting that certain SAM-dependent cellular processes might contribute to the regulation of HLH-30, PHA-4 and autophagic activity in sams-1 mutants.
To examine whether HLH-30 or PHA-4 activity is required for the increased autophagic activity and longevity observed in sams-1 mutants, we first assessed the impact of hlh-30 or pha-4 RNAi on the autophagic activities in these animals. We found that knockdown of hlh-30 or pha-4 significantly suppressed the increased autophagic flux in sams-1(ok2946) mutants and, to a lesser extent, the eat-2(-) DR animals (). Furthermore, the increased number of GFP::LGG-1 puncta in the pharyngeal cells, intestinal cells, hypodermal seam cells and muscle cells of sams-1 mutants were all greatly suppressed by the knockdown of hlh-30 or pha-4 (Fig. S3). Similarly, knockdown of hlh-30 or pha-4 completely suppressed the lifespan extension of sams-1(ok2946) mutants (), indicating that HLH-30 or PHA-4 activity is essential to the lifespan extension of sams-1(ok2946) mutants. Taken together, our results show that sams-1 might regulate the expression and activity of both HLH-30 and PHA-4 to mediate both autophagy and lifespan.
SET-2, an H3K4 methyltransferase, modulates autophagy via HLH-30/TFEB and PHA-4/FOXA
Since SAM supplementation fully abrogated the HLH-30 nuclear translocation phenotype in sams-1 mutants, we hypothesized that a methyltransferase(s) acts downstream of SAMS-1 to regulate HLH-30 activity. Thus, we performed a small-scale protein methyltransferase RNAi screen using HLH-30 nuclear translocation as a readout (Fig. S4A). Among the methyltransferase genes we have tested, we found that RNAi of set-2 methyltransferase increased HLH-30 nuclear translocation (Fig. S4A). Similarly, null mutation of set-2 [Citation23] significantly increased the HLH-30 nuclear translocation (). It is worth noting that the HLH-30 nuclear:cytoplasmic ratio was higher in sams-1(ok2946) than in set-2(bn129) null mutants (), suggesting a stronger induction of HLH-30 nuclear translocation in sams-1 mutants than in set-2 mutants. Thus, it is plausible that other genes may also act downstream of sams-1, parallel to set-2, to regulate HLH-30 nuclear translocation.
Figure 3. SET-2, an H3K4 methyltransferase, modulates autophagy via HLH-30/TFEB and PHA-4/FOXA. (a) HLH-30::GFP nuclear:cytoplasmic ratio in int1 intestinal cells of WT, set-2(bn129) and sams-1(ok2946) worms expressing hlh-30::gfp. Mean SD are shown (N = 50 cells). ****P < 0.0001, One-way ANOVA with Tukey’s multiple comparison test. (b) Representative HLH-30::GFP immunoblot of worms expressing hlh-30::gfp fed with EV or set-2 RNAi bacteria. Worm were fed with respective bacteria from hatching and the whole-cell extracts of adult day 1 worms were subjected to immunoblotting using anti-GFP or anti-actin antibodies. Graph shows abundance of HLH-30::GFP normalized to actin. Mean
SD of three independent experiments are shown. *P < 0.05, Student’s t-test. (c) Representative PHA-4::GFP immunoblot of worms expressing pha-4::gfp fed with EV or set-2 RNAi bacteria. Worm were fed with respective bacteria from hatching and the whole-cell extracts of adult day 1 worms were subjected to immunoblotting using anti-GFP or anti-actin antibodies. Graph shows abundance of PHA-4::GFP normalized to actin. Mean
SD of three independent experiments are shown. **P < 0.01, Student’s t-test. (d) Relative hlh-30 and pha-4 mRNA abundance in N2 and set-2(bn129) worms at L4 larvae stage by QPCR analysis. Mean
SD of three independent experiments are shown. *P < 0.05, ***P < 0.001, Student’s t-test. (e) GFP::LGG-1-positive puncta were quantified in the body-wall muscle, proximal intestinal cells, terminal pharyngeal bulb and hypodermal seam cells of day 1 adult WT and set-2(ok952) expressing lgg-1p::gfp::lgg-1 or lgg-1::gfp::lgg-1(G116A). Graphs show mean
SEM of GFP::LGG-1 puncta in body-wall muscles (WT-LGG-1: N = 66; WT-LGG-1(G116A): N = 46; set-2(ok952)-LGG-1: N = 54; set-2(ok952)-LGG-1(G116A): N = 51 worms), proximal intestinal cells (WT-LGG-1: N = 63; WT-LGG-1(G116A): N = 58; set-2(ok952)-LGG-1: N = 58; set-2(ok952)-LGG-1(G116A): N = 62 cells), terminal pharyngeal bulb (WT-LGG-1: N = 29; WT-LGG-1(G116A): N = 30; set-2(ok952)-LGG-1: N = 30; set-2(ok952)-LGG-1(G116A): N = 32 worms) and hypodermal seam cells (WT-LGG-1: N = 90; WT-LGG-1(G116A): N = 104; set-2(ok952)-LGG-1: N = 83; set-2(ok952)-LGG-1(G116A): N = 92 cells). *P < 0.05, ****P < 0.0001, Two-way ANOVA with Tukey’s multiple comparison test.(f) GFP and mCherry fluorescent images of day 1 adult WT and set-2(bn129) worms expressing gfp::lgg-1::mcherry::lgg-1ΔG. Scale bar: 100 µm. Graph shows the relative GFP:mCherry fluorescence signal ratio of individual worms, normalized to the mean of WT. Mean
SD are shown (WT: N = 24; set-2(bn129): N = 23 worms). ****P < 0.0001, Student’s t-test. (g) Graph shows the relative GFP:mCherry fluorescence signal ratio of WT or set-2(bn129) worms expressing gfp::lgg-1::mcherry::lgg-1ΔG fed with EV, hlh-30 or pha-4 RNAi bacteria. Worms were fed with EV, hlh-30 or pha-4 RNAi bacteria from hatching, and L4 worms were imaged. The relative GFP:mCherry fluorescence signal ratio of individual worms was normalized to the mean of WT worms fed with EV bacteria. Graph shows mean
SD of WT (EV: N = 24; hlh-30 RNAi: N = 23; pha-4 RNAi: N = 25 worms) and set-2(bn129) mutants (EV: N = 21; hlh-30 RNAi: N = 21; pha-4 RNAi: N = 24 worms). **P < 0.01, ****P < 0.0001, Two-way ANOVA with Tukey’s multiple comparison test.
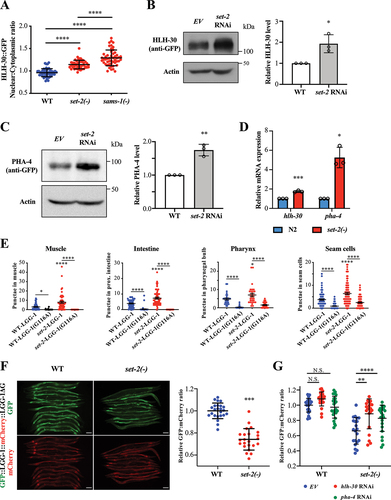
Similar to sams-1 depletion, set-2 depletion also increased the mRNA and protein expressions of HLH-30 and PHA-4 (). Furthermore, we found an increased number of GFP::LGG-1 puncta in the hypodermal seam cells, muscle cells, pharyngeal bulb and intestinal cells of set-2(ok952) mutants, suggesting an increased autophagy activity in set-2(ok952) mutants (). GFP:mCherry signal ratio was also reduced in the set-2(bn129) mutants expressing gfp::lgg-1::mcherry::lgg-1ΔG, indicating an increased autophagic flux (). Moreover, we found that this increase in autophagic flux requires the activities of HLH-30 and PHA-4 (). Intriguingly, the increased number of GFP::LGG-1 puncta in all cell types, except the muscle cells, of set-2(ok952) mutants were significantly suppressed by the knockdown of hlh-30 or pha-4 (Fig. S3). Together, our results indicate that set-2 depletion might activate HLH-30 and PHA-4 to enhance autophagy activity. Consistently, the expression of autophagy-related genes was also increased in set-2(bn129) mutants (Fig. S4B).
SET-2 is an ortholog of mammalian histone H3K4 methyltransferase SET1, which has previously been shown to regulate worm lifespan by modulating fat metabolism [Citation24,Citation25]. Our data suggest that autophagy regulation may also underlie set-2-mediated lifespan regulation in addition to fat metabolism switch. Mammalian SET1 is the methyltransferase subunit of the Complex of Proteins Associated with Set1 (COMPASS) complex which comprises several other subunits [Citation26]. The CFP-1 subunit has a DNA binding domain which allows the COMPASS complex to approach and methylate histone [Citation27]. Notably, cfp-1 mutants and set-2 mutants share several phenotypes including reduced global H3K4me3 level [Citation28]. We thus used cfp-1 mutants to further probe the role of histone methylation in the regulation of HLH-30. We found that the nuclear translocation of HLH-30 was also increased in cfp-1 RNAi mutants (Fig. S4C), strongly suggesting that H3K4 methylation regulates HLH-30 activation.
SET-2 acts in the DR pathway and requires autophagy-related genes to promote longevity
To further understand the role of SET-2 in DR-induced longevity, we performed various genetic epistasis analyses to probe the genetic relationships of set-2 with sams-1 and DR in lifespan regulation. We first created set-2 overexpressing strains that increased the global H3K4me3 level, and ameliorated the longevity phenotype of set-2(bn129) mutants (Fig. S5A, B). We found that set-2 overexpression ameliorated the longevity phenotype of sams-1 mutants (), suggesting that set-2 acts downstream of sams-1 in lifespan regulation. Consistently, we also found that set-2 depletion failed to further extend the lifespan of either eat-2 or sams-1 mutants (Fig. S5C, D). Given these results and that sams-1 acts in the DR pathway [Citation18], set-2 should also act downstream of DR. Indeed, we found that set-2 overexpression reduced the lifespan of eat-2(ad1116) mutants (). These findings suggest that set-2 acts downstream of sams-1 in the regulation of DR-induced longevity.
Figure 4. SET-2 acts in the DR pathway and requires autophagy-related genes to promote longevity. (a) Lifespan analysis of N2 and set-2 OE worms fed with empty vector (EV) or sams-1 RNAi bacteria from hatching at 20°C. (b) Lifespan analysis of N2, set-2 OE, eat-2(ad1116), and eat-2(ad1116);set-2 OE worms fed on OP50 at 20°C. (c-f) Lifespan analyses of N2 and set-2(ok952) worms fed with EV or hlh-30 RNAi (C), pha-4 RNAi (D), vps-34 RNAi (E), lgg-1/lgg-2 RNAi (F) bacteria from day 1 adulthood at 20°C. Please see Table S1 for detailed statistics.
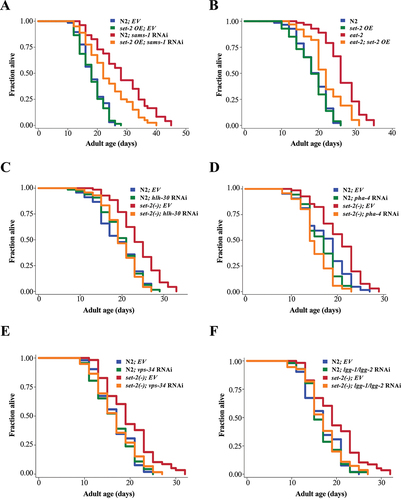
We then asked if autophagy-related transcription factors and genes are also required for the lifespan extension of set-2 mutants, as observed in sams-1 mutants () and eat-2 mutants [Citation15]. Knockdown of transcription factors hlh-30 or pha-4 (), or autophagy-related genes bec-1, vps-34 or lgg-1/lgg-2, completely suppressed the lifespan extension of set-2(ok952) mutants ( and Fig. S5E). Similar to set-2 mutants, cfp-1(tm6369) mutants also showed a long-lived phenotype (Fig. S5D), which was completely suppressed by hlh-30 RNAi (Fig. S5E). Taken together, our findings indicate that reduced SET-2 methyltransferase activity activates HLH-30 and PHA-4 to mediate DR-induced longevity.
AMX-1 H3K4 demethylase antagonizes SET-2 in the regulation of HLH-30/TFEB
To identify the demethylase that can counteract the function of SET-2 in mediating DR responses, we performed an unbiased RNAi screen of all putative demethylases in C. elegans. We found that RNAi of amx-1, a histone H3K4 demethylase, or jmjd-2, an H3K9 and H3K36 demethylases, partially suppressed starvation-induced HLH-30 nuclear translocation (Fig. S6A). In contrast to set-2(bn129) mutants, the global H3K4me3 levels were increased in amx-1(ok659) animals (Fig. S6B). Moreover, the effect of set-2 knockdown on global H3K4me3 level could be canceled out by amx-1 depletion (Fig. S6C). These findings suggest that AMX-1 and SET-2 may antagonize each other in the regulation of H3K4me3 and HLH-30 nuclear translocation.
We next investigated the impact of amx-1 depletion on SAMS-1/SET-2-mediated HLH-30 activation. We found that amx-1 RNAi inhibited HLH-30 nuclear translocation induced by sams-1 RNAi (). We also found that HLH-30 nuclear translocation in eat-2(ad1116) and set-2(bn129) animals were both suppressed by amx-1 RNAi (). RNAi knockdown of amx-1 also reduced the mRNA and protein expressions of hlh-30 in eat-2 ( and Fig. S6D) and set-2 mutants (). Similarly, the mRNA expression of pha-4 was reduced in eat-2 mutants when amx-1 is knock downed (Fig. S6F).
Figure 5. AMX-1 H3K4 demethylase antagonizes SET-2 in the regulation of HLH-30/TFEB. (a) HLH-30::GFP nuclear:cytoplasmic ratio in int1 intestinal cells of day 2 adult worms expressing hlh-30::gfp. The worms were fed with empty vector (EV) or sams-1 RNAi bacteria from hatching and transferred to EV or amx-1 RNAi bacteria at L4 stage. Mean SD are shown (N = 50 cells). ****P < 0.0001, One-way ANOVA with Tukey’s multiple comparison test. (b) HLH-30::GFP nuclear:cytoplasmic ratio in int1 intestinal cells of day 1 adult eat-2(ad1116) (left panel) or set-2(bn129) (right panel) mutants expressing hlh-30::gfp. The worms were fed with EV or amx-1 RNAi bacteria from hatching. Mean
SD are shown (N = 50 cells). ****P < 0.0001, Student’s t-test. (c) Relative hlh-30 mRNA abundance in L4 larvae of eat-2(ad1116) (left panel) or set-2(bn129) (right panel) worms fed with EV or amx-1 RNAi bacteria from hatching by QPCR analysis. Mean
SD of three independent experiments are shown. *P < 0.05, ***P < 0.001, ****P < 0.0001, Student’s t-test. (d) Graph shows the relative GFP:mCherry fluorescence signal ratio of day 1 adult worms expressing gfp::lgg-1::mcherry::lgg-1ΔG fed with EV or amx-1 RNAi bacteria followed by EV or sams-1 RNAi bacteria. Worms were first fed with EV or sams-1 RNAi bacteria from hatching. L3/L4 larvae were then transferred to plates seeded with EV or amx-1 RNAi bacteria and the day 1 adult worms were imaged. The relative GFP:mCherry fluorescence signal ratio of individual worms was normalized to the mean of EV. Mean
SD are shown (EV: N = 24; amx-1 RNAi: N = 24; sams-1 RNAi: N = 24; sams-1 + amx-1 RNAi: N = 25 worms). ****P < 0.0001, for interaction between two variables in Two-way ANOVA.Two-way ANOVA. (e-g) Lifespan analyses of N2 and sams-1(ok2946) (E), set-2(ok952) (F), eat-2(ad1116) (G) worms fed with EV or amx-1 RNAi bacteria from day 1 adulthood at 20°C. Please see Table S1 for detailed statistics.
Furthermore, amx-1 RNAi suppressed the activated autophagic flux induced by sams-1 RNAi, which shows that amx-1 regulates autophagy activation (). We then asked whether amx-1 is required for lifespan extension induced by DR. Through genetic epistasis analyses, we found that knockdown of amx-1 significantly shortened the lifespans of sams-1(ok2946), set-2(ok952), and eat-2(ad1116) mutants (). Taken together, our results indicate that amx-1 antagonizes set-2 in the regulation of both autophagy and longevity.
SET-2 and AMX-1 modulate H3K4me3 levels to control HLH-30/TFEB and PHA-4/FOXA expression
Since SET-2 and AMX-1 control the dynamics of histone H3K4 trimethylation, we thus hypothesized that expression of HLH-30 and PHA-4 is regulated transcriptionally by H3K4 trimethylation status at the hlh-30 and pha-4 promoter region. We hypothesized that a reduction of SAMS-1 expression in response to DR [Citation18] would decrease SAM level and cause downregulation of H3K4me3 levels at the hlh-30 and pha-4 promoter. To test our hypothesis, we first examined the global H3K4me3 levels in sams-1 and eat-2 mutants. Here, we included WDR-5, a core subunit of the worm H3K4me3 methyltransferase complex, and RBR-2, a known H3K4me3 demethylase in C. elegans [Citation24], as a positive and negative control, respectively. We found that the global H3K4me3 levels were markedly decreased in sams-1(ok2946) and eat-2(ad1116) mutants ().
Figure 6. SET-2 and AMX-1 modulate H3K4me3 level to control HLH-30/TFEB and PHA-4/FOXA expression. (a) Representative H3K4me3 immunoblot of N2, eat-2(ad1116), sams-1(ok2946), wdr-5(ok1417) and rbr-2(tm1231) worms. The whole-cell extracts of L4 worms were subjected to immunoblotting using anti-H3K4me3 or anti-H3 antibodies. WDR-5, a core subunit of the H3K4me3 methyltransferase complex, was included here as a positive control. RBR-2, a known H3K4me3 demethylase, was included here as a negative control. (b) ChIP-QPCR analysis of H3K4me3 level at hlh-30 promoter in N2, sams-1(ok2946) and set-2(bn129) at L4 larval stage. Primer pairs a and b recognized two different sites at hlh-30 promoter. IgG antibody was used as a negative control. An intergenic region at chromosome IV (ChrIV) was used as a control site. Mean SD of three independent experiments are shown. ***P < 0.001, One-Way ANOVA with Dunnett’s test relative to N2. (c) ChIP-QPCR analysis of HLH-30::GFP at hlh-30 promoter in WT, sams-1(ok2946) and set-2(bn129) worms expressing hlh-30p::hlh-30::gfp at L4 larval stage. N2 strain was used as a control strain. Mean
SD of three independent experiments are shown. *P < 0.05, ****P < 0.0001, One-Way ANOVA with Dunnett’s test relative to WT strain expressing hlh-30p::hlh-30::gfp. (d) ChIP-QPCR analysis of H3K4me3 level at pha-4 promoter in N2, sams-1(ok2946) and set-2(bn129) at L4 larval stage. Primer pairs a and b recognized two different sites at pha-4 promoter. IgG antibody was used as a negative control. An intergenic region at chromosome IV (ChrIV) was used as a control site. Mean
SD of three independent experiments are shown. ***P < 0.001, One-Way ANOVA with Dunnett’s test relative to N2. (e-f) ChIP-QPCR analyses of H3K4me3 level at hlh-30 promoter (E), or pha-4 promoter (F) in N2 and amx-1(ok659) at L4 larval stage. Mean
SD of three independent experiments are shown. ***P < 0.001, ****P < 0.0001, Student’s t-test.
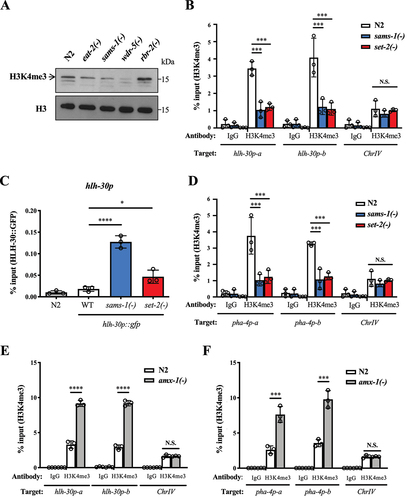
We then looked into the H3K4me3 level at hlh-30 promoter in set-2 and sams-1 mutants by chromatin immunoprecipitation (ChIP) assays. We found that the H3K4me3 level at hlh-30 promoter was significantly reduced in set-2(bn129) and sams-1(ok2946) mutants (). Previously, H3K4me3 was thought to act as an active chromatin mark [Citation29]. However, emerging evidence has demonstrated that the role of H3K4me3 is context dependent and may repress stress-induced transcription [Citation28,Citation30–32]. Our data suggest that H3K4me3 may have a repressive role in the transcription of hlh-30. We then examined the binding of HLH-30 at its own promoter in sams-1 and set-2 mutants by ChIP assay, as HLH-30 has been reported to bind at its promoter to induce its own expression [Citation33]. Therefore, an increased HLH-30 binding at its own promoter indicates an increased promoter activity. We found that HLH-30 recruitment to its promoter was increased in both sams-1(ok2946) and set-2(bn129) mutants (). Thus, in sams-1 and set-2 mutants, low H3K4me3 levels and increased HLH-30 binding at the hlh-30 promoter are likely to correspond to induced hlh-30 transcription in these animals.
DR increases the expression of pha-4, yet the underlying mechanism of such induction is completely unknown [Citation17]. We hypothesized that pha-4 expression, similar to hlh-30, is also controlled by changes in H3K4me3 level. Here, we found that the H3K4me3 level at pha-4 promoter was also decreased in sams-1(ok2946) and set-2(bn129) mutants when compared to WT N2 (), suggesting that the induction of both hlh-30 and pha-4 during starvation is a result of histone mark changes. Consistently, the H3K4me3 levels at hlh-30 and pha-4 promoters were increased in the amx-1 mutants (). Together, our findings suggest that DR may regulate the dynamics of H3K4me3 via SAMS-1 and SET-2 to control the expression of hlh-30 and pha-4, and consequently autophagy and longevity.
HLH-30/TFEB and PHA-4/FOXA collaboratively regulate autophagy and lifespan
It is intriguing that depleting either hlh-30 or pha-4 alone is sufficient to completely suppress the longevities of eat-2 [Citation14,Citation17], sams-1 (), and set-2 mutants (). Both activated HLH-30 and PHA-4 have been shown to bind at the promoters of autophagy-related genes [Citation12,Citation22]. A recently published paper showed that HLH-30 and DAF-16, which is also a forkhead transcription factor, co-occupy target promoters and coregulate many target genes [Citation34]. We thus hypothesized that HLH-30 and PHA-4 may also co-occupy promoters of autophagy-related genes and coregulate their transcription.
To test this hypothesis, we analyzed the HLH-30 and PHA-4 ChIP-sequencing datasets available at the modENCODE project (ftp://data.modencode.org/). Analysis of the binding site distribution showed that HLH-30 and PHA-4 binding sites were enriched within ~50 bp upstream of the transcription start site (TSS) (). We then found that 51% of of HLH-30 binding sites overlapped with PHA-4 binding sites, while 38% of PHA-4 binding sites overlapped with HLH-30 binding sites (). We identified 886 genes whose promoter region contains both HLH-30 and PHA-4 binding sites (). Notably, the datasets were derived from fed worms, indicating that there is a basal level of binding of these two transcription factors to the common target genes under unstimulated condition.
Figure 7. HLH-30/TFEB and PHA-4/FOXA collaboratively regulate autophagy and lifespan. (a-d) HLH-30 and PHA-4 ChIP-seq data of L4 worms expressing hlh-30::gfp and pha-4::gfp respectively were downloaded from modENCODE project (ftp://data.modencode.org/). (A) Graph shows enrichment of HLH-30 and PHA-4 at ±3 kb of transcription start sites (TSS) associated with 13,117 known genes across the genome. Data of two independent ChIP-seq experiments were shown. (b) Venn diagram shows the total number of HLH-30 and PHA-4 binding sites, and overlapped binding sites in L4 worms. 1475 overlapped binding sites were identified, which represented 38% of all PHA-4 binding sites and 51% of all HLH-30 binding sites. *P < 0.0001, Fisher’s exact test was used to test the significance of the overlaps. 886 genes were then identified to contain both HLH-30 and PHA-4 binding sites at their promoter regions. (c) Distribution of distances between HLH-30 and PHA-4 peak centers. HLH-30 peak center is denoted as 0 bp; negative and positive values indicate the distance of a PHA-4 peak center upstream and downstream of HLH-30 respectively on the genome. (d) Gene Ontology (GO) term enrichment analysis of the 886 common target genes whose promoter region contains both HLH-30 and PHA-4 binding sites. 10 GO terms with the lowest q values are shown. (e,f) ChIP-QPCR analyses of HLH-30::GFP (E), and PHA-4::GFP (F) at lgg-1 promoter in WT, sams-1(ok2946) and set-2(bn129) worms expressing hlh-30p::hlh-30::gfp and pha-4p::pha-4::gfp respectively at L4 larval stage. N2 strain was used as a control strain. An intergenic region at chromosome IV (ChrIV) was used as a control site. Mean SD of three independent experiments are shown. *P < 0.05, **P < 0.01, One-way ANOVA with Dunnett’s test relative to WT strain expressing hlh-30p::hlh-30::gfp or pha-4p::pha-4::gfp. (g,h) ChIP-QPCR analyses of HLH-30::GFP (G), and PHA-4::GFP (H) at lgg-1 and sodh-1 promoter in sams-1(ok2946) worms expressing hlh-30p::hlh-30::gfp fed with EV or pha-4 (G), hlh-30 (H) RNAi bacteria at L4 larval stage. An intergenic region at chromosome IV (ChrIV) was used as a control site. Mean
SD of three independent experiments are shown. N.S. no significance, Student’s t-test.
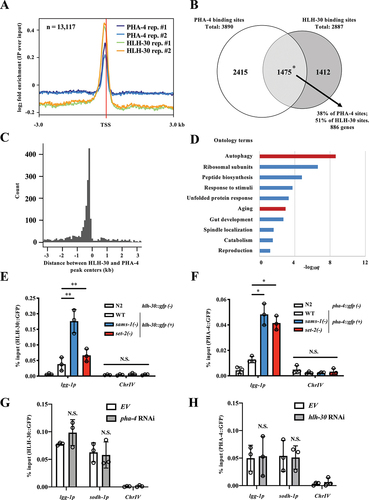
We then compared the distances between peak centers of HLH-30 and PHA-4. The distance distribution revealed that the majority of the distances between their peak centers were ~100 bp, indicating that the two transcription factors are present close to one another on the genome (). These data show that these two transcription factors may co-occupy the same promoter regions or at least bind to nearby sites to cooperatively regulate the transcriptions of their common targets.
We then performed a Gene Ontology (GO) enrichment analysis to determine the functional annotations of these 886 common target genes. As expected, we found “autophagy” and “aging” to be over-represented (). Interestingly, some of the most significant GO terms were ribosome and peptide synthesis, which are also implicated in aging regulation [Citation35].
These common targets included several autophagy-related genes such as lgg-1, whose expression was upregulated in sams-1(ok2946) and set-2(bn129) mutants (, Fig. S4B). We found that hlh-30 or pha-4 alone was required for the induction of lgg-1 mRNA in sams-1(ok2946) or set-2(bn129) mutants, suggesting that these two transcription factors may cooperatively regulate the transcriptional induction of lgg-1 (Fig. S7A). We then performed ChIP assays using primers that recognize the binding sites of both HLH-30 and PHA-4 at lgg-1 promoter (Fig. S7B). Consistent with the ChIP-seq analyses, we found that both HLH-30 and PHA-4 bound at lgg-1 promoter under unstimulated condition (). The bindings of both transcription factors at lgg-1 promoter were increased in the sams-1(ok2946) and set-2(bn129) mutants, which likely lead to the transcriptional induction of lgg-1.
To further investigate whether there are additional genes regulated by HLH-30 and PHA-4 in response to DR through a similar mechanism, we went back to the HLH-30 and PHA-4 ChIP-sequencing datasets. Through the analysis of ChIP-sequencing datasets from the abovementioned modENCODE project, we identified 381 genes whose promoters are differentially bound by PHA-4 during starvation, but not during the ad libitum. We then compared these 381 genes with all the potential HLH-30 target genes () and found 37 overlapping genes (File S2). We then examined some of these overlapping genes that have been previously linked to aging or autophagy regulation (i.e. aakb-1, mnk-1, rilp-1, and cpl-1) as well as several autophagy-related genes found to be upregulated in sams-1 mutants (i.e. lgg-2, sqst-1, atg-4.1, epg-3, and allo-1; ) by ChIP-QPCR analysis. We have confirmed that HLH-30 and PHA-4 indeed bind at the promoter of these genes (Fig. S7C, D) and found that the bindings of HLH-30 at the promoters of all nine of these genes were significantly increased in the sams-1(ok2946) animals (Fig. S7C), whereas the bindings of PHA-4 at the promoter of at least five of these genes (lgg-2, sqst-1, atg-4.1, epg-5, and mnk-1) were significantly increased in the sams-1 mutants (Fig. S7D).
In addition to the autophagy-related genes, we have also investigated another potential common target of HLH-30 and PHA-4, sodh-1 (sorbitol dehydrogenase-1). sodh-1 is one of the 37 overlapping genes identified from our analysis of HLH-30 and PHA-4(starved) ChIP-seq datasets (File S2). Interestingly, we found that the expression of sodh-1 was also increased in sams-1(ok2946) and set-2(bn129) mutants (). Moreover, we found that hlh-30 or pha-4 was required for the induction of sodh-1 in sams-1(ok2946) and set-2(bn129) mutants (Fig. S7E). Similar to lgg-1, HLH-30 and PHA-4 also bound at sodh-1 promoter, and their bindings were increased in sams-1(ok2946) and set-2(bn129) mutants (Fig. S7F, G).
Interestingly, we found that the binding of HLH-30 at the promoter regions of lgg-1 and sodh-1 was not affected by RNAi knockdown of pha-4 and the binding of PHA-4 at the promoter regions of lgg-1 and sodh-1 was not affected by RNAi knockdown of hlh-30 neither (). Moreover, co-immuneprecipitation (co-IP) experiments of HLH-30::GFP and PHA-4::HA failed to pull down each other (Fig. S8A), indicating no direct interaction between these two transcription factors. Therefore, taken together, our findings suggest that HLH-30 and PHA-4 may independently bind to adjacent sites, instead of co-occupying the same sites, at the promoter regions of their common targets to collaboratively control their transcription.
Lastly, we found that the lifespan of hlh-30 and pha-4 double mutants was comparable to pha-4 mutants alone in N2 WT, sams-1(ok2946) or set-2(bn129) animals (Fig. S8B). These data suggest that hlh-30 and pha-4 act in the same genetic pathway in the context of longevity, which is consistent with our model that these two transcription factors act together to regulate autophagy and longevity.
Discussion
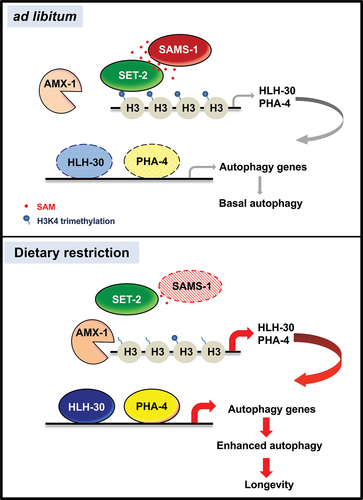
Dietary restriction, including restriction of total caloric intake at various stages of life or restriction of specific nutrient components (e.g., methionine restriction), has been proven to be a robust way to slow aging and extend lifespan across taxa. Recently, autophagy and methionine metabolism have emerged as key players for the regulation of aging [Citation36]. However, the detailed molecular mechanism linking DR, methionine metabolism and chromatin remodeling to autophagy and aging remains unclear. In this study, we have demonstrated a molecular mechanism linking nutritional inputs to transcriptional outputs via the SAM producing enzyme SAMS-1 and the methyltransferase SET-2 (). We showed that DR may influence autophagy and longevity by regulating SAM level and consequently the methylation of histone H3K4 to control the expression and activity of two key transcription factors, HLH-30 and PHA-4, simultaneously. Most interestingly, we found that HLH-30 and PHA-4 might act collaboratively by occupying, in close proximity, the promoter region of their common targets, which include known autophagy-related genes and longevity genes.
Figure 8. Model of autophagy and longevity through SAM-dependent methylation. Proposed model of dietary restriction-mediated longevity through SAMS-1/SET-2 axis, H3K4 methylation and HLH-30/PHA-4 module that collaboratively regulates expression of autophagy-related genes. Under ad libitum condition, SAMS-1 synthesis SAM, which serves as the substrate for histone H3K4 methylation by SET-2. There is a basal level of hlh-30 and pha-4 transcription that provides basal autophagy-related genes transcription. Under DR condition, sams-1 level reduces and thus there is less SAM for H3K4 methylation catalyzed by SET-2. The AMX-1 activity outweighs the SET-2 activity. Therefore, the hypomethylation of H3K4me3 at hlh-30 and pha-4 promoters enhances their transcription, which in turn leads to an increased transcription of autophagy-related genes to activate autophagy and increase longevity.
Previous studies showed that SAM availability controls histone methylation in the contexts of stemness [Citation37] and immunity [Citation38]. Here, we provided evidence that under DR condition, SAM availability was reduced to control autophagy and aging via SET-2 H3K4 methyltransferase. RBR-2 is an H3K4 demethylase that counteracts set-2-mediated lifespan regulation [Citation24]. However, in our unbiased demethylase RNAi screen, the RNAi of amx-1 and jmjd-2 demethylases, instead of rbr-2, suppressed DR-induced HLH-30 nuclear translocation and longevity. This suggests that there are likely more than one demethylases that antagonize set-2 to modulate aging, possibly through different biological processes. It is also possible that distinct antagonization occurs in different longevity paradigms. Our study also shows SET-2 as a regulator of HLH-30 nuclear translocation, yet the underlying mechanism remains unknown. It is possible that a highly-induced HLH-30 expression in set-2 mutants is sufficient to promote a modest HLH-30 nuclear localization. This may be enhanced by other genes that lie downstream of sams-1. Alternatively, SET-2 may control the expression of regulators of HLH-30 nuclear translocation. Lastly, SET-2 may directly methylate HLH-30 to facilitate nuclear export of HLH-30, given that HLH-30 constantly shuttles between cytosol and nucleus [Citation39]. It is noteworthy to point out that these three mechanisms are not mutually exclusive.
The activation of hlh-30 and pha-4 expression upon starvation have been previously reported [Citation14,Citation17]. Interestingly, starvation cannot induce hlh-30 transcript expression in the hlh-30(tm1978) mutants, indicating that HLH-30 protein is required to induce hlh-30 expression in an autoregulatory loop [Citation33]. Taken together with our findings, it is plausible that reduced H3K4me3 level at hlh-30 promoter region under DR condition enhances HLH-30 binding, which subsequently upregulates hlh-30 expression. On the other hand, it was unknown how pha-4 expression is regulated, despite its genetic importance in the regulation of autophagy and longevity in DR and germline-less animals [Citation16,Citation17]. Here, we showed that the expression of PHA-4, similar to HLH-30, may be controlled by diet-modulated histone methylation changes.
Transcription factors such as HLH-30/TFEB, PHA-4/FOXA and MML-1/Mondo have all been reported to control autophagy-related genes yet it is unclear if these transcription factors act independently or collaboratively [Citation40]. Recently, HLH-30 and DAF-16 have been shown to co-occupy target promoters and coregulate many target genes in the long-lived daf-2 mutants [Citation34]. In this study, we found that HLH-30 and PHA-4 may independently binds to adjacent sites to collaboratively control autophagy and lifespan-related genes in DR animals. By comparing the two studies, we found that while DAF-16/HLH-30 common targets and PHA-4/HLH-30 common targets are both enriched in aging, stress response, and translation-related genes, autophagy-related genes are particularly enriched in PHA-4/HLH-30 common targets. Interestingly, even though HLH-30 is universally activated in distinct long-lived mutants, different combinations of autophagy-related genes are activated [Citation14]. Thus, HLH-30 may work with different transcription factors to control distinct subsets of target genes in response to different stimuli.
In addition to autophagy, HLH-30 or PHA-4 is required for lipid remodeling during stressful conditions [Citation33,Citation41,Citation42]. SET-2 has also been implicated in lipid remodeling by controlling the expression of lipid metabolism-related genes [Citation25]. Therefore, the SAMS-1/SET-2 axis may also control lipid remodeling through HLH-30 and PHA-4. To this end, we found that HLH-30 and PHA-4 also regulated a non-autophagy, metabolic gene sodh-1. GO analysis of the common targets of HLH-30 and PHA-4 also showed enrichment of genes involved in the regulation of ribosome, peptide synthesis and unfolded protein response. It would be interesting to explore the role of other biological processes controlled by both HLH-30 and PHA-4 in the regulation of DR-induced longevity. In conclusion, our findings provide a detailed mechanism to explain how DR modulates autophagy to regulate longevity. In this model, the activities of HLH-30/TFEB and PHA-4/FOXA are coordinately regulated through an epigenetic mechanism that involves SAM-dependent methylation. DR modulates SET-2 activity, by controlling the availability of SAM, to simultaneously regulate the expression of HLH-30/TFEB and PHA-4/FOXA, two transcription factors that occupy, in close proximity, the promoter of their common targets, including autophagy-related genes. Genes involved in this regulation, such as SAMS-1 and SET-2, may thus serve as potential therapeutic targets for anti-aging interventions.
Materials and methods
C. elegans strains
All strains were cultured on NGM plates (0.25% peptone, 50 mM NaCl, 25 mM KPO4, pH 6.0, 5 ug/ml cholesterol, 1 mM CaCl2, 1 mM MgCl2, 2% agar) seeded with E. coli OP50 at 20°C under standard conditions. AD84: pSP1[pha-4p::pha-4a::gfp], DA1116: eat-2(ad1116), DA2123: adIs2122[lgg-1p::gfp::lgg-1 + rol-6], EQ153: sams-1(ok2946), EQ1230: sams-1(ok2946); unc-119(tm4063); wgIs433[hlh-30::TY1::EGFP::3xFLAG + unc-119(+)], EQ1235: eat-2(ad1116); unc-119(tm4063); wgIs433[hlh-30::TY1::EGFP::3xFLAG + unc-119(+)], EQ1270: set-2(bn129); unc-119(tm4063); wgIs433[hlh-30::TY1::EGFP::3xFLAG + unc-119(+)], EQ1301: iqIs263[eft-3p::gfp::lgg-1::mcherry::lgg-1ΔG + rol-6p::rol-6], EQ1304: iqEx269[set-2p::set-2::gfp + rol-6p::rol-6], EQ1309: amx-1(ok659), EQ1322: set-2(ok952), EQ1461: eat-2(ad1116); iqEx269[set-2p::set-2::gfp + rol-6p::rol-6], EQ1490: set-2(bn129); pSP1[pha-4p::pha-4a::gfp + rol-6], EQ1491: sams-1(ok2946); pSP1[pha-4p::pha-4a::gfp + rol-6], EQ1560: sams-1(ok2946); hlh-30(tm1978), EQ1563: set-2(bn129); hlh-30(tm1978), EQ1607: set-2(bn129); iqEx269[set-2p::set-2::gfp + rol-6p::rol-6], EQ1654: set-2(bn129); iqIs263[eft-3p::gfp::lgg-1::mcherry::lgg-1ΔG + rol-6p::rol-6], EQ1685: eat-2(ad1116); iqIs263[eft-3p::gfp::lgg-1::mcherry::lgg-1ΔG + rol-6p::rol-6], EQ1857: sams-1(ok2946); iqIs263[eft-3p::gfp::lgg-1::mcherry::lgg-1ΔG + rol-6p::rol-6], JIN1375: hlh-30(tm1978), MAH694: sams-1(ok2946); unc-119(ed3); ppIs?[unc-119(+); lgg-1p::gfp::lgg-1(G116A)], MAH734: sams-1(ok2946); adIs2122[lgg-1p::gfp::lgg-1 + rol-6], MAH743: set-2(ok952); adIs2122[lgg-1p::gfp::lgg-1 + rol-6], MAH746: set-2(ok952); unc-119(ed3); ppIs?[unc-119(+); lgg-1p::gfp::lgg-1(G116A)], OP433: unc-119(tm4063); wgIs433[hlh-30::TY1::EGFP::3xFLAG + unc-119(+)], PFR510: set-2(bn129), PFR588: cfp-1(tm6369), RB1304: wdr-5(ok1417), RD202: unc-119(ed3); ppIs?[unc-119(+); lgg-1p::gfp::lgg-1(G116A)], ZR1: rbr-2(tm1231).
Generation of transgenic lines
For the generation of transgenic animals, a plasmid DNA mix was microinjected into the gonad of young adult hermaphrodite animals, using the standard method [Citation43,Citation44]. F1 progenies were selected on the basis of roller phenotype. Individual F2 progenies were isolated to establish independent lines. For the generation of EQ1280 strain, the plasmid DNA mix consisted of 20 ng/ml pAH725 [eft-3p::gfp::lgg-1::mcherry::lgg-1ΔG] and 80 ng/ml pRF4 [rol-6p::rol-6]. EQ1280 was backcrossed to N2 6X to obtain EQ1301. For the generation of EQ1304 strain, the plasmid DNA mix consisted of 20 ng/ml pAH729 [set-2p::set-2::gfp] and 80 ng/ml pRF4 [rol-6p::rol-6]. All the pAH plasmids were constructed by our lab for this study
RNAi treatment
The identities of all RNAi clones were verified by sequencing the inserts using M13-forward primer. RNAi clones were isolated from Julie Ahringer’s RNAi library [Citation45,Citation46], except for jmjd-2, jmjd-4 and rbr-2, which were PCR-cloned and transformed into HT115 bacteria. HT115 bacteria transformed with RNAi vectors expressing dsRNA of the genes of interest were grown at 37°C in LB (UniRegion Bio-Tech, UR-LBB001) with 50 μg/ml carbenicillin (GoldBio, C-103-25). Bacteria cultures were added on NGM-carbenicillin plates, which were then supplemented with 1 mM IPTG (GoldBio, I2481C50). The bacterial strain containing empty vector L4440 (Addgene, 1654, deposited by Andrew Fire) was used as control.
Lifespan analysis
Lifespan analysis was conducted at 20°C as previously described [Citation47]. RNAi treatments were carried out by placing synchronized eggs on plates seeded with HT115 and L4 worms were transferred to plates seeded with RNAi bacteria. Worms were moved to plates with fresh RNAi bacteria every two days until reproduction ceased. Viability of worms was scored every two to three days. The log rank (Mantel-Cox) test was used for statistical analysis.
HLH-30 nuclear localization assay
Worms expressing hlh-30::gfp were mounted on 2% agarose pad in M9 buffer (22 mM KH2PO4, 42 mM Na2HPO4, pH 7.0, 86 mM NaCl) containing 10 mM NaN3 (Sigma-Aldrich, S8032) and imaged using Olympus BX63 with cellSens Dimension software. To calculate nuclear:cytoplasmic ratio, bright-field and fluorescent images of 50 int1 intestinal cells were taken. Nuclei were located in the bright-field images and the fluorescent intensities of nuclei were measured using ImageJ. Two areas, each with a size equivalent to the nucleus, were selected in the cytosol and their fluorescence intensities were measured. Average of these two measurements was calculated to represent the fluorescent intensity of cytosol.
In SAM supplementation experiment, eggs were placed on plates seeded with UV-killed OP50 and supplemented with water (as control) or 20 µM SAM (Sigma-Aldrich, A2408). Adult day 1 worms were then scored for percentage of worms with HLH-30 nuclear translocation.
Quantification of GFP::LGG-1 puncta
Worms were mounted live on a 2% agarose pad in M9 buffer containing 0.1% NaN3 and imaged using a Zeiss Imager Z1 including apotome.2 with a Hamamatsu orca flash 4LT camera and Zen 2.3 software. The total number of GFP::LGG-1/Atg8-positive puncta was counted in body-wall muscle, hypodermal seam cells, the three to four most proximal intestinal cells or the terminal pharyngeal bulb at 1000x magnification. The average and SEM were calculated and data were analyzed using one-way analysis of variance (ANOVA) or two-way ANOVA as applicable.
Western blot
Approximately 500–1,000 worms at desired stage were washed three times with cold M9 buffer. Worm pellets were resuspended in a final concentration of 1.2X SDS sample buffer and boiled for 10 min followed by centrifugation for 10 min. Supernatants were subjected to SDS-PAGE and transferred to a PVDF membrane (Millipore, IPVH00010). The membrane was blocked with 5% Blotting-Grade Blocker (Bio-rad, 170–6404) or 10% BSA (UniRegion Bio-Tech, UR-BSA001) in TBST (1X TBS [50 mM Tris-Cl pH 7.5, 150 mM NaCl] with 0.05% Tween-20 [Amresco, 0777]) at 4°C overnight. The membrane was then probed with primary antibodies (anti-GFP, 1:3,000, Abcam, ab290; anti-actin, 1:2,500, Millipore, MAB1501; anti-H3K4me3, 1:2,500, Abcam, ab8580; anti-H3, 1:5,000, Abcam, ab1791) at room temperature for 1 h and washed four times with TBST. The membrane was then probed with secondary antibodies (anti-rabbit, 1:100,000, Jackson ImmunoResearch, 211–032-171; anti-mouse, 1:100,000, Jackson ImmunoResearch, 115–035-003) at room temperature for 30 min and washed four times with TBST. Immunoblots were detected using chemiluminescent substrates (Millipore, WBKLS0500; GE Healthcare, RPN2235; GeneTex, GTX14698) and visualized by luminescent image analyzer.
RNA isolation, cDNA synthesis, Quantitative-PCR
Approximately 2,000 L4 worms or 1,000 day 2 adult worms were washed three times with cold M9 buffer. Worm pellets were resuspended in 5X volume of TRIzol (Life Technologies, 15596018) and vortexed for 5 min at room temperature. Total RNA was isolated using Direct-zol RNA MiniPrep kit (Zymo Research, R2052). cDNA was synthesized from 1 µg of total RNA using iScript cDNA synthesis kit (Bio-Rad, 1706891). Quantitative PCR experiments were performed using SYBR Green (Applied Biosystems, 4367659) on ABI StepOnePlus Real-Time PCR System. Relative mRNA levels of the genes of interest were calculated and normalized against internal control (cdc-42) and compared to the stated control (=1). Please see Table S2 for primer sequences used.
Chromatin immunoprecipitation (ChIP)
ChIP experiment was performed from modified protocol previously described [Citation48]. ~50,000 L4 worms were washed three times with cold M9 buffer. Worm pellets were resuspended in crosslinking buffer (1% formaldehyde in 1x PBS) and homogenized using Dounce tissue grinder (Kimble, 885300). The suspensions were gently agitated for 20 min and quenched with 125 mM of glycine followed by another agitation for 15 min. After centrifugation, the pellets were snap frozen in liquid nitrogen. The pellets were thawed in FA lysis buffer (150 mM NaCl, 50 mM HEPES-KOH pH7.5, 1 mM EDTA, 1% Triton X-100 [Sigma-Aldrich, SI-T8787], 0.1% sodium deoxycholate [Sigma-Aldrich, D6750]) supplemented with protease inhibitor cocktail tablets (Roche, 04693159001) on ice for 10 min. Samples were sonicated to a size range of 200–1000 bp using Diagenode Bioruptor at high setting, with each pulse lasting 30s followed by a 30s pause. Samples were then centrifuged at 4°C for 15 min. The supernatants were transferred to new tubes and the protein concentrations were measured using DC protein assay kit (Bio-Rad, 5000111).
To purify input DNA, 250 mM NaCl was added to 0.3 mg protein of worm lysates. The samples were incubated at 65°C for 4–6 h to reverse crosslinks. 2.5X volume of ice-cold ethanol was added and incubated overnight at −20°C. To perform H3K4me3 IP, 10 ug of anti-H3K4me3 (Abcam, ab8580) or 10 μg of normal rabbit IgG (Santa Cruz Biotechnology, sc2027) was added to 1 mg protein of worm lysates and incubated with gentle agitation at 4°C overnight. Twenty μl of Magna ChIPTM Protein A + G magnetic beads (Millipore, 16–663) were then added into the samples for 2 h at 4°C. To perform GFP IP, 10 μl of Binding Control Magnetic Agarose Beads (Chromotek, bmab-20) was added to 1 mg protein of worm lysates and incubated with gentle agitation at 4°C for 1 h. Beads were then removed and 10 μl of GFP-Trap® (Chromotek, gtma-20) was added, followed by gentle agitation at 4°C overnight. The beads were washed twice with FA lysis buffer, FA-high salt lysis buffer (500 mM NaCl), LiCl solution (250 mM LiCl, 10 mM Tris-HCl, pH 8.0, 0.5% NP40 [Sigma-Aldrich, I3021], 0.5% sodium deoxycholate, 1 mM EDTA) and 1X TE buffer (10 mM Tris-HCl pH8, 1 mM EDTA). The beads were then resuspended in ChIP elution buffer (250 mM NaCl, 1% SDS, 10 mM Tris-HCl pH8, 1 mM EDTA) and incubated at 65°C for 4–6 h to reverse crosslinks. 2.5X volume of ice-cold ethanol was added and incubated overnight at −20°C.
Input and IP samples were centrifuged at 4°C for 15 min and the pellets were air-dried before being resuspended in 200 μl of 1X TE buffer. One μl of 20 mg/ml RNaseA (Thermo Fisher Scientific, EN0531) was added to the suspensions and incubated at 42°C for 30 min. Five μl of 20 mg/ml proteinase K (Thermo Fisher Scientific, 100005393) was then added and incubated at 55°C for 1–2 h. DNA was purified using DNA Clean & Concentrator-5 kit (Zymo Research, D4014). DNA was ready to be analyzed by performing quantitative PCR experiments using SYBR Green (Applied Biosystems, 4367659) on ABI StepOnePlus Real-Time PCR System. Please see Table S2 for primer sequences used.
Bioinformatics analysis of ChIP-seq data
Annotations of transcription start sites were performed in the previous study [Citation49]. Raw sequencing files and peak annotations of PHA-4 and HLH-30 ChIP-seq were downloaded from the modENCODE project (ftp://data.modencode.org/). The binding of transcription factors around the TSS was analyzed by mapping the ChIP-seq reads to the WS220 genome using bowtie2 [Citation50]. BAM files from control and ChIP experiments were further compared by deeptools using bamCompare function to determine the enrichment of corresponding transcription factors [Citation51]. bigWig files generated by bamCompare were assayed by deeptools using computeMatrix and ploProfile to plot the enrichment of transcription factors around the TSS [Citation51]. Overlaps of PHA-4 and HLH-30 binding sites were determined by bedtools using the intersect function [Citation52] and the Venn diagram was plotted by eulerr (https://cran.r-project.org/package=eulerr). The minimum distances between PHA-4 and HLH-30 peaks were determined by the bedtools using the closest function [Citation52] and plotted using tidyverse package in R (https://cran.r-project.org/package=tidyverse). Gene ontology term enrichment analysis was performed using the Wormbase Enrichment Suite [Citation53,Citation54] and the q value threshold was set at 0.1.
Statistical analysis
The statistical details of experiments, including statistical tests used, n value, definition of center and dispersion and precision measures, are outlined in the figure legends. Kaplan-Meier survival analysis and Mantel-Cox log rank test were used to analyze lifespan assay. ImageJ was used in the quantification of fluorescence intensities and Western blots. Graphpad Prism 8 was used for statistical analyses.
Supplemental Material
Download Zip (5.9 MB)Acknowledgments
We thank RAJ Chen and CS Chen for providing the worm strains. Some strains were obtained from Caenorhabditis Genetics Center (University of Minnesota), which is supported by the NIH Office of Research Infrastructure Programs (P40 OD010440). We thank the C. elegans Core Facility of the National Core Facility for biopharmaceuticals, Minister of Science and Technology, Taiwan for its technical support. We also thank the technical assistances of PC Chang and VYM Genome Research Center at National Yang Ming Chiao Tung University. The following funding sources supported this research: Ministry of Science and Technology of Taiwan (MOST 109-2628-B-010-012 to ALH and MOST 110-2311-B-A49A-502 to TTC); National Institute of Aging (AG028664 to MH and AG058038 to CK).
Disclosure statement
No potential conflict of interest was reported by the authors.
Supplementary material
Supplemental data for this article can be accessed here
Additional information
Funding
Related Research Data
References
- Lopez-Otin C, Blasco MA, Partridge L, et al. The hallmarks of aging. Cell. 2013 Jun 6;153(6):1194–1217.
- Bento CF, Renna M, Ghislat G, et al. Mammalian autophagy: how does it work? Annu Rev Biochem. 2016 Jun 2;85(1):685–713.
- Yan Y, Finkel T. Autophagy as a regulator of cardiovascular redox homeostasis. Free Radic Biol Med. 2017 Aug;109:108–113.
- Kiffin R, Christian C, Knecht E, et al. Activation of chaperone-mediated autophagy during oxidative stress. Mol Biol Cell. 2004 Nov;15(11):4829–4840.
- Jiao J, Demontis F. Skeletal muscle autophagy and its role in sarcopenia and organismal aging. Curr Opin Pharmacol. 2017 Jun;34:1–6.
- Hansen M, Rubinsztein DC, Walker DW. Autophagy as a promoter of longevity: insights from model organisms. Nat Rev Mol Cell Biol. 2018 Sep;19(9):579–593.
- Rubinsztein DC, Marino G, Kroemer G. Autophagy and aging. Cell. 2011 Sep 2;146(5):682–695.
- Fernandez AF, Sebti S, Wei Y, et al. Disruption of the beclin 1-BCL2 autophagy regulatory complex promotes longevity in mice. Nature. 2018 Jun;558(7708):136–140.
- Fontana L, Partridge L. Promoting health and longevity through diet: from model organisms to humans. Cell. 2015 Mar 26;161(1):106–118.
- Fullgrabe J, Klionsky DJ, Joseph B. The return of the nucleus: transcriptional and epigenetic control of autophagy. Nat Rev Mol Cell Biol. 2014 Jan;15(1):65–74.
- Roczniak-Ferguson A, Petit CS, Froehlich F, et al. The transcription factor TFEB links mTORC1 signaling to transcriptional control of lysosome homeostasis. Sci Signal. 2012 Jun 12;5(228):ra42.
- Settembre C, Di Malta C, Polito VA, et al. TFEB links autophagy to lysosomal biogenesis. Science. 2011 Jun 17;332(6036):1429–1433.
- Martina JA, Chen Y, Gucek M, et al. MTORC1 functions as a transcriptional regulator of autophagy by preventing nuclear transport of TFEB. Autophagy. 2012 Jun;8(6):903–914.
- Lapierre LR, De Magalhaes Filho CD, McQuary PR, et al. The TFEB orthologue HLH-30 regulates autophagy and modulates longevity in Caenorhabditis elegans. Nat Commun. 2013;4(1):2267.
- Hansen M, Chandra A, Mitic LL, et al. A role for autophagy in the extension of lifespan by dietary restriction in C. elegans. PLoS Genet. 2008 Feb;4(2):e24.
- Lapierre LR, Gelino S, Melendez A, et al. Autophagy and lipid metabolism coordinately modulate life span in germline-less C. elegans. Curr Biol. 2011 Sep 27;21(18):1507–1514.
- Panowski SH, Wolff S, Aguilaniu H, et al. PHA-4/Foxa mediates diet-restriction-induced longevity of C. elegans. Nature. 2007 May 31;447(7144):550–555.
- Hansen M, Hsu AL, Dillin A, et al. New genes tied to endocrine, metabolic, and dietary regulation of lifespan from a Caenorhabditis elegans genomic RNAi screen. PLoS Genet. 2005 Jul;1(1):119–128.
- Melendez A, Talloczy Z, Seaman M, et al. Autophagy genes are essential for dauer development and life-span extension in C. elegans. Science. 2003 Sep 5;301(5638):1387–1391.
- Kaizuka T, Morishita H, Hama Y, et al. An autophagic flux probe that releases an internal control. Mol Cell. 2016 Nov 17;64(4):835–849.
- Settembre C, Zoncu R, Medina DL, et al. A lysosome-to-nucleus signalling mechanism senses and regulates the lysosome via mTOR and TFEB. EMBO J. 2012 Mar 7;31(5):1095–1108.
- Zhong M, Niu W, Lu ZJ, et al. Genome-wide identification of binding sites defines distinct functions for Caenorhabditis elegans PHA-4/FOXA in development and environmental response. PLoS Genet. 2010 Feb 19;6(2):e1000848.
- Xiao Y, Bedet C, Robert VJ, et al. Caenorhabditis elegans chromatin-associated proteins SET-2 and ASH-2 are differentially required for histone H3 Lys 4 methylation in embryos and adult germ cells. Proc Natl Acad Sci U S A. 2011 May 17;108(20):8305–8310.
- Greer EL, Maures TJ, Hauswirth AG, et al. Members of the H3K4 trimethylation complex regulate lifespan in a germline-dependent manner in C. elegans. Nature. 2010 Jul 15;466(7304):383–387.
- Han S, Schroeder EA, Silva-Garcia CG, et al. Mono-unsaturated fatty acids link H3K4me3 modifiers to C. elegans lifespan. Nature. 2017 Apr 13;544(7649):185–190.
- Shilatifard A. The COMPASS family of histone H3K4 methylases: mechanisms of regulation in development and disease pathogenesis. Annu Rev Biochem. 2012;81(1):65–95.
- Thomson JP, Skene PJ, Selfridge J, et al. CpG Islands influence chromatin structure via the CpG-binding protein Cfp1. Nature. 2010 Apr 15;464(7291):1082–1086.
- Pokhrel B, Chen Y, Biro JJ. CFP-1 interacts with HDAC1/2 complexes in C. elegans development. FEBS J. 2019 Jul;286(13):2490–2504.
- Santos-Rosa H, Schneider R, Bannister AJ, et al. Active genes are tri-methylated at K4 of histone H3. Nature. 2002 Sep 26;419(6905):407–411.
- Lussi YC, Mariani L, Friis C, et al. Impaired removal of H3K4 methylation affects cell fate determination and gene transcription. Development. 2016 Oct 15;143(20):3751–3762.
- Shi X, Hong T, Walter KL, et al. ING2 PHD domain links histone H3 lysine 4 methylation to active gene repression. Nature. 2006 Jul 6;442(7098):96–99.
- Beurton F, Stempor P, Caron M, et al. Physical and functional interaction between SET1/COMPASS complex component CFP-1 and a Sin3S HDAC complex in C. elegans. Nucleic Acids Res. 2019 Dec 2;47(21):11164–11180.
- Settembre C, De Cegli R, Mansueto G, et al. TFEB controls cellular lipid metabolism through a starvation-induced autoregulatory loop. Nat Cell Biol. 2013 Jun;15(6):647–658.
- Lin XX, Sen I, Janssens GE, et al. DAF-16/FOXO and HLH-30/TFEB function as combinatorial transcription factors to promote stress resistance and longevity. Nat Commun. 2018 Oct 23;9(1):4400.
- MacInnes AW. The role of the ribosome in the regulation of longevity and lifespan extension. Wiley Interdiscip Rev RNA. 2016 Mar-Apr;7(2):198–212.
- Parkhitko AA, Jouandin P, Mohr SE, et al. Methionine metabolism and methyltransferases in the regulation of aging and lifespan extension across species. Aging Cell. 2019 Dec;18(6):e13034.
- Shyh-Chang N, Locasale JW, Lyssiotis CA, et al. Influence of threonine metabolism on S-adenosylmethionine and histone methylation. Science. 2013 Jan 11;339(6116):222–226.
- Ding W, Smulan LJ, Hou NS, et al. s-adenosylmethionine levels govern innate immunity through distinct methylation-dependent pathways. Cell Metab. 2015 Oct 6;22(4):633–645.
- Silvestrini MJ, Johnson JR, Kumar AV, et al. Nuclear export inhibition enhances HLH-30/TFEB activity, autophagy, and lifespan. Cell Rep. 2018 May 15;23(7):1915–1921.
- Nakamura S, Yoshimori T. Autophagy and longevity. Mol Cells. 2018 Jan 31;41(1):65–72.
- O’Rourke EJ, Ruvkun G. MXL-3 and HLH-30 transcriptionally link lipolysis and autophagy to nutrient availability. Nat Cell Biol. 2013 Jun;15(6):668–676.
- Wu J, Jiang X, Li Y, et al. PHA-4/FoxA senses nucleolar stress to regulate lipid accumulation in Caenorhabditis elegans. Nat Commun. 2018 Mar 22;9(1):1195.
- Mello C, Fire A. DNA transformation. Methods Cell Biol. 1995;48:451–482.
- Mello CC, Kramer JM, Stinchcomb D, et al. Efficient gene transfer in C.elegans: extrachromosomal maintenance and integration of transforming sequences. EMBO J. 1991 Dec;10(12):3959–3970.
- Kamath RS, Ahringer J. Genome-wide RNAi screening in Caenorhabditis elegans. Methods. 2003 Aug;30(4):313–321.
- Kamath RS, Fraser AG, Dong Y, et al. Systematic functional analysis of the Caenorhabditis elegans genome using RNAi. Nature. 2003 Jan 16;421(6920):231–237.
- Kenyon C, Chang J, Gensch E, et al. A C. elegans mutant that lives twice as long as wild type. Nature. 1993 Dec 2;366(6454):461–464.
- Kolasinska-Zwierz P, Down T, Latorre I, et al. Differential chromatin marking of introns and expressed exons by H3K36me3. Nat Genet. 2009 Mar;41(3):376–381.
- Chen RA, Down TA, Stempor P, et al. The landscape of RNA polymerase II transcription initiation in C. elegans reveals promoter and enhancer architectures. Genome Res. 2013 Aug;23(8):1339–1347.
- Langmead B, Salzberg SL. Fast gapped-read alignment with Bowtie 2. Nat Methods. 2012 Mar 4;9(4):357–359.
- Ramirez F, Ryan DP, Gruning B, et al. deepTools2: a next generation web server for deep-sequencing data analysis. Nucleic Acids Res. 2016 Jul 8;44(W1):W160–5.
- Quinlan AR, Hall IM. BEDTools: a flexible suite of utilities for comparing genomic features. Bioinformatics. 2010 Mar 15;26(6):841–842.
- Angeles-Albores D, RY NL, Chan J, et al. Tissue enrichment analysis for C. elegans genomics. BMC Bioinformatics. 2016 Sep 13;17(1):366.
- Angeles-Albores D, Lee R, Chan J, et al. Two new functions in the wormbase enrichment suite. MicroPubl Biol. 2018 Mar 27 2018;2018:1 0.17912/W25Q2N.