
ABSTRACT
Following acute kidney injury (AKI), renal tubular cells may stimulate fibroblasts in a paracrine fashion leading to interstitial fibrosis, but the paracrine factors and their regulation under this condition remain elusive. Here we identify a macroautophagy/autophagy-dependent FGF2 (fibroblast growth factor 2) production in tubular cells. Upon induction, FGF2 acts as a key paracrine factor to activate fibroblasts for renal fibrosis. After ischemic AKI in mice, autophagy activation persisted for weeks in renal tubular cells. In inducible, renal tubule-specific atg7 (autophagy related 7) knockout (iRT-atg7-KO) mice, autophagy deficiency induced after AKI suppressed the pro-fibrotic phenotype in tubular cells and reduced fibrosis. Among the major cytokines, tubular autophagy deficiency in iRT-atg7-KO mice specifically diminished FGF2. Autophagy inhibition also attenuated FGF2 expression in TGFB1/TGF-β1 (transforming growth factor, beta 1)-treated renal tubular cells. Consistent with a paracrine action, the culture medium of TGFB1-treated tubular cells stimulated renal fibroblasts, and this effect was suppressed by FGF2 neutralizing antibody and also by fgf2- or atg7-deletion in tubular cells. In human, compared with non-AKI, the renal biopsies from post-AKI patients had higher levels of autophagy and FGF2 in tubular cells, which showed significant correlations with renal fibrosis. These results indicate that persistent autophagy after AKI induces pro-fibrotic phenotype transformation in tubular cells leading to the expression and secretion of FGF2, which activates fibroblasts for renal fibrosis during maladaptive kidney repair.
Abbreviations: 3-MA: 3-methyladnine; ACTA2/α-SMA: actin alpha 2, smooth muscle, aorta; ACTB/β-actin: actin, beta; AKI: acute kidney injury; ATG/Atg: autophagy related; BUN: blood urea nitrogen; CCN2/CTGF: cellular communication network factor 2; CDKN2A/p16: cyclin dependent kinase inhibitor 2A; CKD: chronic kidney disease; CM: conditioned medium; COL1A1: collagen, type I, alpha 1; COL4A1: collagen, type IV, alpha 1; CQ: chloroquine; ECM: extracellular matrix; eGFR: estimated glomerular filtration rate; ELISA: enzyme-linked immunosorbent assay; FGF2: fibroblast growth factor 2; FN1: fibronectin 1; FOXO3: forkhead box O3; GAPDH: glyceraldehyde-3-phosphate dehydrogenase; HAVCR1/KIM-1: hepatitis A virus cellular receptor 1; IHC: immunohistochemistry; IRI: ischemia-reperfusion injury; ISH: in situ hybridization; LTL: lotus tetragonolobus lectin; MAP1LC3B/LC3B: microtubule-associated protein 1 light chain 3 beta; MTOR: mechanistic target of rapamycin kinase; PDGFB: platelet derived growth factor, B polypeptide; PPIB/cyclophilin B: peptidylprolyl isomerase B; RT-qPCR: real time-quantitative PCR; SA-GLB1/β-gal: senescence-associated galactosidase, beta 1; SASP: senescence-associated secretory phenotype; sCr: serum creatinine; SQSTM1/p62: sequestosome 1; TASCC: TOR-autophagy spatial coupling compartment; TGFB1/TGF-β1: transforming growth factor, beta 1; VIM: vimentin
Introduction
Acute kidney injury (AKI) is a serious clinical syndrome characterized by a rapid loss of renal excretory function resulting in the accumulation of nitrogenous wastes such as creatinine and urea, and perturbation of water, electrolyte and acid-base balance. AKI occurs in 10–15% of hospitalized patients and in > 50% of patients admitted to the intensive care unit. The common causes of AKI include renal ischemia-reperfusion injury (IRI), sepsis, and exposure to nephrotoxins. Currently, no treatments can effectively reduce kidney injury or improve kidney recovery from AKI and, as a result, AKI is associated with high morbidity, increasing healthcare cost, and mortality of about 2 million deaths per year [Citation1,Citation2]. Remarkably, even if the patients have survived the acute illness of AKI, they have a high risk for developing chronic kidney disease (CKD) and end-stage renal disease, and AKI is now considered to be an important contributor and accelerant in the development and progression of CKD [Citation3–6].
Kidney repair is a key to the recovery from AKI. In this regard, it is known that renal tubular cell injury and death, the key pathological feature of AKI, is often followed by tubular cell regeneration and repair. Normal kidney repair begins with dedifferentiation, migration, and proliferation of surviving tubular cells to replace injured ones, followed by redifferentiation to restore intact tubular structure and function [Citation7–11]. However, tubular repair after severe or repeated episodes of AKI tends to be incomplete or maladaptive, leading to chronic inflammation and renal interstitial fibrosis that contribute to the progression of AKI to CKD [Citation7–11]. Regardless of the initial insult, multiple types of cells in the kidney participate in AKI to CKD transition. Among them, the proximal tubule is considered to play a central role as an initiating factor [Citation7–12]. In direct support, repeated acute injury targeted to proximal tubules or conditional overexpression of HAVCR1/KIM-1 (hepatitis A virus cellular receptor 1) in renal tubules triggers the pathological changes of CKD [Citation13–15]. Notably, a subpopulation of injured proximal tubular cells may transform to a secretory phenotype resulting in the production and release of pro-inflammatory and pro-fibrotic cytokines. Through these cytokines, the injured tubules may drive the cascade of downstream events via autocrine effects on themselves and paracrine functions on neighboring cells that culminate in the development of interstitial fibrosis and the progression to CKD [Citation7–12].
The mechanism leading to a secretory phenotype in injured renal tubules is very complex. After ischemic AKI, the injured tubules become atrophic with dedifferentiated cells that have enhanced TGFB1/TGF-β1 (transforming growth factor, beta 1) signaling for the production of pro-fibrotic cytokines [Citation16–18]. Tubular atrophy with dedifferentiation after AKI is also related to mitochondrial dysfunction and metabolic shift from fatty acid oxidation to glycolysis during maladaptive kidney repair [Citation19,Citation20]. Remarkably, upon severe or sustained AKI, some tubular cells undergo prolonged G2/M cell cycle arrest, leading to tubular dedifferentiation, increased tubular generation of pro-fibrotic factors, persistent fibroblast activation and renal interstitial fibrosis [Citation21]. Despite these findings, the key cytokines released from renal tubules as paracrine factors for fibroblast activation and interstitial fibrosis remain to be identified, and the regulation of the production of these pro-fibrotic cytokines during maladaptive kidney repair remains elusive.
Macroautophagy/autophagy is a lysosomal degradation pathway that breaks down cytoplasmic components via the formation of autophagosomes and autolysosomes [Citation22]. Alterations of autophagy have been demonstrated in both acute and chronic kidney diseases in experimental models and, to some extents, in human patients [Citation23–25]. In the acute injury phase of AKI, autophagy is induced in proximal tubular cells and acts as an intrinsic protective mechanism [Citation26–30]. During kidney recovery from AKI, autophagy needs to be deactivated for tubular cell proliferation and tubular repair, because tubular cells with persistent autophagy are defective in proliferation [Citation31]. Tightly-regulated autophagy also contributes to phagocytosis to clear up dead cells, to promote restricted antigen presentation and inhibit inflammation, and to preserve self-tolerance of proximal tubules, all of which would favor normal kidney repair [Citation32]. The role of tubular cell autophagy in maladaptive kidney repair after AKI is much less clear.
In this study, we demonstrated that autophagy was sustained at high levels in renal tubular cells after ischemic AKI leading to a secretory phenotype for the production of pro-fibrotic cytokines. Among these cytokines, autophagy specifically induced FGF2 (fibroblast growth factor 2). Functionally, FGF2 was proved to be a key paracrine factor produced by renal tubular cells for fibroblast activation and interstitial fibrosis during maladaptive kidney repair.
Results
Autophagy is persistently activated in renal tubular cells during maladaptive kidney repair after ischemic AKI in mice
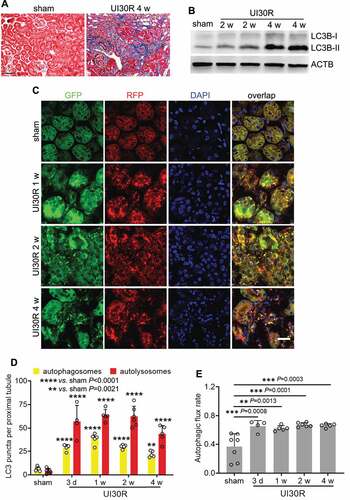
In the animal models used to study kidney repair, renal IRI has the merit of defined phases of injury and repair [Citation33,Citation34], making it possible to specifically target repair without changing initial injury. In this regard, unilateral IRI induces relatively consistent injury-repair in kidneys and ensures animal survival for long-term observation [Citation35]. We subjected C57BL/6 mice to 30-min unilateral renal ischemia followed by reperfusion for up to 4 weeks (UI30R 4 w). Interstitial fibrosis in post-injury kidneys was verified by Masson’s trichrome staining of collagen deposition (). In these kidneys, we detected the accumulation of MAP1LC3B/LC3B (microtubule-associated protein 1 light chain 3 beta)-II, a biochemical hallmark of autophagy [Citation36] (). To examine the location, dynamics and flux of autophagy, we utilized autophagy reporter mice which express a tandem RFP-GFP-LC3 fusion protein that gives both GFP and RFP fluorescence in autophagosomes with a neutral pH but loses GFP signals when autophagosomes progress into autolysosomes with an acidic pH [Citation31,Citation37,Citation38]. As shown in , sham-operated control mice had a low level of autophagy in renal tubules with few GFP-LC3 and RFP-LC3 puncta. However, after unilateral renal IRI, the formation of both autophagosomes (yellow GFP-LC3 and RFP-LC3 overlapping puncta) and autolysosomes (red-only RFP-LC3 puncta) was markedly increased in renal tubules at all the time points we observed throughout 4 weeks (). In quantification (), there were 6 autophagosomes per proximal tubule in sham control mice, which increased to 28 on day 3 after IRI and further elevated to 38 at 1 week. The number of autophagosomes per proximal tubule decreased slightly afterward yet still preserved at 30 after 2 weeks and 22 by 4 weeks. A similar pattern of changes was observed for autolysosomes (), indicating persistent tubular autophagy in post-injury kidneys. We further analyzed the percentage of autolysosomes in all autophagic vesicles to indicate the rate of autophagic flux [Citation36] (). The rate of autophagic flux was 37% in renal tubules in sham control mice, which was increased after renal IRI and maintained at a high level of over 60% throughout 4 weeks of kidney repair. Together, these results indicate a persistent activation of autophagy in renal tubular cells during the development of interstitial fibrosis in maladaptive kidney repair.
Figure 1. Autophagy is persistently activated in renal tubular cells during maladaptive kidney repair after ischemic AKI in mice. C57BL/6 mice underwent sham operation (n = 4) or 30-min unilateral renal ischemia followed by reperfusion for up to 4 weeks (n = 8). Left kidneys were harvested at the indicated time points. (A) Masson’s trichrome staining. Scale bar: 50 µm. (B) LC3B immunoblot. (C) Autophagy reporter mice (CAG-RFP-GFP-LC3) underwent sham operation (n = 7) or 30-min unilateral renal ischemia followed by reperfusion for up to 4 weeks (n = 4 to 6 for each time point). Left kidneys were harvested for confocal microscopy of autophagosomes and autolysosomes in renal tubules. Scale bar: 15 µm. (D) Quantification of the numbers of autophagosomes and autolysosomes per proximal tubule. (E) Quantification of autophagic flux rate. Data in (D and E) are presented as mean ± SD. For statistics, two-way ANOVA with multiple comparisons was used for (D). One-way ANOVA with multiple comparisons was used for (E).
Tubular autophagy deficiency in iRT-atg7-KO mice inhibits interstitial fibrosis during post-ischemic kidney repair
Autophagy inhibition or deficiency in renal tubular cells sensitizes mice to AKI [Citation26–29]. The severity of initial injury certainly affects subsequent tubular repair including the development of interstitial fibrosis. To specifically determine the role of tubular autophagy in kidney repair, we generated an inducible, renal tubule-specific atg7 knockout mouse model by breeding Pax8-rtTA±/LC1± mice [Citation39,Citation40] with Atg7flox/flox mice to produce iRT-atg7-KO mice and wild type (iRT-Atg7-WT) littermates (Figure S1A). In iRT-atg7-KO (but not WT) mice, doxycycline can activate Pax8-rtTA to drive the expression of Cre (LC1) recombinase specifically in renal tubules at a desired time. As shown in , atg7 deletion alleles (2.2 Kb) appeared in iRT-atg7-KO kidneys on day 3 of doxycycline induction, but the loss of ATG7 protein was detected only at 1 week. Consistently, ATG7-mediated conjugation events, such as LC3B-I lipidation/conversion to LC3B-II and the formation of ATG12-ATG5 complex, were significantly inhibited in iRT-atg7-KO kidneys after 1 week of doxycycline exposure (). As controls, WT mice or iRT-atg7-KO mice without doxycycline exposure did not show atg7 ablation or defective autophagy (). By immunofluorescence (Figure S1B), we also showed that WT mice had ATG7 expression in the cytoplasm of proximal tubular cells (positive for lotus tetragonolobus lectin [LTL], a brush boarder marker). This tubular expression of ATG7 almost completely disappeared in iRT-atg7-KO kidneys, further confirming the recombination efficiency by 1-week treatment of doxycycline (Figure S1B). To block tubular autophagy during kidney repair without affecting initial AKI, we started doxycycline treatment 1 day before ischemia surgery (day −1) and ended the treatment 6 days after reperfusion (day +6). Kidneys were harvested at multiple time points after ischemic AKI (Figure S1C). We first confirmed that iRT-atg7-KO mice and their WT littermates had comparable AKI in the clamped kidney by removing the contralateral kidney on day 2 and collecting samples on day 3 for analysis. As shown in Figure S1D, these mice had virtually the same levels of blood urea nitrogen (BUN), serum creatinine and percentage of injured tubules. We then examined autophagic responses in kidney tissues by analyzing LC3B-II accumulation and LC3B puncta formation, hallmarks of autophagy [Citation36]. WT mice had a sustained LC3B-II accumulation in post-AKI kidneys with LC3B-I barely detected, whereas the conversion of LC3B-I to LC3B-II was almost completely blocked in iRT-atg7-KO mice (Figure S1E). Moreover, WT mice had numerous LC3B puncta in the cytoplasm of renal tubular cells, indicating the formation of autophagosomes and/or autolysosomes. By contrast, in iRT-atg7-KO mice, the staining was predominantly present as diffuse, cytosolic LC3B-I in renal tubules (Figure S1F). These results indicate that post-AKI kidney repair is associated with persistent activation of tubular autophagy, which is impaired in iRT-atg7-KO mice.
Figure 2. Tubular autophagy deficiency in iRT-atg7-KO mice inhibits interstitial fibrosis during post-ischemic kidney repair. (A) Top panel: genomic DNA was extracted from WT (n = 6) and iRT-atg7-KO (n = 6) kidneys at the indicated time points after doxycycline treatment for PCR detection of Atg7 flox and deletion alleles. Other panels: tissue lysates were collected from WT and iRT-atg7-KO kidneys for immunoblots of ATG7, LC3B, ATG5 (ATG12 conjugated), and SQSTM1/p62. (B-F) WT and iRT-atg7-KO mice underwent sham operation or 30-min unilateral renal ischemia followed by reperfusion for up to 4 weeks. Left kidneys were harvested at the indicated time points for histology, RT-qPCR and immunofluorescence or IHC. (B) Masson’s trichrome staining. Scale bar: 50 µm. (C) Quantification of collagen-stained areas (UI30R 2 w: WT n = 6, KO n = 6; UI30R 4 w: WT n = 6, KO n = 7). (D) RT-qPCR assay of Fn1, Col1a1, Col4a1, and Acta2 mRNA (sham: WT n = 4 or 5, KO n = 4 or 5; UI30R 4 w: WT n = 7, KO n = 9). (E and F) Immunofluorescence or IHC of FN1, COL1A1, COL4A1 and ACTA2 (WT n = 7, KO n = 7). Scale bar: 100 µm. Data in (C and D) are presented as mean ± SD. Two-way ANOVA with multiple comparisons was used for statistics.
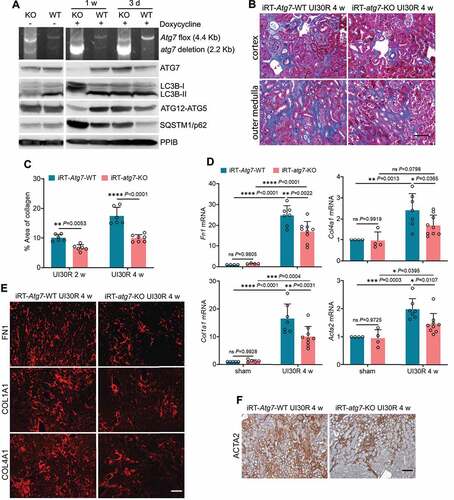
Using the inducible knockout model, we then examined the effects of tubular autophagy deficiency on post-ischemic kidney fibrosis. At 2 to 4 weeks after unilateral ischemic AKI, WT mice had a widespread collagen deposition either forming fibrotic foci around small blood vessels in renal cortex or expanding along injured or atrophic renal tubules in outer medulla. Compared with WT, iRT-atg7-KO mice showed less collagen-positive staining in kidneys (). Morphometric analysis revealed that 10.1% interstitial fibrosis was induced in WT kidneys 2 weeks after unilateral ischemic AKI, which was decreased to 6.6% in iRT-atg7-KO mice. By 4 weeks, WT mice had 17.5% interstitial fibrosis, which was further reduced to 9.9% in iRT-atg7-KO animals (). Consistently, following unilateral ischemic AKI, WT mice had increased production of extracellular matrix (ECM) components such as Fn1 (fibronectin 1), Col1a1 (collagen, type I, alpha 1) and Col4a1 (collagen, type IV, alpha 1) at mRNA level, which were significantly attenuated in iRT-atg7-KO mice (). Fibroblast to myofibroblast transition, as indicated by increased mRNA expression of Acta2/α-Sma (actin alpha 2, smooth muscle, aorta) in WT mice, was suppressed in iRT-atg7-KO kidneys as well (). We further examined the changes of these fibrotic markers at the protein level by immunostaining. Following unilateral ischemic AKI, WT mice had massive accumulation of all three ECM proteins () and ACTA2-positive myofibroblasts () in renal interstitium throughout cortex and outer medulla. Again, compared with WT, iRT-atg7-KO mice showed significantly less tubulointerstitial staining of these fibrotic proteins (). Together, these results indicate that persistent tubular autophagy promotes interstitial fibrosis during post-ischemic kidney repair.
For the advantages mentioned above, we chose unilateral IRI as the primary model used in this study. But, we verified the effects of tubular autophagy deficiency on kidney repair in the model of bilateral renal ischemia-reperfusion. iRT-atg7-KO mice were treated with doxycycline to induce tubular atg7/autophagy deficiency after initial AKI (Figure S2A). At 2 weeks after AKI, WT mice still had 60 mg/dl BUN, whereas iRT-atg7-KO mice had 43 mg/dl BUN indicating better recovery (Figure S2B: BI25R 2 w). Serum creatinine was also lower in iRT-atg7-KO mice (Figure S2C). Consistently, chronic expression of HAVCR1/KIM-1, a well-known tubular injury marker [Citation15], in injured proximal tubules was also attenuated in iRT-atg7-KO mice (Figure S2D and S2E). Along with improved tubular recovery, autophagy deficiency suppressed interstitial fibrosis after bilateral ischemic AKI, reducing the collagen staining area from 9.8% in WT mice to 5.5% in iRT-atg7-KO kidneys (Figure S2F and S2G). Immunoblot analysis further showed that the induction of multiple fibrotic proteins such as COL1A1, COL4A1, FN1, ACTA2 and VIM (vimentin) in WT mice were all inhibited in iRT-atg7-KO mice (Figure S2H and S2I). These results indicate that persistent tubular autophagy after AKI favors the development of interstitial fibrosis and maladaptive kidney repair in both unilateral and bilateral renal IRI models.
Tubular autophagy contributes to the pro-fibrotic phenotype transformation in renal tubules during post-ischemic kidney repair
Following AKI, renal tubular cell responses, such as dedifferentiation, cell cycle arrest, senescence, and metabolic changes, are adaptive initially but become detrimental and favorable for maladaptive repair if sustained [Citation7–11]. To delineate how tubular autophagy promotes interstitial fibrosis during maladaptive kidney repair, we examined the effects of tubular autophagy deficiency on these post-AKI responses in kidneys. For dedifferentiation, we detected VIM, a well-recognized tubular dedifferentiation marker [Citation17,Citation41], mainly in the glomeruli of sham control mouse kidneys with scattered staining in some interstitial cells (Figure S3A). During post-ischemic kidney repair, VIM was increased in WT kidneys, especially in the cells of atrophic tubules indicative of tubular dedifferentiation (Figure S3A: iRT-Atg7-WT, enlarged inset). The VIM induction in renal tubules was significantly attenuated in iRT-atg7-KO mice, whereas interstitial VIM induction was not significantly affected (Figure S3A: iRT-atg7-KO, enlarged inset). Quantitatively, the VIM-positive areas were reduced from 14.4% in WT kidneys to 9.3% in iRT-atg7-KO mice at 2 weeks after ischemic AKI and further went down to 7.8% at 4 weeks (Figure S3B). By LTL staining, we detected the loss of brush border in proximal tubules in WT mice during post-ischemic kidney repair, which was partially but significantly prevented in iRT-atg7-KO mice, suggesting a role for tubular autophagy in compromising tubular integrity and polarity during maladaptive kidney repair (Figure S3C and S3D). Moreover, WT mice had a chronic expression of HAVCR1/KIM-1 in renal tubules during kidney repair, which was suppressed in iRT-atg7-KO mice (Figure S3E and S3F), further supporting an injurious role of persistent autophagy in maladaptive kidney repair.
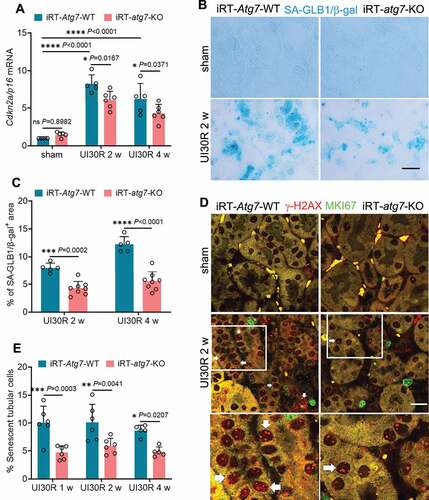
We next examined the effect of autophagy on tubular senescence that has been implicated in maladaptive kidney repair [Citation42,Citation43]. In WT mice, there was an induction of CDKN2A/p16 (cyclin-dependent kinase inhibitor 2A) during post-ischemic kidney repair, which was partially but significantly inhibited in iRT-atg7-KO mice (). Tubular autophagy deficiency also suppressed the expression of SA-GLB1/β-gal (senescence-associated galactosidase, beta 1), another important biomarker of cellular senescence, reducing the areas of positive SA-GLB1/β-gal staining from 8% in WT kidneys to 4.3% in iRT-atg7-KO mice at 2 weeks after ischemic AKI. This effect was maintained during the whole observation period of 4 weeks (). Co-immunofluorescence of Serine139-phosphorylated Histone H2AX (γ-H2AX) and MKI67/Ki67 further revealed the increase of senescent tubular cells (4 or more γ-H2AX-positive foci and MKI67-negative [Citation42]) in post-ischemic WT kidneys at multiple time points, which again was attenuated in iRT-atg7-KO mice ().
Figure 3. Tubular autophagy deficiency in iRT-atg7-KO mice suppresses senescent changes in renal tubules during post-ischemic kidney repair. WT and iRT-atg7-KO mice underwent sham operation or 30-min unilateral renal ischemia followed by reperfusion for up to 4 weeks. Left kidneys were harvested at the indicated time points for senescence analysis. (A) RT-qPCR of Cdkn2a/p16 mRNA (n = 5 or 6 for each group). (B) SA-GLB1/β-gal staining. Scale bar: 50 µm. (C) Quantification of SA-GLB1/β-gal-positive stained areas (UI30R 2 w: WT n = 5, KO n = 8; UI30R 4 w: WT n = 5, KO n = 8). (D) γ-H2AX and MKI67 co-immunofluorescence. Scale bar: 20 µm. White arrows indicate typical senescent tubular cells with 4 or more γ-H2AX-positive foci and MKI67-negative. (E) Quantification of the percentage of senescent tubular cells (n = 5 or 6 for each group). Data in (A, C and E) are presented as mean ± SD. Two-way ANOVA with multiple comparisons was used for statistics.
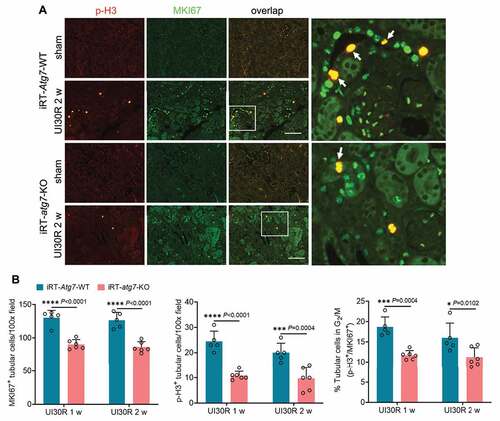
In addition to senescence, a small portion of renal tubular cells also underwent G2/M cell cycle arrest in post-ischemic kidneys, as indicated by tubular cells co-stained with both MKI67 and serine10-phosphorylated histone H3 (p-H3) (). Compared with WT mice, iRT-atg7-KO mice had fewer proliferating (MKI67+) cells, fewer p-H3-positive cells (p-H3+), and notably a lower percentage of p-H3+ cells in total proliferating cells (p-H3+/MKI67+) (), indicating the suppression of G2/M cell cycle arrest. Together, these results suggest that persistent activation of autophagy in post-ischemic kidneys may regulate or act in concert with other tubular responses to promote chronic tubular pathologies and the transformation to a pro-fibrotic phenotype for maladaptive repair.
Figure 4. Tubular autophagy deficiency in iRT-atg7-KO mice reduces G2/M cell cycle arrest in renal tubules during post-ischemic kidney repair. WT and iRT-atg7-KO mice underwent sham operation or 30-min unilateral renal ischemia followed by reperfusion for up to 4 weeks. Left kidneys were harvested at the indicated time points. (A) p-H3 and MKI67 double immunofluorescence. Scale bar: 100 µm. White arrows indicate renal tubular cells with positive co-staining of p-H3 and MKI67. (B) Quantification of the numbers of MKI67-positive cells, p-H3-positive cells, and the percentage of tubular cells arrested in G2/M (n = 5 or 6 for each group). Data in (B) are presented as mean ± SD. Two-way ANOVA with multiple comparisons was used for statistics.
Persistent autophagy selectively induces FGF2 production in renal tubules during post-ischemic kidney repair
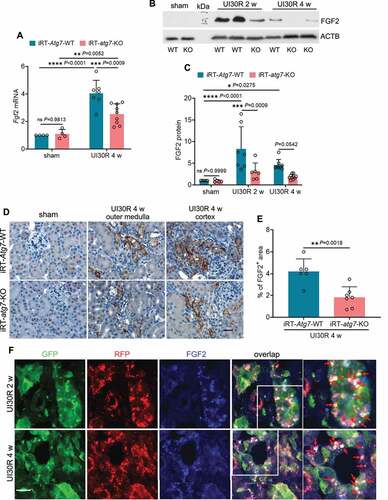
In maladaptive kidney repair, renal tubular cells may produce and secrete various cytokines to stimulate fibroblasts for interstitial fibrosis [Citation7–9,Citation11]. Accordingly, we hypothesized that by mediating the phenotype transformation autophagy may induce the expression and secretion of pro-fibrotic cytokines from renal tubular cells, therefore driving interstitial fibrosis in post-ischemic kidney repair. To test this hypothesis, we first examined the effect of tubular autophagy deficiency on the production of 4 well-documented pro-fibrotic growth factors in maladaptive kidney repair, including TGFB1, PDGFB (platelet derived growth factor, B polypeptide), CCN2/CTGF (cellular communication network factor 2) and FGF2 [Citation7–9,Citation11]. WT mice had a 4-fold increase of Fgf2 mRNA in post-ischemic kidneys over sham control, which was reduced to 2.6-fold in iRT-atg7-KO mice (). Immunoblot analysis further showed that 2 weeks after unilateral ischemic AKI there was an 8.3-fold increase of FGF2 protein in WT kidneys, which was reduced to 3-fold in iRT-atg7-KO mice. By 4 weeks, FGF2 protein expression was also decreased from 4.6-fold over sham control in WT mice to 1.9-fold by iRT-atg7-KO (). Consistently, the inhibitory effect of tubular autophagy deficiency on FGF2 production was also detected in iRT-atg7-KO kidneys after bilateral ischemic AKI (Figure S2H and S2I: FGF2). Other than FGF2, post-ischemic kidney repair was also associated with significant induction of TGFB1, PDGFB and CCN2/CTGF at both mRNA and protein levels; however, the induction of these three growth factors was not significantly affected by tubular autophagy deficiency (Figure S4). These results suggest a selective regulation of FGF2 by tubular cell autophagy during post-ischemic kidney repair. To further characterize FGF2 expression and localization in the kidney, we performed immunohistochemical (IHC) staining (). FGF2 was not detected in sham control kidneys. Following ischemic AKI, FGF2 was induced and accumulated in the cytoplasm of atrophic tubules predominantly at the basolateral side in WT kidneys, and this tubular expression of FGF2 was suppressed in iRT-atg7-KO mice (). Of note, the FGF2-positive atrophic tubules in WT mice were surrounded by widened interstitium, indicative of chronic inflammation and fibrosis. By contrast, iRT-atg7-KO mice had thinner interstitial fibrotic tissues around atrophic tubules as tubular expression of FGF2 was inhibited (). Quantitatively, 4 weeks after ischemic AKI the FGF2-positive staining area was reduced from 4.2% in WT kidneys to 1.8% in iRT-atg7-KO mice (). Moreover, immunostaining of FGF2 in autophagy reporter mice revealed a partial co-localization of FGF2 with autophagosomes (white dots in overlapping images) but barely with degradative autolysosomes in renal tubules of post-ischemic kidneys, indicating a spatiotemporal connection between autophagy and FGF2 induction (). Together, these results indicate that persistent tubular autophagy after AKI may specifically induce the production of FGF2 in atrophic renal tubules to promote interstitial fibrosis for maladaptive kidney repair.
Figure 5. Autophagy deficiency suppresses FGF2 production in renal tubules during post-ischemic kidney repair. WT and iRT-atg7-KO mice underwent sham operation or 30-min unilateral renal ischemia followed by reperfusion for up to 4 weeks. Left kidneys were harvested at the indicated time points for RT-qPCR, immunoblot and IHC of FGF2. (A) RT-qPCR assay of Fgf2 mRNA (sham: WT n = 4, KO n = 4; UI30R 4 w: WT n = 7, KO n = 9). (B and C) FGF2 immunoblot and densitometry (sham: WT n = 5, KO n = 5; UI30R 2 w: WT n = 7, KO n = 6; UI30R 4 w: WT n = 8, KO n = 10). (D) FGF2 IHC. Scale bar: 20 µm. (E) Quantification of FGF2-positive stained areas (WT n = 6, KO n = 7). (F) Autophagy reporter mice (CAG-RFP-GFP-LC3) underwent 30-min unilateral renal ischemia followed by reperfusion for 2 weeks (n = 3) and 4 weeks (n = 3). Left kidneys were collected for cryo-sectioning and FGF2 immunofluorescence. Scale bar: 15 µm. Red arrows indicate FGF2-positive granules co-localized with autophagosomes. Data in (A, C and E) are presented as mean ± SD. For statistics, two-way ANOVA with multiple comparisons was used for (A and C). 2-tailed, unpaired Student t-test was used for (E).
Autophagy specifically stimulates the production and secretion of FGF2 in renal proximal tubular cells during TGFB1 treatment
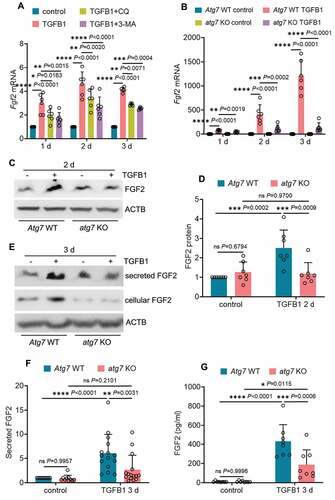
To understand how autophagy regulates FGF2 in renal fibrosis, we examined the in vitro model of TGFB1 treatment of mouse proximal tubular (BUMPT) cells. We showed previously that TGFB1 induced a persistent activation of autophagy in these cells [Citation37]. Notably, TGFB1 also led to a time-dependent, sustained induction of Fgf2 mRNA throughout 3 days of treatment (Figure S5A). Unlike Fgf2, the mRNA expression of Ccn2/Ctgf and Pdgfb induced by TGFB1 treatment appeared to be transient, with a peak increase at 1 day and then gradually going down (Figure S5A). By contrast, there was no obvious Tgfb1 mRNA induction in this model (Figure S5A). The induction of FGF2, CCN2/CTGF and PDGFB in TGFB1-treated BUMPT cells was also shown at the protein level (Figure S5B: cellular proteins). Moreover, TGFB1 treatment of BUMPT cells led to the secretion of FGF2 and CCN2/CTGF, but not PDGFB. Robust secretion of FGF2 and CCN2/CTGF was detected at day 3 of TGFB1 treatment (Figure S5B and S5C: secreted proteins). Using this in vitro model, we then examined the effect of autophagy inhibition on tubular production and secretion of these growth factors. Inhibition of autophagy with either chloroquine (CQ) or 3-methyladnine (3-MA) partially but significantly suppressed Fgf2 mRNA expression (), whereas these inhibitors did not affect the mRNA induction of Ccn2/Ctgf or Pdgfb (Figure S6A). The pharmacological results were verified by using atg7 KO and WT mouse proximal tubular cell lines established in our lab [Citation37]. In response to TGFB1 treatment, WT cells had a time-dependent upregulation of Fgf2, with the mRNA expression increased 74-fold over control at 1 day, 419-fold at 2 days, and further elevated to 1210-fold at 3 days (: Atg7 WT TGFB1). Autophagy deficiency in atg7 KO tubular cells markedly suppressed the induction of Fgf2 mRNA at all 3 time points, reducing the fold changes to 41 at 1 day, 118 at 2 days, and 139 at 3 days, respectively (: atg7 KO TGFB1). Consistent with the mRNA changes, TGFB1 induced a 2.5-fold increase of FGF2 protein in WT cells, and this induction was almost completely diminished in atg7 KO tubular cells (). By contrast, TGFB1 treatment also induced CCN2/CTGF and PDGFB at both mRNA and protein levels in WT tubular cells, whereas these effects were mostly unaffected by atg7 KO (Figure S6B, S6C and S6D). Moreover, TGFB1-induced FGF2 secretion was also blocked in atg7 KO tubular cells. In WT cells, TGFB1 induced a 6-fold increase of FGF2 secretion, which was reduced to 2.7-fold by atg7 KO (). Enzyme-linked immunosorbent assay (ELISA) further confirmed that autophagy deficiency decreased the concentration of secreted FGF2 from 431 pg/ml in WT cell culture medium to 188 pg/ml in atg7 KO cell culture medium (). Autophagy deficiency did not reduce, rather slightly increased, tubular cell secretion of CCN2/CTGF (Figure S6E, S6F and S6G). Together, these in vitro data support our in vivo findings that sustained autophagy may specifically activate tubular production and secretion of FGF2 for interstitial fibrosis.
Figure 6. Autophagy inhibition reduces the production and secretion of FGF2 in renal proximal tubular cells during TGFB1 treatment. (A) Subconfluent BUMPT cells were exposed to 5 ng/ml TGFB1 in serum-free DMEM for up to 3 days alone or with 2 µM CQ or 1 mM 3-MA. Control cells were kept in serum-free medium without TGFB1. Cells were collected at the indicated time points for RT-qPCR assay of Fgf2 mRNA (n = 6 experiments). (B) Subconfluent WT and atg7 KO mouse proximal tubular cells were exposed to 5 ng/ml TGFB1 in serum-free DMEM for up to 3 days. Control cells were kept in serum-free medium without TGFB1. Cells were collected at the indicated time points for RT-qPCR assay of Fgf2 mRNA (n = 6 experiments). (C and D) Subconfluent WT and atg7 KO mouse proximal tubular cells were exposed to 5 ng/ml TGFB1 in serum-free DMEM for 2 days. Control cells were kept in serum-free medium without TGFB1. Cell lysates were collected for FGF2 immunoblot and densitometry (n = 7 experiments). (E) Subconfluent WT and atg7 KO mouse proximal tubular cells were exposed to 5 ng/ml TGFB1 in serum-free DMEM for 3 days. Control cells were kept in serum-free medium without TGFB1. Both cell lysates and culture media were collected for immunoblots of cellular and secreted FGF2 (n = 10 experiments). (F) Densitometry of secreted FGF2 protein. (G) Cells and treatments were described in (E). Culture media were collected for FGF2 ELISA (n = 6 experiments). Data in (A, B, D, F and G) are presented as mean ± SD. Two-way ANOVA with multiple comparisons was used for statistics.
FGF2 neutralizing antibody attenuates the paracrine effect of renal tubular cells on fibroblasts
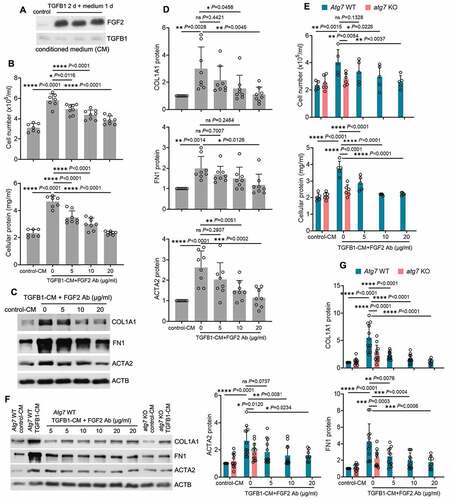
To examine the paracrine effects of secreted FGF2 from tubular cells, we treated BUMPT cells with TGFB1 for 2 days and then replaced with fresh culture media for another day to collect conditioned medium (CM) to incubate fibroblasts. Robust tubular releases of FGF2 in the CM were first confirmed by immunoblot analysis (). We then incubated subconfluent, serum-starved renal NRK-49F fibroblasts with either CM collected from control cells (control-CM) or CM from TGFB1-treated BUMPT cells (TGFB1-CM) in the presence of 0, 5, 10 and 20 µg/ml FGF2 neutralizing antibody for 2 days. As shown in , compared with control-CM, TGFB1-CM significantly promoted fibroblast proliferation, as indicated by increased cell number and protein. Notably, TGFB1-CM-induced fibroblast proliferation was alleviated by FGF2 neutralizing antibody in a dose-dependent manner (). TGFB1-CM also induced the expression of ACTA2 and production of ECM components such as FN1 and COL1A1 in NRK-49F fibroblasts, indicating a phenotype transition from fibroblasts to myofibroblasts (). FGF2 neutralizing antibody suppressed TGFB1-CM-induced expression of ACTA2, FN1 and COL1A1, further supporting a role of FGF2 in tubular paracrine activation of renal fibroblasts (). Given the findings that autophagy specifically regulated tubular production and secretion of FGF2 (), we further determined the effects of tubular autophagy deficiency on fibroblast activation. The CM from TGFB1-treated WT tubular cells (Atg7 WT TGFB1-CM) induced fibrotic changes in NRK-49F fibroblasts (proliferation and the expression of ACTA2, FN1 and COL1A1), whereas the CM from TGFB1-treated atg7 KO tubular cells (atg7 KO TGFB1-CM) did not (). The addition of FGF2 neutralizing antibody to Atg7 WT TGFB1-CM recapitulated the inhibitory effects of atg7 KO TGFB1-CM on renal fibroblasts (), further supporting a role of autophagy-mediated FGF2 production in paracrine activation of fibroblasts by renal tubular cells.
Figure 7. FGF2 neutralizing antibody attenuates the paracrine effect of renal tubular cells on fibroblasts. (A) Subconfluent BUMPT cells were exposed to 5 ng/ml TGFB1 in serum-free DMEM for 2 days. Control cells were kept in serum-free medium without TGFB1. The old culture media for both TGFB1-treated and control cells were replaced by fresh media free of TGFB1 at the end of day 2, incubated with the cells for an additional day, and then collected as tubular cell-CM for immunoblots of secreted FGF2 (n = 3 experiments). Note that only residual amount of TGFB1 was detected in the CMs. (B-D) Subconfluent NRK-49F fibroblasts were incubated with CM either from control BUMPT cells (control-CM) or TGFB1-treated BUMPT cells (TGFB1-CM) for 2 days in the presence of FGF2 neutralizing antibody at 5, 10, 20 µg/ml or mouse IgG (indicated as FGF2 Ab of 0 µg/ml) as negative control (n = 7 experiments). (B) Cell number counting and cellular protein measurement. (C) Immunoblots of COL1A1, FN1 and ACTA2. (D) Densitometry of COL1A1, FN1 and ACTA2 proteins. (E-G) Subconfluent NRK-49F fibroblasts were incubated with Atg7 WT control-CM, Atg7 WT TGFB1-CM, atg7 KO control-CM, or atg7 KO TGFB1-CM for 2 days. FGF2 neutralizing antibody was added to Atg7 WT TGFB1-CM at the concentrations of 5, 10, 20 µg/ml or mouse IgG (indicated as FGF2 Ab of 0 µg/ml) was used as negative control (n = 5 experiments). (E) Cell number counting and cellular protein measurement. (F) Immunoblots of COL1A1, FN1 and ACTA2. (G) Densitometry of COL1A1, FN and ACTA2 proteins. Data in (B, D, E and G) are presented as mean ± SD. For statistics, one-way ANOVA with multiple comparisons was used for (B and D). Both one-way and two-way ANOVA with multiple comparisons were used for (E and G).
Fgf2 deficiency diminishes the paracrine effect of renal tubular cells on fibroblasts
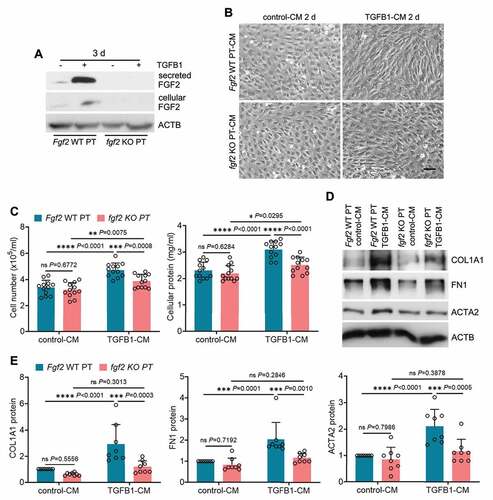
To further dissect the paracrine function of tubular FGF2 in fibrosis, we isolated primary proximal tubular cells from WT and fgf2 KO mice for TGFB1 treatment. The induction and secretion of FGF2 from TGFB1-treated WT primary tubular cells was first verified by immunoblot analysis, and these changes were absent in TGFB1-treated fgf2 KO primary tubular cells (: Fgf2 WT PT vs. fgf2 KO PT). We then collected the CMs from control or TGFB1-treated primary tubular cells to incubate NRK-49F fibroblasts. Compared with control-CM, Fgf2 WT PT TGFB1-CM induced significant fibrotic changes in fibroblasts as indicated by increased cell proliferation, enhanced production of ECM proteins, and morphological transition to myofibroblasts. Importantly, all these fibrotic changes were suppressed in the fibroblasts exposed to fgf2 KO PT TGFB1-CM (). Together with the anti-fibrotic effects of FGF2 neutralizing antibody, these results suggest that FGF2 is an autophagy-dependent cytokine produced by renal tubules which promotes interstitial fibrosis in maladaptive kidney repair via its paracrine action on fibroblasts.
Figure 8. Fgf2 deficiency diminishes the paracrine effect of renal tubular cells on fibroblasts. (A) Subconfluent isolated primary proximal tubular cells from WT (Fgf2 WT PT) and fgf2 KO mice (fgf2 KO PT) were exposed to 5 ng/ml TGFB1 in serum-free DMEM for 3 days. Control cells were kept in serum-free medium without TGFB1. Both cell lysates and culture media were collected for immunoblots of cellular and secreted FGF2 (n = 3 experiments). (B-E) Subconfluent NRK-49F fibroblasts were incubated with CM from control WT primary proximal tubular cells (Fgf2 WT PT control-CM), TGFB1-treated WT primary proximal tubular cells (Fgf2 WT PT TGFB1-CM), control KO primary proximal tubular cells (fgf2 KO PT control-CM), or TGFB1-treated KO primary proximal tubular cells (fgf2 KO PT TGFB1-CM) for 2 days (n = 8 experiments). (B) Cell morphology was monitored by phase contrast microscopy. Scale bar: 100 µm. (C) Cell number counting and cellular protein measurement. (D) Immunoblots of COL1A1, FN1 and ACTA2. (E) Densitometry of COL1A1, FN1 and ACTA2 proteins. Data in (C and E) are presented as mean ± SD. Two-way ANOVA with multiple comparisons was used for statistics.
Induction of tubular autophagy and FGF2 in renal biopsies from post-AKI patients correlates with kidney interstitial fibrosis
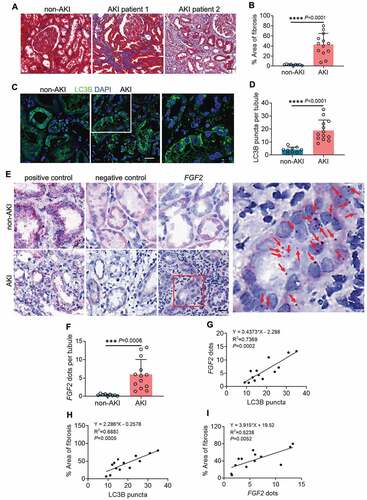
To validate the preclinical findings in human samples, we evaluated autophagy, FGF2 and their association with interstitial fibrosis in renal biopsies from 13 post-AKI patients and 9 non-AKI controls. For post-AKI patients, renal biopsies were collected within 3 months after the diagnosis of AKI. The demographic and clinical information of post-AKI patients was presented in Table S1. The development of renal fibrosis in post-AKI patients was first examined by Masson’s trichrome staining. Compared with non-AKI patients that had minimal collagen deposition in their kidney tissues, all 13 post-AKI patients developed interstitial fibrosis to various extents. In these patients, the excessive collagen deposition was accompanied with tubular injury and atrophy, nephron loss, and widened peritubular interstitium (). In quantification, renal fibrotic area was 2.3% in non-AKI patients, and increased remarkably to 42.8% in post-AKI patients (). Autophagy was assessed by immunofluorescence of LC3B. In non-AKI biopsies, LC3B displayed predominantly an even, cytosolic distribution in renal tubules with limited and weak punctate staining indicative of a low basal level of tubular autophagy (: non-AKI). By contrast, both the amount and intensity of tubular LC3B punctate staining were enhanced in the renal biopsies from all 13 post-AKI patients, suggesting an increased formation of autophagosomes and autolysosomes (: AKI and enlarged inset). On average, non-AKI patients had 4 LC3B puncta per renal tubule, which was significantly increased to 19 in post-AKI renal biopsies (). We then analyzed FGF2 mRNA in these tissues by in situ hybridization (ISH) assay using the RNAscope® ISH technology, which detects each single target RNA molecule as a punctate dot. For positive control, we detected the mRNA signal dots of the house keeping gene PPIB/cyclophilin B (peptidylprolyl isomerase B) in both non-AKI and post-AKI biopsies using the Probe-Hs-PPIB (: positive control). As negative control, the Probe-DapB for a bacterial gene only detected nonspecific staining particularly in the cytoplasm of renal tubular cells due to endogenous alkaline phosphatase activity in these cells (: negative control). With FGF2 probe, renal tubules of non-AKI patient kidneys showed no or very few FGF2 dots (: non-AKI, FGF2). However, FGF2 dots appeared in renal tubules of all 13 post-AKI renal biopsies either scattered or in tiny clusters (: AKI, FGF2 and enlarged inset). Of note, the majority of FGF2-positive renal tubules was seen in fibrotic areas and surrounded by interstitium containing numerous inflammatory cells (: AKI, FGF2). By counting, the number of FGF2 dots increased from 0.4 per renal tubule in non-AKI biopsies to 6 in post-AKI patients (). To further determine the relationship between tubular autophagy, FGF2 mRNA, and renal fibrosis in post-AKI patients, we performed Pearson correlation analysis followed by simple linear regression. There was a significant positive correlation between LC3B puncta formation and FGF2 mRNA expression in renal tubules of post-AKI patients (). Moreover, the development of post-AKI fibrosis in these patients was also positively correlated with both tubular LC3B puncta formation and tubular expression of FGF2 (). In contrast, neither LC3B puncta formation nor FGF2 mRNA expression showed a good correlation with kidney injury markers, including peak serum creatinine (sCr), peak estimated glomerular filtration rate (eGFR) and nadir to peak sCr (Figure S7). Thus, the induction of tubular autophagy and FGF2 was rather an event associated with maladaptive repair after AKI than a direct consequence of initial kidney injury. This patient biopsy analysis supports the involvement of tubular autophagy and FGF2 in renal fibrosis and disease progression after AKI.
Figure 9. Induction of tubular autophagy and FGF2 in renal biopsies from post-AKI patients correlates with kidney interstitial fibrosis. Renal biopsies from non-AKI patient controls (n = 9) and post-AKI patients (n = 13) were assessed for the following: (A) Masson’s trichrome staining. Scale bar: 50 µm. (B) Quantification of fibrotic areas. (C) LC3B immunofluorescence. Scale bar: 15 µm. (D) Quantification of the numbers of LC3B puncta per renal tubule. (E) FGF2 ISH. Scale bar: 20 µm. Red arrows indicate FGF2-positive dots in renal tubular cells. (F) Quantification of the numbers of FGF2 dots per renal tubule. Correlation analysis between (G) LC3B puncta and FGF2 dots, (H) LC3B puncta and fibrotic areas, (I) FGF2 dots and fibrotic areas in post-AKI patients (n = 13). Data in (B, D and F) are presented as mean ± SD. For statistics, 2-tailed, unpaired Student t-test was used for (B, D and F). Pearson correlation analysis followed by simple linear regression was used for (G, H and I).
Discussion
Maladaptive kidney repair after AKI is characterized by evolving tubular pathologies, interstitial fibrosis and chronic inflammation, resulting in gradual decline of renal function and the progression to CKD. In this complex process, renal tubules not only bear the stress and damage but may also provide a driving force for interstitial fibrosis and chronic inflammation by releasing various pro-fibrotic and pro-inflammatory cytokines [Citation7–12]. Despite this understanding, the specific cytokines produced by renal tubular cells and the mechanism governing their production remain unclear. Using both experimental models and human renal biopsies from post-AKI patients, our current study has delineated the role and the underlying mechanism of autophagy in the development of renal fibrosis during maladaptive kidney repair after acute injury. We showed that autophagy was induced and sustained for weeks in renal tubules after ischemic injury in mice, and facilitated the transformation of renal tubular cells to a secretory phenotype with persistent production of pro-fibrotic cytokines. Notably, autophagy specifically induced the production and secretion of FGF2 in post-AKI mice and in TGFB1-treated renal tubular cells. Functionally, FGF2 released by tubular cells was shown to stimulate renal fibroblasts, suggesting that FGF2 is a key paracrine factor for tubulo-interstitial communication and renal fibrosis during maladaptive kidney repair. Remarkably, tubular autophagy, FGF2 expression and interstitial fibrosis showed significant correlations in renal biopsies from post-AKI patients.
In the acute injury phase of AKI, autophagy in renal tubular cells is activated to play a protective role [Citation26–30]. Li et al further reveal a dynamic change of tubular autophagy during ischemic AKI using autophagy reporter mice [Citation31]. Autophagy is shown to peak on day 1 after reperfusion and decrease toward basal levels on day 3. Interestingly, the decrease of autophagy on day 3 is accompanied with better tubular cell proliferation, suggesting that a tightly-regulated autophagy is critical for renal tubules not only to survive initial injury but also to regenerate properly for complete kidney repair [Citation31]. Our present study monitored autophagy after severe ischemic AKI when incomplete or maladaptive kidney repair took place. In our model, autophagy in renal tubules did not resolve completely to the basal level but was maintained at a higher than control level for weeks, eventually leading to fibrosis in post-ischemic kidneys. The mechanism of persistent autophagy during kidney repair remains poorly understood. A recent study [Citation44] indicates that chronic hypoxia after severe AKI activates the transcription factor FOXO3 (forkhead box O3) in a hypoxia inducible factor 1-dependent manner. Compared with wild-type mice, induction of autophagy in renal tubules after AKI is inhibited in proximal tubule-specific Foxo3 knockout mice, suggesting a role of the hypoxia inducible factor 1-FOXO3 pathway in tubular cell autophagy during kidney repair [Citation44]. In addition, recent work has implicated endoplasmic reticulum stress in tubular autophagy after ischemic AKI, promoting interstitial fibrosis [Citation45].
A role of autophagy in renal fibrosis was initially suggested by Ding et al using the model of unilateral ureteral obstruction [Citation46]. However, it remains controversial whether autophagy is pro- or anti-fibrotic [Citation37,Citation42,Citation46,Citation47]. In 2016, Baisantry et al demonstrated that ablation of Atg5 in renal tubular cells leads to a better kidney recovery from ischemic AKI with less inflammation, decreased accumulation of senescent cells, and reduced interstitial fibrosis, suggesting that tubular autophagy may promote interstitial fibrosis during maladaptive kidney repair [Citation42]. In the current study, we established the inducible, renal tubule-specific atg7 knockout mouse model, which allowed us to block tubular autophagy only during kidney repair without affecting initial AKI. We showed that tubular autophagy deficiency initiated after AKI reduced chronic tubular injury, inhibited pro-fibrotic phenotype transformation, and suppressed interstitial fibrosis. Moreover, we demonstrated a significant correlation between tubular autophagy and interstitial fibrosis in renal biopsies of post-AKI patients. These results provide compelling evidence that persistent autophagy in renal tubules promotes interstitial fibrosis during maladaptive tubular repair after severe AKI. Therefore, autophagy is primarily a protective mechanism in renal tubular cells during AKI but it becomes harmful and pro-fibrotic if persistently activated during maladaptive kidney repair after AKI.
In addition to autophagy, multiple changes in renal tubules have been implicated in the development of interstitial fibrosis after AKI, including tubular cell dedifferentiation, cell cycle arrest, senescence, and metabolic changes [Citation48,Citation49]. The relationships among these cellular changes are poorly understood in terms of fibrogenesis and kidney repair. Baisantry et al suggest that autophagy may promote senescence in renal tubular cells after AKI [Citation42]. Consistently, autophagy deficiency in iRT-atg7-KO mice suppressed tubular cell senescence in our study. Canaud et al [Citation50] further demonstrate the formation of senescence-associated target of rapamycin (TOR)-autophagy spatial coupling compartment (TASCC) in renal tubular cells during maladaptive kidney repair after AKI. Importantly, TASCC are formed in G2/M-arrested renal tubular cells to facilitate the secretion of fibrotic factors [Citation50]. In accordance with these findings, we detected that G2/M-arrested tubular cells were induced during kidney repair concurrently with tubular autophagy in WT mice and this induction was inhibited by autophagy deficiency in iRT-atg7-KO mice, suggesting a critical role of autophagy in promoting tubular cell cycle arrest. In addition, tubular cell dedifferentiation after AKI was also suppressed in iRT-atg7-KO mice, further supporting a role of autophagy in the overall phenotypic changes in renal tubular cells during maladaptive kidney repair. Despite these findings, the precise mechanisms by which autophagy promotes this secretory transformation of renal tubular cells are yet to be elucidated. The coordinated activation of autophagy and MTOR (mechanistic target of rapamycin kinase) in TASCC may represent a model where autophagy post-transcriptionally regulates the senescence-associated secretory phenotype (SASP) components at protein level by activating MTOR-mediated protein synthesis [Citation51], but the downstream effectors of MTOR for the synthesis of pro-fibrotic cytokines in renal tubular cells after AKI need to be determined. Moreover, multiple signaling pathways, such as DNA damage responses and stress kinases, converge toward the activation of two well-known SASP transcription factors (nuclear factor kappa B and CCAAT/enhancer binding protein beta), to regulate the expression of SASP genes at the transcription level [Citation52]. Further studies need to investigate the involvement of these signaling pathways in autophagy-associated tubular production of pro-fibrotic cytokines.
Another major finding of this study is the identification of FGF2 as a critical autophagy-dependent cytokine produced and secreted by tubular cells during maladaptive kidney repair. In post-ischemic kidneys, multiple pro-fibrotic cytokines were induced, whereas only FGF2 induction was inhibited by autophagy deficiency. FGF2 accumulated in the cytoplasm of atrophic tubules primarily at the basolateral side, which likely facilitated its secretion from tubular cells into the peritubular interstitium for fibroblast activation with ensuing fibrosis. In line with these findings, FGF2-positive tubules in both post-ischemic mouse kidneys and renal biopsies from post-AKI human patients were always surrounded by widened interstitial tissue indicative of chronic inflammation and fibrosis. In iRT-atg7-KO mice, tubular basolateral accumulation of FGF2 was reduced, and interstitial fibrotic tissue around the atrophic tubules was also largely eliminated. Remarkably, FGF2 staining in kidney cryo-sections of autophagy reporter mice appeared granular and a portion of these FGF2 granules co-localized with autophagosomes in renal tubules of fibrotic kidneys. As a protein lacking the signal sequence for conventional endoplasmic reticulum-Golgi secretory route, FGF2 is secreted through the type I unconventional protein secretion pathway that involves a lipidic pore-mediated translocation across the plasma membrane [Citation53]. The observed co-localization of FGF2 with autophagosomes may represent an additional mechanism named secretory autophagy, which regulates unconventional secretion of a wide range of factors and cytosolic cargo [Citation53,Citation54]. In fibroblasts treated with prolonged serum starvation, Bernard et al identify autophagy as an activator of MTOR complex 2 signaling leading to CCN2/CTGF induction and secretion to facilitate myofibroblast differentiation [Citation55]. A recent study further shows an autophagy-dependent secretion of latent TGFB1 in different types of cells including skin fibroblasts, MEFs and macrophages [Citation56]. These results, together with our findings in renal tubular cells, have raised questions on how the secretory autophagosome selects its secretory cargo and bypasses fusion with lysosomes to avoid degradation. In this regard, Leidal et al lately suggest a mechanism termed LC3-dependent extracellular vesicle loading and secretion in mediating the selection of cargo for secretory autophagy [Citation57]. Moreover, Kimura et al identify specialized receptors and a dedicated SNARE (soluble N-ethylmaleimide-sensitive factor attachment protein receptor) machinery as markers of degradative and secretory autophagosomes, with STX17 (syntaxin) directing lysosomal fusion for degradation whereas SEC22B (SEC22 homolog B, vesicle trafficking protein) and TRIM16 (tripartite motif containing 16) facilitating fusion with the plasma membrane for secretion [Citation58]. It is noteworthy that together with persistent autophagy, TGFB1 also induced a time-dependent, sustained FGF2 production in cultured proximal tubular cells, whereas the inductions of PDGFB and CCN2/CTGF were transient. These results indicate a possible reciprocal regulation between autophagy and FGF2. Once secreted, FGF2 via autocrine may in turn further activate autophagy in renal tubular cells. This positive feedback contributes to the persistent inductions specifically for autophagy and FGF2 during maladaptive repair after AKI.
In line with the results in animal and cell culture models, we also detected autophagy induction in renal tubular cells along with FGF2 induction in post-AKI human patients. Notably, we further demonstrated their correlation with renal interstitial fibrosis in these patients. While these preclinical and clinical studies support a pathogenic role of tubular autophagy in maladaptive kidney repair, there are still obstacles that make clinical translation of autophagy-based therapies to halt AKI progression very challenging. First, emerging evidence including this study indicates that tubular cell autophagy protects against AKI but it compromises tubular repair when sustained after AKI [Citation23,Citation42]. Such ambivalent effects need to be carefully considered when determining the timing, duration and magnitude of autophagy modulation for treatment. Second, autophagy has multifaceted roles in kidney fibrosis and the precise function remains controversial [Citation23,Citation24]. Therefore, the outcomes of autophagy modulation in treating fibrotic kidney disease including post-AKI fibrosis may depend on the etiology and progression or stage of the disease. Third, pharmacological modulation of autophagy may be a promising therapeutic strategy, but some of the candidate drugs may affect cellular processes beyond autophagy and therefore cause unexpected side effects. Finally, while our study is focused on autophagy in renal tubules, autophagy modulators given to patients may also affect other cells including vascular and immune cells. With these considerations, future studies need to further validate our results in a large scale of post-AKI patients with different etiologies. A thorough understanding of autophagy and the related paracrine mechanism in post-AKI kidneys would provide significant insights into maladaptive kidney repair and identify new strategies to prevent the progression to chronic kidney problems.
Materials and methods
Study approval
All animal experiments were conducted in compliance with a protocol approved by the Institutional Animal Care and Use Committee of Charlie Norwood VA Medical Center. Human kidney tissue collection was based on clinical indications and approved by the Ethics Committee of Shanghai Jiao Tong University Affiliated Sixth People’s Hospital. Written informed consent was obtained from all the patients prior to inclusion in the study.
Animals
C57BL/6 mice were originally purchased from the Jackson Laboratory and bred in house for the study. Autophagy reporter mice (CAG-RFP-GFP-LC3) were established recently [Citation31]. Atg7-floxed (Atg7flox/flox) mice were obtained from Dr. Masaaki Komatsu (Tokyo Metropolitan Institute of Medical Science, Japan) [Citation59]. The double transgenic mouse line (Pax8-rtTA±, LC1±) was provided by Dr. Robert Koester (University of Heidelberg, Germany) [Citation39]. Atg7flox/flox mice were crossed with Pax8-rtTA±, LC1± mice to generate a doxycycline-inducible, renal tubule-specific atg7 KO mouse model (iRT-atg7-KO). Doxycycline hyclate (Sigma-Aldrich, D9891) was dissolved in drinking water containing 5% sucrose and given to mice at 0.2 mg/ml for 1 week to induce Atg7 deletion from renal tubules. Genotyping of genomic DNA extracted from kidney tissues was performed by PCR using primer Atg7s (5’-TGGCTGCTACTTCTGCAATGATGT-3’) and primer Atg7 96–121c (5’- TTAGCACAGGGAACAGCGCTCATGG-3’), which amplified a 4.4 Kb fragment for Atg7 flox allele and a 2.2 Kb product for atg7 deletion allele [Citation59]. Fgf2 KO mouse line (Fgf2tm1Doe/J, Stock # 003256) was purchased from the Jackson Laboratory. Mice were housed in a pathogen-free animal facility at Charlie Norwood VA Medical Center under a 12/12-h of light/dark pattern with free access to food and water. Littermate male mice of 10 to 12 weeks old were used for experiments.
AKI patients, classification and staging
We performed a retrospective review of patients diagnosed for AKI from June of 2017 to June of 2020 in Shanghai Jiao Tong University Affiliated Sixth People’s Hospital. A total of 13 patients with AKI who underwent a renal biopsy were recruited for this study, including 3 patients with stage 1, 5 with stage 2, and 5 with stage 3 AKI. AKI definition and staging was performed on the basis of Kidney Disease: Improving Global Outcomes (KDIGO) system [Citation60] and described in details in our recent studies [Citation61]. Pathologically, all 13 patients were diagnosed with acute interstitial nephropathy (AIN) (Table S1). 9 non-AKI human kidney samples were used as control, including 5 normal nephrectomy tissues adjacent to tumors and 4 cases of minor glomerular lesions.
Mouse model of unilateral and bilateral ischemic AKI
Before surgery, mice were given pentobarbital (50 mg/kg, i.p.) for anesthesia and sustained-release buprenorphine (1 mg/kg, s.c.) for analgesia. A homeothermic blanket control unit with rectal probe (Harvard Apparatus, 507220F) was used during surgery to monitor and maintain body temperature at ~36.5°C. To induce unilateral renal ischemia, left renal pedicle was exposed by flank incision and clamped for 30 min. The clamp was then released for reperfusion for up to 4 weeks with the right kidney kept intact. For bilateral model, both renal pedicles were exposed and clamped for 25 min. Kidney color changes were observed to indicate sufficient ischemia and reperfusion. Sham control mice underwent the same operation without renal pedicle clamping. In some unilateral ischemic AKI experiments, 2 days after reperfusion, the right kidney was removed by nephrectomy surgery and blood samples were collected 1 day later for measurement of BUN and serum creatinine to evaluate the function of the left kidney.
Cells
Boston University mouse proximal tubular cell line (BUMPT) was originally from Dr. Wilfred Lieberthal (Boston University School of Medicine) and cultured in Dulbecco’s Modified Eagle’s Medium (DMEM; ThermoFisher Scientific, 12100046) with 10% fetal bovine serum (FBS) [Citation62]. The immortalized atg7 KO mouse proximal tubular cell line and its floxed control/WT cell line were generated by our lab recently [Citation37]. These 2 stable cell lines were grown in DMEM containing 10% FBS, insulin (10 µg/ml; Sigma-Aldrich, I9278), TRF (transferrin; 5 µg/ml; Sigma-Aldrich, T8158), EGF (epidermal growth factor; 10 ng/ml; Sigma-Aldrich, E9644), and dexamethasone (4 µg/ml; Sigma-Aldrich, D1756). Isolation of primary proximal tubular cells from 5-wk-old WT and fgf2 KO mice was performed according to an established protocol described in our previous work [Citation37]. The primary cells were grown in DMEM/F12 medium (ThermoFisher Scientific, 12500062) supplemented with 10% FBS, insulin (5 µg/ml), TRF (5 µg/ml), hydrocortisone (50 nM; Sigma-Aldrich, H0888), and vitamin C (50 µM; Sigma-Aldrich, A4544). The rat kidney fibroblast cell line NRK-49F was obtained from the American Type Culture Collection (CRL-1570) and cultured in DMEM with 10% FBS.
TGFB1 treatment of renal tubular cell lines and primary proximal tubular cells
Cells were seeded in 35-mm dishes at a density of 0.4 × 10⁶ cells/dish for BUMPT or 0.5 × 10⁶ cells/dish for WT and atg7 KO mouse proximal tubular cells. The first passage of primary proximal tubular cells (WT and fgf2 KO PT) were grown for 9 to 10 days after isolation and then plated in 35-mm dishes at a density of 0.2 × 10⁶ cells/dish. Cells reached ~ 60% confluence by the next day and were exposed to 5 ng/ml human recombinant TGFB1 (Sigma-Aldrich, T7039) in serum-free DMEM for up to 3 days. Control cells were cultured in serum-free medium without TGFB1. In the experiment testing the effect of autophagy inhibitors, 2 µM CQ (Sigma-Aldrich, C6628) or 1 mM 3-MA (Sigma-Aldrich, M9281) was added during TGFB1 treatment of cells. In the experiment testing the effect of FGF2 neutralizing antibody (Millipore, 05–117), FGF2 antibody or mouse IgG was added before the day of CM collection. Following treatment, cells were monitored morphologically and collected at the indicated time points for RT-qPCR and immunoblot analysis. In some experiments, tubular cell culture media were also collected and concentrated for ELISA or immunoblot analysis of secreted cytokines.
Tubular cell-CM collection, purification and treatment of renal fibroblasts
For tubular cell lines, cells were seeded in 60-mm dishes at a density of 1 × 10⁶ cells/dish for BUMPT or 1.3 × 10⁶ cells/dish for WT and atg7 KO mouse proximal tubular cells. Primary proximal tubular cells (WT and fgf2 KO) were plated in 60-mm dishes at a density of 0.5 × 10⁶ cells/dish. Cells reached ~60% confluence by the next day and were subjected to 5 ng/ml TGFB1 treatment in serum-free medium for 2 days, while control cells were kept in serum-free medium without TGFB1 for 2 days. Then, the culture media for both TGFB1-treated and control cells were replaced with fresh media free of TGFB1, and incubated for another day to collect tubular cell-CM.
Concentration of tubular cell-CM was performed using Amicon® Ultra-4 centrifugal filter unit with a 3 kDa molecular weight cutoff (Millipore, UFC8003). Briefly, 4 ml CM from each 60-mm dish was collected and centrifuged at 1,000 × g for 5 min at room temperature to remove cell debris. The supernatant was then transferred to a Milli-Q® water pre-rinsed centrifugal filter unit and centrifuged at 7,500 × g on a fixed-angle rotor for 1 h at 4°C to recover approximately 100 µl concentrated CM. To ensure optimal activity, the concentrated CM was used for treatment immediately or stored at −80°C freezer for no more than 3 days before use. Repeated freeze/thaw cycles were avoided all the times.
To treat fibroblasts with tubular cell-CM, NRK-49F fibroblasts were seeded in 12-well plate at a density of 0.15 × 10⁶ cells/well to reach ~80% confluence by the next day. Following overnight starvation in serum-free medium, subconfluent NRK-49F fibroblasts were incubated with tubular cell-CM (100 µl diluted in 1 ml serum-free DMEM) for 2 days. Cells were monitored morphologically, trypsinized for counting using Bio-Rad TC20 automated cell counter, and then lysed for cellular protein measurement and immunoblot analysis. In experiments testing the effect of FGF2 neutralizing antibody, the antibody or mouse IgG was pre-incubated with tubular cell-CM for ~1.5 h at room temperature before adding to NRK-49F fibroblasts. FGF2 neutralizing antibody was tested at different concentrations of 5, 10 and 20 µg/ml.
Analysis of autophagy in mouse kidneys
Autophagy was evaluated in mouse kidneys by LC3-based methods described in our recent work with some modifications [Citation37,Citation63]. For LC3 IHC, mice were fixed by cardiac perfusion with 4% paraformaldehyde. Kidneys were collected, further fixed in the same fixative overnight, and embedded in paraffin. Tissue sections (4 µm) were deparaffinized and incubated with 1 mM EDTA, 0.05% Tween-20 (Fisher Scientific, BP337-500), pH 8.0 at 95–100°C for antigen retrieval. After incubated in sequence with 3% H2O2, streptavidin-biotin blocking buffer (Vector Laboratories, SP-2002), and 2.5% normal horse serum (Vector Laboratories, S-2012), the slides were exposed to 1:1000 rabbit anti-LC3B (Novus Biologicals, NB100-2220) at 4°C overnight and then ImmPRESS™ HRP polymer horse-anti-rabbit secondary antibody (Vector Laboratories, MP-7401) at room temperature for 30 min. To amplify signal, the slides were further incubated with a Tyramide SuperBoost™ kit with biotin-conjugated tyramide (ThermoFisher Scientific, B40931) for 5 min at room temperature, followed by addition of stop reagent provided in the kit to terminate the reaction. After washing, the slides were incubated with VECTASTAIN® Elite® ABC-HRP kit (Vector Laboratories, PK-6100) at room temperature for 1 h and signals were revealed with Vector® DAB kit (Vector Laboratories, SK-4100). The dynamic changes of autophagy were also analyzed in autophagy reporter mice. Briefly, after experiment, CAG-RFP-GFP-LC3 mice were perfused with 4% paraformaldehyde. Harvested kidneys were post-fixed in the same fixative overnight, balanced with 30% sucrose, and embedded in Tissue-Tek® O.C.T. compound (Sakura Finetek USA, 4583). Cryo-sections of 5 µm were then mounted with ProLong™ Diamond antifade reagent with DAPI (ThermoFisher Scientific, P36962) for confocal microscopy (Zeiss LSM 780 upright, Carl Zeiss USA). 8 to 10 random fields (630×) were selected from each section for quantitative analysis using ImageJ. After counting punctate staining in renal tubules, the number of autophagosomes was indicated by yellow (GFP-LC3 overlapping RFP-LC3) puncta and the number of autolysosomes (red-only puncta) was obtained by subtracting yellow puncta from total red puncta. The percentage of autolysosomes in total autophagy puncta was calculated as autophagic flux rate. In addition to the morphological assays, immunoblot analysis of LC3B in kidney tissue lysates was also used to monitor autophagy.
IHC and immunofluorescence of FGF2 in mouse kidneys
For FGF2 IHC, kidneys were routinely harvested, fixed overnight in 4% paraformaldehyde, and paraffin-embedded for tissue sectioning at 4 µm. After antigen retrieval in 10 mM sodium citrate, 0.05% Tween-20, pH 6.0 at 95–100°C, the slides were incubated with 3% H2O2 to block endogenous peroxidase activity and then 2.5% normal horse serum to reduce nonspecific binding. The slides were further incubated with 1:100 rabbit anti-FGF2 (Abcam, ab106245; discontinued) at 4°C overnight and then ImmPRESS HRP polymer horse-anti-rabbit secondary antibody at room temperature for 1 h. Negative controls were done by replacing the primary antibody with antibody diluent. After washes, the signals were developed with Vector® DAB kit and counterstained with hematoxylin. For quantification, 20 to 30 fields (400×) were randomly selected from each section and the percentage of FGF2-positive stained area was analyzed using ImageJ.
To examine the co-localization of FGF2 with autophagic vesicles, FGF2 immunofluorescence was performed in kidney cryo-sections of autophagy reporter mice. Tissue fixation and processing were described above. Without antigen retrieval, cryo-sections (5 µm) were incubated with a blocking buffer containing 2% bovine serum albumin, 0.2% milk, 2% normal goat serum (Jackson ImmunoResearch, 005–000-121) and 0.8% Triton X-100 (Fisher Scientific, BP151-500) at room temperature for 1 h. The slides were then exposed to 1:50 rabbit anti-FGF2 at 4°C overnight, followed by incubation with 1:500 goat-anti-rabbit Alexa Fluor™ 405 secondary antibody (ThermoFisher Scientific, A-31556) for 1 h at room temperature. The slides were mounted with ProLong™ Diamond antifade reagent without DAPI (ThermoFisher Scientific, P36961) to examine the co-localization of FGF2 with autophagosomes and/or autolysosomes under confocal microscopy.
RNA isolation and RT-qPCR
Total RNA was extracted from cells or snap-frozen kidney tissues with GeneJET RNA purification kit (ThermoFisher Scientific, K0732) following the manufacturer’s protocol. For Fgf2 RT-qPCR with RNA extracted from WT and atg7 KO mouse proximal tubular cells, 2 µg total RNA was converted to single-stranded cDNA using high-capacity cDNA reverse transcription kit (ThermoFisher Scientific, 4368814) and RT-qPCR was performed using TaqMan® Universal PCR master mix without AmpErase® UNG (ThermoFisher Scientific, 4324018) according to the manufacturer’s instructions. For the other RT-qPCR assays, cDNA was synthesized from 1 µg total RNA using iScript™ cDNA synthesis kit (Bio-Rad, 1708891) and RT-qPCR was done with iTaq™ Universal SYBR® Green supermix (Bio-Rad, 1725121) following the manufacturer’s instructions. GAPDH (Glyceraldehyde-3-phosphate dehydrogenase) was used as an endogenous control for normalization. Comparative CT (ΔΔCT) was set up on StepOne™ Software for quantification as described in our previous studies [Citation38,Citation64]. The primer sequences used for RT-qPCR were listed in Table S2.
Immunoblot analysis
Cultured cell or kidney tissue lysates were extracted in SDS buffer containing 62.5 mM Tris-HCl, pH 6.8, 2% SDS, 10% glycerol supplemented with protease inhibitor cocktail (Sigma-Aldrich, P8340) and Benzonase® Nuclease (Millipore, 70746). After protein concentration measurement with Pierce™ BCA protein assay kit (ThermoFisher Scientific, 23225), equal amounts of protein (10 µg for cell lysate, 50 µg for tissue lysate) were loaded in each lane, separated by SDS-PAGE under reducing conditions, and transferred onto PVDF membrane for standard procedure of immunoblot analysis. For concentrated culture media collected from control or TGFB1-treated tubular cells, equal volume of 10 µl was loaded in each lane for electrophoresis. Primary antibodies for immunoblot: rabbit anti-LC3B (Novus Biologicals, NB100-2220; 1:1000), rabbit anti-ATG7 (Sigma-Aldrich, A2856; 1:500), rabbit anti-ATG5 (Abcam, ab108327; 1:1000), mouse anti-SQSTM1/p62 (Abcam, ab56416; 1:2000), rabbit anti-COL1A1 (Novus Biologicals, NBP1-30054; 1:500), rabbit anti-FN1 (Abcam, ab2413; 1:4000), rabbit anti-ACTA2/α-SMA (Abcam, ab5694; 1:1000), rabbit anti-FGF2 (Abcam, ab106245; 1:500, discontinued), mouse anti-FGF2 (Millipore, 05–118; 1:1000), rabbit anti-CCN2/CTGF (Novus Biologicals, NBP2-16025; 1:1000), rabbit anti-PDGFB (Santa Cruz Biotechnology, sc-7878; 1:200, discontinued), rabbit anti-TGFB1 (Abcam, ab92486; 1:1000), mouse anti-ACTB/β-actin (Sigma-Aldrich, A5316; 1:10,000), rabbit anti-PPIB/cyclophilin B (Abcam, ab16054; 1:10,000). Secondary antibodies for immunoblot analysis were from ThermoFisher Scientific. Antigens on the blots were revealed with Clarity™ Western ECL substrate kit (Bio-Rad, 1705061).
ELISA of FGF2 and CCN2/CTGF
To measure tubular release of cytokines, culture media from control or TGFB1-treated mouse tubular cells were collected and concentrated as described above. ELISA of FGF2 and CCN2/CTGF was performed using mouse FGF2 ELISA kit (ELISAGenie, MOFI00666) and mouse CCN2/CTGF ELISA kit (ELISAGenie, MOFI00185), respectively. In brief, a series of standard dilutions was freshly prepared as instructed and 100 µl of each standard was added into appropriate wells. Meanwhile, samples were diluted 2-fold (50 µl samples mixed with 50 µl 1× Diluent) to make up a volume of 100 µl for each well. Following overnight incubation at 4°C for FGF2 or incubation for 2.5 h at room temperature for CCN2/CTGF, the wells were carefully washed 4 times. The wells were then sequentially incubated at room temperature with 100 µl/well biotinylated FGF2 or CCN2/CTGF detection antibody for 1 h and 100 µl/well Streptavidin-HRP for 45 min. Complete wash was performed after each incubation. The color was developed by incubation with 100 µl/well TMB substrate for 30 min at room temperature. Following addition of 50 µl/well stop solution, the absorbance at 450 nm was read on TECAN Infinite® 200 PRO immediately and the concentrations of released FGF2 and CCN2/CTGF were calculated based on standard curves.
Renal function, histology, immunofluorescence, and SA-GLB1/β-gal staining
To measure renal function, blood samples were obtained for coagulation and centrifugation at room temperature to collect serum. BUN was determined using Stanbio urea nitrogen test kit (Stanbio Laboratory, 0580). The reaction was conducted at 100°C for 12 min and the absorbance at 520 nm was recorded by the end of reaction. Serum creatinine was measured using creatinine biochemistry reagent (Stanbio Laboratory, 0430). Samples were added to a pre-warmed (37°C) reaction mixture and the absorbance at 510 nm was monitored kinetically at 20 s and 80 s of reaction. The levels of BUN and creatinine (mg/dl) were then calculated according to standard curves.
For histology, kidney tissues were fixed with 4% paraformaldehyde, embedded in paraffin, and sectioned at 4 µm. Renal fibrosis was examined by Masson’s trichrome staining (Sigma-Aldrich, HT-15) or Sirius Red/Fast Green staining (Chondrex, 9046) following the manufacturer’s procedures. Collagen fibrils including COL1, COL3 and COL4 were stained either blue or magenta. 10 to 20 positive collagen-stained fields (100× or 200×) were randomly selected from each section and analyzed quantitatively by ImageJ as described previously [Citation37].
Immunofluorescence was performed on 4 µm paraformaldehyde-fixed, paraffin-embedded kidney tissue sections. Briefly, after rehydration, tissue sections were incubated with 10 mM sodium citrate, 0.05% Tween-20, pH 6.0 or 10 mM Tris, 1 mM EDTA, 0.05% Tween-20, pH 9.0 at 95–100°C for antigen retrieval. Nonspecific binding was blocked with a buffer containing 2% bovine serum albumin, 0.2% milk, 2% normal donkey serum (Jackson ImmunoResearch, 017–000-121) and 0.8% Triton X-100. The slides were then exposed to the following primary antibodies for single or double staining at 4°C overnight: rabbit anti-COL1A1 (Novus Biologicals, NBP1-30054; 1:300), rabbit anti-COL4A1 (Abcam, ab6586; 1:300), rabbit anti-FN1 (Abcam, ab2413; 1:500), rabbit anti-ACTA2/α-SMA (Abcam, ab5694; 1:400), rabbit anti-VIM (D21H3; Cell Signaling Technology, 5741; 1:200), goat anti-mouse HAVCR1/KIM-1 (R&D Systems, AF1817; 1:400), rabbit anti-ATG7 (LSBio, LS-B2195; 1:1000), rabbit anti-MKI67/Ki67 (Cell Signaling Technology, 9129; 1:400), mouse anti-γ-H2AX (Abcam, ab26350, 1:200), mouse anti-p-H3 (Cell Signaling Technology, 9706, 1:400). After washing, the slides were incubated with corresponding Alexa Fluor™-conjugated secondary antibodies (ThermoFisher Scientific, A-10037, A-10042, A-11057, A-21202, A-21206, A-21081) at room temperature for 1 h. In some experiments, the slides were also stained with FITC-LTL (Vector Laboratories, FL-1321; 1:100) to indicate brush border of intact proximal tubules. After mounted with ProLong™ Diamond antifade reagent, the slides were examined by fluorescence or confocal microscopy. 10 to 20 random fields (100× or 200×) were selected from each section for quantitative analysis of COL1A1-, COL4A1-, FN1-, ACTA2-, VIM-, LTL- and HAVCR1/KIM-1-positive staining areas using ImageJ. The portion of p-H3-positive cells in total MKI67-positive cells indicated tubular cells in G2/M phase. Renal tubular cells that had 4 or more γ-H2AX-positive nuclear foci but negative for MKI67 were considered senescent. For quantification, 10 to 20 fields (400×) were randomly selected from each section and the percentage of senescent tubular cells was analyzed with ImageJ.
Tubular senescent changes were also determined by SA-GLB1/β-gal staining of kidney tissues using a senescence detection kit (Abcam, ab65351). Kidneys were harvested, snap-frozen in liquid nitrogen, and embedded in Tissue-Tek® O.C.T. compound. 4 µm tissue sections were fixed with fixative solution for 15 min at room temperature and then immersed in staining solution overnight at 37°C to develop blue color. To ensure optimal enzymatic activity, kidney tissues were processed for staining on the same day of harvest. When left overnight at 37°C, the slides were sealed in a humidified chamber to avoid the formation of salt crystals. 10 to 20 random fields (200×) were selected from each section for quantitative analysis using ImageJ.
Clinical pathology, evaluation of autophagy and FGF2 in human post-AKI renal biopsy samples
Paraformaldehyde-fixed, paraffin-embedded renal biopsy samples were sectioned at 3 µm for clinical pathology including hematoxylin and eosin, periodic acid-Schiff, and Masson’s trichrome staining. The slides were reviewed by 2 independent pathologists and a nephrologist in a blinded manner. Interstitial fibrosis and tubular atrophy (IFTA) score was determined by tubular injury (brush border loss, necrosis, atrophy, etc), interstitial inflammation and excessive collagen deposition according to the Banff working classification [Citation65].
Autophagy in human kidney biopsies was monitored by immunofluorescence of LC3B using a Tyramide SuperBoost™ kit with Alexa Fluor™ 488-conjugated tyramide (ThermoFisher Scientific, B40922). Briefly, after antigen retrieval in 1 mM EDTA, 0.05% Tween-20, pH 8.0 at 95–100°C, tissue sections were incubated with 3% H2O2 and 10% normal goat serum, followed by exposure to 1:5000 rabbit anti-LC3B (Novus Biologicals, NB100-2220) overnight at 4°C and HRP polymer goat-anti-rabbit secondary antibody at room temperature for 30 min. The signals were amplified by Alexa Fluor™ 488-conjugated tyramide and visualized under confocal microscopy. 20 to 30 fields (630×) with approximately 150 to 200 renal tubules were randomly selected from each section and the numbers of LC3B-positive dots per renal tubule were counted for quantification by ImageJ.
FGF2 mRNA expression in human kidney tissues was evaluated with an RNAscope® ISH kit from Advanced Cell Diagnostics, which included RNAscope® Probe-Hs-FGF2 (312111), RNAscope® positive control Probe-Hs-PPIB/cyclophilin B (313901), RNAscope® negative control Probe-DapB (310043), and RNAscope® 2.5 HD reagent kit-RED (322350). In this assay, with 20 specific double Z probe pairs, RNAscope® Probe-Hs-FGF2 hybridized to target human FGF2 RNA molecules in a highly specific and sensitive manner. Meanwhile, RNAscope® positive control Probe-Hs-PPIB/cyclophilin B (a housekeeping gene) and RNAscope® negative control Probe-DapB (a nonspecific bacterial gene) were used to ensure technical workflow quality control and sample/RNA quality control. The ISH procedure outlined by sample preparation, pretreatment, hybridization, signal amplification and development was performed following the manufacturer’s step-by-step manual. After staining, the slides were scanned with a digital slide scanner PANNORAMIC Desk P-midi P250 (3DHISTECH Ltd., Hungary) and whole sections were analyzed using CaseViewer 2.3 software. For quantification, 150 to 200 renal tubules were randomly selected from each section and the numbers of FGF2-positive dots per renal tubule were counted at 630× magnification.
Statistics
Qualitative data including immunoblots and cell/tissue images are representatives of at least 3 experiments. Quantitative Data were expressed as means ± SD. Statistical analysis was conducted using the GraphPad Prism 9. Statistical differences between two groups were determined by 2-tailed, unpaired Student t-test. Statistical differences in multiple groups were determined by one-way or two-way ANOVA with multiple comparisons. Pearson correlation analysis followed by simple linear regression was used to determine the association between autophagy, FGF2 and AKI progression in human renal biopsy samples. P values were indicated in the figures. P < 0.05 was considered significantly different.
Supplemental Material
Download MS Word (7 MB)Acknowledgments
We thank Dr. Masaaki Komatsu and Dr. Robert Koester for providing Atg7flox/flox mice and double transgenic Pax8-rtTA±, LC1± mice respectively that were used in this study to generate the inducible, renal tubule-specific atg7 knockout mouse model. We also thank Dr. Joseph Hill (University of Texas Southwestern Medical Center) for providing the autophagy reporter mice (CAG-RFP-GFP-LC3).
Disclosure statement
All authors declare that they have no conflict of interest.
Supplementary material
Supplemental data for this article can be accessed online at https://doi.org/10.1080/15548627.2022.2072054
Additional information
Funding
References
- Ronco C, Bellomo R, Kellum JA. Acute kidney injury. Lancet. 2019;394:1949–1964.
- Mehta RL, Burdmann EA, Cerda J, et al. Recognition and management of acute kidney injury in the International Society of Nephrology 0by25 global snapshot: a multinational cross-sectional study. Lancet. 2016;387:2017–2025.
- See EJ, Jayasinghe K, Glassford N, et al. Long-term risk of adverse outcomes after acute kidney injury: a systematic review and meta-analysis of cohort studies using consensus definitions of exposure. Kidney Int. 2019;95:160–172.
- Chawla LS, Eggers PW, Star RA, et al. Acute kidney injury and chronic kidney disease as interconnected syndromes. N Engl J Med. 2014;371:58–66.
- Coca SG, Singanamala S, Parikh CR. Chronic kidney disease after acute kidney injury: a systematic review and meta-analysis. Kidney Int. 2012;81:442–448.
- Hsu CY. Yes, AKI truly leads to CKD. J Am Soc Nephrol. 2012;23:967–969.
- Ferenbach DA, Bonventre JV. Mechanisms of maladaptive repair after AKI leading to accelerated kidney ageing and CKD. Nat Rev Nephrol. 2015;11:264–276.
- Venkatachalam MA, Weinberg JM, Kriz W, et al. Failed tubule recovery, AKI-CKD transition, and kidney disease progression. J Am Soc Nephrol. 2015;26:1765–1776.
- Basile DP, Bonventre JV, Mehta R, et al. Progression after aki: understanding maladaptive repair processes to predict and identify therapeutic treatments. J Am Soc Nephrol. 2016;27:687–697.
- Kumar S. Cellular and molecular pathways of renal repair after acute kidney injury. Kidney Int. 2018;93:27–40.
- Humphreys BD. Mechanisms of renal fibrosis. Annu Rev Physiol. 2018;80:309–326.
- Liu BC, Tang TT, Lv LL, et al. Renal tubule injury: a driving force toward chronic kidney disease. Kidney Int. 2018;93:568–579.
- Grgic I, Campanholle G, Bijol V, et al. Targeted proximal tubule injury triggers interstitial fibrosis and glomerulosclerosis. Kidney Int. 2012;82:172–183.
- Takaori K, Nakamura J, Yamamoto S, et al. Severity and frequency of proximal tubule injury determines renal prognosis. J Am Soc Nephrol. 2016;27:2393–2406.
- Humphreys BD, Xu F, Sabbisetti V, et al. Chronic epithelial kidney injury molecule-1 expression causes murine kidney fibrosis. J Clin Invest. 2013;123:4023–4035.
- Geng H, Lan R, Wang G, et al. Inhibition of autoregulated TGFbeta signaling simultaneously enhances proliferation and differentiation of kidney epithelium and promotes repair following renal ischemia. Am J Pathol. 2009;174:1291–1308.
- Lan R, Geng H, Polichnowski AJ, et al. PTEN loss defines a TGF-beta-induced tubule phenotype of failed differentiation and JNK signaling during renal fibrosis. Am J Physiol Renal Physiol. 2012;302:F1210–1223.
- Geng H, Lan R, Singha PK, et al. Lysophosphatidic acid increases proximal tubule cell secretion of profibrotic cytokines PDGF-B and CTGF through LPA2- and Galphaq-mediated Rho and alphavbeta6 integrin-dependent activation of TGF-beta. Am J Pathol. 2012;181:1236–1249.
- Lan R, Geng H, Singha PK, et al. Mitochondrial pathology and glycolytic shift during proximal tubule atrophy after ischemic AKI. J Am Soc Nephrol. 2016;27:3356–3367.
- Kang HM, Ahn SH, Choi P, et al. Defective fatty acid oxidation in renal tubular epithelial cells has a key role in kidney fibrosis development. Nat Med. 2015;21:37–46.
- Yang L, Besschetnova TY, Brooks CR, et al. Epithelial cell cycle arrest in G2/M mediates kidney fibrosis after injury. Nat Med. 2010;16:535–543, 1p following 143.
- Mizushima N. A brief history of autophagy from cell biology to physiology and disease. Nat Cell Biol. 2018;20:521–527.
- Tang C, Livingston MJ, Liu Z, et al. Autophagy in kidney homeostasis and disease. Nat Rev Nephrol. 2020;16:489–508.
- Choi ME. Autophagy in kidney disease. Annu Rev Physiol. 2020;82:297–322.
- Huber TB, Edelstein CL, Hartleben B, et al. Emerging role of autophagy in kidney function, diseases and aging. Autophagy. 2012;8:1009–1031.
- Kimura T, Takabatake Y, Takahashi A, et al. Autophagy protects the proximal tubule from degeneration and acute ischemic injury. J Am Soc Nephrol. 2011;22:902–913.
- Liu S, Hartleben B, Kretz O, et al. Autophagy plays a critical role in kidney tubule maintenance, aging and ischemia-reperfusion injury. Autophagy. 2012;8:826–837.
- Jiang M, Wei Q, Dong G, et al. Autophagy in proximal tubules protects against acute kidney injury. Kidney Int. 2012;82:1271–1283.
- Takahashi A, Kimura T, Takabatake Y, et al. Autophagy guards against cisplatin-induced acute kidney injury. Am J Pathol. 2012;180:517–525.
- Kaushal GP, Shah SV. Autophagy in acute kidney injury. Kidney Int. 2016;89:779–791.
- Li L, Wang ZV, Hill JA, et al. New autophagy reporter mice reveal dynamics of proximal tubular autophagy. J Am Soc Nephrol. 2014;25:305–315.
- Brooks CR, Yeung MY, Brooks YS, et al. KIM-1-/TIM-1-mediated phagocytosis links ATG5-/ULK1-dependent clearance of apoptotic cells to antigen presentation. EMBO J. 2015;34:2441–2464.
- Sharfuddin AA, Molitoris BA. Pathophysiology of ischemic acute kidney injury. Nat Rev Nephrol. 2011;7:189–200.
- Bonventre JV, Yang L. Cellular pathophysiology of ischemic acute kidney injury. J Clin Invest. 2011;121:4210–4221.
- Fu Y, Cai J, Li F, et al. Chronic effects of repeated low-dose cisplatin treatment in mouse kidneys and renal tubular cells. Am J Physiol Renal Physiol. 2019;317:F1582–F1592.
- Klionsky DJ, Abdel-Aziz AK, Abdelfatah S, et al. Guidelines for the use and interpretation of assays for monitoring autophagy (4th edition)(1). Autophagy. 2021;17:1–382.
- Livingston MJ, Ding HF, Huang S, et al. Persistent activation of autophagy in kidney tubular cells promotes renal interstitial fibrosis during unilateral ureteral obstruction. Autophagy. 2016;12:976–998.
- Ma Z, Li L, Livingston MJ, et al. p53/microRNA-214/ULK1 axis impairs renal tubular autophagy in diabetic kidney disease. J Clin Invest. 2020;130:5011–5026.
- Traykova-Brauch M, Schonig K, Greiner O, et al. An efficient and versatile system for acute and chronic modulation of renal tubular function in transgenic mice. Nat Med. 2008;14:979–984.
- Schonig K, Schwenk F, Rajewsky K, et al. Stringent doxycycline dependent control of CRE recombinase in vivo. Nucleic Acids Res. 2002;30:e134.
- Polichnowski AJ, Lan R, Geng H, et al. Severe renal mass reduction impairs recovery and promotes fibrosis after AKI. J Am Soc Nephrol. 2014;25:1496–1507.
- Baisantry A, Bhayana S, Rong S, et al. Autophagy induces prosenescent changes in proximal tubular S3 segments. J Am Soc Nephrol. 2016;27:1609–1616.
- Mylonas KJ, O’Sullivan ED, Humphries D, et al. Cellular senescence inhibits renal regeneration after injury in mice, with senolytic treatment promoting repair. Sci Transl Med. 2021;13:eabb0203. doi:10.1126/scitranslmed.abb0203.
- Li L, Kang H, Zhang Q, et al. FoxO3 activation in hypoxic tubules prevents chronic kidney disease. J Clin Invest. 2019;129:2374–2389.
- Shu S, Zhu J, Liu Z, et al. Endoplasmic reticulum stress is activated in post-ischemic kidneys to promote chronic kidney disease. EBioMedicine. 2018;37:269–280.
- Ding Y, Kim S, Lee SY, et al. Autophagy regulates TGF-beta expression and suppresses kidney fibrosis induced by unilateral ureteral obstruction. J Am Soc Nephrol. 2014;25:2835–2846.
- Li H, Peng X, Wang Y, et al. Atg5-mediated autophagy deficiency in proximal tubules promotes cell cycle G2/M arrest and renal fibrosis. Autophagy. 2016;12:1472–1486.
- Gewin LS. Renal fibrosis: primacy of the proximal tubule. Matrix Biol. 2018;68-69:248–262.
- He L, Livingston MJ, Dong Z. Autophagy in acute kidney injury and repair. Nephron Clin Pract. 2014;127:56–60.
- Canaud G, Brooks CR, Kishi S, et al. Cyclin G1 and TASCC regulate kidney epithelial cell G2-M arrest and fibrotic maladaptive repair. Sci Transl Med. 2019;11. DOI:10.1126/scitranslmed.aav4754.
- Narita M, Young AR, Arakawa S, et al. Spatial coupling of mTOR and autophagy augments secretory phenotypes. Science. 2011;332:966–970.
- Malaquin N, Martinez A, Rodier F. Keeping the senescence secretome under control: molecular reins on the senescence-associated secretory phenotype. Exp Gerontol. 2016;82:39–49.
- New J, Thomas SM. Autophagy-dependent secretion: mechanism, factors secreted, and disease implications. Autophagy. 2019;15:1682–1693.
- Ponpuak M, Mandell MA, Kimura T, et al. Secretory autophagy. Curr Opin Cell Biol. 2015;35:106–116.
- Bernard M, Dieude M, Yang B, et al. Autophagy fosters myofibroblast differentiation through MTORC2 activation and downstream upregulation of CTGF. Autophagy. 2014;10:2193–2207.
- Nuchel J, Ghatak S, Zuk AV, et al. TGFB1 is secreted through an unconventional pathway dependent on the autophagic machinery and cytoskeletal regulators. Autophagy. 2018;14:465–486.
- Leidal AM, Huang HH, Marsh T, et al. The LC3-conjugation machinery specifies the loading of RNA-binding proteins into extracellular vesicles. Nat Cell Biol. 2020;22:187–199.
- Kimura T, Jia J, Kumar S, et al. Dedicated SNAREs and specialized TRIM cargo receptors mediate secretory autophagy. EMBO J. 2017;36:42–60.
- Komatsu M, Waguri S, Ueno T, et al. Impairment of starvation-induced and constitutive autophagy in Atg7-deficient mice. J Cell Biol. 2005;169:425–434.
- Section 2: AKI definition. Kidney Int Suppl. 2012;2:19–36.
- Fan Y, Xiao W, Lee K, et al. Inhibition of reticulon-1A-mediated endoplasmic reticulum stress in early AKI attenuates renal fibrosis development. J Am Soc Nephrol. 2017;28:2007–2021.
- Sinha D, Wang Z, Price VR, et al. Chemical anoxia of tubular cells induces activation of c-Src and its translocation to the zonula adherens. Am J Physiol Renal Physiol. 2003;284:F488–497.
- Livingston MJ, Wang J, Zhou J, et al. Clearance of damaged mitochondria via mitophagy is important to the protective effect of ischemic preconditioning in kidneys. Autophagy. 2019;15:2142–2162.
- Wei Q, Sun H, Song S, et al. MicroRNA-668 represses MTP18 to preserve mitochondrial dynamics in ischemic acute kidney injury. J Clin Invest. 2018;128:5448–5464.
- Racusen LC, Solez K, Colvin RB, et al. The Banff 97 working classification of renal allograft pathology. Kidney Int. 1999;55:713–723.