
ABSTRACT
Alopecia areata (AA) involves an aberrant immune attack on the hair follicle (HF), which leads to hair loss. Previous genetic data from our lab pointed to a connection between macroautophagy/autophagy and AA pathogenesis, and GWAS identified STX17, CLEC16A and BCL2L11/BIM as risk factors for AA. Additionally, AA patients have copy number deletions in region spanning the ATG4B gene. To test whether autophagy might contribute to disease pathogenesis in AA, we investigated autophagic activity in C3H/HeJ mouse model. We found that autophagy protein SQSTM1 accumulated in HF of AA mice, while in immune cells from AA skin-draining lymph nodes SQSTM1 was not altered, suggesting that autophagic activity is inhibited in the HF of AA mice. Induction of autophagy with Tat-BECN1 peptide attenuated AA, while treatment with the autophagy blocker chloroquine promoted disease, compared to untreated AA mice. Together, our findings suggest the involvement of impaired autophagy in disease pathogenesis of AA.
Abbreviations: AA: alopecia areata; CQ: chloroquine; GWAS: genome-wide association studies; HF: hair follicle; MHC: major histocompatibility complex; SDLN: skin-draining lymph nodes
Introduction
Cellular homeostasis requires a balance of macromolecules synthesis for growth and removal of damaged proteins for survival. Autophagy is a cellular disposal system which removes unfolded proteins and damaged organelles, and provides nutrition by lysosomal degradation and recycling of breakdown products [Citation1]. The cytoplasmic components are encapsulated in double-membrane vesicles called autophagosomes, which subsequently fuse with lysosomes for recycling of the cargo [Citation2]. Autophagic activity refers to this sequential process of the formation of autophagosomes and subsequent degradation in lysosomes [Citation3,Citation4].
Alopecia areata (AA) is an inflammatory skin disease characterized by T cell-mediated damage in the hair follicle (HF) resulting in hair loss [Citation5]. AA lesions begin as rounded, demarcated, patchy hair loss on the scalp (AA patchy) that may extend to cover the whole scalp (alopecia totalis) or in severe cases, extend to the entire body (alopecia universalis) [Citation6]. Our genome-wide association studies (GWAS) followed by functional studies in the C3H/HeJ mouse model of AA demonstrated the prominent role of CD8+ KLRK1/NKG2D+ cytotoxic T cells as pathogenic effector T cells in both C3H/HeJ grafted AA mice and AA patients [Citation7,Citation8]. Despite the identification of pathogenic CD8+ KLRK1+ T cells, the mechanisms underlying hair loss in AA are not fully elucidated.
Our GWAS studies revealed that variations in genes such as STX17, CLEC16A, and BCL2L11/BIM, which play a role in regulating autophagy, are predisposing genetic loci for AA [Citation7,Citation9]. In addition, we identified multiple AA patients with copy number variations (CNV) in the genomic region spanning ATG4B, which is a cysteine protease involved in post-translational modification of the autophagy protein LC3 [Citation10–14]. It was previously shown that Atg4b-deficient mice have a higher susceptibility to develop intestinal inflammation in experimental mouse model of colitis [Citation15]. Moreover, dysregulation in autophagy has been implicated in numerous autoimmune diseases, such as Crohn disease, celiac disease, multiple sclerosis, systemic lupus erythematosus, and type 1 diabetes, wherein autophagy proteins have pleiotropic roles beyond their classical functions in protein degradation and recycling [Citation16–19]. In fact, impairment in autophagy has been implicated in the loss of immune tolerance in human AA [Citation20].
In addition to recycling cellular components, autophagy is involved in diverse functions such as vesicle trafficking, uptake of extracellular cargo (such as foreign pathogens or neighboring dead cells), antigen processing and presentation that impacts the cellular and tissue homeostasis [Citation21–24]. Whereas autophagy is known to regulate survival either by directly targeting cell death pathways or indirectly by maintaining cell energy needs, autophagy may also promote immunogenic cell death under stress conditions [Citation25]. Considering the known role of autophagy in many autoimmune diseases, together with our genetic studies implicating autophagy in AA, we postulated that autophagy may contribute to disease pathogenesis in AA.
Here, we used the grafted C3H/HeJ mouse model of AA to ask whether autophagy plays a role in AA. We measured autophagic activity in the skin and HF of C3H/HeJ AA mice and found that autophagic activity is inhibited in the HF of AA mice. AA mice treated with autophagy inducing Tat-BECN1 peptide showed attenuated disease, while autophagy blockade with chloroquine moderately accelerated the onset of AA. Our findings define a contribution of impaired autophagic activity in AA pathogenesis.
Results
Autophagic activity was blocked in the skin and hair follicle of AA mice
To investigate if autophagic activity is altered during the development of AA, we used the well-established C3H/HeJ mouse model of AA. In this model, 10-week-old female mice are grafted with alopecic skin from donor mice with chronic AA, and recipient mice develop AA within 6–8 weeks after grafting [Citation26]. We used sham grafted mice as control for these experiments. Skin biopsies were collected from AA grafted mice at 8–9 weeks after engraftment, when mice showed greater than 50% of hair loss over the body ().
Figure 1. Autophagic activity is blocked in the skin and HF of C3H/HeJ AA mice. (A) Mouse images showing the extent of hair loss in grafted C3H/HeJ AA mice at 8 weeks after grafting. Solid black line demarcates the area of skin without hair shafts. (B) Western blot for LC3B and SQSTM1 on protein lysates prepared from sham and AA grafted skin. TUBB was used to normalize total amount of protein loaded per well. Graphs show the quantification of western blot band intensities and data pooled from 3 independent experiments with 4 mice per group. Unpaired two-tailed t-test was used to analyze data. ***p-values <0.005 was significant, ns = not significant. (C) Immunostaining and microscopic imaging of SQSTM1 protein expression in the HF of sham and AA grafted mice. The white dotted line outline the area encompassing the HF and excluding the region of sebaceous glands. The white asterisks mark autofluorescence from the hair shafts that were excluded from the measurement of SQSTM1 staining intensity. Graphs on the right show the quantification of data pooled from 3 independent experiments with SQSTM1 staining intensity measured in n = 35 HF from sham grafted and n = 40 HF from AA grafted mice imaged from 5 mice per group. Unpaired two-tailed t-test was used to analyze data. *p-values <0.05 was considered significant, ns = not significant. (D) Immunostaining and microscopic imaging of LC3B protein expression in the HF of sham and AA grafted mice. The white dotted line outlines the area encompassing the HF and excluding the region of sebaceous glands. The white asterisks mark autofluorescence from the hair shafts that were excluded from the measurement of LC3B staining intensity. Graphs on the right show the quantification of data pooled from 3 independent experiments with LC3B staining intensity measured in n = 20 HF from sham grafted and n = 35 HF from AA grafted mice imaged from 5 mice per group. Unpaired two-tailed t-test was used to analyze data. ns = not significant. (E) Western blot analysisof phosphorylated BECN1 (S91) and total BECN1 on the protein lysates prepared from sham and AA grafted skin. TUBB was used to normalize total amount of protein loaded per well. Graphs show the quantification of western blot band intensities and data pooled from 3 independent experiments with total 11 mice per group. Unpaired two-tailed t-test was used to analyze data. *p-values <0.05 was considered significant, ns = not significant. (F) Western blot analysis of LC3B and SQSTM1 expression in protein lysates isolated from the SDLN of sham and AA grafted mice. Graph shows quantification of band intensities with data pooled from 3 independent experiments with total 12 mice per group. Unpaired two-tailed t-test was used to analyze data. ns = not significant. (G) Western blot analysis of phosphorylated BECN1 (S91) and total BECN1 expression in protein lysates isolated from the SDLN cells of sham and AA grafted mice. Graph shows quantification of band intensities with data pooled from 3 independent experiments with total 12 mice per group. Unpaired two-tailed t-test was used to analyze data. ns = not significant.
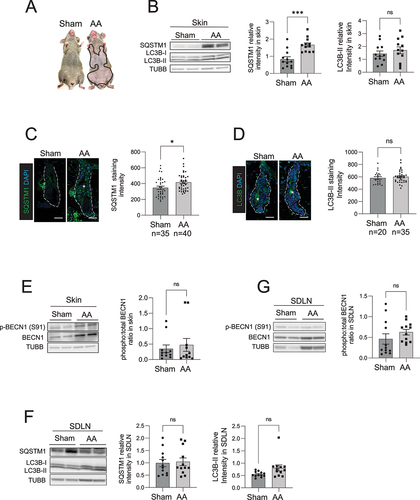
To assess the autophagic activity in the skin of AA mice, we performed western blot and immunohistochemistry analyses on skin biopsies and measured the relative amounts of the autophagy marker proteins MAP1LC3B/LC3B and SQSTM1 [Citation27]. LC3B is post-translationally modified when autophagy is induced and converted from a cytosolic LC3B-I to LC3B-II (LC3 conversion), which binds the inner and outer membrane of autophagic vacuoles [Citation28]. SQSTM1 acts as a chaperone protein that binds damaged proteins and organelles and targets them for sequestration in autophagosomes that are eventually degraded in lysosomes. Normal autophagic activity involves LC3B conversion and SQSTM1 degradation along with proteins enclosed inside autophagosomes [Citation29]. An impairment in autophagic activity is defined by either the formation or degradation of autophagosomes (or both) are suppressed, leading to the accumulation of SQSTM1 protein [Citation27]. Our western blot analysis of skin biopsies showed that SQSTM1 protein accumulated in the skin of AA mice, whereas LC3B-II protein (14 kDa, lower band) in AA skin did not show any significant difference when compared to skin from sham-grafted mice (). The accumulation of SQSTM1 seen in skin biopsies of AA mice indicated that autophagic activity was inhibited in AA-affected skin ().
Next, we analyzed the expression of LC3B and SQSTM1 protein expression specifically in the HF using immunofluorescent staining, and measured fluorescence intensity using ImageJ software by demarcating a region of interest around HF, excluding the sebaceous glands (white dashed line in ). We used DAPI nuclear staining to include fluorescence from HF cells and exclude auto-fluorescent signal from the hair shafts (that do not have nuclei and are DAPI negative) (white asterisks in ). Quantification of microscopy data, combined from at least 35 HFs analyzed across 5 mice per group, revealed that SQSTM1 protein expression was higher in HF of AA mice as compared to sham grafted mice (). We used anti-LC3B (D11) XP Rabbit mAb (Cell Signaling Technology) for LC3B immunostaining which detects endogenous levels of total LC3B protein with stronger reactivity with LC3B-II. Similar to the LC3B western blot analysis, LC3B immunostaining in HF from AA and sham grafted mice did not show any significant differences ().
An increase in SQSTM1 protein levels occur when either the formation or degradation of autophagic vacuoles (or both) are inhibited [Citation27]. To determine if autophagy is induced in skin during onset of AA, we measured the phosphorylation of BECN1 (p-BECN1) at serine 91, a marker that is activated by nutrient sensing AMP-activated protein kinase to induce autophagy [Citation30,Citation31]. We detected no significant differences in the levels of p-BECN1 (Ser91) in the skin of sham and AA mice, suggesting that autophagy was not induced in AA (). Taken together, these results showed accumulation of SQSTM1 in the HF, indicating that the autophagic activity was blocked in AA mice.
Autophagic activity was unchanged in immune cells isolated from skin draining lymph nodes of AA mice
AA involves the autoreactive CD8+ T cell mediated attack on the HF leading to hair loss [Citation7,Citation8]. In vivo studies have shown that autoreactive T cells are exposed to autoantigens and activated in the target tissue-draining lymph nodes [Citation32]. To determine if autophagy is altered in immune cell compartment of the AA mice, we performed western blot analysis of LC3B and SQSTM1 in the skin-draining lymph nodes (SDLN) isolated from AA and sham grafted mice. We found no overall difference in LC3B conversion and SQSTM1 expression in the SDLN from AA and sham grafted mice (), suggesting that autophagy was not changed in the immune cells resident in the SDLN of AA mice. Further, we found that the levels of p-BECN1 (Ser91) remained unchanged in SDLN from AA and WT mice (). These data further supported the notion that the impairment of autophagy was not evident in the immune cell compartment of AA mice, but rather was restricted to the HF.
Autophagy induction delayed the onset of AA
Autophagy sustains cell survival by replenishing nutrients and maintains tissue homeostasis by clearance of dead cell debris [Citation33]. In vivo studies have shown that inhibition of autophagy causes a buildup of dead cellular debris and induction of tissue inflammation [Citation17,Citation34,Citation35]. The data shown in indicated that autophagic activity was inhibited in AA mice, leading to the accumulation of SQSTM1. Thus, we postulated that pharmacological induction of autophagy may restore autophagic activity and reestablish tissue homeostasis in AA skin and reduce the associated inflammation.
To induce autophagy, we treated grafted C3H/HeJ AA mice with a cell permeable Tat-BECN1 peptide that is derived from the autophagy associated beclin1 protein linked to the TAT protein derived from the HIV virus. Tat-BECN1 inhibits GLIPR2, which is a Golgi-associated protein that interacts with BECN1 and negatively regulates autophagy. Treatment with Tat-BECN1 blocks GLIPR2-mediated inhibition of BECN1 and results in the net induction of autophagy [Citation36]. We quantified the area of skin showing hair loss relative to the total body surface area using ImageJ. Strikingly, while AA mice in the control group (treated with Tat-SCRAMBLE peptide) developed hair loss after 5 weeks of treatment, mice that were given Tat-BECN1 were disease free at 5 weeks (). The areas of skin showing hair loss in Tat-BECN1-treated AA mice were significantly smaller and had lower AUC (% area with hair loss over time) values than Tat-SCRAMBLE treated AA mice (). The preventive effect of the Tat-BECN1 peptide was not durable, since mice developed AA 2 weeks after discontinuation of Tat-BECN1 treatment ()
Figure 2. Induction of autophagy with Tat-BECN1 peptide delays onset of AA. (A) Mouse images showing the extent of hair loss in Tat-SCRAMBLE or Tat-BECN1 peptide treated AA mice at 5 weeks after peptide teratment. Solid black lines demarcate the area of skin without hair shafts. (B) Graph showing quantification of % area of skin exhibiting hair loss in Tat-SCRAMBLE or Tat-BECN1 peptide treated AA mice. Data were pooled from 2 independent experiments with at least 2 mice per group. Two-way ANOVA was used to analyze data. *p < 0.05 was considered significant. (C) Mouse images showing extent of hair loss in Tat-SCRAMBLE or Tat-BECN1 peptide treated AA mice at 2 weeks after peptide treatment discontinuation. Solid black lines demarcate the area of skin without hair shafts. (D) Graph shows the area under the curve (AUC) measurement for % area of skin showing hair loss upon Tat-SCRAMBLE or Tat-BECN1 treatment over weeks after grafting. Unpaired two-tailed t-test was used to analyze data. *p-values <0.05 was considered significant. (E) Graphs show the frequency of various T cells and macrophage subsets in the skin and skin-draining lymph nodes (SDLN) of Tat-SCRAMBLE or Tat-BECN1 treated AA mice. 5 mice were used per treatment group. Two-way ANOVA statistical test was performed and p < 0.05 were considered statistically significant. Differences between groups were not significant (ns).
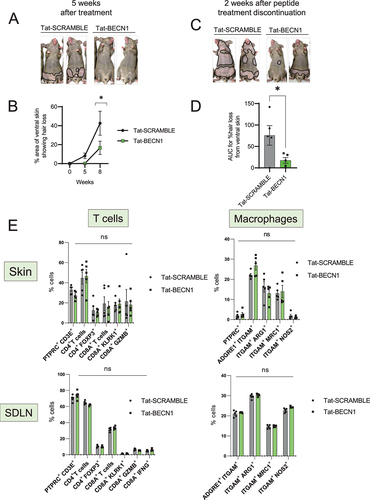
In vivo studies with grafted C3H/HeJ mice during disease induction phase revealed that skin inflammation is first induced near the graft and progressively spreads to skin distal to the graft. Perifollicular immune infiltrate is composed of CD4+ and CD8+ cells with only CD8+ penetrating the HF [Citation37]. Further, lymphocyte and macrophages infiltration is associated with dystrophy within differentiating outer and inner root sheaths [Citation37]. To assess the effect of Tat-BECN1 treatment on the immune cell compartment of AA mice, we analyzed the single cell suspensions isolated from skin and SDLN of Tat-SCRAMBLE or Tat-BECN1 treated AA mice (Figure S1). We found no statistical differences in the proportion of total CD4+ or CD8A+ T cells, CD4+ FOXP3+ Tregs, or KLRK1-, GZMB- or IFNG-expressing CD8A+ T cell subsets in either the skin or in SDLN (). Further, we found no change in the frequency of M2-polarized ARG1 (arginase, liver)-, MRC1 (mannose receptor, C type 1)-expressing macrophages or M1-polarized NOS2-expressing macrophages in either the skin or in SDLN (). These data suggests that Tat-BECN1 affects AA development independent of its influence on the activity of T cells and macrophages subsets in the skin and SDLN.
Autophagy inhibition accelerated disease onset in AA mice
Next, we tested whether blocking autophagy using chloroquine could affect the development of disease in grafted AA mice. Chloroquine (CQ) is a lysosomotropic agent that prevents endosomal acidification and inhibits both fusion of autophagosomes with lysosomes and lysosomal degradation [Citation38]. To evaluate the effect of CQ on AA development, we treated grafted AA mice for 8 weeks, and monitored the mice for the development of hair loss. Mice that received CQ showed accelerated onset of disease, with small patches of hair loss appearing on the abdominal skin as early as 3 weeks after grafting, when most of the control AA mice treated with PBS showed no disease at this time point (). The disease progressed faster upon CQ treatment and AA mice given CQ showed significantly larger areas of skin showing hair loss at 5 weeks after grafting (). The area under the curve of % hair loss with time showed higher values in CQ treated AA mice group as compared to PBS treated control group () suggesting that the disease was exacerbated with CQ treatment.
Figure 3. Autophagy blocker chloroquine accelerates disease onset in AA mice. (A) Graph shows the quantification of the % area of skin showing hair loss in CQ, or PBS treated AA mice. CQ treated mice had a significantly larger area of skin showing hair loss at 5 weeks after grafting. Data were pooled from 3 independent experiments with 3 mice per group. Two-way ANOVA was used to analyze data. *p < 0.05 was considered significant. (B) Images show the extent of disease in grafted AA mice upon treatment with CQ or PBS vehicle. Solid black line demarcates the area of skin without hair shafts. (C) Graph shows AUC measurement for % area of skin showing hair loss upon CQ or PBS treatment over weeks after grafting. Unpaired two-tailed t-test was used to analyze data. *p-values <0.05 was considered significant. (D) Graphs show the frequency of various T cells and macrophage subsets in the skin and skin-draining lymph nodes (SDLN) of PBS or CQ treated AA mice. 5 mice were used per treatment group. Two-way ANOVA statistical test was performed and p < 0.05 were considered statistically significant. Differences between groups were not-significant (ns).
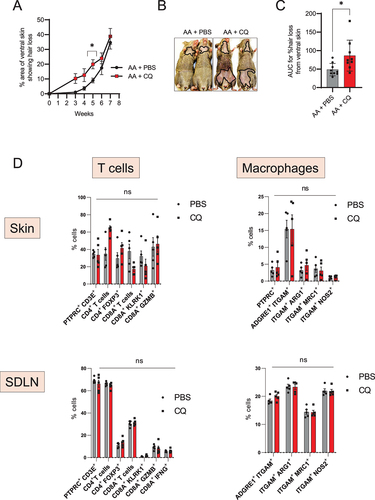
To assess the effect of CQ treatment on the immune cell compartment of AA mice, we analyzed the single cell suspensions isolated from skin and SDLN of PBS or CQ treated AA mice (Figure S1). We found no statistical differences in the proportion of total CD4+ or CD8A+ T cells, CD4+ FOXP3+ Tregs, or KLRK1-, GZMB- or IFNG-expressing CD8A+ T cell subsets in either the skin or in SDLN (). We found no change in the frequency of M2-polarized ARG1 (arginase, liver)-, MRC1 (mannose receptor, C type 1)-expressing macrophages or M1-polarized NOS2-expressing macrophages in either the skin or in SDLN (). These data suggests that the effect of CQ on the onset of AA pathogenesis is independent of its influence on the activity of T cells and macrophages subsets in the skin and SDLN.
AA is a complex disease involving multiple genetic factors acting in combination with the environmental modulators. Cytotoxic CD8+ KLRK1+ T cells represent the primary pathogenic immune cells involved in causing damage to HF in AA [Citation8]. To pinpoint the effect of autophagy modulators on T cell cytotoxic action, we performed in vitro T cell killing assay in which we used dermal sheath (DS) cells isolated from the whisker pads of C3H/HeJ mice as target cells and cultured them with T cells either in the presence or absence of Tat-BECN1 or CQ. We detected the expression of RAET1A, RAET1B, RAET1C, RAET1D, and RAET1E (using pan-specific antibody) that are NKG2D ligands expressed on the surface of DS cells after 3 weeks of in vitro culture (Figure S2A). In vitro stimulated T cells upregulated KLRK1 on the surface at 72 h after activation (Figure S2B). We found a progressive increase in the frequency of ANXA5/annexin V+ dead target (DS) cells with increasing T cell numbers/well (Figure S2C). However, there was no change in T cell cytotoxicity upon treatment with either Tat-BECN1 or CQ (Figure S2C). These data suggest that the effect of autophagy modulation with Tat-BECN1 or CQ is independent of T cell cytotoxicity.
Discussion
Our findings revealed that an impairment in autophagy may contribute to disease pathogenesis in AA. The expression of the autophagy associated protein SQSTM1 was increased in the HF of AA mice, suggesting that autophagic activity was inhibited in the HF during disease onset. In contrast, autophagy was not perturbed in immune cells isolated from the skin-draining lymph nodes of AA mice. Treatment of AA mice with the autophagy inducing Tat-BECN1 peptide delayed the development of hair loss, while the pharmacological inhibition of autophagy using CQ moderately accelerated the disease onset. Taken together, our data revealed a role for perturbed autophagy in disease pathogenesis of AA.
Autophagy and proteasomal degradation are the two major pathways of degradation of the cellular constituents. While proteasomes target and breakdown the soluble protein molecules, autophagy is capable of processing larger organelles along with protein aggregates and damaged proteins for destruction and recycling in lysosomes [Citation39]. As one of the basic cellular disposal systems, dysregulation of autophagy is associated with a variety of diseases spanning different tissue types such as neurodegeneration, cardiovascular diseases, eye diseases, liver diseases, metabolic diseases, and cancer [Citation3,Citation4]. In the context of skin, dysregulation of autophagy in melanocytes is linked with autoimmunity in vitiligo [Citation40]. Thus, autophagy is implicated in a wide range of diseases and approaches that restore autophagy may normalize tissue function and are being explored to develop new therapeutics. A major challenge is how to selectively target autophagy in vivo in the cells primarily affected in a particular disease [Citation41].
Autophagy was originally discovered as a cell-stress response to survive low-nutrient conditions by recycling intracellular components [Citation42]. However, accumulating evidence shows that autophagy has diverse functions that extend beyond lysosomal degradation of intracellular self proteins. Autophagy is implicated in the phagocytosis and immune-silent clearance of extracellular dead cells in LC3B-II coated vesicles that are targeted for lysosomal degradation [Citation17]. In vivo studies showed that systemic lupus erythematosus-like autoimmune disease is triggered when autophagic clearance of dead cells is inhibited [Citation33]. Similarly, autophagy-mediated dead cell clearance is also important for tissue regeneration, as seen in the mammary gland epithelial cells that use autophagy proteins to engulf dead cells during post-lactational regression, and genetic ablation of this process induces tissue inflammation [Citation34]. In view of the role of autophagy mediated clearance of dead cells and considering that dead cell debris is generated in HF during the periodic rounds of regeneration during hair cycle [Citation43], we speculate that autophagy is perhaps involved in clearing tissue debris generated during hair cycle. Perturbation of autophagy in AA may impair the clearance of dead cell debris that leads to the skin tissue inflammation. Our data demonstrating CQ treatment promotes disease onset corroborates that normal autophagic activity maintains immune balance and that inhibiting autophagy facilitates disease causing mechanisms (). On the other hand, inducing autophagy with Tat-BECN1 peptide dampens disease development indicating that autophagic activity is important to maintain tissue homeostasis ().
In addition to the uptake of the dead cell debris, autophagy plays a critical role in antigen processing/presentation and regulates the expression of both major histocompatibility complex (MHC) Class I and II molecules [Citation44–47]. The HF in healthy skin is an immune privileged site where immune inhibitory mechanisms are in place that keep MHC expression low and shield the HF from recognition by the immune system [Citation5]. However, in AA, the expression of MHC proteins is highly upregulated in the HF [Citation48]. Consistent with our data demonstrating autophagy blockade in grafted AA mice (), Hardman et al similarly showed that autophagic activity is blocked in lesional HF from AA patients. Pharmacological induction of autophagy with (methyl-) spermidine in hair follicle organ culture partially restored immune balance in the hair follicle by reducing MHC class I expression [Citation20]. Taken together with our data that autophagy induction with Tat-BECN1 peptide delayed AA onset (), these data raise the possibility that impairment of autophagy might contribute to loss of HF immune privilege, and that restoration of autophagy may restore immune balance in the skin.
Autophagy has a direct role in regulating hair regeneration, and activation of autophagy promotes hair growth in quiescent telogen HF [Citation49], while inhibition of autophagy induces death in matrix cells found inside hair bulb promoting catagen development [Citation50]. In addition, autophagy contributes to immunogenic cell death in tumors that promote anti-tumor immune response through the recruitment of immune cells [Citation51]. Together with our data, a potential model of AA suggests the inhibition of autophagy in HF of AA mice may trigger immunogenic cell death in the HF, combined with inefficient autophagic clearance of cell debris. These events may initiate an inflammatory signaling cascade and infiltration of immune cells into the skin that lead to the collapse of immune privilege and subsequent damage to the HF in AA [Citation33,Citation35]. Such a mechanism invites investigation of a new avenue of treatment for AA aimed at restoring autophagic activity in the HF.
Materials and methods
Mice
8- to 9-weeks-old C3H/HeJ female mice were purchased from the Jackson Laboratory (Strain ID 000659) and maintained under specific pathogen-free conditions in the animal facility at the Columbia University Irving Medical Center. All experiments were performed in compliance with institutional guidelines as approved by the Institutional Animal Care and Use Committee of Columbia University Irving Medical Center.
Antibodies, cell culture media, and reagents
Flow cytometric analysis of immune cell infiltrate in skin and SDLN was performed by staining with the following fluorochrome-conjugated monoclonal antibodies against ARG1 (Clone A1exF5; ThermoFisher Scientific, 25–3697-82), CD3E (Clone17A2; BioLegend, 877–246-5343), CD4 (Clone GK1.5; BD Biosciences, 564,298), CD8A (Clone 53–6.7; BioLegend, 100,744), ITGAM/CD11B (Clone M1/70; BioLegend, 101,222), ITGAX/CD11C (Clone N418; BioLegend, 117,339), PTPRC/CD45 (Clone 30-F11; BioLegend, 103,138), ADGRE1/F4/80 (Clone BM8; BioLegend, 123,128), FOXP3 (Clone FJK-16s; ThermoFisher Scientific, 11–5773-82), GZMB (Clone GB11; BioLegend, 515,408), NOS2 (Clone CXNFT; ThermoFisher Scientific, 61–5920-82), IFNG (Clone XMG1.2; ThermoFisher Scientific, 12–7311-82), MRC1/mannose receptor (Clone MR6F3; ThermoFisher Scientific, 17–2061-82), KLRK1/NKG2D (Clone CX5; BioLegend, 115,606), Zombie NIR (BioLegend, 423,106), and Pe Annexin-V apoptosis detection kit (BioLegend, 640,934). Mouse RAET1 pan-specific antibody (MAB17582-100) was purchased from R & D systems.
For immunofluorescence staining of mouse skin sections, we used primary antibodies against MAP1LC3B (Cell Signaling Technology, 3868; D11 rabbit monoclonal) and SQSTM1 (abcam, ab91526). Secondary antibodies used was donkey anti-rabbit IgG Alexa Fluor 488 (Invitrogen, A-21206) purchased from ThermoFisher Scientific.
For western blotting experiments, we used primary antibodies to detect (Novus Biologicals, NB100-2220), SQSTM1 (PROGEN Biotechnik, GP62-C), BECN1 (Cell Signaling Technology, 3738), phospho-BECN1-Ser91 (Cell Signaling Technology, 14,717) and TUBB/tubulin-HRP (Abcam, ab21058). Secondary antibodies used were anti-rabbit IgG-HRP (Fisher Scientific, NA934), anti Guinea pig IgG-HRP (EMD Millipore, AP193P).
Cell culture media reagents used were DMEM (high glucose; ThermoFisher Scientific, 12,430,062) and RPMI-1640 (ThermoFisher Scientific, 11,875,119), fetal bovine serum (Cytiva, SH30088.03).
Chloroquine (C6628) was purchased from Sigma Aldrich. Autophagy-inducing Tat-BECN1 (YGRKKRRQRRR-GG-VWNATFHIWHD) and control Tat-SCRAMBLE (YGRKKRRQRRR-GG-VSNATFHIWHD) peptides (>95% pure) were custom synthesized by ThermoFisher Scientific.
Experimental mouse model of alopecia areata
Experimental AA was induced in C3H/HeJ by skin grafting performed as described previously [Citation26]. In brief, female donor mice with chronic AA were euthanized, and full-thickness skin grafts of ∼2 cm in diameter from donor mice were grafted onto the back of 10-wk-old normal-haired female recipient C3H/HeJ mice. Hair loss typically began at around 4–6 weeks after grafting. Mice that were sham grafted were used as controls. ImageJ software was used to quantify % area of skin exhibiting hair loss. Briefly, area of skin without hair shafts is measured and normalized to total body area. Area under the curve (AUC) was measured for line curves obtained by measuring % area showing hair loss over time after grafting.
Mice treatment with autophagy modulators
For the evaluation of modulating effect of autophagy on disease onset, grafted AA mice were treated with drugs or vehicle starting on the day of grafting. CQ (50 mg/kg), or either Tat-BECN1 or Tat-SCRAMBLE peptide (15 mg/kg) were dissolved in sterile PBS (Thermofisher, 14,190–250) and injected intraperitoneally 3 times per week for maximum of 8 weeks.
Skin embedding, sectioning and immunofluorescence staining for microscopy
Skin was biopsied from AA or sham grafted mice and cryopreserved in TissueTek OCT solution (Sakura, 4583) on dry ice and skin blocks were kept frozen in −80°C freezer until sectioning. 5 µm thick skin sections were obtained on glass slides and frozen tissue was fixed with 4% PFA for 10 min at room temperature followed by washing with PBS three times. Fixed tissue was then blocked and permeabilized with antibody dilution buffer (PBS containing 0.01% Triton X-100 [Sigma, 9002–93-1] and 5% normal donkey serum [Jackson ImmunoResearch Laboratories Inc., 017–000-121) for 1 h at room temperature. After incubation, excess buffer was removed, and skin was incubated with primary antibodies overnight at 4°C. The next day, slides were washed three times with PBS to remove unbound primary antibody and incubated with secondary antibodies for 30 min at room temperature. After washing, slides were mounted in Fluoroshield with DAPI (Sigma-Aldrich, F6057). Images were acquired using Nikon Ti Eclipse inverted microscope equipped with A1 scanning confocal unit and microscopy data was analyzed using ImageJ.
Flow cytometry
To prepare single cell suspensions, skin was harvested, rinsed in 2X antibiotics containing PBS and minced with a pair of scissors in DMEM containing 1 mg/ml collagenase type II (Sigma-Aldrich, C2139) and incubated for 90 min at 37°C with constant shaking at 70 rpm. The digested skin was then passed through a 70-µm cell strainer (BD Biosciences, 352,350) and washed thoroughly with ice-cold PBS before FACS staining. SDLN were minced on a 70-µm cell strainer using a 5-ml syringe plunger and washed with PBS. RBCs were lysed using ammonium chloride lysis buffer before FACS staining.
To block nonspecific binding, single cell suspensions were first incubated with TruStain FcX (BioLegend, 101,320) in FACS buffer (PBS containing 2% FBS+0.01% NaN3) for 20 min on ice. For surface markers staining and live/dead cell discrimination, cells were incubated with various combination of fluorochrome-conjugated antibodies and Zombie NIR fixable viability dye (BioLegend, 423,106) in FACS buffer for 30 min on ice after which cells were washed twice with PBS and fixed with 2% PFA before acquisition.
For intracellular cytokine staining, SDLN were minced and 2 × 10⁶ cells were cultured in RPMI 1640 media + 10% FBS in the presence of cell stimulation cocktail (eBioscience, 00–4970-93) for 4 h and protein transport inhibitor cocktail (eBioscience, 00–4980-93) was added 1 h after starting the cell culture. After 4 h incubation, cells were stained for surface markers and live/dead labeling, fixed, and then processed for intracellular IFNG staining. FACS samples were acquired on BD LSRII and data analysis was done using FlowJo software.
Western blotting
Skin biopsies or SDLN were obtained from mice and snap frozen in liquid nitrogen. Frozen tissue was homogenized in RIPA buffer (Sigma-Aldrich, R0278) containing protease inhibitor (Sigma-Aldrich, P8340) and phosphatase inhibitor (Sigma-Aldrich, P2850) cocktail on ice for 5 min in 2 ml U-bottom microcentrifuge tubes. Tissue homogenate was centrifuged at 9391 X g for 10 min at 4°C to remove tissue and cell debris. Concentration of the extracted protein was determined using PierceTM Coomassie (Bradford) Protein assay kit (ThermoFisher Scientific, 1,856,209). 10–15 µg of the skin lysates were mixed with SDS loading buffer containing 5% β-mercaptoethanol and boiled for 5 min. Samples were resolved on Novex 4–20% Tris-Glycine mini gels (ThermoFisher Scientific, XP04200BOX) in Invitrogen Novex Tris-Glycine SDS running buffer (ThermoFisher, LC2675) and transferred to PVDF membranes for western blotting. All antibodies used for western blotting are described in the antibodies and reagents section.
T cell cytotoxicity assay
Dermal sheath cells were isolated from the whisker pads of C3H/HeJ mice and cultured for 3 weeks to generate target cells [Citation8]. Effector T cells were generated by in vitro activation of T cells isolated from the skin-draining lymph nodes using anti-CD3- and anti-CD28-coated dynabeads (ThermoFisher Scientific, 11452D). After 3 days of stimulation, T cells were overlaid on the monolayer of target cells and incubated for 4 h. Target/T cells mix was harvested by trypsinization and stained with an ANXA5 apoptosis detection kit to determine the proportion of dead cells and PTPRC/CD45 antibody to exclude T cells for FACS analysis.
Statistical analysis
GraphPad prism was used to analyze data comparing two or more groups with two-tailed unpaired Student’s t-test or two-way ANOVA respectively. All data are presented as mean ± SEM. *p-values <0.05; ***p-values <0.005.
Supplemental Material
Download Zip (497.6 KB)Acknowledgments
We thank Emily Chang, Jade Huang, Ming Zhang, and Wangyong Zeng for expert assistance in the laboratory. We thank Lynn Petukhova and Stephanie Erjavec for stimulating discussions of AA susceptibility genetics and Rolando Perez-Lorenzo, Tatiana Sezin, and Eunice Lee for critcally reading the manuscript. Confocal images were collected in the Confocal and Specialized Microscopy Shared Resource of the Herbert Irving Comprehensive Cancer Center at Columbia University, supported by NIH grant #P30 CA013696 (National Cancer Institute). Flow-cytometry was performed in the CCTI Flow Cytometry Core, supported in part by the Office of the Director, National Institutes of Health under awards S10RR027050. This research was supported in part by Mentored Investigator Award from National Alopecia Areata Foundation to R.G. and NIH/NIAMS P50AR070588 Alopecia Areata Center for Research Translation (AACORT; P50AR070588 to A.M.C.).
Disclosure statement
The authors declare that they have no potential, perceived or real conflict of interest regarding the content of this manuscript.
Supplementary material
Supplemental data for this article can be accessed online at https://doi.org/10.1080/15548627.2022.2074104
Additional information
Funding
References
- Yoshii SR, Mizushima N. Monitoring and measuring autophagy. Int J Mol Sci. 2017 SEP;18(9):1865.
- Mizushima N, White E, Rubinsztein DC. Breakthroughs and bottlenecks in autophagy research.Trends Mol Med. 2021 [2021 July 11];27(9):835–838.
- Levine B, Kroemer G. Biological functions of autophagy genes: a disease perspective. Cell. 2019 Jan 10; 176(1–2):11–42.
- Mizushima N, Levine B, Longo DL. Autophagy in Human Diseases. N Engl J Med. 2020 Oct 15; 383(16):1564–1576.
- Gilhar A, Etzioni A, Paus RAA. Alopecia Areata. N Engl J Med. 2012;366(16):1515–1525.
- Pratt CH, King LE Jr., Messenger AG, et al. Alopecia areata. Nat Rev Dis Primers. 2017 Mar 16;3:17011.
- Petukhova L, Duvic M, Hordinsky M, et al. Genome-wide association study in alopecia areata implicates both innate and adaptive immunity. Nature. 2010 [2010 July 01];466(7302):113–117.
- Xing L, Dai Z, Jabbari A, et al. Alopecia areata is driven by cytotoxic T lymphocytes and is reversed by JAK inhibition. Nat Med. 2014 Sep;20(9):1043–1049.
- Betz RC, Petukhova L, Ripke S, et al. Genome-wide meta-analysis in alopecia areata resolves HLA associations and reveals two new susceptibility loci. Nat Commun. 2015 Jan 22;6:5966.
- Fujita N, Hayashi-Nishino M, Fukumoto H, et al. An Atg4B mutant hampers the lipidation of LC3 paralogues and causes defects in autophagosome closure. Mol Biol Cell. 2008 Nov;19(11):4651–4659.
- Kauffman KJ, Yu S, Jin J, et al. Delipidation of mammalian Atg8-family proteins by each of the four ATG4 proteases. Autophagy. 2018;14(6):992–1010.
- Petukhova L, Patel AV, Rigo RK, et al. Integrative analysis of rare copy number variants and gene expression data in alopecia areata implicates an aetiological role for autophagy. Exp Dermatol. 2020 Mar;29(3):243–253.
- Satoo K, Noda NN, Kumeta H, et al. The structure of Atg4B-LC3 complex reveals the mechanism of LC3 processing and delipidation during autophagy. EMBO J. 2009 May 6 28(9):1341–1350.
- Yang Z, Wilkie-Grantham RP, Yanagi T, et al. ATG4B (Autophagin-1) phosphorylation modulates autophagy. J Biol Chem. 2015 Oct 30 290(44):26549–26561.
- Cabrera S, Fernandez AF, Marino G, et al. ATG4B/autophagin-1 regulates intestinal homeostasis and protects mice from experimental colitis. Autophagy. 2013 Aug;9(8):1188–1200.
- Bhattacharya A, Parillon X, Zeng S, et al. Deficiency of autophagy in dendritic cells protects against experimental autoimmune encephalomyelitis. J Biol Chem. 2014 Sep 19 289(38):26525–26532.
- Heckmann BL, Boada-Romero E, Cunha LD, et al. LC3-Associated Phagocytosis and Inflammation. J Mol Biol. 2017 Nov 24 429(23):3561–3576.
- Keller CW, Lunemann JD. Noncanonical autophagy in dendritic cells triggers CNS autoimmunity. Autophagy. 2018 Feb;17:1–2.
- Yang Z, Goronzy JJ, Weyand CM. Autophagy in autoimmune disease. (Berlin, Germany). J Mol Med. 2015 Jul;93(7):707–717.
- Hardman JA, Nicu C, Tai C, et al. Does dysfunctional autophagy contribute to immune privilege collapse and alopecia areata pathogenesis? J Dermatol Sci. 2020 Oct;100(1):75–78.
- Brooks CR, Yeung MY, Brooks YS, et al. KIM-1-/TIM-1-mediated phagocytosis links ATG5-/ULK1-dependent clearance of apoptotic cells to antigen presentation. EMBO J. 2015 Oct 1 34(19):2441–2464.
- Dooley HC, Razi M, Polson HE, et al. WIPI2 links LC3 conjugation with PI3P, autophagosome formation, and pathogen clearance by recruiting Atg12-5-16L1. Mol Cell. 2014 Jul 17 55(2):238–252.
- Henault J, Martinez J, Riggs JM, et al. Noncanonical autophagy is required for type I interferon secretion in response to DNA-immune complexes. Immunity. 2012 Dec 14 37(6):986–997.
- Lai SC, Devenish RJ. LC3-associated phagocytosis (LAP): connections with host autophagy. Cells. 2012 Jul 30; 1(3):396–408.
- Ploumi C, Papandreou ME, Tavernarakis N. The complex interplay between autophagy and cell death pathways. Biochem J. 2022 Jan 14; 479(1):75–90.
- McElwee KJ, Boggess D, Sundberg JP, et al. Experimental Induction of alopecia areata-like hair loss in C3H/HeJ mice using full-thickness skin grafts. J Invest Dermatol. 1998 [1998 November 01];111(5):797–803.
- Mizushima N, Yoshimori T, Levine B. Methods in mammalian autophagy research. Cell. 2010 Feb 5; 140(3):313–326.
- Kabeya Y, Mizushima N, Ueno T, et al. LC3, a mammalian homologue of yeast Apg8p, is localized in autophagosome membranes after processing. EMBO J. 2000;19(21):5720–5728.
- Klionsky DJ, Abdelmohsen K, Abe A, et al. Guidelines for the use and interpretation of assays for monitoring autophagy (3rd edition). Autophagy. 2016;12(1):1–222.
- Galluzzi L, Pietrocola F, Levine B, et al. Metabolic Control of Autophagy. Cell. 2014 [2014 December 04];159(6):1263–1276.
- Kim J, Kim Young C, Fang C, et al. Differential regulation of distinct Vps34 Complexes by AMPK in nutrient stress and autophagy. Cell. 2013 [2013 January 17];152(1):290–303.
- Gagnerault M-C, Luan JJ, Lotton C, et al. Pancreatic lymph nodes are required for priming of β Cell Reactive T Cells in NOD Mice. J Exp Med. 2002;196(3):369–377.
- Martinez J, Almendinger J, Oberst A, et al. Microtubule-associated protein 1 light chain 3 alpha (LC3)-associated phagocytosis is required for the efficient clearance of dead cells. Proceedings of the National Academy of Sciences of the United States of America. 2011 Oct 18;108( 42):17396–17401.
- Teplova I, Lozy F, Price S, et al. ATG proteins mediate efferocytosis and suppress inflammation in mammary involution. Autophagy. 2013 Apr;9(4):459–475.
- Martinez J, Cunha LD, Park S, et al. Noncanonical autophagy inhibits the autoinflammatory, lupus-like response to dying cells. Nature. 2016 May 5 533(7601):115–119.
- Shoji-Kawata S, Sumpter R, Leveno M, et al. Identification of a candidate therapeutic autophagy-inducing peptide. Nature. 2013 Feb 14 494(7436):201–206.
- McElwee KJ, Silva K, Boggess D, et al. Alopecia areata in C3H/HeJ mice involves leukocyte-mediated root sheath disruption in advance of overt hair loss. Vet Pathol. 2003 Nov;40(6):643–650.
- Mauthe M, Orhon I, Rocchi C, et al. Chloroquine inhibits autophagic flux by decreasing autophagosome-lysosome fusion. Autophagy. 2018;14(8):1435–1455.
- Lu K, den Brave F, Jentsch S. Pathway choice between proteasomal and autophagic degradation. Autophagy. 2017;13(10):1799–1800.
- He Y, Li S, Zhang W, et al. Dysregulated autophagy increased melanocyte sensitivity to H2O2-induced oxidative stress in vitiligo. Sci Rep. 2017 Feb 10;7:42394.
- Galluzzi L, Bravo-San Pedro JM, Levine B, et al. Pharmacological modulation of autophagy: therapeutic potential and persisting obstacles. Nature Reviews. Drug Discovery. 2017 [2017 July 01];16(7):487–511.
- Takeshige K, Baba M, Tsuboi S, et al. Autophagy in yeast demonstrated with proteinase-deficient mutants and conditions for its induction. J Cell Biol. 1992 Oct;119(2):301–311.
- Müller-Röver S, Foitzik K, Paus R, et al. A Comprehensive guide for the accurate classification of murine hair follicles in distinct hair cycle stages. J Invest Dermatol. 2001;117(1):3–15.
- Loi M, Muller A, Steinbach K, et al. Macroautophagy proteins control MHC class i levels on dendritic cells and shape anti-viral CD8(+) T cell responses. Cell Rep. 2016 May 3 15(5):1076–1087.
- Münz C. The macroautophagy machinery in MHC restricted antigen presentation. Front Immunol. 2021;12:628429.
- Oh DS, Lee HK. Autophagy protein ATG5 regulates CD36 expression and anti-tumor MHC class II antigen presentation in dendritic cells. Autophagy. 2019 Dec;15(12):2091–2106.
- Yamamoto K, Venida A, Yano J, et al. Autophagy promotes immune evasion of pancreatic cancer by degrading MHC-I. Nature. 2020 May;581(7806):100–105.
- Bertolini M, McElwee K, Gilhar A, et al. Hair follicle immune privilege and its collapse in alopecia areata. Exp Dermatol. 2020 Aug;29(8):703–725.
- Chai M, Jiang M, Vergnes L, et al. Stimulation of hair growth by small molecules that activate autophagy. Cell Rep. 2019 Jun 18 27(12):3413–3421.e3.
- Parodi C, Hardman JA, Allavena G, et al. Autophagy is essential for maintaining the growth of a human (mini-)organ: evidence from scalp hair follicle organ culture. PLoS Biol. 2018 Mar;16(3):e2002864.
- Michaud M, Martins I, Sukkurwala AQ, et al. Autophagy-dependent anticancer immune responses induced by chemotherapeutic agents in mice. Science. 2011;334(6062):1573.