
ABSTRACT
Macroautophagy/autophagy is an evolutionarily conserved cellular stress response mechanism. Autophagy induction in the tumor microenvironment (stroma) has been shown to support tumor metabolism. However, cancer cell-derived secreted factors that initiate communication with surrounding cells and stimulate autophagy in the tumor microenvironment are not fully documented. We identified CTF1/CT-1 (cardiotrophin 1) as an activator of autophagy in fibroblasts and breast cancer-derived carcinoma-associated fibroblasts (CAFs). We showed that CTF1 stimulated phosphorylation and nuclear translocation of STAT3, initiating transcriptional activation of key autophagy proteins. Additionally, following CTF1 treatment, AMPK and ULK1 activation was observed. We provided evidence that autophagy was important for CTF1-dependent ACTA2/α-SMA accumulation, stress fiber formation and fibroblast activation. Moreover, promotion of breast cancer cell migration and invasion by activated fibroblasts depended on CTF1 and autophagy. Analysis of the expression levels of CTF1 in patient-derived breast cancer samples led us to establish a correlation between CTF1 expression and autophagy in the tumor stroma. In line with our in vitro data on cancer migration and invasion, higher levels of CTF1 expression in breast tumors was significantly associated with lymph node metastasis in patients. Therefore, CTF1 is an important mediator of tumor-stroma interactions, fibroblast activation and cancer metastasis, and autophagy plays a key role in all these cancer-related events.
Abbreviations: ACTA2/α-SMA: actin, alpha 2, smooth muscle CAFs: cancer- or carcinoma-associated fibroblasts CNT Ab.: control antibody CNTF: ciliary neurotrophic factor CTF1: cardiotrophin 1 CTF1 Neut. Ab.: CTF1-specific neutralizing antibody GFP-LC3 MEF: GFP-fused to MAP1LC3 protein transgenic MEF LIF: leukemia inhibitory factor IL6: interleukin 6 MEFs: mouse embryonic fibroblasts MEF-WT: wild-type MEFs OSM: oncostatin M TGFB/TGFβ: transforming growth factor beta
Introduction
Cells of the tumor microenvironment or stroma contribute to cancer cell seeding, proliferation, treatment resistance and metastasis. The stroma consists of diverse cellular components, such as fibroblasts, immune cells, mesenchymal stem cells and vascular cells [Citation1,Citation2]. Fibroblasts in the tumor stroma share similarities with tissue damage-activated normal fibroblasts or myofibroblasts. Indeed, tumors historically compared to non-healing wounds, and many cancer types develop on a chronic inflammation background [Citation3]. Tumor stroma fibroblasts are also known as cancer- or carcinoma-associated fibroblasts (CAFs). Interaction between tumor cells and stroma components leads to the modification and transdifferentiation of some of these naïve tissue fibroblasts into CAFs [Citation4]. Adoption of a secretory phenotype and a smooth muscle-like contractile state by CAFs is a result of the expression of proteins, including ACTA2/α-SMA (actin, alpha 2, smooth muscle) and VIM (vimentin).
Communication between cancer cells and stroma components is highly dynamic and rely on direct and indirect interactions. Cytokines, including TGFB/TGFβ (transforming growth factor beta) and IL6 (Interleukin 6) play a key role in this context [Citation5–7]. The list of mediators of cancer-stroma interactions is far from complete. As a result of a screen that aimed to identify novel autophagy activators, we identified several cytokines stimulating autophagy in otherwise non-stressed cells. In fact, autophagy is an evolutionarily conserved stress-response mechanism that plays a role in cancer formation and progression [Citation8,Citation9].
We identified CTF1/CT-1 (cardiotrophin 1), as a strong activator of autophagy in fibroblasts. CTF1 is a member of IL6 family which includes IL6, IL11, LIF (leukemia inhibitory factor), CNTF (ciliary neurotrophic factor) and OSM (oncostatin M) [Citation10]. Yet, these cytokines shown to bind overlapping but divergent receptor combinations.
In line with this, CTF1 binds IL6ST/gp130 and LIFR as well as a less characterized CTF1-specific receptor component [Citation11,Citation12]. Similarly, in addition to IL6ST/gp130, IL6 preferentially binds to a specific IL6 receptor [Citation13]. Similarly, cytokine-specific receptors were described for other family members, pointing to the functional diversity of these factors.
CTF1 mainly studied in the heart, where it is shown to have cardioprotective effects [Citation14]. However, it is also expressed in other tissues and organs, including liver, kidney, lung, and skeletal muscle [Citation10]. Several studies in the literature involved CTF1 in a number of biological phenomena, including cell survival, proliferation, and tissue regeneration [Citation15]. However, the role of CTF1 in malignant transformation is not clear.
In the present study, we describe for the first time that cancer-derived CTF1 is a potent regulator of fibroblast autophagy and CAF transdifferentiation. We provide evidence that CTF1 is an important mediator of stroma-assisted and autophagy-dependent cancer cell migration and invasion. Moreover, CTF1 expression in patient-derived breast tumor samples significantly correlated with stromal autophagy and lymph node metastasis. Hence, CTF1 is a novel activator of autophagy, an important component of tumor-stroma interactions and a contributing factor to cancer metastasis.
Results
Secreted factors mediate cancer cell-induced fibroblast autophagy
In order to determine whether soluble factors secreted by tumor cells activated autophagy in fibroblast cells, one of the key stroma components, we incubated autophagy reporter GFP-LC3 transgenic mice fibroblasts (GFP-LC3 MEFs) with culture media that were conditioned by various tumor-derived cell lines. Autophagy activation induces GFP-LC3 lipidation and recruitment to autophagic membranes, resulting in cytoplasmic puncta formation. MCF7, MDA-MB-231 and T47D breast cancer cells, Huh7 hepatocellular carcinoma cells and PC3 prostate cancer cells were cultured in low FBS-containing (3%) media for 72 h, conditioned media from cultures were concentrated and added onto GFP-LC3 MEFs. Conditioned media from GFP-LC3 MEFs were used as control. Media-derived from all five cancer cell lines significantly activated autophagy in GFP-LC3 MEF cells, whereas control media had no prominent effect (). To further validate these results, we co-cultured GFP-LC3 MEFs with MCF7 or T47D breast cancer cells that were stably expressing the red fluorescent protein RFP. Under these co-culture conditions, MEFs that were in close proximity of cancer cells significantly activated autophagy (), colored version Figure. S1). Similar to MCF7 and T47D, MDA-MB-231 cells also induced autophagy in GFP-LC3 MEF cells (Figure. S1E-H). All these results confirmed that unknown secreted factors induced autophagy in fibroblasts.
Figure 1. Cancer cell-derived factors triggered autophagy in the neighboring fibroblasts. (a and b) Treatment of fibroblast cells with conditioned culture media from MCF7 (1), T47D (2), MDA-MB-231 (MDA; 3), Huh7 (4), and PC3 (5) cancer cells increased GFP-LC3 puncta formation in fibroblast cells. CNT, conditioned medium from MEF cells alone. Quantitative analysis of GFP-LC3 positivity was shown in graphs (mean ± SD of independent experiments, n = 3, *: p < 0.05, **: p < 0.01, ***: p < 0.001) (c) Co-culture of RFP-positive MCF7 (MCF7-RFP) breast cancer cells with GFP-LC3 MEF (MEF) cells. (e) Quantitative analysis of GFP-LC3 positivity in MEF:MCF7-RFP co-culture experiments (24 h and 48 h) (mean ± SD of independent experiments, n = 3, *: p < 0.05; **: p < 0.01). MEF, GFP-LC3 fibroblasts alone (48 h). (d) Co-culture of RFP-positive T47D (T47D-RFP) breast cancer cells with GFP-LC3 MEF (MEF) cells. (f) Quantitative analysis of GFP-LC3 positivity in MEF:T47D-RFP co-culture experiments (24 h and 48 h) (mean ± SD of independent experiments, n = 3, *: p < 0.05; **: p < 0.01). MEF, GFP-LC3 fibroblast alone (48 h). Scale bar: 20 µm.
An unbiased screen for autophagy-inducing cytokines
Cytokines TGFB1 and IL6 were previously shown to induce autophagy in fibroblasts [Citation16–18]. In order to discover new cytokines stimulating autophagy, we produced a set of 73 recombinant cytokines in HEK293T cells and screened GFP-LC3 MEFs for autophagy activation (Figure. S2A). We discovered that seven cytokines significantly induced autophagy in MEFs (Figure. S2B,C). Among them, CTF1 was one of the most potent inducers of autophagy. Since CTF1 was never implicated in autophagy regulation so far, we focused on this cytokine.
Characterization of cancer-derived CTF1 as an autophagy inducer in fibroblasts
In order to confirm that CTF1 was responsible for the autophagy inducing effect that was observed using conditioned media, we co-cultured MCF7 cells with GFP-LC3 MEFs by using the transwell system in the presence of a control antibody (CNT Ab) or a CTF1-specific neutralizing antibody (CTF1 Neut. Ab). Cancer cells on the upper chamber of transwell plates resulted in autophagy activation in MEF cells seeded to the lower chamber (). Autophagy activation in MEFs was significantly inhibited following incubation with CTF1 Neut. Ab, but not with CNT Ab, confirming that cancer-secreted CTF1 was responsible for the observed effect in co-cultures.
Figure 2. CTF1 was the responsible factor inducing autophagy in fibroblasts. Representative images (a) and quantification of GFP-LC3 positivity (b) in fibroblasts that were co-cultured in transwell plates with MCF7 breast cancer cells or not, in the presence of CTF1 neutralizing antibody (Neut. Ab) or control antibody (CNT Ab) (mean ± SD of independent experiments, n = 3, **: p < 0.01, n.s.: not significant). Representative images (c) and quantification of GFP-LC3 positivity (d) in fibroblasts that were treated with HEK-derived control conditioned media (Cond. Media) or CTF1 plus CTF1 neutralizing antibody (Neut. Ab) or control antibody (CNT Ab) (mean ± SD of independent experiments, n = 3, **: p < 0.01, n.s.: not significant). Representative images (e) and GFP-LC3 positivity quantifications (f) of autophagy in fibroblast treated with increasing doses of bacterial recombinant CTF1 protein (Rec. CTF1). Representative images (g) and quantification (h) of GFP-LC3 positivity in fibroblasts that were treated with bacterial recombinant CTF1 or CTF1 plus neutralizing antibody (Neut. Ab) were shown (mean ± SD of independent experiments, n = 3, **: p < 0.01; n.s.: not significant). (i) Endogenous CTF1 protein expression in wild-type (MEF-WT), atg5 KO (MEF KO) and GFP-LC3 transgenic (MEF) fibroblasts and T47D and MCF7 breast cancer cells. kDa, Molecular Weight in kilodaltons (j) Endogenous protein levels of CTF1 receptor components IL6ST/gp130 and LIFR in MEFs and breast cancer cells. (k) Graph depicting ELISA analysis of CTF1 secretion from MEFs and breast cancer cell lines (mean ± SD of independent experiments, n = 6, ***: p < 0.001). (l) Schematic representation of CTF1 receptors IL6ST/gp130, LIFR and CTF1 specific receptor (CTF1R?) and CTF1 (depicted as an oval). Scale bar: 20 µm.
To further elaborate these results, we treated GFP-LC3 MEFs with media from CTF1 overexpressing HEK293T cells (see Materials and Methods) in the presence of a control antibody (CNT Ab) or a CTF1-specific neutralizing antibody (CTF1 Neut. Ab). CTF1 spesific neutralizing antibody significantly inhibited autophagy in MEFs which was activated by the media from CTF1 overexpressing HEK293T cells (). Moreover to show direct interaction, we exposed GFP-LC3 MEFs with bacteria-derived and purified recombinant CTF1 protein. We observed that CTF1 induced autophagy in MEFs in a dose-dependent manner. Autophagy that was stimulated under these conditions was significantly inhibited following incubation with the CTF1 neutralizing antibody (). In order to detect the expression levels of CTF1 in cells, we performed immunoblots using extracts from MEFs and breast cancer cells. These experiments revealed that CTF1 was highly expressed in MCF7 and T47D breast cancer cells, but not in MEFs ()). On the other hand, MEFs expressed high levels of CTF1 receptors IL6ST/gp130 and LIFR ()). Furthermore, ELISA tests revealed that CTF1 was secreted by both breast cancer cell types at significant levels ()). Hence, cancer cells are a major source of CTF1 and fibroblasts might be targeted by this cancer-derived cytokine through specific receptors that are abundantly expressed on these cells ()). Off note, CTF1 receptors were undetectable in cancer cells ()).
Molecular mechanisms of autophagy induction by CTF1
We further dissected the kinetics of autophagy induction by CTF1. We observed that the cytokine-stimulated autophagy in MEFs around 30–60 min. following addition. These results were confirmed both by GFP-LC3 puncta formation ()) and LC3 shift ()) assays. To evaluate the autophagic flux, we treated MEFs with CTF1 in the absence or presence of lysosomal inhibitor bafilomycin A1 (BafA1). CTF1-induced LC3-II accumulation was further enhanced in the presence of BafA1 ()). We also analyzed degradation of autophagy receptors, NBR1 and SQSTM1/p62. Under same experimental conditions, we observed degradation of NBR1 and SQSTM1 to some degree and accumulation after BafA1 treatment ()). We also performed quantitative GFP-LC3 and RFP-LAMP1 colocalization analyses. LC3 and LAMP1 colocalization was increased following CTF1 treatment (Fig. S3A-C). All these results showed that CTF1 stimulated productive autophagy, autophagosome and autolysosome formation and autophagic degradation in MEF cells.
Figure 3. Autophagy activation by CTF1 in fibroblast. Time-dependent (0, 15, 30, 60 min.) induction of autophagy by the recombinant CTF1 protein. (a) Representative images, (b) quantification of GFP-LC3 positivity and (c) immunoblots showing LC3 shift in fibroblasts (mean ± SD of independent experiments, n = 3, *: p < 0.05; ***: p < 0.001, n.s.: not significant). (d) Immunoblots of autophagy receptors NBR1 and SQSTM1/p62, and LC3 shift in fibroblasts. DMSO, carrier of torin 1. TORIN, torin 1. 60+ BafA1, 60 min CTF1 treatment in the presence of 100 nM bafilomycin A1 (lysosomal inhibitor). ImageJ band quantifications of LC3-II:I, NBR1:ACTB and SQSTM1:ACTB ratios are shown. Scale bar: 20 µm.
In most cell types, CTF1 activates a signaling cascade involving STAT3 phosphorylation and nuclear translocation. Indeed, in CTF1-treated fibroblast, we observed a time-dependent increase in STAT3 phosphorylation that reached maximal levels after 60 min. of incubation with the cytokine ()). At this time point, a significant proportion of p-STAT3 was found in the nuclear fraction of cells ()).
Figure 4. Intracellular signaling pathways activated by CTF1 in fibroblasts. (a) Immunoblots of phospho-STAT3 (p-STAT3) and STAT3 following recombinant CTF1 treatment for 0, 1, 5, 10, 15, 30, 60, 120, 240 min. ImageJ quantifications of p-STAT3:STAT3 ratios were shown. (b) Immunoblotting of the cytoplasmic fraction (Cyt.) and the nuclear fraction (Nuc.) of MEF cells that were treated with recombinant CTF1 or carrier Tris-HCl pH:8 (CNT). Phospho-STAT3 (p-STAT3), ACTB and LMNA (lamin A/C) antibodies were used. p-STAT3:ACTB and p-STAT3:LMNA band ratios were shown. (c) qRT-PCR analysis of autophagy genes Atg3, Atg7 and Atg8 following carrier Tris-HCl pH:8 (CNT) or CTF1 treatment. (d) Immunoblots of phospho-PRKAA/AMPKα (p-PRKAA) and PRKAA following recombinant CTF1 treatment for 0, 1, 5, 10, 15, 30, 60, 120, 240 min. p-PRKAA:PRKAA band ratios were shown. (e) Immunoblots of phospho-ULK1 (p-ULK1) and ULK1 following recombinant CTF1 treatment for 0, 1, 5, 10, 15, 30, 60, 120, 240 min. p-ULK1:ULK1 band ratios were shown. (f) Immunoblots of phospho-STAT3 (p-STAT3), STAT3, phospho-PRKAA (p-PRKAA), phospho-ULK1 (p-ULK1) and ULK1 following siSTAT3 or dorsomorphin (AMPK inhibitor; Dorso: 10 μM) treatment. p-STAT3:STAT3, p-PRKAA:PRKAA and p-ULK1:ULK1 band ratios were shown. (g) Endogenous protein levels of CTF1 receptor components IL6ST/gp130 and LIFR in patient-derived CAFs. (h, i and j) Immunoblots of recombinant CTF1 treated (0 or 60 min.) CAF cell extracts with LC3, phospho-PRKAA (p-PRKAA) and phospho-STAT3 (p-STAT3) antibodies. ImageJ band ratios were shown under the blots.
Previous studies showed that STAT3 activation correlated with the upregulation of several autophagy-related genes [Citation19]. Indeed, following CTF1 treatment, we observed an increase in the mRNA levels of Atg3, Atg7 and Atg8 ()).
Activation and coordination of a number of signaling pathways are responsible for the stimulation of autophagy in different cell types. Therefore, we checked the status of autophagy-related proteins and pathways in CTF1-treated fibroblasts. A pathway involving the serine/threonine kinase, MTOR, is a major regulator of autophagy. MTOR-mediated phosphorylation of autophagy proteins, such as ULK1, has an inhibitory effect on autophagy. Surprisingly, CTF1 did not lead to a noticeable change in the activity of the MTOR pathway (Figure. S3E,F). On the other hand, phosphorylation of ULK1 at serine 555 by the AMP/ATP sensing kinase AMPK, was shown to stimulate autophagy [Citation20]. In our system, we observed that CTF1 treatment resulted in a time-dependent phosphorylation and activation of AMPK ()) and ULK1 phosphorylation at serine 555 correlated with AMPK activity ()).
To further dissect the signaling pathways, we performed STAT3 silencing using siRNAs or inhibited AMPK using dorsomorphin (Dorso). We observed that, silencing STAT3 blocked CTF1-mediated AMPK activation. However, AMPK inhibition did not show any effect on STAT3 activation ()), indicating that AMPK is downstream to STAT3. In addition, silencing of STAT3 as well as inhibition of AMPK by Dorso attenuated CTF1-induced ULK1 activation ()), placing ULK1 downstream to AMPK. In the light of these data, CTF1-mediated STAT3 activation triggered AMPK-depended ULK1 activation and autophagy in fibroblasts.
These mechanistic observations in MEFs were confirmed in primary cancer-associated fibroblasts (CAFs) that were isolated from patient-derived breast cancer tissue specimen.
In line with previous reports, we observed that CAFs expressed CTF1 receptors LIFR and IL6ST/gp130 ()) [Citation21].
Similar to results obtained in MEFs, CTF1 induced STAT3, AMPK and autophagy activation in CAFs as well ()). All these results demonstrate that CTF1 activated transcriptional as well as post-transcriptional pathways that resulted in the activation of autophagy.
Role of CTF1 and autophagy on fibroblast activation
In order to analyze the effect of CTF1 on the activation of low passage fibroblasts, we first checked the levels of an activation marker, namely ACTA2/α-SMA, following treatment with the cytokine. TGFB that is an important inducer of fibroblast transdifferentiation was used as a positive control. We showed that, a 24 h incubation with recombinant CTF1 or TGFB resulted in a significant increase in the levels of Acta2 mRNA ()) and ACTA2/α-SMA protein ()) in wild-type MEFs (MEF-WT). Importantly, ACTA2/α-SMA inducing effects of CTF1 were not observed in autophagy-deficient atg5 KO or atg7 KO MEFs.
Figure 5. Role of CTF1 in fibroblast activation and transdifferentiation. (a) Immunoblots of wild-type (MEF-WT), atg5 KO (MEF atg5 KO) or atg7 KO (MEF atg7 KO) fibroblasts following recombinant CTF1 or TGFB treatment. ACTA2/α-SMA, anti-ACTA2/α-SMA antibody; GAPDH, loading control GAPDH antibody. (b) ImageJ band quantification ratios of ACTA2:GAPDH. (mean ± SD of independent experiments, n = 3, ***: p < 0.001) (c) qRT-PCR analysis of Acta2 mRNA expression levels in CNT-, CTF1- or TGFB-treated MEFs. (d and f) ACTA2/α-SMA (green) or actin-micro filament (phalloidin red) staining of CNT-, CTF1- or TGFB-treated wild-type (MEF-WT), atg5 KO (MEF atg5 KO) and atg7 KO (MEF atg7 KO) MEFs. Merge, merged images (green and red), Zoom, Zoomed area. (g) Representative images and (h) quantification of gel contraction by activated-fibroblasts following recombinant CTF1 or TGFB treatment or in controls. Scale bar: 20 µm.
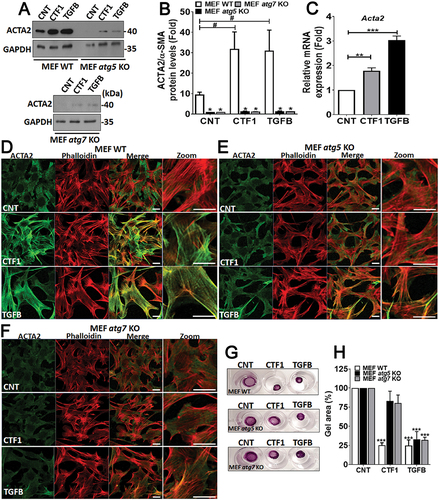
ACTA2/α-SMA is important for the formation of actin stress fibers in activated fibroblasts. Therefore, we stained WT and atg KO MEFs with an ACTA2/α-SMA-specific antibody and phalloidin (to reveal actin fiber organization) and analyzed cells under confocal microscopy. We observed significant changes in the cytoskeleton of CTF1-treated cells. In line with expression data, immunostaining revealed higher levels of ACTA2/α-SMA in cytokine-treated cells compared to controls. Strikingly, cytokine treatment did not induce ACTA2/α-SMA upregulation in autophagy-deficient atg5 KO or atg7 KO MEFs. Phalloidin-stained actin fibers were organized into parallel arrays of thicker bundles that are reminiscent of actin stress fibers observed in activated fibroblasts. In treated cells, a strong colocalization of ACTA2/α-SMA and phalloidin was observed.
Cytoskeletal rearrangements were observed in MEF-WT, but not in atg KO MEFs ()). All these results demonstrated that CTF1 is an inducer of fibroblast activation and autophagy is necessary for the establishment of this phenotype.
We performed collagen gel contractility assays using autophagy competent or deficient cells. We observed that, CTF1 or control TGFB treatment could significantly enhance gel contractility in MEF-WT cells ()). Yet, autophagy-deficient MEFs showed lower contractility under similar condition.
All these data showed that, CTF1 is important for fibroblast activation and CTF1-induced autophagy is indispensable for this event.
Role of CTF1 and autophagy in stroma-assisted cancer cell proliferation, migration and invasion
Activated fibroblasts that are found in the tumor stroma were characterized as a major determinant of cancer growth and metastasis. Therefore, we tested whether co-culture with activated MEFs and breast cancer-derived primary CAFs stimulated cancer cell growth. We observed that cancer cells that were in co-culture with activated MEFs or CAFs proliferated much faster than isolated cultures. Yet, inactivation of CTF1 using a blocking antibody had no significant effect on the observed proliferative phenotype (Figure. S5E,F). Off note, we did not observe fibroblast proliferation under these co-culture conditions (Figure. S5A-D). Interestingly, autophagy-deficient MEFs did not support tumor growth, underlining the importance of stromal autophagy in this context (Figure. S5G).
Previous studied showed that secretion of factors, including IL6, from CAFs played a role in cancer cell growth [Citation22] and CTF1 could induce IL6 upregulation [Citation23]. Therefore, we tested in our system whether CTF1 treatment resulted in the induction of IL6 secretion in fibroblasts.
MEFs were treated with recombinant CTF1 for 24 h and IL6 levels were measured using an ELISA assay. TGFB was used as control. Although, TGFB treatment resulted in significant upregulation of secreted IL6 levels in the medium, CTF1 treatment did not induce IL6 secretion (Figure. S5H). Hence, CTF1-related phenotype in fibroblasts does not depend on its effects on IL6 secretion.
Next, we wondered whether CTF1 was involved in stroma-assisted cancer cell migration and invasion. To test this hypothesis, breast cancer cells and activated MEFs or CAFs were co-cultured, and migration and Matrigel invasion assays were performed. In our system, while fibroblasts did not migrate or invade Matrigel in transwell plates, MCF7 cancer cells did so and appeared in the lower part of transwell membranes (Figure. S6). In this set-up, co-culture with fibroblasts significantly increased both migration and invasion of breast cancer cells ()). Addition of a CTF1 neutralizing antibody abolished fibroblasts-induced migration and invasion capacity.
Figure 6. Role of CTF1 in fibroblast facilitated breast cancer cell migration and invasion and the role of autophagy. Migration and invasion of MCF7 cells that were co-cultured with MEFs or CAFs. (a) Representative images of transwell membrane (0.8 μm) migration of MCF7 cells alone or in co-culture with wild-type MEFs (MCF7:MEF) or MCF7:MEF plus CTF1 neutralizing antibody (Neut. Ab). (b) Representative images of migration of MCF7 cells alone or in co-culture with patient-derived CAFs (MCF7:CAF) or MCF7:CAF plus CTF1 neutralizing antibody (Neut. Ab). (c and d) Quantification of migration experiments (Relative fold changes compared to MCF7 alone) (mean ± SD of independent experiments, n = 3, **: p < 0.01; ***: p < 0.001). (e) Representative images of transwell Matrigel invasion of MCF7 cells alone or in co-culture with wild-type MEFs (MCF7:MEF) or MCF7:MEF plus CTF1 neutralizing antibody (Neut. Ab). (f) Representative images of invasion of MCF7 cells alone or in co-culture with CAFs (MCF7:CAF) or MCF7:CAF plus CTF1 neutralizing antibody (Neut. Ab). (g and h) Quantification of invasion experiments (Relative fold changes compared to MCF7 alone) (mean ± SD of independent experiments, n = 3, *: p < 0.05, **: p < 0.01; ***: p < 0.001). Representative images of migration (I) invasion (K) of MCF7 cells alone or in co-culture with atg5 KO MEFs (MCF7:MEF atg5 KO) or MCF7:MEF atg5 KO plus CTF1 neutralizing antibody (Neut. Ab). (m and o) Quantification of invasion experiments (Relative fold changes compared to MCF7 alone) (mean ± SD of independent experiments, n = 3, *: p < 0.05, **: p < 0.01; ***: p < 0.001). Representative images of migration (j) and invasion (l) of MCF7 cells alone or in co-culture with atg7 KO MEFs (MCF7:MEF atg7 KO) or MCF7:MEF atg7 KO plus CTF1 neutralizing antibody (Neut. Ab). (n and p) Quantification of invasion experiments (Relative fold changes compared to MCF7 alone) (mean ± SD of independent experiments, n = 3, *: p < 0.05, **: p < 0.01; ***: p < 0.001). Scale bar: 100 µm.
Since we observed that cancer cell-derived CTF1 activated autophagy in fibroblasts, we wondered whether fibroblast autophagy played a role in the observed migration and invasion phenotype. In order to address this question, we performed similar experiments using atg5 KO or atg7 KO MEFs. These autophagy-deficient cells failed to stimulate cancer cell migration and invasion, and CTF1 neutralizing antibody had no significant effect in this context ()).
Therefore, cancer cell-derived CTF1 is a critical mediator of tumor-stroma interaction supporting the metastatic phenotype of cancer cells, and autophagy induction in stromal fibroblasts by CTF1 is crucial for these metastasis-related events.
CTF1 expression in human breast cancer specimen correlated with stromal autophagy and advanced disease
We next studied in vivo relevance of our observations in human breast cancer tissues. We obtained paired tumor/non-tumor breast cancer tissue samples from patients (see Table S2; for patient list) and checked CTF1 levels. We observed that increased CTF1 expression correlated with T2 tumor stage (tumors between 2 − 5 cm) rather than T1 stage (2 cm in their larger dimension) () and Figure. S7). In the light of our findings about the role of CTF1 in cancer cell migration and invasion, we analyzed lymph node involvement in CTF1 high and low tumors. We observed a significant association between primary tumor CTF1 expression and lymph node metastasis (N0 versus N1 or N2 tumors) ()). These data strongly suggest a positive correlation between CTF1 and advanced breast tumor stage as well as lymph node metastasis.
Figure 7. Cancer stage-associated CTF1 expression in human breast cancer tumors. (a) Expression of CTF1 protein in human breast cancer tumors (T) compared to corresponding non-tumorous tissues (NT). T1, T2, tumor stages according to the AJCC classification. (b) Comparison of CTF1 expression in T1 versus T2 stage tumors (T1: n = 27, T2: n = 39, *: p = 0,037). (c) Comparison of CTF1 expression in N0 versus N1 plus N2 stage breast cancer specimen. N0, N1, N2, lymph node involvement stage according to the AJCC classification (N0: n = 37, N1+ N2: n = 29, **: p = 0,008). Comparison of CTF1 expression with ESR (d), PGR (e), ERBB2/Her2 (f), MKI67/Ki67 (g) positivity and breast cancer subtypes (diagnosed by histopathology) (h).
We also checked whether CTF1 expression correlated with ESR ()), PGR ()), ERBB2/Her2 ()), MKI67/Ki67 ()) expression levels and breast cancer subtypes ()) in pathology specimen from patients. We saw that, CTF1 expression did not correlate with hormone receptor status, MKI67/Ki67 positivity and breast cancer subtypes.
In order to evaluate correlation of CTF1 expression with stromal autophagy and CAF activation, we analyzed tumor tissue sections using immunofluorescence staining. We compared tumors expressing high or low levels of CTF1 ()). An antibody against ACTA2/α-SMA was used as a marker of cancer-associated stromal fibroblasts (CAFs), and an anti-LC3 antibody that preferentially recognized an autophagy-associated form of LC3 (LC3-II) was used as a marker of autophagy. We observed that tumors that express lower levels of CTF1 contained less ACTA2/α-SMA positive fibroblasts ()).
Figure 8. ACTA2/α-SMA and LC3 immunostaining in CTF1 high and low breast cancer specimen. (a) Representative images of nuclei (Hoechst 33,342, Blue), anti-ACTA2/α-SMA (red) and anti-CTF1 (green) immunostaining of a T1 breast cancer tissue. (b) Similar immunostaining analysis of a T2 breast cancer tissue. (c) Representative images of nuclei (Hoechst 33,342, Blue), anti- ACTA2/α-SMA (red) and anti-LC3 (green) immunostaining of a T1 breast cancer tissue. (d) Similar immunostaining analysis of a T2 breast cancer tissue. Arrows, LC3 and ACTA2/α-SMA signal overlap areas. (e) Immunoblot analysis of CTF1 and LC3 proteins in non-tumor and tumor samples of T1 and T2 breast cancer tissue. LC3-II:I and CTF1:ACTB band ratios were quantified by ImageJ analysis. Scale bar: 100 µm.
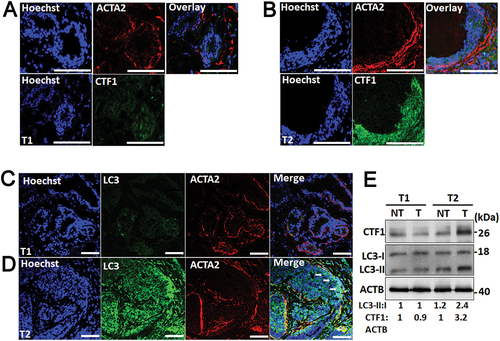
Tumors with a higher expression of CTF1 intensely stained with the anti-ACTA2 antibody, and the ACTA2/α-SMA signal strongly overlapped with the LC3-II autophagy staining. Correlation between tumor CTF1 levels and autophagy was further confirmed in immunoblots of tumor versus non-tumor protein extracts ()).
These results revealed that CTF1 expression in breast cancer was associated with an increase in the abundance of CAFs, and a higher level of autophagy in these cells. In line with our in vitro migration and invasion data, higher CTF1 levels and stromal autophagy in breast tumors were significantly associated with lymph node metastasis and aggressive metastatic behavior.
SILAC MS/MS analysis of CTF1-induced proteomic changes in fibroblasts
Modification of extracellular matrix components by tumor stroma fibroblasts facilitates migration and invasion of cancer cells. In order to document changes in the proteomics of fibroblasts following CTF1 exposure, we performed SILAC-MS/MS analysis (Figure. S8). 49 proteins were significantly up- or down-regulated following CTF1 exposure. Among the proteins modulated by CTF1, collagens such as COL5A1 and COL12A1 and collagen fibril modifiers of secreted factors such as PLOD1 were found, indicating that CTF1 treatment affected ECM components that are secreted by fibroblasts and that contribute to remodeling of the ECM (Table S3) [Citation24]. Transdifferentiation of naïve fibroblasts into activated fibroblasts is associated with the acquirement of a contractile and motile phenotype. We have already shown that ACTA2/α-SMA was upregulated in CTF1 treated fibroblasts. In addition to ACTA2/α-SMA another activated fibroblast/CAF-associated marker, CD44, was also upregulated under these conditions [Citation25]. Moreover, levels of several proteins that are involved in cytoskeletal rearrangement and cell migration (MEMO1, CRIP2, FAT1, ACP1, BZW2, PARP14, DCLK1, EPHA2) were altered by CTF1 [Citation26–33].
Levels of proteins, including ACAT2, IDI1, FDPS, NSDHL, HMGS and PRKCB were also altered, indicative of metabolic reprogramming [Citation34–39]. All these results provide additional evidence about the role of CTF1 in fibroblast reprogramming, activation and transdifferentiation and fibroblast-mediated ECM remodeling.
Discussion
In this study, we showed that a cytokine, CTF1/CT-1 (cardiothropin 1), is a novel mediator of cancer-stroma interaction. Indeed, we observed that CTF1 was overexpressed in cell lines derived from different cancer types, including breast cancer cells. Yet, the level of the cytokine was low in non-transformed cells, such as fibroblasts ()). In fact, fibroblasts are key components of the tumor stroma, and we observed that they expressed CTF1 receptors () and )). Consequently, cancer-derived CTF1 could activate downstream signaling pathways in fibroblasts. One of the prominent cellular outcomes of CTF1 exposure was the activation of autophagy ( and Figure. S3). Accumulating data in the literature show that cancer stroma autophagy is essential for the growth of various types of tumors [Citation40–42]. We did not observe a significant difference in cancer cell growth after blocking CTF1 (Figure. S5E-G). Yet, we discovered that CTF1 was a critical factor in fibroblast activation, and this phenotype depended on autophagy activation and ACTA2/α-SMA upregulation by the cytokine (). Moreover, CTF1 was indispensable for fibroblast- and patient-derived CAF-facilitated migration and invasion of co-cultured breast cancer cells, and these metastasis-associated effects required autophagy activation by the cytokine (). In line with these in vitro observations, CTF1 was upregulated in the majority of human breast tumor specimens, and its expression correlated with advanced disease and lymph node metastasis ().
Furthermore, dynamic proteomics analysis of CTF1 treated fibroblasts revealed changes in the level of proteins that are associated with fibroblast reprogramming, transdifferentiation, and ECM remodeling (Figure. S8, Table S3).
Here, we provided evidence that cancer-derived CTF1 was an important inducer of autophagy in fibroblasts. CTF1 induced autophagy in a dose and time-dependent manner. We showed that CTF1 triggered activation of the STAT pathway, upregulation of the expression of autophagy proteins such as ATG3, ATG7 and ATG8. In addition, key autophagy regulators AMPK and ULK1 were phosphorylated and activated following CTF1 treatment.
Activation of MTOR and its downstream target RPS6 was not affected by CTF1, indicating that these effects were independent of the MTOR pathway (Figure. S3E,F). STAT and AMPK-ULK1 signals preceded the autophagic activity (1–5 min. vs. 30 min.) and STAT3 activation was necessary for AMPK activation ()). Interestingly, CTF1-mediated autophagy activation was sustained at even longer time periods (24 h, 48 and 72 h), indicating responsiveness of fibroblast to CTF1 during chronic exposure (i.e., in tumor tissues) (Figure. S3D). In the light of these results, we propose that CTF1-mediated STAT activation provided autophagy stimulating signals through upregulation of key autophagy mRNAs and proteins, and through AMPK activation and ULK1 phosphorylation.
In recent years, there is a growing interest in the role of autophagy in tumor-stroma interactions. Studies with different cancer models showed that, autophagy-competent tumor growth was severely impaired in autophagy-deficient animals [Citation40–42]. In all these studies, the major focus was the role of stroma in the metabolic support of tumor cells. To our knowledge, this is the first report showing that autophagy in the stroma contributes to the CAF phenotype and plays a role in CAF-assisted tumor cell migration and invasion ().
In line with these experimental observations, analysis of a series of patient-derived breast cancer tissues revealed that, a high expression of CTF1 in tumor parenchyma correlated with ACTA2/α-SMA positivity and autophagy activation in the stroma and lymph node metastasis of tumors (). Treatment strategies design to treat breast cancer patients may vary according to their hormone receptor status and subtypes [Citation43]. Although, we have analyzed ESR, PGR, ERBB2/Her2 and MKI67/Ki67 expression levels in a series of breast cancer specimen, CTF1 expression did not correlate with these parameters (). Hence, CTF1 positivity in tumors might be a sign of metastasis to the lymph nodes, and stromal autophagy is an important determinant of tumor metastasis.
A number of cytokines were involved in tumor-stroma interactions and CAF formation [Citation16,Citation44]. TGFB was identified as a major regulator in this context. Although, CTF1 and TGFB use different receptors and downstream signals, in our hands, both were able to strongly induce ACTA2/α-SMA expression and stress fiber formation, indicative of fibroblast activation and transdifferentiation (). Off note, while TGFB induced IL6 activation in fibroblasts, CTF1 did not do so, indicating a divergence in the mechanism of action of these two cytokines. In support of these data, we observed a higher level of ACTA2/α-SMA positivity in human breast cancer specimen showing a high expression of CTF1 (). Hence, CTF1 is an important inducer of fibroblast activation and CAF phenotype.
Previous studies showed that autophagy was involved in the maturation, secretion and degradation of ECM components, including collagens [Citation45,Citation46]. Indeed, in our system, proteomics analysis of CTF1 treated fibroblasts provided evidence that treatment with the cytokine altered the levels of collagens and collagen-modifying enzymes. Considering that CTF1 is a strong inducer of autophagy in our system, autophagy may play a direct role through its effects on ECM components and modifiers. In addition, autophagy might be indirectly contributing to ECM modification by regulating fibroblast activation and CAF formation.
Overall, our study introduces CTF1 as a new mediator of tumor-stroma interactions. This novel function of CTF1 largely relies on its autophagy activating effects, resulting in the regulation of cancer migration, invasion and metastasis.
Materials and methods
Ethics statement
Samples collected under protocols approved by the Ethical Committees of Istanbul University Medical Faculty, Çukurova University Medical Faculty and Koç University Medical Faculty and written informed consent obtained from all participants.
Cell culture and transfection
Immortalized mouse embryonic fibroblast cells (MEF) were obtained following transfection with the SV40 whole genome of early passage primary GFP-LC3 transgenic MEF [Citation47,Citation48] or primary MEF wild type (WT) and atg5 knockout (KO) (Figure. S4A) [Citation49]. MCF7-RFP and MCF7-LUC breast cancer cells were derived from MCF7 (ATCC, HTB-22) following lentiviral transduction. T47D-RFP and MDA-MB-231-RFP breast cancer cells cells were derived from T47D and MDA-MB-231 (ATCC, HTB-26) following lentiviral transduction, respectively. HEK293T, MCF7, T47D, Huh7, PC3 cells were cultured in full DMEM medium, which is DMEM (Sigma-Aldrich, D5671) supplemented with 10% (v:v) fetal bovine serum (FBS), L-glutamine and 100 U/mL penicillin/streptomycin, at 37°C in a humidified 5% CO2 incubator. GFP-LC3 (green fluorescent protein-fused to MAP1LC3) transgenic MEF (GFP-LC3 MEF) and MDA-MB-231 (MDA) cells were cultured in full DMEM medium supplemented with 1 x MEM non-essential amino acid solution (Gibco, 11,140–035). MEF-WT and KO cells were cultured in MEF medium (full DMEM medium supplemented with 55 µM β-mercaptoethanol). SiRNA-mediated knockdown experiments performed by using STAT3 targeting siRNA (siSTAT3) (Dharmacon SiGENOME Smart Pool Stat3 siRNA, M-040794-00-0005) purchased from Thermo Scientific.
Establishment of atg7 KO MEF cells
MEF atg7 KO cells were generated by using CRISPR/Cas9 method. Guide-RNA sequences for targeting atg7 were designed by using sgRNA Designer: CRISPRko Broad institute online tool. Complementary oligonucleotides were purchased including restriction enzyme BsmBI (Thermo, ER0451) cutting sites as follows; crAtg7 Fwd: 5’-CACCGAACTCCAACGTCAAGCGGGT-3’, crAtg7 Rev: 5’-AAACACCCGCTTGACGTTGGAGTTC-3’. Oligos were annealed and then cloned into lentiCRISPRv2 (Addgene, 52,961; deposited by Feng Zhang). Calcium phosphate salt precipitation method was used to produce lentiviruses. HEK293T cells were transfected with gRNA-Atg7 containing lentiCRISPRv2 vector with pMD2.G (Addgene, 12,259; deposited by Didier Trono) and psPAX2 (Addgene, 12,260; deposited by Didier Trono) vectors. After 48 h, the medium was collected, centrifuged, and filtered with 0.45-µm pore syringe. MEF cells were transduced with lentiviruses in the presence of 5 µg/ml of polybrene (Sigma-Aldrich, H9268). Forty-eight h later, selection was carried out by administration of selection antibiotic puromycin (1 µg/ml) for 5 days. Individual clones were allowed to growth and verified by immunoblotting (Figure. S4B).
Isolation of patient-derived primary breast cancer fibroblasts, CAFs
Fresh tissue samples were obtained in sterile DMEM media and washed with ice-cold PBS. Then, they were minced and treated with Liberase TL (Roche, 05401020001) at 37°C for 1–2 h, depending on the size of the sample. Samples were then vortexed every 30 minutes to allow homogenization. Single-cell suspensions were centrifuged for 10 min. Cell pellets were dissolved in fresh culture media and samples seeded onto 12-well culture plates and then allowed the attached for 1 h. After 1 h, cells were washed in PBS and only adherent fibroblasts were maintained in culture.
Lentiviral transduction and MCF7, T47D, MDA-MB-231 and MEF stable cell line generation
Lentiviruses were produced by transfection of pRSI9-U6-UbiC-TagRFP-2A-Puro, pLenti CMV V5-LUC Blast (w567-1) and pLenti CMV GFP Puro (658–5) (Addgene, 28,289, 21,474 and 17,448; deposited by Alex Chenchik and Gus Frangou, Eric Campeau and Eric Campeau and Paul Kaufman, respectively.) plasmids together with helper plasmids psPAX2 and pMD2.G (Addgene, 12,260 and 12,259; deposited by Didier Trono) into HEK293T cells. Cell supernatants were harvested at 48 h and 72 h after transfection and used to infect cells. For stable cell line generation, all cells were infected at a 60% confluence for 24 h with lentiviral supernatants diluted 1:1 with full DMEM culture medium supplemented with 5 µg/ml polybrene (Sigma-Aldrich, H9268). Twenty-four h after infection, fresh medium was added. MCF7 cells stably expressing RFP (MCF7-RFP), Luciferase (MCF7-LUC), T47D cells stably expressing RFP (T47D-RFP), MDA-MB-231 cells stably expressing RFP (MDA-MB-231-RFP) and MEF cells stably expressing GFP (MEF-GFP) were obtained after the selection of cells with 1 µg/ml concentration of puromycin for 4 weeks.
Conditioned medium
Conditioned medium was obtained from different cancer cells (MCF7, MDA, Huh7, and PC3 cells) and as controls from GFP-LC3 MEF cells for microscope and from MEF-WT cells for immunoblot analysis. After 16 h of culture, the medium was replaced with low-FBS medium (5 ml/10 cm plate), which is DMEM medium containing 3% FBS with L-glutamine, 100 U/ml penicillin and streptomycin. After 72 h, the medium of the cells was collected and concentrated using Amicon Ultra-4 centrifugal filter units (3 kDa cutoff; Milipore, UFC800396) with centrifugation at 4.000 × g for 40 min. using a swinging bucket rotor. Concentrated media (300 μl final volume) were diluted in 1 ml full DMEM plus 1xMEM non-essential amino acids (5 folds concentration) and added onto previously seeded GFP-LC3 MEFs (1 × 10⁵ cells/well in 12-well plates). After 24 h, cells were fixed with 4% paraformaldehyde and autophagy activation was evaluated under fluorescence microscope with GFP-LC3 puncta analysis. The effect of concentrated medium of different cancer cells on autophagy of fibroblast cells was also tested by adding concentrated medium of a certain cancer cell into fresh medium of MEF-WT for 24 h. Autophagy markers were analyzed in MEF-WT cells using immunoblot technique in order to quantify autophagy modulation after treatment with conditioned medium.
Co-culture of MCF7, T47D and MDA-MB-231 cells with fibroblasts
MCF7, T47D and MDA-MB-231-RFP breast cancer cells were prepared (1 × 10⁴ cells/well) in 1 ml medium and added onto previously seeded GFP-LC3 MEFs (1 × 10⁵ cells/well in 12-well plate) on cover slides. After 24 h and 48 h, cells were fixed and autophagy activation was evaluated under fluorescence microscope with GFP-LC3 puncta analysis.
Screens with a cytokine cDNA library set
A cytokine cDNA library set that was cloned into the mammalian expression vector pCMV-SPORT6 vector was purchased from Thermo Scientific (MHS4928). Initially, cDNA of 73 different cytokines were first mixed to have 14 pools containing 5–6 different cytokines (Table S1). HEK293T cells were transfected with the pools and after 8 h of post-transfection, fresh low-FBS medium was added. 72 h later, media of all pools were collected and concentrated using Amicon® Ultra-4 centrifugal filter units as described above. Concentrated media (approximately 300 μl) were diluted in 1 ml of fresh media and added onto GFP-LC3 MEF. After 24 h, cells were fixed and autophagy activation was evaluated under a fluorescence microscope with GFP-LC3 puncta analysis. Individual cytokine cDNAs from the pools were identified by checking individual cytokines of pools that induced autophagy more than two-folds. Finally, individual cDNAs were transfected to HEK293T cells. Their media were collected, concentrated and analyzed on the autophagy of GFP-LC3 MEF as described for the pools. Since, induction of autophagy by IL6 was previously published [Citation16–18], no further autophagy tests were performed using its cDNAs or corresponding conditioned media. The analysis of individual cDNAs was repeated three times (n = 3).
Neutralization antibody treatment
In order to analyze the specification of the induction of autophagy upon treatment with CTF1 conditioned medium, concentrated media were preincubated with 6 µg/ml CTF1 neutralizing antibody (R&D, MAB2601) or with 6 µg/ml control antibody (monoclonal anti-Flag M2 antibody; Sigma-Aldrich, F3165) for 2 h at 4°C before diluting in fresh medium and adding onto fibroblast cells. After 24 h, cells were fixed and autophagy activation was evaluated under a fluorescence microscope with GFP-LC3 puncta analysis.
Recombinant protein of CTF1 treatment on fibroblast cells
The recombinant protein of CTF1 was purchased from Sigma-Aldrich (SRP4011) and resuspended in carrier, which is 20 mM Tris solution (pH 8.0). For autophagy activation, several concentrations of recombinant CTF1 (5 and 25 ng/ml) and several time points (1 min; 5 min; 15 min; 30 min; 1 h) were tested under the microscope with GFP-LC3 puncta analysis and with protein analysis for autophagy marker and further downstream pathways.
GFP-LC3 puncta analysis
To detect autophagy activation by GFP-LC3 puncta analysis, GFP-LC3 MEF cells were fixed with 4% paraformaldehyde (Sigma-Aldrich, 15,812–7), mounted and inspected under 60× magnification using a BX60 fluorescence microscope (Olympus, BX60, Japan). Basal autophagy threshold was determined as 20 GFP-LC3 puncta per control, non-treated GFP-LC3 MEF cells. Puncta in at least 150 cells per experimental point were counted and analyzed. Graphs were plotted as percentage of GFP-LC3 positive cells over total cell numbers.
LAMP1-LC3 colocalization analysis
To detect autophagic flux by quantifiying autolysosomes, MEF cells were treated with CTF1 along with lysosomal inhibitor bafilomycin A1 (Sigma-Aldrich, B1793). Cells were then fixed with 4% paraformaldehyde (Sigma-Aldrich, 15,812–7). Immunostaining was performed using an anti-LAMP1 (Abcam, Ab25630) and anti-LC3 (Sigma-Aldrich, L7543) antibodies, followed by incubation with anti-rabbit IgG Alexa Flour 488 (Invitrogen, 982,425) and anti-mouse IgG Alexa Flour 568 (Invitrogen, A11004) antibodies, respectively. Cover slides were mounted and inspected under 20× magnification using a DMI8 SP8 DLS/CS confocal microscope. Colocalization was quantified using the LASX tool (DMI8; Leica Germany). Ordinary one-way ANOVA statistical analyses were performed using Prism 8 software.
ELISA
Cancer cells were cultured in low FBS (3%) containing media for 72 h. Secreted CTF1 or IL6 levels were tested using the CTF1 (Sigma-Aldrich, RAB0107) or IL6 (R&D, Human IL6 Quantikine ELISA) ELISA kits according to instructions of the manufacturer.
Immunoblot analysis and antibodies
Protein extraction was performed with RIPA buffer (50 mM TRIS-HCl, pH 7.4, 150 mM NaCl, 1% NP40 [Applichem, A1694.0250], 0.25% Na-deoxycholate [Sigma-Aldrich, 30,970]) supplemented with complete protease inhibitor cocktail (Roche, 04–693-131-001) and 1 mM phenylmethylsulfonyl fluoride (PMSF; Sigma-Aldrich, P7626). For phosphorylated proteins, protein extraction was performed with RIPA buffer supplemented with complete protease inhibitor cocktail and phenylmethylsulfonyl fluoride (PMSF; Sigma-Aldrich, P7626) and 100 nM okadaic acid (Calbiochem, 495,604), 1 μM cyclosporine A (Sigma-Aldrich, C3662), 1 mM NaF, 50 mM β-glycerophosphate (Calbiochem, 13,408–09-8). Nuclear fractionation was also performed. Collected cells were dounced with isotonic extraction buffer 40 times and cells were centrifuged at low speed to separate cytosolic fraction. Then nuclei were treated with hypertonic extraction buffer containing (400 mM KCl) and centrifuged to obtain nuclear fraction. Cell extracts (30 μg for SQSTM1 degradation and LC3 shift analysis; 100 μg for the phosphorylation of STAT3, MTOR, RPS6, PRKAA/AMPKα and ULK1 analysis) were separated by SDS-polyacrylamide gels and transferred to nitrocellulose membrane. Following blockage in 5% nonfat milk (or 3% BSA [Sigma-Aldrich, A3059] for phosphorylated-protein analysis), membranes were incubated in 3% BSA-PBST (1X-PBS [Phosphate buffered saline, pH:7.4] with 0,05% Tween 20 [Sigma-Aldrich, P5927]) solutions containing primary antibodies (ab): anti-LC3B ab (Novus Biologicals, NB100-2331, 1:1000), anti-SQSTM1/p62 ab (BD Transduct. Lab, 610,832, 1:4000), anti-human CTF1 (R&D, MAB2601, 1:1000), anti-LIFR (Santa Cruz Biotechnology, sc659, 1:1000), anti-STAT3 ab (Cell Signaling Technology [CST], 9139; 1:1000), anti-p-STAT3 (Tyr 705) ab (CST, 9131; 1:1000), anti-p-MTOR (Ser 2448) ab (CST, 5536; 1:1000), anti-MTOR ab (CST, 2983; 1:1000), anti-p-RPS6 (Ser235/236) ab (CST, 4858; 1:1000), anti-RPS6 ab (CST, 2317; 1:1000), anti-p-PRKAA/AMPKα (Thr172) ab (CST, 2535; 1:1000), anti-PRKAA/AMPKα ab (CST, 2603; 1:1000), anti-p-ULK1 (Ser 555) ab (CST, 5869; 1:1000), anti-ULK1 (CST, 8054; 1:1000), anti-p-STAT3 (Tyr705) ab (CST, 9145; 1:1000), anti-IL6ST/gp130 (Santa Cruz Biotechnology, sc-655; 1:1000), anti-LIFR (Santa Cruz Biotechnology, sc-659; 1:1000), anti-LMNA (CST, 2032; 1:1000) and anti-ACTB/β-actin ab (Sigma-Aldrich, A5441; 1:10,000). Then, the appropriate secondary mouse or rabbit antibodies coupled to horseradish peroxidase (anti-mouse: Jackson Immunoresearch Laboratories, 115,035,003; anti-rabbit: Jackson Immunoresearch laboratories, 111,035,144, 1:10,000) were applied and protein bands were revealed with chemiluminescence. The band signals were quantified using ImageJ.
Immunofluorescence staining
MEF-WT, atg5 or atg7 KO cells were treated with CTF1, cells were fixed with 4% paraformaldehyde and permeabilized in PBS with 0.1% BSA (Sigma-Aldrich, A4503) and 0.1% saponin (Sigma-Aldrich, 84,510). Immunostaining was performed using an anti- ACTA2/α-SMA antibody (Sigma-Aldrich, A2547) followed by incubation with anti-mouse IgG Alexa Flour 488 (Invitrogen, 982,425). Cells also were co-stained with phalloidin for 10 min. (Alexa Flour 546 Phalloidin; Thermo-Fisher, A22283). Cover slides were mounted and inspected under 40× magnification using a Carl Zeiss LSM 710 confocal microscope (Zeiss, Germany). Frozen tissues embedded in OCT (Tissue-Tek, VWR) and cut as 4-micron thickness sections by cryotome (Thermo Scientific Shandon Cryotome FSE). Cut sections of the desired thickness, placed on poly-L-lysine-coated Fisher Superfrost slides and kept under −20°C. Tissue sections then were marked with hydrophobic pen and dehydrated by 1X PBS. Tissue sections were fixed with 4% paraformaldehyde and permeabilized in PBS with 0.1% BSA (Sigma-Aldrich, A4503) and 0.1% saponin (Sigma, 84,510). Immunostaining was performed using anti-CTF1 antibody (R&D, MAB2601), anti-ACTA2/α-SMA antibody (Sigma-Aldrich, A2547), anti-LC3B antibody (Sigma-Aldrich, L7543) followed by incubation with anti-mouse IgG Alexa Flour 488 (Invitrogen, 982,425), anti-mouse IgG Alexa Flour 568 (Invitrogen, A11004), respectively. Cover slides were mounted and inspected under 20× magnification using a Carl Zeiss LSM 710 confocal microscope.
Transwell migration and matrigel invasion assay
Transwell migration assays were performed in 24-well chambers with 8-μm pores (BD falcon, Bedford, MA, USA). MCF7-WT, MCF7-RFP or MCF7-LUC cancer cells were added (1 × 10⁵ cells/well) onto previously seeded WT, atg5 KO or atg7 KO MEFs (5 × 10⁴ cells/chamber) or onto CAFs (3 × 10⁴ cells/chamber) on upper chambers in medium containing no FBS. Lower chambers were filled with media containing 10% FBS as a chemo-attractant. Chambers were incubated at 37°C for 24 h, after which, non-migrating cells were removed with a cotton swab. Cells that successfully migrated to the lower part of transwell membranes were fixed by methanol for 15 min, stained with 0.1% crystal violet for 15 min, and counted under a light microscope or under a fluorescent microscope (MEF-GFP and MCF-RFP cells).
For Matrigel invasion assay, experiments were performed in 24-well using Matrigel-coated chambers with 8-μm pores (BD falcon, Bedford, MA, USA). Chambers were coated with 50 μl Matrigel (1 mg/ml; BD, 356,234) 2 h prior to seeding. Results were analyzed as explained above in the migration assay section.
In transwell luciferase reading experiments, after carefully removing non-migrating or non-invading cells with a cotton swab, membranes were removed without fixation and lysed in Chris Buffer (50 mM Tris, pH 8.0, 200 mM NaCl, 0.1 mM EDTA, 10% glycerol, 0.5% NP40, 1× PI [Protease Inhibitor Cocktail; Sigma-Aldrich, P8340]). Luciferase assays were performed with supernatants. Luciferase reagent (1.07 mM [MgCO3]4·Mg[OH]2 · 5 H2O, 20 mM Tricine, pH 7.8, 2.67 mM MgSO4, 0.1 mM EDTA, 33.3 mM DTT, 270 µM coenzyme A [Sigma-Aldrich, C4282], 530 μM ATP [Sigma-Aldrich, A2383] and 470 μM luciferin [Promega, E1605]) was added. Luciferse signal was measured with a luminometer.
Collagen gel contraction assay
MEF-mediated collagen gel contraction assay was performed as follows: Type-I collagen gel (rat tail collagen; Corning, 354,236) was dissolved in DMEM containing 5% FBS and neutralization buffer (2.2 g NaHCO3, 4.77 g HEPES, NaOH 0.05 M final concentrations, pH 7.2) to achieve a final concentration of collagen of 1 mg/ml. Collagen mixture was then added onto 48-well plates (150 μl/well) and overnigth incubated at 37°C for gelification. WT, atg5 KO or atg7 KO MEFs (3 × 10⁵ cells/ml) in 3% FBS containing DMEM, were seeded. Following 4 h of attachment, gel edges were detached using a needle. Twenty h later, gels were stained with crystal violet and gel areas were measured.
qRT-PCR analysis
Total RNA was extracted using TRIzol reagent (Sigma-Aldrich, T9424) according to the manufacturer’s instructions. cDNA was reverse transcribed from total RNA (DNase treated) using M-MuLV reverse transcriptase (Fermentas, EP0351) or RevertAid enzyme (ThermoScientific, EP0441) and random hexamers (Invitrogen, 48,190–011). SYBR Green Quantitative RT-PCR kit (Roche, 04–913-914-001) and a Roche Light Cycler 480 were used for single step qRT-PCR reactions. To activate the SYBR green, an initial cycle of 95°C, 10 min. was performed followed by, PCR reactions: 40 cycles of 95°C for 15s. and 60°C for 1 min. Then a thermal denaturation protocol was used to generate the dissociation curves for the verification of amplification specificity (a single cycle of 95°C for 60s. 55°C for 60s. and 80 cycles of 55°C for 10s). Changes in mRNA levels were quantified using the 2−ΔΔCT method using GAPDH (gyceraldehyde-3-phosphate dehydrogenase) mRNA as control.
Tumor analysis
Frozen tissue (present in liquid nitrogen) was broken into pieces, weighted, and washed in lysis buffer. After spinning at 11,000 x g for 1 min at 4°C, 2.5 μl/mg RIPA was added. Using a disposable tissue grinder, pieces were ground in a time with approx. 40 strokes. Homogenization was performed on ice by spinning at 15,000 x g for 15 min at 4°C.
Labeling protein lysates with SILAC (stable isotope labeling in cell culture) technique
We previously described the technique in detail in our previous article [Citation50]. Here, MEF-WT cells were cultured for 10 days in order to perform heavy labeling for CTF1 condition medium treatment and medium labeling for CNT, moreover MEF-WT cells were cultured in light labeling for starvation treatment. SILAC medium contains DMEM (Thermo Fisher Scientific, 89,985) including penicillin/streptomycin (100 unit/mL; PAN Biotech, 06–07100), L-glutamine (100 μg/mL; PAN Biotech, P04-80,100) and 10% FBS (Gibco, 26,400–044). Depending on labeling types, different isotopes of amino acids were added. For heavy labeling, 42 μg/mL L-arginine-13C6 15N4 hydrochloride (Arg10; Sigma-Isotec, 608,033) and 40 μg/mL L-lysine −13C6 15N2-hydrochloride (Lys8; Sigma-Isotec, 608,041); for medium labeling, 42 μg/mL L-arginine-13C6- hydrochloride (Arg6; Cambridge Isotope laboratories Inc, CLM-2265) and 40 μg/m L -lysine-4,4,5,5-d4 hydrochloride (Lys4; Sigma-Isotec, 616,192) and for light labeling, arginine (Arg0; Sigma, 11,039) and lysine (Lys0; Sigma, L8662) were added into SILAC medium. After labeling, MEF-WT cells were treated with CTF1. After 24 h of treatment, from collected cells, protein lysates were obtained using RIPA solution.
Digest of proteins with trypsin enzyme in the gel
Obtained protein lysates were reduced with 10 mM DTT, alkalized with 55 mM iodoacetamide (Sigma-Aldrich, I1149). Samples were loaded to NuPAGER gel to run gel electrophoresis and stained with colloidal blue. In the gel, the regions, that contained proteins, are digested with Trypsin enzyme (Trypsin-sequencing grade, PROMEGA, V511C).
LC-MS/MS
After Trypsin treatment, peptide fragments were loaded into C18-filled columns and purified in order to sequence with HPLC-related mass spectrometry. Electrospray experiments were performed with Agilent 1200 nanoflow LC system (Agilent Technologies) connected nanoelectrospray ion source and LTQ Orbitrap XL mass spectrometry (Thermo Fisher Scientific). Chromatographic separation of peptides was performed in emitormicrocolon which is filled with reverse-phase mode ReproSil-Pur C18-AQ beads (Dr. Maisch) and packed with 15 cm silica (SilicaTipPicoTip; New Objective).
Proteomic data analysis
Raw chromatogram data, obtained from mass spectrometry, were analyzed with MaxQuant v.1.2.0.1.8 and Andromeda database. At the end of the analysis, Benjamin Hochberg statistic test was applied. According to the result of the analysis, proteins, which indicated differences depending on CTF1 treated samples versus CNT control, were determined.
Statistical analysis
Statistical analyses were performed using Student’s two-tailed t-test or ordinary one-way ANOVA. Data were presented as means of ± SD of ≥3 independent experiments. Values of p < 0.05 were considered as significant.
Supplemental Material
Download Zip (11.6 MB)Acknowledgments
GFP-LC3 transgenic MEFs and atg5 KO and wild-type MEFs were a kind gift of Noboru Mizushima. We would like to thank to Dilek Cevik for her technical support. This work was supported by Scientific and Technological Research Council of Turkey (TUBITAK) 2523 grant number 112T685. Y.A., H.E.K. and S.E.B. were supported by TUBITAK-BIDEB 2211-A scholarship for Ph.D. studies.
Disclosure statement
No potential conflict of interest was reported by the author(s).
Supplementary material
Supplemental data for this article can be accessed online at https://doi.org/10.1080/15548627.2022.2090693
Additional information
Funding
Related Research Data
References
- Bhome R, Bullock MD, Al Saihati HA, et al. A top-down view of the tumor microenvironment: structure, cells and signaling. Front Cell Dev Biol. 2015;3:33.
- Schiavoni G, Gabriele L, Mattei F. The tumor microenvironment: a pitch for multiple players. Front Oncol. 2013;3:90.
- Balkwill F, Mantovani A. Inflammation and cancer: back to Virchow? Lancet. 2001;357:539–545.
- Polyak K, Haviv I, Campbell IG. Co-evolution of tumor cells and their microenvironment. Trends Genet. 2009;25:30–38.
- Frank S, Madlener M, Werner S. Transforming growth factors beta1, beta2, and beta3 and their receptors are differentially regulated during normal and impaired wound healing. J Biol Chem. 1996;271:10188–10193.
- Ronnov-Jessen L, Petersen OW. Induction of alpha-smooth muscle actin by transforming growth factor-beta 1 in quiescent human breast gland fibroblasts. Implications for myofibroblast generation in breast neoplasia. Lab Invest. 1993;68:696–707.
- Seong GJ, Hong S, Jung SA, et al. TGF-beta-induced interleukin-6 participates in transdifferentiation of human Tenon’s fibroblasts to myofibroblasts. Mol Vis. 2009;15:2123–2128.
- Akkoc Y, Gozuacik D. Autophagy and liver cancer. Turk J Gastroenterol. 2018;29:270–282.
- Kocaturk NM, Akkoc Y, Kig C, et al. Autophagy as a molecular target for cancer treatment. Eur J Pharm Sci. 2019;134:116–137.
- Pennica D, Wood WI, Chien KR. Cardiotrophin-1: a multifunctional cytokine that signals via LIF receptor-gp 130 dependent pathways. Cytokine Growth Factor Rev. 1996;7:81–91.
- Bauer S, Kerr BJ, Patterson PH. The neuropoietic cytokine family in development, plasticity, disease and injury. Nat Rev Neurosci. 2007;8:221–232.
- Robledo O, Fourcin M, Chevalier S, et al. Signaling of the cardiotrophin-1 receptor. Evidence for a third receptor component. J Biol Chem. 1997;272:4855–4863.
- Rossi JF, Lu ZY, Jourdan M, et al. Interleukin-6 as a therapeutic target. Clin Cancer Res. 2015;21:1248–1257.
- Sheng Z, Pennica D, Wood WI, et al. Cardiotrophin-1 displays early expression in the murine heart tube and promotes cardiac myocyte survival. Development. 1996;122:419–428.
- Lopez-Yoldi M, Moreno-Aliaga MJ, Bustos M. Cardiotrophin-1: a multifaceted cytokine. Cytokine Growth Factor Rev. 2015;26:523–532.
- Karakas HE, Kim J, Park J, et al. A microfluidic chip for screening individual cancer cells via eavesdropping on autophagy-inducing crosstalk in the stroma niche. Sci Rep. 2017;7:2050.
- Kiyono K, Suzuki HI, Matsuyama H, et al. Autophagy is activated by TGF-beta and potentiates TGF-beta-mediated growth inhibition in human hepatocellular carcinoma cells. Cancer Res. 2009;69:8844–8852.
- Martinez-Outschoorn UE, Whitaker-Menezes D, Lin Z, et al. Cytokine production and inflammation drive autophagy in the tumor microenvironment: role of stromal caveolin-1 as a key regulator. Cell Cycle. 2011;10:1784–1793.
- Jonchere B, Belanger A, Guette C, et al. STAT3 as a new autophagy regulator. Jakstat. 2013;2:e24353.
- Bach M, Larance M, James DE, et al. The serine/threonine kinase ULK1 is a target of multiple phosphorylation events. Biochem J. 2011;440:283–291.
- Albrengues J, Bertero T, Grasset E, et al. Epigenetic switch drives the conversion of fibroblasts into proinvasive cancer-associated fibroblasts. Nat Commun. 2015;6:10204.
- Subramaniam KS, Omar IS, Kwong SC, et al. Cancer-associated fibroblasts promote endometrial cancer growth via activation of interleukin-6/STAT-3/c-Myc pathway. Am J Cancer Res. 2016;6:200–213.
- Fritzenwanger M, Meusel K, Foerster M, et al. Cardiotrophin-1 induces interleukin-6 synthesis in human umbilical vein endothelial cells. Cytokine. 2006;36:101–106.
- Qi Y, Xu R. Roles of PLODs in collagen synthesis and cancer progression. Front Cell Dev Biol. 2018;6:66.
- Kinugasa Y, Matsui T, Takakura N. CD44 expressed on cancer-associated fibroblasts is a functional molecule supporting the stemness and drug resistance of malignant cancer cells in the tumor microenvironment. Stem Cells. 2014;32:145–156.
- Chen CH, Ho YC, Ho HH, et al. Cysteine-rich protein 2 alters p130Cas localization and inhibits vascular smooth muscle cell migration. Cardiovasc Res. 2013;100:461–471.
- Deuel TA, Liu JS, Corbo JC, et al. Genetic interactions between doublecortin and doublecortin-like kinase in neuronal migration and axon outgrowth. Neuron. 2006;49:41–53.
- Dunne PD, Dasgupta S, Blayney JK, et al. EphA2 expression is a key driver of migration and invasion and a poor prognostic marker in colorectal cancer. Clin Cancer Res. 2016;22:230–242.
- Gao H, Yu G, Zhang X, et al. BZW2 gene knockdown induces cell growth inhibition, G1 arrest and apoptosis in muscle-invasive bladder cancers: a microarray pathway analysis. J Cell Mol Med. 2019;23:3905–3915.
- Kuo JC, Han X, Hsiao CT, et al. Analysis of the myosin-II-responsive focal adhesion proteome reveals a role for beta-Pix in negative regulation of focal adhesion maturation. Nat Cell Biol. 2011;13:383–393.
- Nishikawa Y, Miyazaki T, Nakashiro K, et al. Human FAT1 cadherin controls cell migration and invasion of oral squamous cell carcinoma through the localization of beta-catenin. Oncol Rep. 2011;26:587–592.
- Rigacci S, Rovida E, Dello Sbarba P, et al. Low Mr phosphotyrosine protein phosphatase associates and dephosphorylates p125 focal adhesion kinase, interfering with cell motility and spreading. J Biol Chem. 2002;277:41631–41636.
- Zaoui K, Honore S, Isnardon D, et al. Memo-RhoA-mDia1 signaling controls microtubules, the actin network, and adhesion site formation in migrating cells. J Cell Biol. 2008;183:401–408.
- Caldas H, Herman GE. NSDHL, an enzyme involved in cholesterol biosynthesis, traffics through the Golgi and accumulates on ER membranes and on the surface of lipid droplets. Hum Mol Genet. 2003;12:2981–2991.
- Kim HY, Kim DK, Bae SH, et al. Farnesyl diphosphate synthase is important for the maintenance of glioblastoma stemness. Exp Mol Med. 2018;50:137.
- Nakamura K, Mori F, Tanji K, et al. Isopentenyl diphosphate isomerase, a cholesterol synthesizing enzyme, is localized in Lewy bodies. Neuropathology. 2015;35:432–440.
- Parini P, Jiang ZY, Einarsson C, et al. ACAT2 and human hepatic cholesterol metabolism: identification of important gender-related differences in normolipidemic, non-obese Chinese patients. Atherosclerosis. 2009;207:266–271.
- Tsui C, Martinez-Martin N, Gaya M, et al. Protein kinase C-beta dictates B cell fate by regulating mitochondrial remodeling. Metab Reprogramming, Heme Biosynthesis. Immun. 2018;48:1144–59 e5.
- Zhao L, Fan J, Xia S, et al. HMG-CoA synthase 1 is a synthetic lethal partner of BRAF(V600E) in human cancers. J Biol Chem. 2017;292:10142–10152.
- Katheder NS, Khezri R, O’Farrell F, et al. Microenvironmental autophagy promotes tumour growth. Nature. 2017;541:417–420.
- Poillet-Perez L, Xie X, Zhan L, et al. Autophagy maintains tumour growth through circulating arginine. Nature. 2018;563:569–573.
- Sousa CM, Biancur DE, Wang X, et al. Pancreatic stellate cells support tumour metabolism through autophagic alanine secretion. Nature. 2016;536:479–483.
- El Sayed R, El Jamal L, El Iskandarani S, et al. Endocrine and targeted therapy for hormone-receptor-positive, HER2-negative advanced breast cancer: insights to sequencing treatment and overcoming resistance based on clinical trials. Front Oncol. 2019;9:510.
- Guan J, Zhang H, Wen Z, et al. Retinoic acid inhibits pancreatic cancer cell migration and EMT through the downregulation of IL-6 in cancer associated fibroblast cells. Cancer Lett. 2014;345:132–139.
- Ghavami S, Cunnington RH, Gupta S, et al. Autophagy is a regulator of TGF-beta1-induced fibrogenesis in primary human atrial myofibroblasts. Cell Death Dis. 2015;6:e1696.
- Kim SI, Na HJ, Ding Y, et al. Autophagy promotes intracellular degradation of type I collagen induced by transforming growth factor (TGF)-beta1. J Biol Chem. 2012;287:11677–11688.
- Gozuacik D, Bialik S, Raveh T, et al. DAP-kinase is a mediator of endoplasmic reticulum stress-induced caspase activation and autophagic cell death. Cell Death Differ. 2008;15:1875–1886.
- Mizushima N, Yamamoto A, Matsui M, et al. In vivo analysis of autophagy in response to nutrient starvation using transgenic mice expressing a fluorescent autophagosome marker. Mol Biol Cell. 2004;15:1101–1111.
- Kuma A, Hatano M, Matsui M, et al. The role of autophagy during the early neonatal starvation period. Nature. 2004;432:1032–1036.
- Erbil S, Oral O, Mitou G, et al. RACK1 is an interaction partner of ATG5 and a novel regulator of autophagy. J Biol Chem. 2016;291:16753–16765.