
ABSTRACT
Macroautophagy/autophagy is a catabolic process by which cytosolic content is engulfed, degraded and recycled. It has been implicated as a critical pathway in advanced stages of cancer, as it maintains tumor cell homeostasis and continuous growth by nourishing hypoxic or nutrient-starved tumors. Autophagy also supports alternative cellular trafficking pathways, providing a mechanism of non-canonical secretion of inflammatory cytokines. This opens a significant therapeutic opportunity for using autophagy inhibitors in cancer and acute inflammatory responses. Here we developed a high throughput compound screen to identify inhibitors of protein-protein interaction (PPI) in autophagy, based on the protein-fragment complementation assay (PCA). We chose to target the ATG12-ATG3 PPI, as this interaction is indispensable for autophagosome formation, and the analyzed structure of the interaction interface predicts that it may be amenable to inhibition by small molecules. We screened 41,161 compounds yielding 17 compounds that effectively inhibit the ATG12-ATG3 interaction in the PCA platform, and which were subsequently filtered by their ability to inhibit autophagosome formation in viable cells. We describe a lead compound (#189) that inhibited GFP-fused MAP1LC3B/LC3B (microtubule associated protein 1 light chain 3 beta) puncta formation in cells with IC50 value corresponding to 9.3 μM. This compound displayed a selective inhibitory effect on the growth of autophagy addicted tumor cells and inhibited secretion of IL1B/IL-1β (interleukin 1 beta) by macrophage-like cells. Compound 189 has the potential to be developed into a therapeutic drug and its discovery documents the power of targeting PPIs for acquiring specific and selective compound inhibitors of autophagy.
Abbreviations: ANOVA: analysis of variance; ATG: autophagy related; CQ: chloroquine; GFP: green fluorescent protein; GLuc: Gaussia Luciferase; HEK: human embryonic kidney; IL1B: interleukin 1 beta; LPS: lipopolysaccharide; MAP1LC3B/LC3B: microtubule associated protein 1 light chain 3 beta; PCA: protein-fragment complementation assay; PDAC: pancreatic ductal adenocarcinoma; PMA: phorbol 12-myristate 13-acetate; PPI: protein-protein interaction. VCL: vinculin.
Introduction
Autophagy is an evolutionarily conserved catabolic process by which cytosolic content of a cell, such as damaged organelles and proteins, is engulfed within a double-layer membrane vesicle, called the autophagosome, which delivers its content to the lysosome for degradation [Citation1,Citation2]. This degradative arm of autophagy is active at basal levels in all eukaryotic cells as a means to maintain homeostasis. Under stressful conditions, such as nutrient starvation or hypoxia, it is upregulated and serves as a stress response mechanism [Citation3]. The removal of damaged proteins and organelles from the cell by autophagy, in addition to providing building blocks for the synthesis of new macromolecules and energy, enables the cell to overcome the stressful conditions and regain homeostasis. This essential role of autophagy is adopted by tumor cells to promote their survival and proliferation at advanced stages of tumor development [Citation4,Citation5].
In advanced stages of tumorigenesis, many types of solid tumors, primary as well as metastatic, have been shown to depend on autophagy, which becomes essential for coping with the various stress conditions that develop in the tumor microenvironment [Citation6–8]. For example, the inner cells within the tumor mass are under constant stressful conditions such as hypoxia and nutrient starvation, and therefore autophagy is crucial for their survival [Citation9]. In particular, RAS-driven cancers such as pancreatic cancer depend on autophagy [Citation10], since autophagy is required to maintain nucleotide pools during unconstrained cell proliferation and functional mitochondria necessary for metabolism and energy homeostasis. In addition, during chemotherapy or targeted cancer therapy, autophagy is up-regulated in the tumor cells, counteracting drug-induced killing. For these reasons, tumor cells develop dependency on autophagy for their continuous survival [Citation11–14]. The dependence of various tumors on excessive levels of autophagy has been termed in the literature “autophagy addiction,” and re-defines this essential cellular process as a potential therapeutic target for cancer treatment.
Autophagy also supports alternative cellular trafficking pathways, providing a mechanism of non-canonical protein secretion [Citation2,Citation15–17]. This arm of autophagy-dependent secretion (the secretory arm, also named autosecretion) enables leaderless cytokines and other danger/damage-associated molecular patterns (DAMPs) proteins to exit the cell without entering the ER- and Golgi-based secretory pathway, via a compartment intermixed with autophagic organelles [Citation18,Citation19]. It confers a role for autophagy in the cytokine storm that occurs during acute inflammatory response, for example, following bacterial infections or during sterile inflammation induced by lipopolysaccharide (LPS) administration [Citation20,Citation21].
Overall, the essentiality of the degradative arm of autophagy to maintain the survival of tumor cells at advanced cancer stages, and its participation in cytokine secretion, provides a significant therapeutic opportunity for using autophagy inhibitors in cancer and acute inflammatory diseases [Citation22]. Yet, the field lacks highly specific and selective drugs. Clinically approved compounds such as chloroquine (CQ) or its derivative, hydroxychloroquine, lack specificity as they inhibit lysosomal functions and thus have various off-target effects [Citation14,Citation20]. Other efforts to target autophagy by small compounds are based on inhibition of upstream autophagy regulating kinases such as ULK1, a serine/threonine kinase [Citation23], and PIK3C3/VPS34, a lipid kinase [Citation24]. Yet, these drugs display multiple pleiotropic effects due to the fact that ULK1 and PIK3C3 each has additional autophagy-independent roles, and because these drugs also cross-react with other kinases with similar catalytic domains. Here we hypothesized that targeting protein-protein interactions by small molecules may display higher selectivity to autophagy, as even if each protein partner has other non-relevant functions, by targeting the specific interface between a pair of proteins, the probability of off-target effects is significantly reduced. From among the various pairs of proteins participating in the process of autophagy, we chose to target the interaction between ATG12 and ATG3 that is part of a ubiquitin-like conjugation pathway driving LC3B lipidation. ATG3 is an E2-like conjugating protein that by directly binding to the ATG12 protein within the E3 ligase complex (comprising the ATG12–ATG5 conjugate and ATG16L1), delivers the ubiquitin-like protein LC3B to a membrane lipid to drive elongation and closure of autophagosome membranes [Citation2,Citation25]. The essentiality of ATG12-ATG3 to autophagosome expansion and maturation implies that this pathway is indispensable for both the degradative and secretory arms of autophagy.
To develop specific inhibitors of autophagy, we established a sensitive screening platform, based on split luciferase complementation assays, for discovering compounds that inhibit the ATG12-ATG3 interaction using a cell lysate mixing protocol. Positive hits were then filtered to choose the compounds that inhibit autophagy in live cells, and were tested in two different cell culture-based disease models. We report on a new compound discovered by this screening pipeline that inhibited the autophagy process in cells, displayed selective anti-growth effects in autophagy addicted tumor cells, and inhibited cytokine secretion by macrophages.
Results
Choosing the ATG12-ATG3 interaction as target for inhibition
The rationale for choosing the ATG12-ATG3 interaction as a target for drug screening was twofold. First, the ATG12-ATG3 interaction is exclusive to autophagy, with no other known functions in other biological processes, and is reversible with a Kd ranging between 50–100 nM [Citation26]. Secondly, the resolved crystal structure of the interaction interface between the two proteins predicts that it may be amenable to inhibition by small molecules. The structure comprises an alpha helical peptide protruding from ATG3 entering into a cavity in ATG12, and depicts hot spots that should be amenable for inhibition by small molecules. The hot spots at the interface of the two proteins were previously mapped, including a single anchoring residue (Met157) in the helical peptide of ATG3, and several residues on the surface of ATG12. Single mutation of Met157 in ATG3, or in each of the corresponding hot spot residues in ATG12 (Lys54, Lys72, and Trp73) interferes with the binding between these proteins and blocks LC3B lipidation and autophagy, suggesting that the interaction between these two proteins through this specific interface is indispensable for the autophagy process [Citation27]. To provide further support of the central role of ATG3 residue Met157 in the interaction with ATG12, we applied the ANCHORSmap program [Citation28]. According to this prediction, Met157 bound strongly and preferentially to a hydrophobic pocket on the surface of ATG12 (Figure S1), delimited by residues Trp73, Val75, Leu84 and Phe87. Met157 acted as a binding anchor whereas Asp156, Glu158 and Glu161, which made surface H-bonds with ATG12 residues Lys54 and Arg79, acted as potential latches [Citation29] rather than anchoring residues. Altogether, the structural considerations taken together with the essentiality and exclusivity of the interaction make the ATG12-ATG3 PPI a promising target for discovering small molecule autophagy inhibitors. Notably, this interaction differs from a previously described covalent conjugation of ATG3 to ATG12 that involves an isopeptide bond between the C-terminal glycine of ATG12 and Lys 243 in ATG3, and has other cellular functions not related to autophagy [Citation30]. Thus, compounds that interfere with the ATG12-ATG3 PPI through Met 157 of ATG3 docking in the ATG12 cleft are not predicted to block the unrelated conjugation of ATG12 to ATG3, underscoring the benefit of developing PPI inhibitors that are specific to a particular surface interaction between the ATG12-ATG3 pair.
Establishing the PCA-based high-throughput screening platform
The screening platform used here is based on the protein-fragment complementation assay (PCA) [Citation31]. This assay, previously used in our lab for the purpose of detecting novel PPIs within the autophagy and apoptosis pathways [Citation32], is based on co-expression of two proteins of interest, each one fused to an inactive fragment of Gaussia luciferase, GLuc1 (L1) or GLuc2 (L2). Upon interaction of the two proteins, the luciferase fragments are brought into proximity, whereby they fold to form the fully active luciferase protein, resulting in emission of luminescence signal upon addition of its substrate (). This quantitative and sensitive assay was adjusted in our lab for the detection of small molecule PPI inhibitors in general, and specifically here for inhibition of the ATG12-ATG3 interaction. To this end, the luciferase fragments were fused to the C-terminal ends of ATG12 and ATG3, a position that does not interfere with the interaction between the two proteins. First, we calibrated the PCA platform, moving from the previously used format of co-expression of the two reporter genes in cells, to a cell lysate mixing format, each derived from transfection of individual reporter genes. The assumption was that pre-exposing one reporter protein partner (ATG12-L1) to the small compound, before adding the second reporter protein partner (ATG3-L2) will increase the odds of detecting inhibitory compounds. To this end, we calibrated and optimized a number of assay conditions, including the optimal time length of cell lysate mixing incubation. Applying the final conditions of the mixing protocol worked very well, as shown in . Mixing of lysate expressing ATG12-L1 with lysate expressing ATG3-L2 yielded high luminescence signal (). In contrast, mixing ATG3-L2 with ATG12-L1K54D, a variant bearing a mutation within a residue that was identified as critical for the ATG12-ATG3 interaction (Figure S1), showed similar background levels of luminescence as ATG3-L2 alone, confirming the specificity of the signal. To determine whether this mixing protocol is amenable for detecting potential inhibitory small compounds, another pair of GLuc-reporter genes, BCL2L1(BCL-XL)-L1 and BAX-L2 [Citation32], which provided strong luminescent signals in the mixing protocol (), was assayed in the presence of their known compound inhibitor, ABT-737. Incubation of the drug with BCL2L1-L1 cell lysates for 1 h prior to mixing with the BAX-L2 cell lysates resulted in a significant decrease in luminescence, providing a proof-of-concept for the ability to detect inhibitory compounds in the mixing protocol. The calibrated platform was then adapted for the high-throughput robotic system, and the screening workflow is shown schematically in Figure S2.
Figure 1. Adapting the PCA platform for detecting PPI inhibition by small compounds. (A) Scheme of the PCA methodology. ATG12 and ATG3 proteins are fused at their C termini to inactive fragments of luciferase GLuc1 (L1) and GLuc2 (L2), respectively, and co-expressed in cells [Citation31]. When ATG3 and ATG12 proteins interact, the inactive fragments combine to form fully active luciferase. (B) Representative PCA assay of ATG12-L1 and ATG3-L2 lysate mixing protocol. ATG12-L1 WT or ATG12-L1K54D lysates were mixed with ATG3-L2 lysates. RLU, relative luminescence units. (C) Representative PCA assay of BCL2L1-L1 and BAX-L2 lysate mixing protocol with ABT-737. BCL2L1-L1 expressing lysate was mixed with 1 µM ABT-737 prior to addition of BAX-L2 lysate.
![Figure 1. Adapting the PCA platform for detecting PPI inhibition by small compounds. (A) Scheme of the PCA methodology. ATG12 and ATG3 proteins are fused at their C termini to inactive fragments of luciferase GLuc1 (L1) and GLuc2 (L2), respectively, and co-expressed in cells [Citation31]. When ATG3 and ATG12 proteins interact, the inactive fragments combine to form fully active luciferase. (B) Representative PCA assay of ATG12-L1 and ATG3-L2 lysate mixing protocol. ATG12-L1 WT or ATG12-L1K54D lysates were mixed with ATG3-L2 lysates. RLU, relative luminescence units. (C) Representative PCA assay of BCL2L1-L1 and BAX-L2 lysate mixing protocol with ABT-737. BCL2L1-L1 expressing lysate was mixed with 1 µM ABT-737 prior to addition of BAX-L2 lysate.](/cms/asset/bbc5127d-3a9a-4729-8c32-8cab8e8e87b4/kaup_a_2178159_f0001_oc.jpg)
Screening compound libraries of small molecules
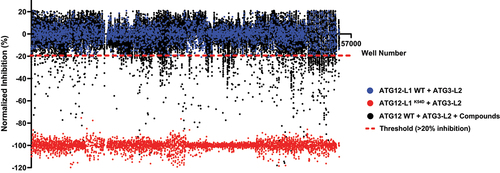
Several compound libraries were screened with the high-throughput experimental platform (). All compounds were plated in 384-well plates (at 10 μM), and further incubated with ATG12-L1 and ATG3-L2, as described in the Materials and Methods. After 24-h incubation, luciferase substrate was added to the plates and luminescence was measured. The ATG12-L1K54D mutant was used as a positive control for disruption of the PPI in these screens (a value corresponding to maximal inhibition) relative to the negative control (no compound). In total, 41,161 compounds from 6 different libraries were screened. From the primary screen, 785 compounds passed the threshold of >20% inhibition and were identified as hits (1.9% hit rate).
Figure 2. Screening small compound libraries. Results of 41,161 compounds (originating from Prestwick, Selleck, MicroSourse, LOPAC, and ChemDiv libraries) screened in the PCA high-throughput system. Blue dots represent ATG12-L1 WT + ATG3-L2 lysates + DMSO solvent (no compound, used as negative control, normalized to 0). Red dots represent ATG12-L1K54D + ATG3-L2 lysates + DMSO solvent (used as positive control for maximal inhibition, normalized to −100). Black dots each represent ATG12-L1 WT + ATG3-L2 lysates + library compounds (10 µM). Dashed red line represents the threshold (20% inhibition). Total screen hit rate is 1.9%, and Z’ score is 0.76. X-axis corresponds to the well number, corresponding to all three types of samples (controls and compounds).
The positive hits from the initial screen were then reexamined in triplicate for hit validation and triaged by medicinal chemists to remove compounds with problematic physical characteristics. Eventually, 24 compounds were chosen and re-synthesized for further examination. The dose response curves of the 24 re-synthesized compounds were determined in cell lysates, using the same protocol adapted for the compound screen (). 17 compounds displayed IC50 corresponding to 9–40 µM, and for the remaining compounds, no effect could be measured at this concentrations range (up to 100 µM).
Table 1. List of re-synthesized compounds with dose-response curves and calculated IC50 measured in the PCA system.
Validating inhibitors of autophagy in Green Fluorescent Protein (GFP)-LC3B cell-based assay
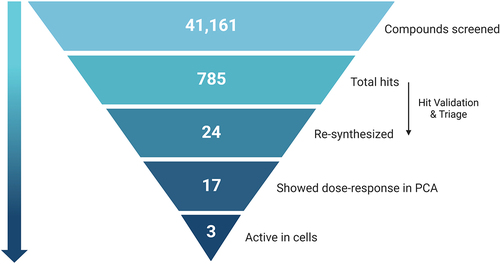
The inhibitory effects of the compounds on autophagy in live cells was then tested by a high-throughput cell-based assay. In this assay, human embryonic kidney (HEK) 293A cells stably expressing GFP-LC3B were treated with each of the 17 active compounds at different concentrations for 22 h, followed by induction of autophagy by 2 h treatment with the MTOR (mechanistic target of rapamycin kinase) inhibitor torin1. The lysosomal inhibitor CQ was added to block fusion of the mature autophagosome with the lysosome, resulting in accumulation of autophagosomes in cells. After staining for nuclei and fixation, autophagosomes were visualized as GFP positive cytoplasmic puncta by fluorescence microscopy. Three of the 17 tested compounds were active in cells, resulting in reduced puncta formation with IC50s that ranged around 10 μM (Table S1). The summary of the outcome of the global screen is shown in .
Figure 3. Pyramid scheme of the compound’s filtration through the screen pipeline. 41,161 compounds were screened in the primary screen, with 785 hits in total (1.9% hit rate). Out of these, 24 compounds passed validation and triage by medicinal chemists, and were re-synthesized for further validations. Out of the 24 re-synthesized compounds, 17 showed dose-response in the PCA system, and 3 were found to be active in cells. Scheme created with BioRender.com.
Characterization of compound 189
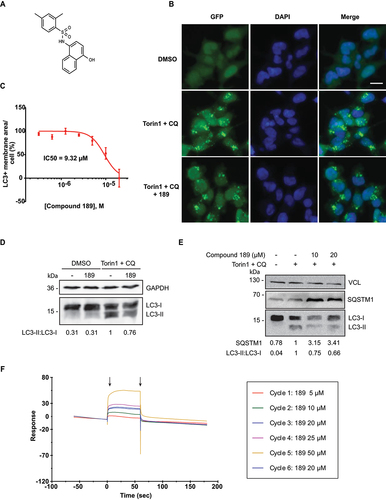
One of the compounds found to be active in cells was compound 189 (). The dose response curve measuring its inhibitory effects on GFP-LC3B-positive membrane area/cell yielded an IC50 value corresponding to 9.2 μM (). Western blot analysis provided an independent proof for the inhibitory effect of compound 189 on LC3B lipidation; incubation with compound 189 reduced the levels of lipidated LC3B (LC3B-II) relative to the unlipidated form (LC3B-I) upon induction of autophagosomes with torin1 and CQ (). In parallel, accumulation of the autophagy cargo receptor SQSTM1/p62 was enhanced by addition of compound 189 to torin1- and CQ-treated cells, as expected for an inhibitor of autophagy (). To prove direct binding of compound 189 to ATG12 protein, purified recombinant ATG12-Flag was prepared (Fig. S3) and used in surface plasmon resonance (SPR) in vitro binding assays, which showed a direct dose-dependent binding between compound 189 and ATG12-Flag; subsequent dissociation excluded covalent binding ().
Figure 4. Compound 189 reduces autophagy levels in cells. (A) Structure of compound 189. (B) Representative images of HEK 293A GFP-LC3B cells tested without and with 10 µM compound 189 for 24 h. Basal steady state levels of autophagy are observed in DMSO treated cells. 200 nM torin1 + 20 µM CQ were used to induce autophagy in the final 2 h of treatment. Scale bar: 20 µm. (C) Dose-response curve of compound 189 effect on autophagy. Cells were treated with the compound at serial dilutions in the range of 20–0.31 µM for 22 h, followed by 2 h treatment with torin1 + CQ. Data are presented in logarithmic scale as LC3+ membrane area/cell, mean ± SD, n = 3 independent biological repeats. (D and E) Western blots of HEK 293A cells treated with 10 µM compound 189 for 22 h, followed by 2 h of torin1 + CQ, and blotted with LC3B (D) or SQSTM1/p62 (E) antibodies, and GAPDH or VCL (vinculin) antibodies, as loading controls. (F) SPR plot of compound 189 binding to recombinant ATG12-Flag. Black arrows represent association (left) and dissociation (right) points. Cycle number represents the order of injection. The 20 µM sample concentration was injected twice to ensure consistency of association levels.
Validating compound activity in cell-based disease models
Compound 189 was tested in two independent cell-based disease models in which autophagy is involved: autophagy addicted cancer cell lines, and cytokine secretion by macrophages. Pancreatic cell lines established from pancreatic ductal adenocarcinoma (PDAC) tumors have high basal levels of autophagy, and have been shown to be highly dependent on autophagy for survival and growth [Citation9,Citation10]. The PANC1 PDAC cell line was therefore used to test the effect of compound 189 on basal autophagy levels over 4 days, compared to treatment with CQ, used as a nonspecific autophagy inhibitor. To prove selectivity, the results were compared with an independent cell line, NCI-H460 human lung cancer cells, whose growth does not depend on autophagy, as shown previously [Citation9,Citation10]. As expected, the basal levels of LC3B lipidation were high in the PANC1 cells, in contrast to the normal low basal levels in NCI-H460 cells (). The differential effects of compound 189 on the growth curves of these two cell lines were significant; compound 189 reduced the number of viable pancreatic cancer cells compared to untreated cells, similar to the CQ positive control. In contrast to untreated cells that continuously proliferated over the 4-day time-course, upon treatment with compound 189 (5 µM), cell growth plateaued between 2–4 days (). In contrast, treatment with either compound 189 or CQ had no effect on the growth of the non-autophagy addicted NCI-H460 cells. At the final day of the experiment (day 4), compound 189 reduced the growth of PANC1 cells by >50%, similar to CQ (). This effect could be generalized to additional cancer cell lines with RAS mutations; compound 189 had similar growth restrictive effects on endometrial adenocarcinoma HEC-1A cells and lung carcinoma NCI-H1299 cells [Citation10] (). These cell lines are also autophagy addicted, as seen by their sensitivity to established autophagy inhibitors () and the high levels of LC3B-II observed on western blot (). Notably, there was no evidence to suggest that compound 189ʹs effects on the autophagy addicted cancer cell lines were due to enhanced cell death, as CASP3 (caspase 3) activation, a common marker for apoptosis, was not observed on western blot (Figure S4A).
Figure 5. Compound 189 reduces autophagy levels and the growth of autophagy-addicted pancreatic cancer cells. (A) Western blot showing levels of lipidated and free LC3B in autophagy addicted PANC1, HEC-1A, and NCI-H1299 cells and control non-autophagy addicted NCI-H460 cells. VCL was used as a loading control. (B) PANC1 and NCI-H460 cell lines were treated with 5 µM compound 189, and viability was measured over the course of 4 day by CellTiter-Glo assay. CQ (10 µM) was used as a positive control for autophagy inhibition. Data represent the mean ± SD of 3 repetitions, normalized to day 0, time at which drug was added. Statistical significance was determined by two-way analysis of variance (ANOVA) with Tukey’s multiple comparisons test, **P < 0.01; ***P < 0.001. (C) Relative viability of PANC1, HEC-1A, NCI-H1299 and NCI-H460 cells after 4-day incubation with either DMSO, compound 189 (5 µM, PANC1, NCI-H460 or 10 µM, HEC-1A, NCI-H1299), CQ (10 µM, PANC1, NCI-H460, HEC-1). Note that since NCI-H1299 cells did not respond to CQ, ULK1 inhibitor (10 µM) was used instead as a control for an established autophagy inhibitor. Statistical significance was determined by ordinary one-way ANOVA with Tukey’s multiple comparisons test, **P < 0.01; ***P < 0.001; ****P < 0.0001. Data is presented as growth relative to DMSO treated cells, mean ± SD of n = 3 (PANC1, H460), n = 11 (HEC1A) or n = 6 (NCI-H1299) biological repeats. (D) RFP-GFP-LC3B PANC1 stable cells were treated with compound 189 (10 µM) and CQ (10 µM) for 24 h, followed by fixation and DAPI staining, and imaged by confocal microscopy. Scale bar: 10 µm. (E) Quantification of number of autophagosomes (yellow) and autolysosomes (red) per cell. The number of autolysosomes was calculated as the number of red dots minus the green dots (autophagosomes). Data was normalized to the number of autolysosomes in the DMSO-treated cells, mean ± SD, n = 3 independent biological repeats. Statistical significance was determined by two-way ANOVA with Sidak’s multiple comparisons test, *P < 0.05; ***P < 0.001.
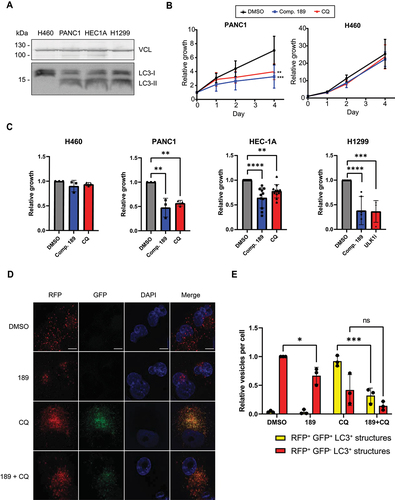
To test the inhibitory effects of compound 189 on autophagy flux in PDAC cells, a stable polyclonal population expressing the RFP-GFP-LC3B reporter was generated (). As expected, basal levels of autophagy in these cells were high; many autolysosomes (red-only puncta, the GFP signal is quenched by the low pH within the autolysosome) were observed in the absence of any treatment (). Compound 189 significantly reduced the number of autolysosomes. Treatment with CQ resulted, as expected, in a shift toward increased number of autophagosomes at the expense of autolysosomes, as autophagosomes failed to fuse with lysosomes. Combined treatment with compound 189, however, resulted in a strong reduction in the number of both autophagosomes and autolysosomes observed, with minimal change in their proportions, as expected from an inhibitor of the conjugation steps necessary for autophagosome formation. These findings suggest that compound 189 is effective in reducing the continuous growth of autophagy addicted tumor cells by suppressing the high basal levels of autophagy flux through inhibition of the ATG12-ATG3 interaction.
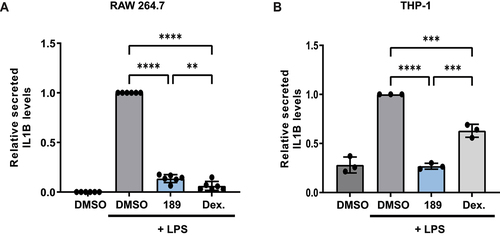
In order to examine the compound’s inhibitory effect on autophagy-dependent secretion, IL1B (interleukin 1 beta) secretion was measured in two LPS-treated macrophage-like cell lines, RAW 264.7 mouse cells and human acute monocytic leukemia THP-1 cells. Dexamethasone (an inhibitor of IL1B expression [Citation33,Citation34]) was used as a positive control in both systems. Addition of compound 189 to LPS treated RAW 264.7 cells reduced the secreted levels of IL1B by 86% (). Western blots showed reduced lipidated LC3B levels in compound 189 treated cells, confirming the inhibitory effect of compound 189 on autophagy (Figure S4B). Similarly, in LPS stimulated THP-1 cells that were pretreated with phorbol 12-myristate 13-acetate (PMA) to induce maturation to macrophage-like cells, compound 189 reduced the secreted IL1B levels by 73% (). These data suggest that compound 189 has the potential to inhibit the secretory arm of autophagy.
Figure 6. Compound 189 reduces IL1B secretion in LPS-treated macrophage-like cells. (A) RAW 264.7 cells were treated with LPS (1 μg/ml) combined with DMSO, compound 189 (10 μM), or dexamethasone (2 μg/ml) for 24 h, and levels of IL1B in the medium was measured by ELISA. Data represent mean ± SD of 6 biological repetitions, and was normalized to LPS-treated cells. Statistical significance was assessed using one-way ANOVA with Tukey’s multiple comparisons test, **P < 0.01; ****P < 0.0001. (B) THP-1 cells were treated with 0.5 μM PMA for 3 h followed by 0.5 μg/ml LPS combined with DMSO, compound 189 (10 μM), or dexamethasone (2 μg/ml) for 4 h and IL1B levels were assayed by ELISA as in A. Data represent mean ± SD of 3 biological repetitions, and was normalized to LPS-treated cells. Statistical significance was assessed using one-way ANOVA with Tukey’s multiple comparisons test, ***P < 0.001; ****P < 0.0001.
Discussion
The central role of autophagy in various human diseases has made it a valuable target for therapies. In some classes of diseases, including lysosomal storage disorders [Citation35], neurodegenerative diseases [Citation36] and aging [Citation37], enhancement of autophagy can be beneficial for treating patients, and indeed a variety of autophagy inducers have shown therapeutic benefits in mouse models [Citation35,Citation38]. In other diseases, such as advanced cancer and acute inflammation (including cytokine storm), inhibition of either the degradative or secretory arms of autophagy has the potential to reduce the progression of these diseases, either by stand-alone [Citation9,Citation20,Citation39] or combinatorial [Citation22,Citation40–42] treatments. The use of autophagy inhibitors has progressed to clinical trials of various phases [Citation22,Citation42,Citation43], however to date, no autophagy-selective drugs lacking off-target effects have been found in the clinical pipeline [Citation43–45]. As the field lacks, and definitely needs, potent and more specific autophagy inhibitors, the change in direction for drug discovery taken here, to yield high specificity and selectivity, is a significant advance in the field. Our strategy to develop specific and direct inhibitors of autophagy is based on three fundamental principles: (1) Targeting the core machinery of autophagy, which enables direct inhibition of the molecular pathways that drive the formation of the autophagosome, rather than upstream regulators that often have multiple functions and may even be bypassed. (2) Targeting protein-protein interaction within a pair of proteins that interact through an exclusive interface, thus significantly reducing the possibility of off-target effects, even if each protein has additional independent non-autophagy functions. (3) The crystal structure of the interaction interface between the two proteins depicts hot spots that are amenable for inhibition by small molecules. The choice of the ATG12-ATG3 interaction as a target for drug development integrates these three principles, as it is a part of the core machinery and is restricted to the autophagy pathway. The essentiality of this PPI to the autophagy pathway has been well established [Citation26,Citation27], and our computational analysis of the interaction surface together with previous mutational scanning confirmed the anchoring spots in the interface, which can be targeted by small molecules.
Notably, the development of the cell lysate mixing protocol provides a novel and efficient platform for high-throughput drug screening to identify PPI inhibitors based on the PCA system, with several advantages over co-transfections [Citation31] and measurements in live cells [Citation46]. The sensitivity of the PCA platform enables quantification of the interaction inhibition accurately and determination of compound IC50. The findings that only 3 out of 17 compounds were effective in the cell-based assays suggests that many of the compounds that passed the robust pipeline in the PCA cell lysates nevertheless failed to penetrate into cells, or are rapidly degraded in the cells and do not reach the ATG12-ATG3 complexes. Yet, for the compounds that did work in cells, high specificity toward autophagy is expected, due to the prior targeting of the ATG12-ATG3 complex, providing an advantage over compound screens based on autophagy inhibition in viable cells, in which the majority of hits are indirect and not relevant.
Overall, we have successfully established a sensitive and accurate high-throughput system for detection of PPI inhibitors using an established PPI detection system. By mixing lysates individually expressing each component, small molecules targeting the proteins could be introduced prior to their interaction, which resolved the competitive advantage of ATG3 binding to ATG12. This system was used to screen ~41,000 compounds from 6 different libraries, with three compounds passing the pipeline and showing inhibitory effects on autophagy in cells. Additional work with one of these compounds, compound 189, in two disease models, proved its potential clinical use. It impaired the growth of autophagy-addicted RAS-driven cancer cells, but not of the non-addicted lung cancer cells, providing the first proof-of-principle that this compound should be further studied for its potential anti-cancer effects. Inhibition of the secretory arm of autophagy led to the reduction of cytokine secretion from macrophages, the first indication that it may be used in acute inflammatory responses to reduce harmful cytokine secretion [Citation16,Citation17,Citation20].
Further development of compound 189 into a pharmaceutical drug will require structure activity relationship (SAR) studies and hit optimization to improve its efficacy to nM scale in cells. This will allow, after examining chemical absorption, distribution, metabolism, excretion, and toxicity (ADMET) properties, to test its effect in mouse disease models that involve the degradative and secretory arms of autophagy. Broadly, its discovery demonstrates that targeting PPIs in the core machinery of autophagy using the PCA platform is a promising strategy for the discovery of autophagy specific inhibitory compounds.
Materials and Methods
Computational anchoring spots mapping
The program ANCHORSmap [Citation28] was used to analyze the surface of a protein to detect cavities and sub-cavities that can accommodate the side chain of a single amino acid. It defined anchoring spot as a cavity on the surface of a protein plus a protruding residue from another protein that binds in this cavity. Thousands of amino-acid probes were scattered near the cavities and preferred binding locations were determined through iterative energy minimization and clustering. In the final step, the binding ΔG of the optimally posed probes was estimated using a semi-empirical scoring function that includes van-der-Waals, electrostatic and desolvation terms. Since the probes represent amino acids that are part of a protein, the electrostatic energy term was corrected for the dielectric shielding exerted by an approaching protein. Low ΔG (≤ −4 kcal/mol) anchoring spots correspond to experimentally detected hot spots.
DNA constructs
The PCA plasmids used in this study (ATG12-L1 WT, ATG3-L2, BCL2L1/BCL-XL-L1 and BAX-L2) were previously generated by our lab and described [Citation32]. Mutant ATG12-L1K54D was generated by restriction-free cloning using the KAPA HiFi HotStart ReadyMixPCR Kit (Kapa Biosystems, KK2601) according to the manufacturer’s protocol. The fused luciferase fragments include a linker sequence between the C-terminal end of the proteins (IDGGGGSGGGGSSG) and the following fragments:
GLuc1 (L1):
KPTENNEDFNIVAVASNFATTDLDADRGKLPGKKLPLEVLKEMEANARKAGCTRGCLICLSHIKCTPKMKKFIPGRCHTYEGDKESAQGGIG
GLuc2 (L2):
EAIVDIPEIPGFKDLEPMEQFIAQVDLCVDCTTGCLKGLANVQCSDLLKKWLPQRCATFASKIQGQVDKIKGAGGD
Cell culture
HEK 293 T cells (ATCC, CRL-3216), HEK 293A GFP-LC3 stable cell line (a kind gift from Sharon Tooze, The Francis Crick Institute, London, England [Citation47]), PANC-1 cells (ATCC, CRL-1469) and RAW 264.7 cells (ATCC, TIB-71) were grown in Dulbecco Modified Eagle Medium (DMEM; Biological Industries, 01–055-1A). NCI-H1299 cells (ATCC, CRL-5803) and NCI-H460 (ATCC, HTB-177) were grown in RPMI (Biological Industries, 01–104-1A), and HEC-1A (ATCC, HTB-112) in DMEM/F12 (Thermo Fisher Scientific-Gibco, 21,331–020) medium. THP-1 cells (ATCC, TIB-202) were grown in suspension in flasks in RPMI medium. All media were supplemented with 10% fetal bovine serum (Thermo Fisher Scientific-Gibco, 12,657–029), 1% penicillin-streptomycin (Biological Industries, 03–031-1B), 1% glutamine (Biological Industries, 03–020-1A). Cells were routinely monitored for mycoplasma contamination.
Cell lysate production
HEK 293 T cells grown on 15 cm plates (4.5x10⁶) were co-transfected with 30 μg Luc-fragments plasmids using calcium-phosphate transfection reagents [Citation48]. After 48 h, the cells were harvested and lysed in luciferase lysis buffer (25 mM Tris, pH 8.5 [Thermo Fisher Scientific, 77–86-1], 150 mM NaBr [Alfa Aesar, Thermo Fisher Scientific, 03644], 5 mM EDTA [Avantor, 8993–01], 0.1% NP40 [Sigma-Aldrich, I8896], 5% glycerol [Bio-Lab, 000712022300], 65 µM sodium oxalate [Thermo Fisher Scientific, AC207725000], 0.5 mM reduced glutathione [Thermo Fisher Scientific, AC120000050], 0.5 mM oxidized glutathione [Thermo Fisher Scientific, AC320220050]). The buffer was supplemented with 10 μl/ml 0.1 M PMSF (Sigma-Aldrich, 93,482) and 1% protease (Sigma-Aldrich, P8340) and phosphatase (Sigma-Aldrich, P0044) inhibitor cocktails. The lysates were filtered through 0.45 µM filter (Whatman™, 10,462,100) and stored at −80°C.
High-throughput PCA experiments
ATG12-L1 WT/K54D-containing lysate (5 µl) was injected to 384 well-plates pre-printed with compounds (10 µM final concentration) and incubated at 4°C for 1 h, followed by injection of ATG3-L2-containing lysate (5 µl) and incubation in 4°C for 24 h. Next, native coelenterazine (Prolume, 303–10), diluted 1:250 in luciferase assay buffer (25 mM Tris, pH 7.75, 1 mM EDTA, 0.5 mM reduced glutathione, 0.5 mM oxidized glutathione, 75 mM urea [MP Biomedicals, 821,527] and 2 mM sodium ascorbate [Alfa Aesar, Thermo Scientific Chemicals, A17759]), was injected to each well (10 μl) and luminescence signal (integrated over 10 seconds at gain 3000) was read using PHERAstar microplate luminometer (BMG labtech, Germany).
Western blot
Cells were lysed in luciferase lysis buffer, as described above. The buffer was supplemented with 10 μl/ml 0.1 M PMSF (Sigma-Aldrich, 93,482) and 1% protease (Sigma-Aldrich, P8340) and phosphatase inhibitor cocktails (Sigma-Aldrich, P0044). Proteins were separated by SDS-PAGE and transferred to PVDF membranes, which were incubated with antibodies to LC3B (Sigma, L7543; 1:1000), ATG12 (Cell Signaling Technology, 2010S; 1:1000), VCL (Sigma-Aldrich, V9131; 1:10,000), GAPDH (Merck, MAB374; 1:1000), SQSTM1/p62 (BD Transduction, 610,832; 1:1000), and CASP3 (Cell Signaling Technology, C-9664S; 1:500). Detection was done with either horseradish peroxidase (HRP)-conjugated goat anti-mouse (Jackson ImmunoResearch, 115–035-003) or anti-rabbit (Jackson ImmunoResearch, 111–165-144) secondary antibodies, followed by enhanced chemiluminescence using EZ-ECL (Biological Industries, 20–500). Protein levels were quantitated using Image Studio Lite software (LI-COR Biosciences) with normalization to loading control protein, as indicated in figures, within the linear range of detection.
Cloning, expression and purification of recombinant ATG12
The DNA fragment bearing N-terminal poly-His-tag, thioredoxin protein, TEV protease recognition site and ATG12_cFlag was prepared by PCR using T7 promoter primer and DH-316 reverse primer(5’-CCGGTACCCTTGGCAAAGCACCCCTTGTCGTCATCGTCTTTG-3’) from a pETHis Trx vector [Citation49] containing Atg-Flag as a template. The fragment digested by Nde I (New England BioLabs, R0111S) and Kpn I (New England BioLabs, R3142S) was ligated into appropriate sites of pTYB2 vector (New England BioLabs, N6702). Resulting recombinant expression vector pTYB-Trx-ATG12_cFlag DNA sequence was confirmed by sequencing.
One ShotTM BL21 StarTM (DE3) competent E. coli cells (ThermoFisher Scientific, C601003) were transformed by pTYB-Trx-ATG12_cFlag vector and incubated overnight at 37°C in LB medium with 100 μg/ml ampicillin (Sigma-Aldrich, A9518). The modified autoinduction medium ZYP-5052 [Citation50] was inoculated by LB culture and grown at 30°C under vigorous shaking to OD600 of 1. The temperature was then switched to 18°C, and cultures were grown overnight. The cells were harvested by centrifugation. Cell pellets were resuspended in lysis/wash buffer (300 mM NaCl [Thermo Fisher Scientific, 02–004-047], 50 mM Tris, pH 8, 0.5 mM Tris (2-carboxyethyl) phosphine hydrochloride (TCEP [Merck, C4706], 10% glycerol [Thermo Fisher Scientific, 02002936], 20 mM imidazole [Sigma-Aldrich, I2399]) and disrupted by French pressure cell press. The cell-free lysate was loaded onto a HisPurTM Ni-NTA resin (Thermo Scientific, 88,222), washed and recombinant protein was eluted with 300 mM imidazole in lysis/wash buffer. Dialysis against lysis/wash buffer together with cleavage by TEV protease was performed overnight at 4°C. Separated thioredixin was subsequently removed by reverse His-tag purification and the N-terminal cleavage of intein was induced by addition of 50 mM dithiothreitol (Sigma-Aldrich, D9779). Remaining dithiothreitol was removed by dialysis against 50 mM NaCl, 50 mM Tris, pH 8, 10% glycerol, 3 mM 2-mercaptoethanol (Invitrogen, 31,350–10) and ATG12 protein was isolated by ion exchange chromatography on HiTrapTM Q XL column (Cytiva, 17,515,901) using a linear gradient of NaCl. The protein was then subjected to final size exclusion chromatography using HiLoadTM SuperdexTM 75 pg column (Cytiva, 11,380,342).
Surface plasmon resonance experiments
For the surface plasmon resonance experiments, Biacore S200 (GE Healthcare, Sweden) was used. For the preparation of the ATG12-Flag immobilized sensor chip, purified ATG12-Flag in HEPES buffer (50 mM HEPES [Bio-Lab Ltd, 773,233,100], 50 mM NaCl, and 3 mM β-mercaptoethanol) was injected upon a Series S Sensor Chip CM5 (Cytiva, GE Healthcare, 14100530S). The running buffer contained 50 mM HEPES, 50 mM NaCl, 3 mM β-mercaptoethanol, and 5% DMSO (Sigma-Aldrich, D2650). Compound 189 was diluted in running buffer as indicated and injected over the immobilized ATG12-Flag sensor chip at 50 uL/min rate. Association was carried out for 1 min, and dissociation was measured at a flow rate of 50 μl/min at 25°C. No regeneration was required as the sensogram reached baseline after 1 min. The binding and dissociation of compound 189 to ATG12 was too fast to determine Kd. As 5% DMSO was included in the samples as well as the running buffer, solvent correction was used in order to eliminate bulk responses from solvent effects.
Cell viability assay
Cells were plated in sealed white 96-well plates (2000 cells/well). The next day, the cells were treated with compounds, CQ (Sigma-Aldrich, C6628) or ULK1 inhibitor (Sigma-Aldrich, SML1540) as indicated, and luminescence was measured at the indicated time points using the CellTiter-Glo® Luminescent Cell Viability Assay protocol (Promega, G7573).
ELISA
For cytokine secretion assay, 0.8 × 10⁶ RAW 264.7 cells were plated in 6 cm plates. The next day, LPS (Sigma-Aldrich, L2630) 1 µg/ml and compound 189 or Dexamethasone (Sigma-Aldrich, D4902) were added as indicated. 24 h later, the medium was collected and IL1B levels were measured using DuoSet® ELISA kit (R&D systems, DY401, DY008). Alternatively, 1.25 × 10⁴ THP-1 cells were incubated in media containing 0.5 μM PMA (Sigma-Aldrich, P8139) for 3 h. Cells were then collected and resuspended in media containing 0.5 µg/ml LPS with compound 189 or Dexamethasone for 4 h and IL1B levels were measured as above.
GFP-LC3B puncta assay
HEK 293A cells stably expressing GFP-LC3B were plated in 96-well plates (20,000 cells/well) pre-printed with tested compounds at final concentrations of 20–0.31 µM. After 20 h incubation, cells were treated with 250 nM torin1 (BioVision Incorporated, 2273) and 20 µM CQ for 2 h, followed by nuclear staining using Hoechst 33,342 (Thermo Fisher Scientific, H3570) and fixation with 4% paraformaldehyde (Bar Naor, BN15710). Cells were imaged by fluorescent microscopy, and analyzed with MetaXpress software (Molecular Devices). “Transfluor” algorithm was applied to identify Hoechst-labeled nuclei and GFP-LC3B puncta area/cell.
Autophagy flux assay in pancreatic cancer cells
PANC1 cells were transfected with RFP-GFP-LC3B expression vector (kind gift from Thomas Wollert, Institut Pasteur, Paris, France) and grown in puromycin (Sigma-Aldrich, P8833)-containing medium for two weeks, until stably expressing cells were established. The cells were plated in 6-well plates on coverslips (3X10⁵ cells/well), and were treated the next day with the indicated reagents. Twenty-four h later, cell nuclei were stained with DAPI (Sigma-Aldrich, D9542) and fixed with 4% paraformaldehyde. After imaging the cells by confocal microscopy, images were analyzed by Imaris software, measuring the number of autophagosomes (RFP+ GFP+) and autolysosomes (RFP+ GFP−) per cell.
Statistical methods
All statistical analyses were performed using Prism 9.3 software (GraphPad Software), as specified in the figure legends.
Supplemental Material
Download Zip (3.9 MB)Acknowledgments
We would like to thank Yehuda Matan Danino for critical assistance with the PANC1 RFP-GFP-LC3B imaging and analysis. We thank Dor Perets, Meital Yona and Tamar Unger for lysate productions. We would also like to thank Galit Cohen and Khriesto Shurrush for compound management and triage.
Disclosure statement
Yeda Research and Development, Ltd., the technology transfer arm of the Weizmann Institute, has submitted a patent application related to the results reported herein.
Supplementary Material
Supplemental data for this article can be accessed online at https://doi.org/10.1080/15548627.2023.2178159
Additional information
Funding
References
- Feng Y, He D, Yao Z, et al. The machinery of macroautophagy. Cell Res. 2014;24:24–41.
- Levine B, Kroemer G. Biological Functions of Autophagy Genes: a Disease Perspective. Cell. 2019;176:11–42.
- Yorimitsu T, Klionsky DJ. Autophagy: molecular machinery for self-eating. Cell Death Differ. 2005 Nov;12(Suppl 2):1542–1552.
- White E. Deconvoluting the context-dependent role for autophagy in cancer. Nat Rev Cancer. 2012;12:401–410.
- Kocaturk NM, Akkoc Y, Kig C, et al. Autophagy as a molecular target for cancer treatment. Eur J Pharm Sci. 2019 [2019 Jun 15];134:116–137.
- Russell RC, Guan KL. The multifaceted role of autophagy in cancer. EMBO J. 2022 Jul 4;41(13):e110031.
- Degenhardt K, Mathew R, Beaudoin B, et al. Autophagy promotes tumor cell survival and restricts necrosis, inflammation, and tumorigenesis. Cancer Cell. 2006;10:51–64.
- Hu YL, DeLay M, Jahangiri A, et al. Hypoxia-induced autophagy promotes tumor cell survival and adaptation to antiangiogenic treatment in glioblastoma. Cancer Res. 2012;72:1773–1783.
- Yang S, Wang X, Contino G, et al. Pancreatic cancers require autophagy for tumor growth. Genes Dev. 2011;25:717–729.
- Guo JY, Chen HY, Mathew R, et al. Activated Ras requires autophagy to maintain oxidative metabolism and tumorigenesis. Genes Dev. 2011;25:460–470.
- Bryant KL, Stalnecker CA, Zeitouni D, et al. Combination of ERK and autophagy inhibition as a treatment approach for pancreatic cancer. Nat Med. 2019;25:628–640.
- Kinsey CG, Camolotto SA, Boespflug AM, et al. Protective autophagy elicited by RAF→MEK→ERK inhibition suggests a treatment strategy for RAS-driven cancers. Nat Med. 2019;25:620–627.
- Amaravadi R, Kimmelman AC, White E. Recent insights into the function of autophagy in cancer. Genes Dev. 2016 Sep 1;30(17):1913–1930.
- Singh SS, Vats S, Chia AY-Q, et al. Dual role of autophagy in hallmarks of cancer. Oncogene. 2018;37:1142–1158.
- Cavalli G, Cenci S. Autophagy and Protein Secretion. J Mol Biol. 2020;432:2525–2545.
- Claude-Taupin A, Jia J, Mudd M, et al. Autophagy’s secret life: secretion instead of degradation. Essays Biochem. 2017;61:637–647.
- New J, Thomas SM. Autophagy-dependent secretion: mechanism, factors secreted, and disease implications. Autophagy. 2019;15:1682–1693.
- Duran JM, Anjard C, Stefan C, et al. Unconventional secretion of Acb1 is mediated by autophagosomes. J Cell Biol. 2010;188:527–536.
- Thorburn J, Horita H, Redzic J, et al. Autophagy regulates selective HMGB1 release in tumor cells that are destined to die. Cell Death Differ. 2009;16:175–183.
- Lu LH, Chao CH, Yeh TM. Inhibition of autophagy protects against sepsis by concurrently attenuating the cytokine storm and vascular leakage. J Infection. 2019;78:178–186.
- Xu Y, Jagannath C, Liu XD, et al. Toll-like Receptor 4 Is a Sensor for Autophagy Associated with Innate Immunity. Immunity. 2007;27:135–144.
- Sui X, Chen R, Wang Z, et al. Autophagy and chemotherapy resistance: a promising therapeutic target for cancer treatment. Cell Death Dis. 2013;4:1–12.
- Egan DF, Chun MGH, Vamos M, et al. Small Molecule Inhibition of the Autophagy Kinase ULK1 and Identification of ULK1 Substrates. Mol Cell. 2015;59:285–297.
- Pasquier B, El-ahmad Y, Filoche-romme B, et al. Discovery of (2S)‑8-[(3R)‑3-Methylmorpholin-4-yl]-1-(3-methyl-2- oxobutyl)-2-(trifluoromethyl)-3,4-dihydro‑2H‑ pyrimido[1,2‑a]pyrimidin-6-one: a Novel Potent and Selective Inhibitor of Vps34 for the Treatment of Solid Tumors. J Med Chem. 2015;58(1):376–400.
- Hanada T, Noda NN, Satomi Y, et al. The Atg12-Atg5 conjugate has a novel E3-like activity for protein lipidation in autophagy. J Biol Chem. 2007;282:37298–37302.
- Metlagel Z, Otomo C, Takaesu G, et al. Structural basis of ATG3 recognition by the autophagic ubiquitin-like protein ATG12. Proc Natl Acad Sci USA. 2013;110:18844–18849.
- Otomo C, Metlagel Z, Takaesu G, et al. Structure of the human ATG12~ATG5 conjugate required for LC3 lipidation in autophagy. Nat Struct Mol Biol. 2013;20:59–66.
- Ben-Shimon A, Eisenstein M. Computational Mapping of Anchoring Spots on Protein Surfaces. J Mol Biol. 2010;402:259–277.
- Rajamani D, Thiel S, Vajda S, et al. Anchor residues in protein-protein interactions. Proc Natl Acad Sci USA. 2004;101:11287–11292.
- Radoshevich L, Murrow L, Chen N, et al. ATG12 conjugation to ATG3 regulates mitochondrial homeostasis and cell death. Cell. 2010;142(4):590–600.
- Remy I, Michnick SW. A highly sensitive protein-protein interaction assay based on Gaussia luciferase. Nat Methods. 2006 Dec;3(12):977–979.
- Gilad Y, Shiloh R, Ber Y, et al. Discovering protein-protein interactions within the programmed cell death network using a protein-fragment complementation screen. Cell Rep. 2014;8:909–921.
- Gewert K, Svensson U, Andersson K, et al. Dexamethasone differentially regulates cytokine transcription and translation in macrophages responding to bacteria or okadaic acid. Cell Signal. 1999;11:665–670.
- Jeon YJ, Han SH, Lee YW, et al. Dexamethasone inhibits IL-1β gene expression in LPS-stimulated RAW 264.7 cells by blocking NF-κB/Rel and AP-1 activation. Immunopharmacology. 2000;48:173–183.
- Palhegyi AM, Seranova E, Dimova S, et al. Biomedical Implications of Autophagy in Macromolecule Storage Disorders. Front Cell Dev Biol. 2019;7:1–17.
- Nixon RA. The role of autophagy in neurodegenerative disease. Nat Med. 2013;19:983–997.
- Rubinsztein DC, Mariño G, Kroemer G. Autophagy and aging. Cell. 2011;146:682–695.
- Nah J, Yuan J, Jung Y-K. Autophagy in Neurodegenerative Diseases: from Mechanism to Therapeutic Approach. Mol Cells. 2015;38:381–389.
- Yang A, Herter-Sprie G, Zhang H, et al. Autophagy sustains pancreatic cancer growth through both cell-autonomous and nonautonomous mechanisms. Cancer Discov. 2018;8:276–287.
- Dekel-Bird NP, Bialik S, Itzhaki O, et al. A functional pre-screening platform for identifying points of vulnerability in the cell death map of human melanoma tumors. J Cancer Sci Clin Therap. 2022;6:39–60.
- Mulcahy Levy JM, Zahedi S, Griesinger AM, et al. Autophagy inhibition overcomes multiple mechanisms of resistance to BRAF inhibition in brain tumors. Elife. 2017 Jan 17;6:1–24.
- Levy JMM, Towers CG, Thorburn A. Targeting autophagy in cancer. Nat Rev Cancer. 2017;17:528–542.
- Y-p Y, L-f H, H-f Z, et al. Application and interpretation of current autophagy inhibitors and activators. Acta Pharmacol Sin. 2013;34:625–635.
- Kocak M, Ezazi Erdi S, Jorba G, et al. Targeting autophagy in disease: established and new strategies. Autophagy. 2021;00:1–23.
- Pasquier B. Autophagy inhibitors. Cell Mol Life Sci. 2016;73:985–1001.
- Michnick SW, Ear PH, Manderson EN, et al. Universal strategies in research and drug discovery based on protein-fragment complementation assays. Nat Rev Drug Discov. 2007;6:569–582.
- McKnight NC, Jefferies HBJ, Alemu EA, et al. Genome-wide siRNA screen reveals amino acid starvation-induced autophagy requires SCOC and WAC. EMBO J. 2012;31:1931–1946.
- Kingston RE, Chen CA, Rose JK. Calcium phosphate transfection. Curr Protoc Mol Biol. 2003;Chapter 9:91
- Peleg Y, Unger T. Resolving bottlenecks for recombinant protein expression in E. coli. Zanders Eeditor Chemical Genomics and Proteomics. Methods in Molecular BiologyVol. 800. 2011 oct 04 ed: Humana Press; 2012. 173–186
- Studier FW. Protein production by auto-induction in high density shaking cultures. Protein Expr Purif. 2005 May;41(1):207–234.