
Abstract
Shared electric mobility hubs, or eHUBs, offer users access to a range of shared electric vehicles on demand. However, little is currently known about what the characteristics of potential users of this novel type of shared mobility are. This makes it difficult to plan the location of hubs and to provide facilities, which ultimately will determine their success. This paper therefore seeks to identify potential users based on an in-depth case study of a representative sample of the Municipality of Amsterdam population. The analysis employed an attitudinal market segmentation approach supported by the Theory of Diffusion of Innovations (DOI). The analysis identified four specific target groups, each with a different propensity to use eHUBs in the future. In our sample, two groups expressed an interest in using eHUBs. The first group consists of highly educated and non-car owning young adults (19% of the sample), whereas the second group shows a higher level of car ownership and a greater number of households with children (69% of the sample). The two remaining groups comprise the majority of laggards (52%), despite only representing 12% of the sample. They tend to be older, less educated, and live in a household without children. The four groups are further distinguished based on their current shared mobility use, traveler identity, and perceived barriers to using shared electric vehicles. Finally, general recommendations to practitioners and policymakers to increase the uptake of shared mobility, including paying attention to the availability, cost, and convenience of shared mobility options, are provided.
1. Introduction
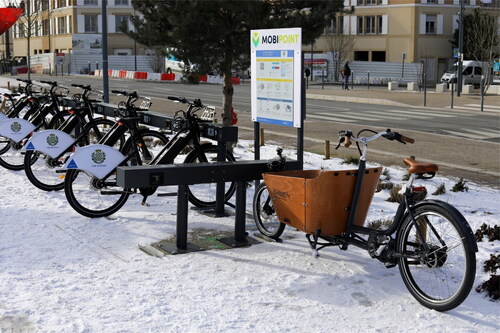
Shared electric mobility hubs or ‘eHUBs’ refer to a location where several shared electric vehicle types—including e-scooters, e-bikes, e-cargobikes and e-cars—are made available to the public on an ‘as-needed’ basis (Shaheen et al., Citation2016). eHUBs are increasingly deployed in cities worldwide, challenging urban planners and policymakers to adapt to and manage the potential impact of this rapidly spreading form of urban mobility (Anderson-Hall et al., Citation2019; Gössling, Citation2020). Note that, to be considered a hub according to our definition, eHUBs should contain at least two of the modes mentioned above (see for an example).
Figure 1. eHUB with shared electric bicycles and an e-cargobike next to an information panel. Image provided by the courtesy of the City of Dreux, France, partner of the eHUBs project. Source: Ville de Dreux—Photo: Jean Cardoso. Reprinted with permission.
Typically, shared vehicles are accessed by multiple users daily and rented on a pay-per-use basis (Le Vine & Polak, Citation2015). If placed in strategic locations, eHUBs can offer users a bandwidth of modes to suit their mobility needs in most everyday situations. That is, by embracing several types of shared electric mobility in one location, eHUBs are tailored to meet the demand of various trip characteristics, offering a means to increase the connectivity among modes and to facilitate first- and last-mile connections (Anderson et al., Citation2017; Eliot et al., Citation2020).
While shared mobility provision may not solve all transportation problems in urban areas, it offers several opportunities. First, shared mobility may reduce both congestion and pollution through fewer vehicles on the road (Machado et al., Citation2018). The emission and car use reduction potential is amplified if the provided shared vehicles are electric and, in the future, automated as well (Carteni et al., Citation2020; Manders et al., Citation2020; Reyes García et al., Citation2019; Vasconcelos et al., Citation2017). Simulations by Ciari and Becker (Citation2017) suggest that a combination of shared e-bikes and e-cars could reasonably replace the majority of short trips (<5 km) currently made by private car, although e-bikes begin to lose their edge over private cars for medium distances (5–10 km). Second, shared mobility may facilitate the first and last mile access to public transport, such as bus or train stations, thereby increasing the catchment area of public transport (Shaheen & Chan, Citation2016). That is, people may use shared vehicles for access and egress trips, thus reducing the reliance on private motorized transport and making travel more sustainable. Third, shared mobility may also promote social equity if the provision is extended to socially disadvantaged low-income groups, therefore increasing the fairness and quality of life in cities (Fleming, Citation2018; Kodransky & Lewenstein, Citation2014). Fourth, shared mobility options may produce significant health benefits, especially when replacing trips previously made by private car (Otero et al., Citation2018), although health and safety concerns also should be considered (Milakis et al., Citation2020; Yang et al., Citation2020).
In general, eHUBs are intended to be flexible and may vary in both the number and types of shared vehicles available. In terms of location, eHUBs may be placed wherever sufficient demand is foreseen. This could be, for instance, in neighborhoods, near important public transport interchanges, such as bus or train stations, or near major retail outlets, employment centers or tourist attractions, thus facilitating access and egress for single or multi-modal trips (Shaheen & Chan, Citation2016). Of course, the more people who use shared electric vehicles to replace trips previously made by private motorized transport, the greater the environmental and congestion-related benefits are likely to be. Claasen (Citation2020) estimated that in areas with high parking pressure, the introduction of shared mobility hubs could lead to a reduction of 11–15% in household car ownership.
Representing a novel type of shared mobility service, a key question of interest is ‘Who is going to use eHUBs?’. Burghard and Dütschke (Citation2019) showed that individuals’ willingness to use shared mobility depends on the perceived compatibility with their mobility needs as well as prevailing social norms. Furthermore, previous work suggests that those most inclined to use shared mobility services are likely to include environmentally concerned, technology-affine and multimodal travelers (Alonso-González et al., Citation2020; Hinkeldein et al., Citation2015). However, previous studies tend to focus on the use of a single shared mobility mode (e.g., e-bike or e-car sharing) whereas, with eHUBs, the objective is to provide a more diverse range of modes, such as the addition of e-cargobikes and/or e-scooters to the vehicle mix. Indeed, there appears to be a lack of representative market segmentations concerning the potential users of eHUBs, as opposed to studies focusing on particular modes (Burghard & Dütschke, Citation2019; Eccarius & Lu, Citation2020; Nikiforiadis et al., Citation2019) or other types of shared mobility services (Alonso-González et al., Citation2020; Hinkeldein et al., Citation2015; Hoerler & Hoppe, Citation2019; Lavieri & Bhat, Citation2019).
One notable exception is the work of Claasen (Citation2020), who investigated the potential effects of mobility hubs in the Netherlands via a Stated Choice experiment. According to Claasen (Citation2020), people with a positive attitude toward shared cars and sustainable transport modes express a greater interest in the use of mobility hubs, whereas those already owning a car and older residents are less interested. Among the modes available, people showed a preference for shared cars, raising concerns about the added value of mobility hubs vis-á-vis conventional car sharing schemes. Moreover, Claasen (Citation2020) identified the proximity and cost of using mobility hubs as the most influential factors in the decision to relinquish a car. To expand upon these early findings, the current paper presents a representative attitudinal market segmentation to identify the early adopters of eHUBs, taking into consideration not only respondents’ demographic profile, current travel behavior (including shared mobility use), and perceived barriers, but also their self-reported traveler identity and shared mobility attitudes.
The remainder of the paper is structured as follows: Sec. 1.1 provides an outline of the chosen theoretical and methodological approach—attitudinal market segmentation—and briefly describes how elements of Everett Rogers’ Diffusion of Innovations (DOI) Theory and the Theory of Planned Behavior were integrated into the research to identify potential early adopters of eHUBs. This is followed by information about the online questionnaire used in our study (Sec. 2.1), the recruited participant sample (Sec. 2.2), and data analysis procedures (Sec. 2.3). Subsequently, a stepwise presentation of the key research findings is given in Sec. 3. The latter includes a detailed description of the personal characteristics and perceived barriers of the identified population segments with varying levels of interest in using eHUBs. The paper concludes with a synthesis of the findings in the Discussion section (Sec. 4), drawing general conclusions, highlighting limitations and recommendations, as well as proposing avenues for future research.
1.1. Theoretical framework
In the research reported in this paper, the potential user groups of a novel type of shared mobility service—that is, eHUBs facilities—are identified using an attitudinal market segmentation approach administered via an online survey.
Hence, the objective in the current study is to divide the population into segments based on people’s attitudes, measured using Likert-scale items, toward relevant topics such as car use, the environment, and shared mobility. Population segments are subsequently assigned to one of four adopter categories, using DOI theory as a heuristic, so as to broadly classify respondents as either early or late majority adopters. This is achieved by combining and ranking respondents’ intention scores to use e-bikes and e-cars, as further explained in Sec. 3.3. Finally, extracted clusters are compared based on their demographic profile, general travel behavior, and traveler identity (i.e., whether an individual identifies as a cyclist, driver, walker, public transport, or multi-modal user).
In addition to identifying likely eHUBs users, evidence is also presented to show to what extent shared vehicles, as provided by eHUBs, may serve to replace respondents’ current regular commute or food shopping trips. This also includes the possibility of eHUBs replacing trips already being made by sustainable (i.e., non-car) modes. Moreover, the perceived barriers to shared mobility use are investigated (Sec. 3.4) and some tentative recommendations are made as to how the latter may be overcome (Sec. 4.1). Below, each building block of the conceptual model is introduced separately.
1.1.1. Attitudinal market segmentation
As suggested by Hinkeldein et al. (Citation2015), attitude-based market segmentation is recommended for the successful implementation of integrated shared e-mobility services. Identifying potential user groups at an earlier stage allows cities and practitioners to tailor their marketing efforts to specific target groups. Additionally, segmenting the population provides insight into the current mobility patterns of potential target groups and thus what trips are most likely to be made or replaced by using shared (electric) vehicles. In this way, local authorities and the commercial sector can maximize their return on investments. Attitudinal market segmentation is also useful for the identification of perceived barriers to the uptake of mobility hubs. While various perceived barriers to shared mobility uptake have been identified (Alonso-González et al., Citation2020; Pimentel & Lowry, Citation2020), people’s perceived barriers to the use of eHUBs remain relatively unexplored (see Claasen, Citation2020, for an exception). Identifying such barriers is particularly informative for cities and policymakers who want to deploy, or stimulate the use of, such hubs.
1.1.2. Diffusion of innovations (DOI) theory
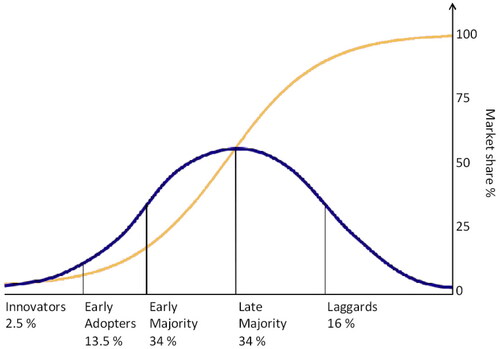
Everett Rogers’ Diffusion of Innovations (DOI) theory (1995) explains the diffusion process of an innovation (e.g., a new product or service; here: eHUBs) through the general population. According to the theory, the diffusion of an innovation usually occurs gradually, where some parts of the population will adopt the innovation early on (i.e., innovators, early adopters, and early majority) and others only when it has become the new norm (i.e., late majority and laggards. The characteristics between these adopter types generally differ and different messages may be required to stimulate the adoption of the innovation in each group. In the final stage of the diffusion process, the innovation has been fully adopted by the entire population see ).
Figure 2. Adopter categories according to DOI theory (Rogers, Citation1995). “Diffusion of innovations” by marcoderksen is licensed under CC by-NC 2.0.
The theory further posits that the adoption decision is driven by a combination of people’s individual characteristics (e.g., people’s knowledge, socio-economic characteristics, or personality) as well as five perceived characteristics of the innovation, leading to either adoption or rejection of the innovation. The perceived characteristics include:
the perceived Relative Advantage (RA) that the innovation provides over the product or service it replaces; the perceived Compatibility (CO) with the users’ values, needs and characteristics; the perceived Complexity (CX) of the innovation (i.e., whether the innovation is easy to use and/or understand); Trialability (TR) of the innovation (i.e., whether potential adopters have the opportunity to experiment with or test the innovation before making the decision to adopt or not); and lastly, Observability (OB) or the extent to which the innovation produces tangible results
According to the theory of DOI, it follows that users are likely to adopt an innovation early when they believe in the relative advantage of the innovation, its compatibility with their needs and its ease of use. The rate of adoption is further increased if the innovation can be tested by individuals and generates a visible positive impact.
The three major take-aways from Rogers's adoption curve are (a) it is a wasted effort to try convincing laggards to change, as they will not (at least in the short to medium term), (b) one should focus on finding the innovators and the early adopters and make common cause with them, and (c) the early majority will bring along the fence-sitters (i.e., those who are hesitant or unsure about adopting the innovation or not), and hence the early majority of adopters is the group that will require the most attention (Maloney & Kim, Citation2019).
In this study, the application of DOI theory was twofold. First, elements of the theory were integrated into our research by combining the DOI factors which are likely to influence the uptake of eHUBs within a series of corresponding attitude statements (see Sec. 3.1). Moreover, to help distinguish between potential early (i.e., innovators, early adopters, and early majority) and late (i.e., late majority and laggards) adopters of eHUBs, respondents’ adoption intention scores were used in conjunction with Rogers’ curve (see Sec. 3.3).
1.1.3. Theory of planned behaviour
The theory of Planned Behavior (TPB) (Ajzen, Citation1991) is a commonly used theoretical framework which posits that the behavioral intention to enact a specific behavior is determined by three interrelated factors: attitudes (i.e., either positively or negatively valanced behavioral beliefs regarding the target behavior), subjective norms (i.e., whether others, whose opinion one values, approve or disapprove of the target behavior), and perceived behavioral control (i.e., possessing the ability or capacity to enact the target behavior). Amongst its wide applications in the domain of travel behavior (Donald et al., Citation2014; Liu et al., Citation2017; Jing et al., Citation2019), the theory has also been applied in the context of shared mobility (Li et al., Citation2021; Mattia et al., Citation2019; Si et al., Citation2020; Yu et al., Citation2018). While not being used in a latent variable model (e.g., Li et al., Citation2021; Si et al., Citation2020), various TPB-based attitudinal statements capturing attitudes, subjective norm, and perceived behavioral control, were generated in concordance with previous literature.
2. Method
The methodological approach of our research is described in this section, including a description of the questionnaire, participant sample, and applied analytical methods.
2.1. Setting up the online questionnaire
An online questionnaire was created to introduce the concept of eHUBs and to measure respondents’ attitudes, demographics, general travel behavior and traveler identity, and current use of shared vehicles. Respondents also were asked to indicate their intention to use eHUBs in the future and to identify any perceived barriers related to the uptake of eHUBs, as further described below. To introduce survey respondents to the concept of eHUBs, the following illustration was used.Footnote1
Survey measures for the purpose of clustering respondents, and the subsequent comparison of clusters, are outlined below.
2.1.1. For the purpose of clustering respondents
Attitudes—Based on a review of previous literature, a total of 20 statements were created to reflect attitudes toward car use, the environment, and shared mobility, all of which may have a potential impact on an individual’s intention to adopt novel shared mobility services (Hinkeldein et al., Citation2015). Several items were derived based on Everett Rogers’ DOI Theory (1995) to measure people’s attitudes toward the innovation (in this study: the potential use of eHUBs), which may influence uptake. The remaining attitudinal items were based on Ajzen’s Theory of Planned Behavior (TPB; Ajzen, Citation1991), inspired by applications of the theory in previous shared mobility research (Li et al., Citation2021; Mattia et al., Citation2019; Si et al., Citation2020; Yu et al., Citation2018), measuring people’s intention to adopt eHUBs, perceived behavioral control and subjective (or social) norms. Attitudes were measured using ordinal Likert-scale type items (1—Strongly disagree to 7—Strongly agree) and are listed in in the Appendix along with descriptive statistics (means and SDs).
2.1.2. For the purpose of comparing clusters
Intentions—Respondents’ general intention to use eHUB facilities was measured using two items asking respondents to indicate “How likely would you be to use an e-bike (or e-car) from an eHUB in the future if it were available in your city?” These items were rated on continuous slider scales ranging from 0—Extremely unlikely to 100—Extremely likely. Based on their combined intention scores (i.e., e-bike + e-car intention), respondents were classified as either early or late adopters according to DOI theory (Sec. 3.3).
Simplified Stated Preferences (SP)—In addition to measuring respondents’ intentions to use shared electric vehicles from an eHUB, they were asked whether they would use e-bikes, e-cargobikes or e-cars as part of a specific trip purpose (i.e., either their regular commute [RT] or food shopping [FS] trip) with for ‘none/a few/many/most or all trips of this purpose’ as possible answer choices (also see in the Appendix). Please note that, although eHUBs are intended to offer a broad choice of shared vehicles, we did not consider the use of e-scooters, as the latter were not allowed on public roads in the Netherlands at the time of the study and besides, e-scooters have a questionable environmental impact (Hollingsworth et al., Citation2019).
Identity—Respondents were asked to indicate whether they identified themselves as one of the following transport users: “Please complete the following phrase by selecting the option you most strongly identify with: I consider myself a … Car driver, Cyclist, Pedestrian, Public transport user or Multi-modal user (not bound to any single mode of transport).” Transport identities have been shown to be associated with both stated intentions and self-reported travel behavior (Heinen, Citation2016).
Shared mobility use—Respondents were asked to report whether they use any publicly shared vehicles (i.e., “Do you use any publicly shared vehicles on a regular basis?”) including shared bicycles, shared cars, e-scooters, or other shared options.
Barriers to shared mobility use—If respondents indicated that they were not currently using any shared vehicles (i.e., “I don't use any shared vehicles” was selected), they were asked to identify any barriers that prevented them from doing so on a list of suggested barriers (see Sec. 3.4). Alternatively, respondents could select ‘Other’ and type their own barriers into a comment box.
Socio-demographic variables—Clusters were also compared based on various sociodemographic variables including age, gender, household composition (i.e., number of adults and children living in the household), income and education level, as well as variables describing the availability of household vehicles, possession of a driver’s license and regular (commute) trip satisfaction (see Sec. 3.2).
2.2. Selection of a representative sample
The City of Amsterdam has been chosen as a case study city due to its ongoing commitment to implementing shared mobility hubs on a broad scale, given its active mobility friendly environment, and its experience with shared mobility options.
A representative sample, in terms of age groups, was obtained from the adult-population of the Municipality of Amsterdam through a polling agency between 30th March and 8th April Claasen (Citation2020), to capture, proportionately for all age groups, attitudes toward novel shared mobility services (here: eHUBs). With the data having been collected during the first COVID-19 related lockdown in the Netherlands (from March 15, Citation2020, onwards), the wording in the survey explicitly stated for respondents to focus on their regular or past (i.e., pre-COVID) rather than current travel behavior.
To further ensure that the reported trip making was not substantially different from pre-COVID levels, survey responses were compared to a recent ranking of European cities in sustainable transport (Kodukula et al., Citation2018). As there was no main mode variable in the current study, respondents’ frequency of use of four major travel modes (i.e., Private motorized transport, Walking, Cycling, and Public transport) was used for comparison. Hereby, the usage of a particular mode of transport on at least 3 days per week (N = 749) was considered as representing respondents’ main mode (see ). In this way, it was possible to establish that were no notable differences in modal shares between the study sample and pre-COVID levels (i.e., Private motorized: 20% vs. 20%; Walking: 32% vs. 31%; Cycling: 28% vs. 32%; Public transport: 20% vs. 17%).
shows the population size and proportion for each age group, as well as statistics for the targeted and achieved study sample. Within each age group, a balanced representation of genders was targeted. While the achieved sample closely matched the population statistics proportionally, the oldest age group (75 or older) suffered from a low response rate and was thus merged with the second oldest age group for analysis purposes, leaving six age groups in total.
Table 1. Targeted and achieved number of completed surveys per age group representative of the Municipality of Amsterdam adult population.
While largely representative in terms of age, some deviations of the study sample from the general population should be noted. In terms of gender, female respondents were slightly underrepresented compared to the general population (42% vs. 50%; CBS, Citation2021) and 25 respondents (5% of the sample) did not indicate their gender. Compared to the general population, one-person households, on the other hand, were overrepresented (38% vs. 18%; CBS, Citation2021), as were those with tertiary (i.e., university level) education (55% vs. 29%; Dutch Census, Citation2011). The proportion of those who are economically active was comparable to national population levels (61% vs. 53%; Dutch Census, Citation2011). Further information on respondents’ background characteristics can be found in in the Appendix.
2.3. Data analysis
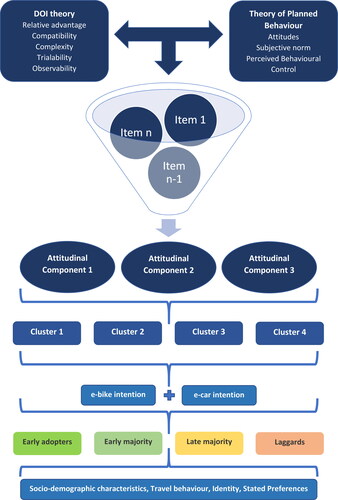
Potential eHUBs user groups were identified based on the 20 attitude statements using a combination of variable reduction and clustering techniques, a common procedure for attitudinal market segmentation approaches (Alonso-González et al., Citation2020; Hinkeldein et al., Citation2015). In particular, attitudinal statements were analyzed using Categorical Principal Components Analysis (CATPCA) and subsequently subjected to a two-step clustering process. Once identified, clusters were compared based on demographic characteristics and other variables of interest, such as current shared mobility use and perceived barriers. Finally, respondents were assigned to one of four adopter categories based on DOI theory, using their stated intentions to use e-bikes and e-cars, respectively. The categorization of respondents into adopter categories is further explained in Sec. 3.3. The methodological approach of the present study is summarized in .
Figure 3. Methodological framework of the present study.
2.3.1. Categorical principal component analysis (CATPCA)
To facilitate the clustering process, the 20 attitudinal statements were factor analyzed. Here, CATPCA with Varimax rotation was chosen for the factoring of data because, despite equidistance often being assumed between the different levels of Likert-scales, other dimension reduction techniques (e.g., EFA or PCA) are not appropriate for the use with ordinal data (see Linting et al., Citation2007). As in ordinary PCA, each individual case receives a score on each of the extracted components, called factor or ‘object’ scores. The latter are standardized to reflect a z-score, placing each variable in a plane of multivariate variability (Atchley, Citation2007). In our analysis, the normalized object scores were saved for use in the subsequent cluster analysis (see also Ketchen & Shook, Citation1996).
2.3.2. Cluster analysis
The objective of cluster analysis is to classify respondents into independent homogeneous groups based on key variables of interest (here: respondents’ attitudinal component object scores). As the resulting groups are homogeneous, respondents within a cluster share similar attitudes but differ, usually to the greatest extent possible, from all other clusters based on the measured variables. Using an inductive approach (Ketchen & Shook, Citation1996), and following the recommended procedure by Punj and Stewart (Citation1983), a combination of hierarchical and iterative clustering algorithms was applied.
As there was no theoretical basis to specify a particular number of clusters a priori, initially, hierarchical clustering of the data, based on the respondents’ object scores, was conducted. In particular, Ward’s method (1963) was chosen as the clustering algorithm, with squared Euclidean distance being set as the dissimilarity measure, to estimate the potential number of clusters. Through successive iterations, Ward’s method computes solutions for a specified range of clusters—in this study, 2 to 10—and a dendrogram was used, in addition to the agglomeration table, to identify the range of clusters where the optimization begins to stabilize. While Ward’s method is susceptible to outliers, it generally outperforms other hierarchical clustering algorithms in achieving a balanced set of clusters (Punj & Stewart, Citation1983).
Once a potential range of clusters had been established, the iterative k-means clustering procedure was applied to the successive numbers of clusters in the range informed by Ward’s method. In k-means, cluster centroids (based on the means of the input variables) are initially chosen at random and individual observations are assigned to their nearest centroid (Faber, Citation1994). However, the initial assignment is usually not optimal and, later in the assignment procedure, observations may need to be reassigned to a different cluster to meet the criteria to minimize the objective function—that is, the sum of squares distance of each observation to its assigned cluster center is minimized. Whenever an observation is reassigned to a different cluster, the cluster centroids are recalculated, starting a new iteration. The algorithm stops once all observations have been assigned to their nearest cluster centroid.
As k-means requires the number of clusters to be determined in advance, because there is no objective method of determining the optimal number of clusters within the method, it is useful to use hierarchical cluster analysis to initially define a range. By comparing outputs for the range of clusters, the best fitting solution can be identified. To cross-validate the final cluster solution, the analysis was repeated with an independent sample from Manchester (UK, N = 404) and compared to the Amsterdam data.
3. Results
3.1. Categorical principal components analysis (CATPCA)
shows the 20 attitudinal statements entered into CATPCA. These statements included both DOI as well as TPB constructs, as indicated in the second column of the table.
Table 2. Rotated categorical component (CC) loadings (factor loadings less than .40 hidden).
As CATPCA requires the number of components to be extracted to be determined a priori, three, four and five component solutions were explored. While the four and five factor solutions increased the amount of explained variance (R2 = 0.63 and R2 = 0.67, respectively), the reliability of any additional components fell below acceptable levels of reliability (i.e., α < 0.70). Consequently, three components were extracted, explaining a reasonable amount of the variance in attitude statements (R2 = 0.58), and showing good reliability (see ), with Cronbach α values ranging from 0.83 to 0.88 (Cortina, Citation1993). One statement (#13) showed a factor loading higher than 0.40 on two components. Omitting the statement, however, did not increase the reliability of components and, therefore, the item has been assigned to the component with the highest loading (CC2).
Broadly, the first categorical component (CC) can be interpreted as holding a positive attitude toward shared mobility (CC1—ProShared), a prerequisite for the intention to adopt shared mobility services (Acheampong & Siiba, Citation2020). The second component combines items reflecting a pro-environmental attitude (CC2—ProEnvironment), including perceived subjective and social norms, whereas the third component comprises statements related to perceived barriers toward shared mobility use (CC3—ProBarriers). Respondents scoring high on CC3 also do not see the added value of shared mobility and tend to hold a more negative attitude toward car use reduction. The three attitudinal components were subsequently used for the clustering of respondents into distinct segments (Sec. 3.2).
3.2. Cluster analysis and interpretation of results
The normalized object scores (i.e., individuals’ z-scores on each of the three components), obtained from the previous analysis (Sec. 3.1), were saved, and subjected to hierarchical cluster analysis using Ward’s method, to determine a potential number of clusters. The resulting dendrogram (see ) suggested that, based on the three attitudinal factors, respondents could be reasonably grouped into two up to five clusters.
Figure 4. Dendrogram showing the grouping of respondents using Ward’s method.
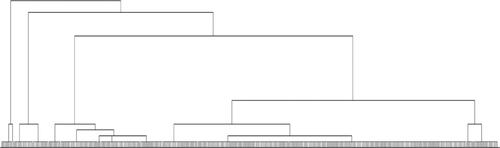
Consequently, two to five clusters each were extracted from the data using the iterative k-means clustering procedure with a maximum of 25 iterations. Upon examination of the different cluster solutions, considering the distinctness and size of extracted clusters, four clusters were deemed as the optimal solution.
The final cluster centers of the four-cluster solution are shown in and , where a positive value indicates agreement, and a negative value indicates disagreement (see also in the Appendix for the unstandardized means and standard deviations of each attitudinal statement by cluster). In order to obtain a better idea of the profile of each of the extracted clusters, basic demographic, and other key variables of interest, were compared (see in the Appendix). For comparison, the final cluster centers of the Manchester sample are provided in (see for attitude means and cluster characteristics, respectively).
Figure 5. Final cluster centers and individual cases based on component object z-scores.
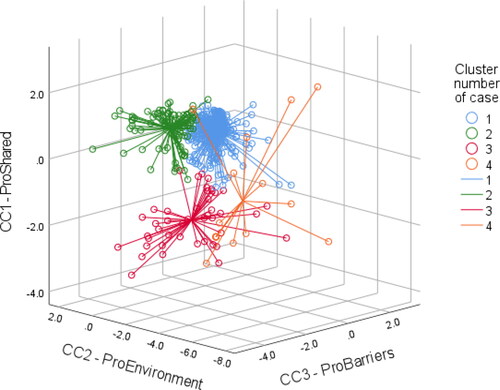
Table 3. Final cluster centers for Amsterdam (z-score means/standard deviations).
At a first glance, it becomes apparent that, while the sizes of clusters differ between Amsterdam and Manchester for Clusters 1 and 2 in particular, the attitudinal profiles of clusters largely overlap (see ), suggesting that a fairly stable cluster solution has been achieved. The characteristics of each cluster (Amsterdam) are described in the Discussion.
3.3. Assigning respondents to DOI adopter categories
and the associated data table (see for the comparison sample) categorize the four clusters according to Everett Rogers (Citation1995) DOI theory (refer back to Sec. 1.1), considering respondents’ intention to use eHUBs.
Figure 6. Adopter categories according to DOI theory by cluster membership (AMS, N = 496).
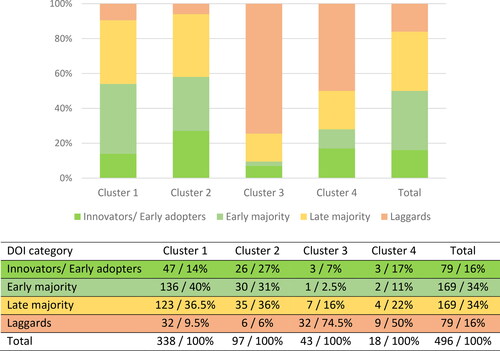
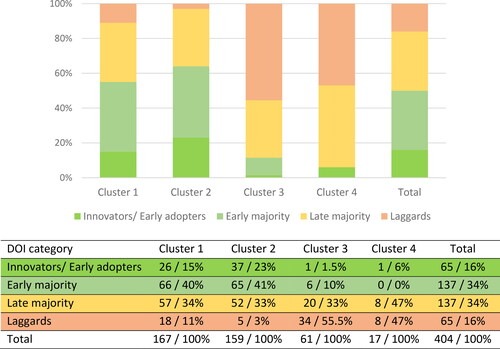
Figure 7. Adopter categories according to DOI theory by cluster membership (MAN, N = 404).
Specifically, intention to use shared vehicle scores (i.e., shared e-bikes and e-cars) were combined (see ), thus establishing a rank order among respondents. Respondents’ total scores ranged from 0 to 200, where ‘0′ stands for ‘Extremely unlikely’ to adopt and ‘200’ stands for ‘Extremely likely’ to adopt. This was followed by assigning clustered respondents to one of the DOI adopter categories based on their total score.
Table 4. Final cluster centers for Manchester (z-score means/standard deviations).
Table 5. DOI categorization based on combined intention scores (Min = 0, Max = 200).
Based on this procedure, it can be seen that, in the current sample, more than half of respondents in Clusters 1 (54%) and Cluster 2 (58%) would be classified as innovators, early adopters, or early majority, with Cluster 2 evidencing the highest share of innovators/early adopters (27%). Interestingly, based on total interest scores, 90.5% of Cluster 3 and 72% of Cluster 4 fall into the late majority and laggard categories, supporting earlier findings. Importantly, also shows the variety within clusters. As an example, despite their generally positive attitude toward eHUBs and high adoption intentions, 42% of Cluster 2 would still be classified as late majority or laggards based on their intention scores.
3.4. Perceived barriers to shared mobility use
Finally, respondents’ current shared mobility use by each cluster, and the barriers perceived by each, were examined, as shown in .
Table 6. Shared mobility use and perceived barriers by cluster (C) membership.
The first notable difference emerges between Clusters 1 and 2 and Clusters 3 and 4 with regard to current shared mobility use. Members of the latter pair of clusters do not commonly use any publicly shared vehicles (96% and 89% for Cluster 3 and 4, respectively), whereas this proportion is substantially lower among the former (63% and 53% for Cluster 1 and 2, respectively).
Concerning perceived barriers, respondents could select from a list of 13 potential barriers, those that (might) prevent them from the uptake of shared mobility. Multiple selections were allowed for this question, so that responders could cite as many barriers as they thought applied to them. Alternatively, or in addition, respondents could cite their own barrier(s) by selecting the ‘Other’ option. The majority of respondents in Cluster 3, in particular, indicate that they are satisfied with using their own car or bike (68%), which is also the most commonly cited barrier to shared mobility use among the other clusters. The second most cited barrier among clusters is a preference for using existing public transport (rather than publicly shared vehicles) which, again, was higher in Cluster 3 (34%) compared to the other clusters. Clusters 3 and 4 also show a greater proportion of respondents who do not see the added value of shared mobility (23% and 17%, respectively).
The most common barriers to the use of shared mobility, cited by members of the largest potential user group (Cluster 1), included the price of renting shared vehicles (16%), insecurity about the availability of shared vehicles (15%), the inability to leave vehicles where the user wishes (11%), and the lack of availability of shared vehicle locations nearby (10%). These concerns were mostly mirrored also by respondents in Cluster 2.
4. Discussion
Below, each of the attitudinal clusters is revisited in terms of the order of priority of potential public uptake, from the perspective of cities and shared mobility providers, with specific recommendations as to how they might be encouraged to use eHUBs.
4.1. Clusters and recommendations
4.1.1. Cluster 1 (car-focused, family; 69% of the sample, high priority)
In total, 74% of respondents who were classified as potential early adopters (including innovators and early majority) of eHUBs came from Cluster 1. Being the biggest group of potential e-mobility hub users in our study, Cluster 1 comprised the majority of car users, thus offering the greatest emissions reduction potential. This group appears to have synergy with Hinkeldein et al. (Citation2015) ‘flexible car-lovers’, who rely on the convenience of the private car to some extent, yet who also are open to other transport alternatives. Although, compared to Cluster 2, members of this group are less positively inclined toward shared mobility, less driven by pro-environmental motives, and perceive barriers toward the use of shared mobility. Members of Cluster 1 showed the greatest interest in using eHUB-based alternatives for their regular commute or food shopping trips. Perceived barriers highlight concerns about the cost and availability of shared vehicles, flexibility (i.e., being able to leave vehicles where desired), and the distance of eHUB locations from origin or destination or both. Addressing these barriers could convince a major proportion of this group to use e-mobility hubs on a regular basis, who will then encourage the fence-sitters to follow (Maloney & Kim, Citation2019).
4.1.2. Cluster 2 (multimodal, cyclists; 19% of the sample, moderate priority)
In line with previous research (Alonso-González et al., Citation2020; Hinkeldein et al., Citation2015), the individuals most inclined to use shared mobility options, based on their overall score on intentions to use shared vehicles from an eHUB, include those already traveling sustainably. First and foremost, this includes pro-environmentally attuned and technology-affine cyclists and multi-modal users, often with university-level education. This group, strongly resembling Hinkeldein et al. (Citation2015)’s ‘innovative technology-loving multi-optionals’ or Alonso-González et al. (Citation2020)’s ‘MaaS-ready individuals’, expressed the greatest interest in, and low perceived barriers toward, the use of shared e-bikes and e-cars. At a first glance, this group appears to represent those most eager to use shared mobility as a replacement for, or supplement to, their existing mobility patterns, suggesting less effort will be required to encourage this group to adopt eHUBs. However, despite the highest proportion of innovators and early adopters among all clusters (27%), members of Cluster 2 differ only slightly from Cluster 1 (58% vs. 54% classified as either innovators, early adopters, or early majority) and, due to their mostly active travel patterns currently, bear less emission reduction potential. Notably, Cluster 2 respondents showed less interest in using eHUBs-based alternatives for their regular commute or food shopping trip than Cluster 1. Similar to Cluster 1, the cost, availability, and distance of shared vehicle locations from the origin or destination of the trip, were perceived as major barriers.
4.1.3. Cluster 4 (senior, captive; 3% of the sample, moderate priority)
Cluster 4 represents older adults with a lower level of education and income, mostly living alone and without children. Respondents in Cluster 4 tend to be male, are the least satisfied with their most regular trip, and the least likely to possess a driver’s license, suggesting some degree of mode captivity. Albeit being somewhat less negative compared to Cluster 3, they show little intention to use shared mobility options in the future, stemming from a strongly negative attitude or indifference toward shared mobility and the environment. Thus, they can be considered laggards concerning shared mobility adoption. Ironically, members of Cluster 4 could benefit most from eHUBs by expanding their mobility options, yet they do not see the added value of shared mobility, suggesting the need for tailored interventions to stress its benefits and an affordable pricing structure that does not exclude them from using eHUB alternatives.
4.1.4. Clusters 3 (senior, anti-sharing; 9% of the sample, low priority)
Individuals in Cluster 3 tend to be female, are the most satisfied with their regular trip, and are the least likely to own a bicycle across all groups. They prefer to use existing mobility options (i.e., either their own car or bicycle or use public transport) and might also be labeled as ‘Anti new-mobility individuals’ (Alonso-González et al., Citation2020) due to their very low intention to use shared vehicles. Therefore, trying to convince this group to use eHUBs would be seen as a wasted effort.
4.2. Implications
Whilst our findings cannot provide an exact estimate of how many people would use eHUBs, they can help cities and practitioners to manage their expectations regarding hub use (e.g., understanding the characteristics of who are the likely users), to locate hubs, to address commonly perceived barriers, and to develop appropriate strategies (e.g., educational, marketing, infrastructure-based, or legislative) to increase the likelihood of uptake, and thus to achieve sufficient value from investment.
Regarding hub locations, the extracted clusters, which have been shown to be reasonably stable across at least two different geographical contexts (i.e., Amsterdam and Manchester), can be used in combination with Census data to identify cohorts in urban or rural areas that are more likely to use the eHUBS. This can be facilitated by drawing on additional information, such as activity pattern data or public transport locations (see Semanjski & Gautama, Citation2016, for a practical application), to facilitate multimodal travel.
Extracted clusters can also be used in travel demand models to simulate the adoption and use of eHUBS. The clusters can be used to select groups of travelers for which specific demand models can be estimated explaining mode choice in detail. Often transport demand models need to resort to classes of travelers to explain in higher detail the travel behavior of the population in a region. Therefore, regarding eHUBs, the clusters provide a relevant initial framework to make a distinction between the travelers, allowing estimating their real usage in competition with the other available modes of transport.
Regarding the uptake of eHUBS, between 53–66% of respondents in Clusters 1 and 2 indicated they would consider using shared vehicles from an eHUB for at least a few of their regular (commute) trips. These proportions were somewhat lower for food shopping trips (30–58%), especially among Cluster 2 (18–36%). Surprisingly, compared to Cluster 1, members of Cluster 2 were the least interested in using shared vehicles in combination with public transport, despite representing the greatest proportion identifying themselves as multimodal users (33%). This raises some questions with regard to the ability of shared mobility options acting as a facilitator for first- and last-mile public transport access (Shaheen & Chan, Citation2016), at least for this particular group. A possible explanation for the lack of interest in using shared vehicles in combination with public transport could stem from the fact that the majority of respondents in Cluster 2 are regular cyclists (57% cycle on 3–4 days or more) and using public transport may not be needed or desirable for their regular commute or food shopping trips.
It should also be noted that only a minority of respondents in Clusters 1 and 2 are frequent car users (26–30% use the car for 3–4 days or more), suggesting limited potential to replace trips made by private car and thus little emission reduction potential consistent with previous research (James et al., Citation2019). Indeed, the emission reduction potential of shared mobility options, in particular, that of e-scooters, has been questioned (Hollingsworth et al., Citation2019).
Hollingsworth et al. (Citation2019) estimated the average value of lifecycle global warming impacts of e-scooters to be 202 g CO2-eq/passenger-mile which, in almost two-thirds of the replaced trips, is greater than the modes being replaced. This is likely to be the case when shared mobility options replace trips that were already being made using sustainable modes such as walking, cycling, or public transport (James et al., Citation2019). Concerning shared cars, the greatest emissions reduction potential is offered by users not merely sharing vehicles, but sharing rides as well (e.g., car-pooling; Santos, Citation2018). Ridesharing itself, however, is frequently met with negative expectations about ride availability, safety, and social awkwardness (Correia & Viegas, Citation2011; Nielsen et al., Citation2015). Thus, the environmental benefits of shared electric mobility remain strongly dependent on their potential to replace trips by private motorized transport and on the integration with public transportation modes (Ambrosino et al., Citation2016; Currie, Citation2018; Santi & Ratti, Citation2017).
However, for people to integrate the use of eHUBs into their daily travel routines requires that any real or perceived barriers to their use are gradually removed. These include, amongst others, concerns about the cost and availability of shared vehicles, the inability to leave vehicles where it is convenient to the user, a lack of shared vehicle locations close by, and a lack of competencies related to the use of electric vehicles. To reduce actual or perceived barriers to the uptake of shared electric vehicles provided via eHUBs, cities and providers must ensure shared mobility services:
are affordable, clean, well maintained, and safe
guarantee the confidentiality of users’ travel data
have an easy registration, rental, and payment process
have a sufficiently large number of vehicles available at all times
have a large number of locations where vehicles can be accessed/left
provide clear and easy to understand information on how to operate vehicles.
The older potential user groups (Clusters 3 and 4 in particular) expressed the least confidence in using eHUBs and electric bicycles (see ). Similarly, respondents in Clusters 1 and 3 expressed some concern about the use of electric cars. These concerns should be taken seriously, given the aging population (65+) in Europe until 2050 (He et al., Citation2016). Therefore, the final recommendation from this research is that providers should focus on delivering equitable transport services. Shared mobility options need to be adapted well to the mobility needs of the aging population by providing tailored transport infrastructure and services that are truly accessible (Cui et al., Citation2017).
4.3. Limitations
Given that our representative sample was obtained from respondents resident in the municipality of Amsterdam, a city boasting high levels of active travel, especially by bicycle (32% according to the Deloitte City Mobility Index for Amsterdam), a key question of interest is to investigate how transferable our results are to other urban areas. As our estimations are based on a Dutch study sample, they may overstate the proportion of individuals who are willing to use shared electric vehicles compared to a different cultural environment. In a different context, such as cities or countries which have lower overall levels of active travel or less developed cycling facilities—note that the EU27 average for cycling is about 8% according to Blondiau and Zeebroeck (Citation2014)—it is likely that different proportions for each potential user group, or different groupings altogether, might be observed. However, as our study used context-independent items and found a stable three-factor structure, our attitudinal clustering approach is transferable and can easily be replicated in other cities, yielding comparable results.
Another limitation relates to the classification of respondents into either early or late majority adopters of eHUBs. While DOI theory (Rogers, Citation1995) was successfully integrated into our research and can predict, in broader terms, what adopter category respondents will likely fall into, based on their stated shared mobility intentions and attitudes, there is a large variation within the clusters as well. A substantial part of Cluster 2 respondents, for instance, were still classified as late majority or laggards, despite their overall positive attitudes toward shared mobility and low perceived barriers. DOI also cannot tell us about the speed of adoption, which may differ greatly between different population segments.
5. Future research
While potential user groups of eHUBs were distinguished, there are some issues that require further research. One key question of interest concerns vehicle selection. Knowing that different user groups may be more likely within an eHUB to go for modes that they are already using (e.g., car users going for shared e-cars), it would have been useful asking the respondents to indicate their modal preference in an eHUB scenario. Therefore, to extend the findings of this initial exploratory study, using the derived segments to find out more about the determinants of choice (e.g., cost, access and travel time, vehicle types and availability) may generate deeper knowledge on the adoption of eHUBs. This may take the form of Discrete Choice/Stated Preferences experiments, where participants are presented with eHUB modes as an alternative to their existing mode. In fact, in a parallel exercise, such an experiment has been conducted by the authors that will shed more light on the factors influencing the choice of shared electric vehicles from eHUBs.
Relatedly, another key question of interest surrounds the added value of providing several shared electric vehicle types in one location, which is the major novelty aspect of the eHUBs project. Concerning this question, it was observed that respondents in Cluster 2 expressed the greatest interest in using shared EVs (intention), mirroring the findings of Claasen (Citation2020), who questioned the added value of mobility hubs versus traditional car sharing schemes. Indeed, 92% of respondents in Cluster 2 reported owning at least one bicycle, so the lower interest in shared bicycles may not be surprising. For the biggest cluster of the study (Cluster 1, 69% of the sample), however, this tendency did not emerge, with respondents expressing similar intentions to use either shared e-(cargo) bikes or EVs. Hence, it appears that the added value of increasing the variety of modes is likely going to be different for different user segments, although further research is needed to explore this.
In addition to the above, it is not clear to what extent potential users’ intentions to use shared mobility services may depend on perceived built environment characteristics, such as the availability of cycling paths and facilities. Whilst possibly not a specific issue in the Municipality of Amsterdam, with good provision for walking and cycling in most parts, offering shared mobility options in cities that do not provide adequate facilities may hamper the uptake of these options as a means of transportation. Adapting existing infrastructure is thus crucial for future shared electric mobility development (Marsden et al., Citation2019).
Importantly, our findings indicate also that shared electric vehicles may replace trips already being made using sustainable modes. This may be true for up to 70–74% of potential users in Clusters 1 and 2 who are not frequent car users and have high bicycle ownership, thus highlighting the importance of taking mode choice of the substitute trip into account when measuring the environmental benefits of shared mobility usage (Vasconcelos et al., Citation2017). As the proportion of frequent car users is likely to be greater in other European countries, such as Germany or the UK, how efforts to promote shared mobility can be tailored specifically to segments with the greatest emission savings potential should be explored. This applies especially to Cluster 1 respondents who are not only more reliant on the private car but also perceive greater barriers to the use of publicly shared vehicles. A few suggestions as to how this may be achieved have been listed in the preceding section.
Finally, future research also should consider that electric shared mobility bears potential disbenefits in terms of safety and health due to its speed and lack of physical activity compared to trips made by pedal cycle or walking (Milakis et al., Citation2020; Yang et al., Citation2020). Minimizing risks is crucial for those without prior experience of using shared electric vehicles. Studies comparing the health (dis-)benefits and risks of electric versus non-electric shared mobility schemes could close the knowledge gap in this respect.
6. Conclusions
Shared electric mobility hubs (eHUBs) are gaining momentum in cities worldwide, disrupting established mobility patterns and offering the potential to contribute to the sustainable mobility agenda. eHUBs have the potential to shift short to medium distance trips previously made by private cars to more sustainable alternatives by offering people convenient access to an array of shared micro-mobility options. This paper has sought to examine the characteristics of potential user groups of this new type of shared mobility service using Amsterdam as a case study city. Based on a representative sample of adult respondents, four user groups with varying levels of intention to use eHUBs in the future were distinguished, depending on the available offer of shared mobility options and the compatibility with personal mobility needs. Crucially, our research indicates that those most likely to adopt eHUBs services are those already traveling sustainably, whereas those with the greatest emissions savings potential are interested, yet perceive various barriers to the uptake of shared vehicles, such as the availability and cost of shared vehicles or the walking distance to access eHUBs. Addressing these perceived barriers appropriately through careful planning, implementation, and marketing, needs to become a top priority in the future.
Acknowledgements
This work has been supported by the EU-funded eHUBs project (Sponsor: INTERREG NWE, Project number: NWE 826). The project sponsor neither had any direct involvement in the conduct of the research nor in the decision to submit the article for publication. Ethical approval for this study was obtained from the SAGE Ethics Committee based at Newcastle University (Ref: 18251/2019) and informed consent was obtained from all participants. Finally, we would like to thank the City of Amsterdam, Hogeschool van Amsterdam (AUAS | Psychology for Sustainable Cities), and Transport for Greater Manchester, for their support in recruiting a representative study sample and providing feedback on early draft versions of the online questionnaire, amongst others.
Disclosure statement
The authors declare no conflicts of interest.
Notes
1 20190409_Mobipunt-Leuven_01.png (1920 × 1080) (autodelen.net)
References
- Acheampong, R. A., & Siiba, A. (2020). Modelling the determinants of car-sharing adoption intentions among young adults: The role of attitude, perceived benefits, travel expectations and socio-demographic factors. Transportation, 47(5), 2557–2580. https://doi.org/10.1007/s11116-019-10029-3
- Ajzen, I. (1991). The theory of planned behavior. Organizational Behavior and Human Decision Processes, 50(2), 179–211. https://doi.org/10.1016/0749-5978(91)90020-T
- Alonso-González, M. J., Hoogendoorn-Lanser, S., van Oort, N., Cats, O., & Hoogendoorn, S. (2020). Drivers and barriers in adopting Mobility as a Service (MaaS) – A latent class cluster analysis of attitudes. Transportation Research Part A: Policy and Practice, 132, 378–401.
- Ambrosino, G., Nelson, J. D., & Gini, S. (2016). The pivotal role of Public Transport in designing the integration of mobility services and in operating MaaS offer: The concept of Shared Mobility Centre and the experience of Arezzo. In REAL CORP 2016–SMART ME UP! How to become and how to stay a Smart City, and does this improve quality of life? Proceedings of 21st International Conference on Urban Planning, Regional Development and Information Society (pp. 737–747). CORP–Competence Center of Urban and Regional Planning.
- Anderson, K., Blanchard, S. D., Cheah, D., & Levitt, D. (2017). Incorporating equity and resiliency in municipal transportation planning: Case study of mobility hubs in Oakland, California. Transportation Research Record: Journal of the Transportation Research Board, 2653(1), 65–74. https://doi.org/10.3141/2653-08
- Anderson-Hall, K., Bordenkircher, B., O'Neil, R., & Scott, S. C. (2019). Governing micro-mobility: A nationwide assessment of electric scooter regulations (No. 19-05267). Transportation Research Board 98th Annual Meeting.
- Atchley, W. R. (2007). Introduction to principal components and factor analysis. Retrieved September 24, 2020, from ftp://statgen.ncsu.edu/pub/thorne/molevoclass/AtchleyOct19.pdf.
- Blondiau, T., & Zeebroeck, B. V. (2014). Cycling works. Jobs and job creation in the cycling economy. European Cyclists’ Federation. Retrieved October 1, 2020, from https://repository.difu.de/jspui/bitstream/difu/232402/1/DS1369.pdf
- Burghard, U., & Dütschke, E. (2019). Who wants shared mobility? Lessons from early adopters and mainstream drivers on electric carsharing in Germany. Transportation Research Part D: Transport and Environment, 71, 96–109. https://doi.org/10.1016/j.trd.2018.11.011
- Carteni, A., Henke, I., Molitierno, C., & Errico, A. (2020). Towards E-mobility: Strengths and weaknesses of electric vehicles. In L. Barolli, F. Amato, F. Moscato, T. Enokido, & M. Takizawa (Eds.), Web, artificial intelligence and network applications. WAINA 2020. Advances in intelligent systems and computing (vol. 1150). Springer. https://doi.org/10.1007/978-3-030-44038-1_126
- CBS. (2021). Population dashboard (cbs.nl). Retrieved July 25, 2021.
- Ciari, F., & Becker, H. (2017). How disruptive can shared mobility be? A scenario-based evaluation of shared mobility systems implemented at large scale. In G. Meyer & S. Shaheen (Eds.), Disrupting mobility (pp. 51–63). Springer.
- Claasen, Y. (2020). Potential effects of mobility hubs: Intention to use shared modes and the intention to reduce household car ownership (Master's thesis). University of Twente. Retrieved September 16, 2020, from http://essay.utwente.nl/81537/
- Correia, G., & Viegas, J. M. (2011). Carpooling and carpool clubs: Clarifying concepts and assessing value enhancement possibilities through a Stated Preference web survey in Lisbon, Portugal. Transportation Research Part A: Policy and Practice, 45(2), 81–90.
- Cortina, J. M. (1993). What is coefficient alpha? An examination of theory and applications. Journal of Applied Psychology, 78(1), 98–104. https://doi.org/10.1037/0021-9010.78.1.98
- Cui, J., Loo, B. P., & Lin, D. (2017). Travel behaviour and mobility needs of older adults in an ageing and car-dependent society. International Journal of Urban Sciences, 21(2), 109–128. https://doi.org/10.1080/12265934.2016.1262785
- Currie, G. (2018). Lies, damned lies, AVs, shared mobility, and urban transit futures. Journal of Public Transportation, 21(1), 19–30. https://doi.org/10.5038/2375-0901.21.1.3
- Deloitte City Mobility Index: Amsterdam. Deloitte insights. Retrieved October 1, 2020, from https://www2.deloitte.com/content/dam/insights/us/articles/4331_Deloitte-City-Mobility-Index/city-mobility-index_AMSTERDAM_FINAL.pdf
- Donald, I. J., Cooper, S. R., & Conchie, S. M. (2014). An extended theory of planned behaviour model of the psychological factors affecting commuters’ transport mode use. Journal of Environmental Psychology, 40, 39–48. https://doi.org/10.1016/j.jenvp.2014.03.003
- Dutch Census. (2011). Dutch census 2011 (cbs.nl). Retrieved July 25, 2021.
- Eccarius, T., & Lu, C. C. (2020). Adoption intentions for micro-mobility – Insights from electric scooter sharing in Taiwan. Transportation Research Part D: Transport and Environment, 84, 102327. https://doi.org/10.1016/j.trd.2020.102327
- Eliot, R., Hong, C., & Hughey, M. (2020). Creating mobility hubs to connect transportation modes. Resilient Communities Project (RCP), University of Minnesota. Retrieved September 16, 2020, from https://conservancy.umn.edu/handle/11299/214104
- Faber, V. (1994). Clustering and the continuous k-means algorithm. Los Alamos Science, 22, 138–144.
- Fleming, K. L. (2018). Social equity considerations in the new age of transportation: Electric, automated, and shared mobility. Journal of Science Policy & Governance, 13(1). https://www.sciencepolicyjournal.org/jspgvol13.html
- Gössling, S. (2020). Integrating e-scooters in urban transportation: Problems, policies, and the prospect of system change. Transportation Research Part D: Transport and Environment, 79, 102230. https://doi.org/10.1016/j.trd.2020.102230
- He, W., Goodkind, D., & Kowal, P. R. (2016). An aging world: 2015. U.S. Census Bureau, International Population Reports, P95/16-1. U.S. Government Publishing Office.
- Heinen, E. (2016). Identity and travel behaviour: A cross-sectional study on commute mode choice and intention to change. Transportation Research Part F: Traffic Psychology and Behaviour, 43, 238–253. https://doi.org/10.1016/j.trf.2016.10.016
- Hinkeldein, D., Schoenduwe, R., Graff, A., & Hoffmann, C. (2015). Who would use integrated sustainable mobility services – and why? In M. Attard & Y. Shiftan (Eds.), Sustainable urban transport (Vol. 7, pp. 177–203). Emerald Group Publishing Limited, Bingley.
- Hoerler, R., & Hoppe, M. (2019). Commuter segmentation and openness to sharing services: A Swiss case study. ZHAW Zürcher Hochschule für Angewandte Wissenschaften. https://doi.org/10.21256/zhaw-18749
- Hollingsworth, J., Copeland, B., & Johnson, J. X. (2019). Are e-scooters polluters? The environmental impacts of shared dockless electric scooters. Environmental Research Letters, 14(8), 084031. https://doi.org/10.1088/1748-9326/ab2da8
- James, O., Swiderski, J. I., Hicks, J., Teoman, D., & Buehler, R. (2019). Pedestrians and e-scooters: An initial look at e-scooter parking and perceptions by riders and non-riders. Sustainability, 11(20), 5591. https://doi.org/10.3390/su11205591
- Jing, P., Huang, H., Ran, B., Zhan, F., & Shi, Y. (2019). Exploring the factors affecting mode choice Intention of autonomous vehicle based on an extended theory of planned behavior—A case study in China. Sustainability, 11(4), 1155. https://doi.org/10.3390/su11041155
- Ketchen, D. J., & Shook, C. L. (1996). The application of cluster analysis in strategic management research: An analysis and critique. Strategic Management Journal, 17(6), 441–458. https://doi.org/10.1002/(SICI)1097-0266(199606)17:6<441::AID-SMJ819>3.0.CO;2-G
- Kodransky, M., & Lewenstein, G. (2014). Connecting low-income people to opportunity with shared mobility. Institute for Transportation & Development Policy.
- Kodukula, S., Rudolph, F., Jansen, U., & Amon, E. (2018). Living. Moving. Breathing. Wuppertal Institute.
- Lavieri, P. S., & Bhat, C. R. (2019). Investigating objective and subjective factors influencing the adoption, frequency, and characteristics of ride-hailing trips. Transportation Research Part C: Emerging Technologies, 105, 100–125. https://doi.org/10.1016/j.trc.2019.05.037
- Le Vine, S., & Polak, J. (2015). Introduction to special issue: New directions in shared-mobility research. Transportation, 42(3), 407–411. https://doi.org/10.1007/s11116-015-9603-4
- Li, J., Shen, J., & Jia, B. (2021). Exploring intention to use shared electric bicycles by the extended theory of planned behaviour. Sustainability, 13(8), 4137. https://doi.org/10.3390/su13084137
- Linting, M., Meulman, J. J., Groenen, P. J. F., & van der Koojj, A. J. (2007). Nonlinear principal components analysis: Introduction and application. Psychological Methods, 12(3), 336–358. https://doi.org/10.1037/1082-989X.12.3.336
- Liu, D., Du, H., Southworth, F., & Ma, S. (2017). The influence of social-psychological factors on the intention to choose low-carbon travel modes in Tianjin, China. Transportation Research Part A: Policy and Practice, 105, 42–53.
- Machado, C. A. S., De Salles Hue, N. P. M., Berssaneti, F. T., & Quintanilha, J. A. (2018). An overview of shared mobility. Sustainability, 10(12), 4342. https://doi.org/10.3390/su10124342
- Maloney, E. J., & Kim, J. (2019). The misuse of the diffusion of innovation. Retrieved October 2, 2020, from https://www.insidehighered.com/digital-learning/blogs/technology-and-learning/misuse-diffusion-innovation
- Manders, T., Cox, R., Wieczorek, A., & Verbong, G. (2020). The ultimate smart mobility combination for sustainable transport? A case study on shared electric automated mobility initiatives in the Netherlands. Transportation Research Interdisciplinary Perspectives, 5, 100129. https://doi.org/10.1016/j.trip.2020.100129
- Marsden, G., Anable, J., Bray, J., Seagriff, E., & Spurling, N. (2019). Shared mobility: Where now? where next?. The second report of the Commission on Travel Demand. Centre for Research into Energy Demand Solutions. ISBN: 978-1-913299-01-9.
- Mattia, G., Mugion, R. G., & Principato, L. (2019). Shared mobility as a driver for sustainable consumptions: The intention to re-use free-floating car sharing. Journal of Cleaner Production, 237, 117404. https://doi.org/10.1016/j.jclepro.2019.06.235
- Milakis, D., Gebhardt, L., Ehebrecht, D., & Lenz, B. (2020). Is micro-mobility sustainable? An overview of implications for accessibility, air pollution, safety, physical activity, and subjective wellbeing. In C. Curtis (Ed.), Handbook of sustainable transport. Edward Elgar Publishing Ltd.
- Nielsen, J. R., Hovmøller, H., Blyth, P. L., & Sovacool, B. K. (2015). Of “white crows” and “cash savers:” A qualitative study of travel behavior and perceptions of ridesharing in Denmark. Transportation Research Part A: Policy and Practice, 78, 113–123.
- Nikiforiadis, A., Chrysostomou, K., & Aifadopoulou, G. (2019). Exploring travelers’ characteristics affecting their intention to shift to bike-sharing systems due to a sophisticated mobile app. Algorithms, 12(12), 264. https://doi.org/10.3390/a12120264
- Otero, I., Nieuwenhuijsen, M. J., & Rojas-Rueda, D. (2018). Health impacts of bike sharing systems in Europe. Environment International, 115, 387–394. https://doi.org/10.1016/j.envint.2018.04.014
- Pimentel, R., & Lowry, M. (2020). If you provide, will they ride? Motivators and deterrents to shared micro-mobility. Pacific Northwest Transportation Consortium [136]. Retrieved September 15, 2020, from http://hdl.handle.net/1773/45598
- Punj, G., & Stewart, D. W. (1983). Cluster analysis in marketing research: Review and suggestions for application. Journal of Marketing Research, 20(2), 134–148. https://doi.org/10.1177/002224378302000204
- Reyes García, J. R., Lenz, G., Haveman, S. P., & Bonnema, G. M. (2019). State of the art of electric Mobility as a Service (eMaaS): An overview of ecosystems and system architectures. 32nd International Electric Vehicle Symposium (EVS32). Retrieved September 16, 2020, from https://ris.utwente.nl/ws/portalfiles/portal/117977192/EVS32_1.PDF
- Rogers, E. M. (1995). Diffusion of innovations (4th ed.). The Free Press.
- Santi, P., & Ratti, C. (2017). A future of shared mobility. Journal of Urban Regeneration & Renewal, 10(4), 328–333.
- Santos, G. (2018). Sustainability and shared mobility models. Sustainability, 10(9), 3194. https://doi.org/10.3390/su10093194
- Semanjski, I., & Gautama, S. (2016). Crowdsourcing mobility insights–Reflection of attitude based segments on high resolution mobility behaviour data. Transportation Research Part C: Emerging Technologies, 71, 434–446. https://doi.org/10.1016/j.trc.2016.08.016
- Shaheen, S. A., Bansal, A., Chan, N., & Cohen, A. (2016). Mobility and the sharing economy: Industry developments and early understanding of impacts. Transport Policy, 51(Supplement C), 141–142. https://doi.org/10.1016/j.tranpol.2016.01.008
- Shaheen, S., & Chan, N. (2016). Mobility and the sharing economy: Potential to facilitate the first-and last-mile public transit connections. Built Environment, 42(4), 573–588. https://doi.org/10.2148/benv.42.4.573
- Si, H., Shi, J., Tang, D., Wu, G., & Lan, J. (2020). Understanding intention and behavior toward sustainable usage of bike sharing by extending the theory of planned behavior. Resources, Conservation and Recycling, 152, 104513. https://doi.org/10.1016/j.resconrec.2019.104513
- Vasconcelos, A. S., Martinez, L. M., Correia, G. H., Guimarães, D. C., & Farias, T. L. (2017). Environmental and financial impacts of adopting alternative vehicle technologies and relocation strategies in station-based one-way carsharing: An application in the city of Lisbon, Portugal. Transportation Research Part D: Transport and Environment, 57, 350–362. https://doi.org/10.1016/j.trd.2017.08.019
- Ward, J. (1963). Hierarchical grouping to optimize an objective function. Journal of the American Statistical Association, 58(301), 236–244. https://doi.org/10.1080/01621459.1963.10500845
- Yang, H., Ma, Q., Wang, Z., Cai, Q., Xie, K., & Yang, D. (2020). Safety of micro-mobility: Analysis of E-Scooter crashes by mining news reports. Accident; Analysis and Prevention, 143, 105608. https://doi.org/10.1016/j.aap.2020.105608
- Yu, Y., Yi, W., Feng, Y., & Liu, J. (2018). Understanding the intention to use commercial bike-sharing systems: An integration of TAM and TPB. Proceedings of the 51st Hawaii International Conference on System Sciences, January).
Appendix
Table A1. Attitudes toward shared mobility, car use and the environment in order from highest to lowest level of agreement by cluster (green = tends to agree, yellow/red = tends to disagree).
Table A2. Cluster comparison on variables of interest.
Table A3. Attitudes toward shared mobility, car use and the environment from highest to lowest level of agreement by cluster (green = tends to agree, yellow/red = tends to disagree).
Table A4. Cluster comparison on variables of interest.