
 ?Mathematical formulae have been encoded as MathML and are displayed in this HTML version using MathJax in order to improve their display. Uncheck the box to turn MathJax off. This feature requires Javascript. Click on a formula to zoom.
Abstract
Passenger cars contribute considerably to total emissions of greenhouse gasses. In this article, we develop scenarios for the Swedish passenger car fleet in 2030, achieving a 70% reduction of greenhouse gas emissions as compared to 2010. The number of shared and electric cars, how they are combined, and levels of biofuel use differ between the scenarios. Transport volumes, car access, battery use, indirect emissions, and fleet development are evaluated and compared. Conclusions based on the scenarios include:
Target-fulfillment requires a reduction in kilometers traveled by passenger cars. The reductions are 21%–47% per capita in six scenarios.
Major changes to both removal rate and new car sales are needed, highlighting a policy challenge for the coming decade.
Total battery capacity in the vehicle fleet increase from 1 GWh 2018 to 73–168 GWh in the six scenarios. This implies a need for careful consideration regarding resource scarcity and production capacity. A new metric, vehicle kilometers/(kWh*year), is developed and tested to explore efficiency in battery use.
Reducing direct emissions through a high production of electric cars causes tensions in relation to the European Emissions Trading System due to the indirect emissions that arise. It is therefore important to consider indirect emissions in policymaking.
1. Introduction
The European Union (EU) has a target of reaching climate neutrality by 2050, including an intermediate target of a 55% reduction of greenhouse gases (GHG) by 2030 compared to 1990 (European Commission, Citation2022). According to a report from the European Environmental Agency from 2019, one-quarter of EU emissions originate from transport, 40% of which originate from the use of passenger cars alone (European Parliament, Citation2019). Renewable fuels and electric propulsion are expected to contribute substantially to lowering emissions (see e.g. International Energy Agency (IEA), 2019a). However, these technological solutions introduce new challenges and tradeoffs.
Regarding energy use, biomass for sustainable biofuels is limited in supply and likely to become subject to increasing demand in transport and other sectors aiming to decrease their reliance on fossil fuels (Börjesson, Citation2016; IEA, Citation2020a). In addition, biomass also leads to GHG emissions. Thus, relying too much on biofuels when aiming to reduce the transport sector’s contribution to global warming is a problematic strategy. Energy in the form of renewable electricity can be produced in several different ways. However, barriers in, for example, power distribution need to be considered (IEA, Citation2020b, pp. 226–245).
The demand for electric cars is picking up pace and with it comes challenges related to, for example, ramping up of battery production, which is linked to the availability of metals like cobalt, lithium, and nickel (IEA, Citation2018, pp. 84–86, Citation2022). The risk of resource depletion has been discussed (Peters & Weil, Citation2016), as well as supply failing to match demand within the current decade, following long lead times for new lithium and nickel extraction capacity (IEA, Citation2022). There have been reports of electric car manufacturers having to decrease the rate of production, or even put production on hold due to a shortage of batteries (Automotive News Europe, Citation2020; Electrive, Citation2020; Handelsblatt, Citation2020). Other concerns include social and environmental impacts currently originating from the extraction and production process, as well as geopolitical risks, since much of battery metal production and refining activities are concentrated to specific parts of the world (IEA, Citation2019b, Citation2022).
Electrification of passenger cars and renewable fuels also contributes to a shift of weight regarding the emissions from different life cycle stages. While direct emissions are removed, emissions from the car manufacturing phase are the same or higher, even in absolute terms. The carbon-intensive battery production is a key reason for this shift (Ellingsen et al., Citation2016; Emilsson & Dahllöf, Citation2019; Hawkins et al., Citation2013).
Two types of electric cars that have risen in popularity recently are Battery Electric Vehicles (BEVs) and Plug-In Hybrid Electric Vehicles (PHEVs). While BEVs run solely on electricity, PHEVs combine electric propulsion for shorter distances with an internal combustion engine. This enables the use of smaller batteries, and PHEVs have therefore been suggested as a resource and climate efficient alternative (see, e.g., Andersson & Börjesson, Citation2021). However, the advantage is dependent on the share of fuel used being low enough not to erode the emissions reductions. Notably, real world emissions of PHEVs have turned out to be substantially higher than those reported through the Worldwide Harmonized Light Vehicle Test Procedure. According to a study by Plötz et al. (Citation2022), the distance driven in electric mode, electric Utility Factor (UF), was only 45%–49% for private PHEVs and 11%–15% for PHEVs owned by companies.
On a general level, population size, economy, and urban and regional structure are important factors affecting driving distances. One mode of use that has potential to reduce emissions and resource use is car sharing. One of the reasons is that each shared car can replace several individually owned ones. Another example is that those participating in car sharing tend to travel less by car overall (Chen & Kockelman, Citation2016; Loose, Citation2015; Shaheen et al., Citation2019).
The combination of car sharing and electric vehicles has been suggested as having potential to reduce GHG emissions (Chen & Kockelman, Citation2016; Shaheen et al., Citation2019). Sharing could enable increased utilization of electric vehicles during their lifetime, thereby reducing, for example, manufacturing emissions per vehicle-km, and at the same time replacing a larger number of fossil fueled kilometers. In addition, while the relation between car sharing and GHG emissions savings has been explored more thoroughly, the link to decreasing resource use has not garnered as much attention (Harris et al., Citation2021). Increasing the intensity of electric car use by sharing could contribute to reduced life cycle emissions as well as reduced need for battery metals.
Passenger car fleets around the world have been studied using scenarios to explore the potential of reduced GHG emissions. According to Dirnaichner et al. (Citation2022) studies considering only the use phase dominate. Garcia and Freire (Citation2017) adds that most studies focusing on a life cycle perspective are centered around singular vehicles, although the number of fleet level studies are growing (c.f. Dirnaichner et al., Citation2022; Garcia & Freire, Citation2017). A focus on GHG emissions dominates heavily, and fewer studies consider material resources needed in the transition to low-emission vehicle fleets (Gassner et al., Citation2021). As stated by Dirnaichner et al. (Citation2022): “… system-wide implications along other sustainability dimensions need further exploration.”.
This article considers the case of the Swedish passenger car fleet, where a strict emission target for the transport sector make tradeoffs and tensions tangible (see, e.g., Kågeson, Citation2019). Although electrification of cars in Sweden has come comparatively far, other nations will soon face similar situations. Therefore, the results of this article should be relevant for other countries as well although differences regarding, for example, car ownership and average vehicle weight, need to be adjusted for.
1.1. Aim and delimitations
The aim of this article is to explore scenarios of car sharing and electrification for the Swedish passenger car fleet in 2030, achieving a 70% reduction in direct emissions compared to 2010. The scenarios are analyzed with regards to:
Transport volumes and car access
Indirect emissions from vehicles and fuels
Battery demand and utilization
Potential pathways for fleet development
Total transport volumes that can be accommodated are examined as well as the level of car access that may be realized with set limits for the use of fossil fuel and biofuel. Two levels of biofuel use are considered, one restrained by Swedish raw material availability and the other by availability in a global context (see Section 4.1). Indirect emissions from fuels and vehicles are estimated and placed in the context of the European Union Emissions Trading system (EU ETS). Total battery demand in the scenarios is investigated, as well as how well batteries are utilized, depending on the type of electric car and mode of use. Finally, possible fleet development is explored, including the number of cars that must be added and removed in order to reach the scenarios.
Delimitations include:
Emissions from infrastructure are not included. According to Liljenström (Citation2021, p. 25), such emissions make up 20% of indirect climate impact from road transport.
The higher weight of BEVs will to some extent increase road wear, but we do not try to estimate how much in this article.
We focus on sequential sharing of cars, which can be contrasted to ride sharing, where multiple users share the same vehicle simultaneously (Kawaguchi et al., Citation2019).
Fleet development is modeled as a closed system, without any export or import to or from other countries.
While the focus here is electrification, sharing, and the use of biofuels, there are other technological and behavioral changes of importance not taken into account. Examples include: (other) mobility services, public transport and active modes of transportation.
2. Methodology and approach
2.1. Backcasting
A backcasting approach is used in this article. In a categorization by Börjeson et al. (Citation2006), backcasting belongs to the normative transformative scenario category, that is, scenarios that require structural change to be able to fullfill targets. Backcasting can be summarized in four steps (Höjer et al., Citation2011). First, a target is defined for a future state of the studied system. Second, the current trajectory is examined. If there are reasons to believe that the target will not be achieved without major systemic change, a third step is taken, that is, development of target-fulfilling images of the future (the term “scenarios” is used in this article instead of images of the future). In this study, the scenarios are composed of different combinations of building blocks like levels of biofuel and numbers of electric cars (see Section 4). In a final step, the scenarios are analyzed in terms of consistency and how they relate to targets other than those specified initially. In this step, paths between the present and the scenarios can be developed and analyzed as well, including the role of near-time strategical decisions. Typical time frames for backcasting are 25–50 years (Börjesson, Citation2016). In this article, the target year is less than 10 years away. This means that this article is less open to radical change, as compared to many other backcasting studies. For example, the average age of cars removed from the Swedish passenger car fleet is roughly 17 years (Kågeson, Citation2019, p. 143), telling for the inertia which limits the transition possible in the near-time perspective, that is, until 2030.
A modeling approach in the form of spreadsheet calculations is taken to explore Swedish car fleet development, from its current state to that in the scenarios for 2030. Available statistical data are used for 2018–2020, a forecast for 2021–2022, while the passenger car fleet development is modeled for 2023–2030 (see Section 2.3 on the data used). First the scenarios are sketched out through rough calculations with approximate numbers, then more detailed modeling is carried out in order to achieve results with greater accuracy (see Section 2.2). The work includes simulating pathways to the state of the fleet in the scenarios, through additions and removals of cars. As the pathways affect shares of vehicle types, and thereby emissions and energy use, an iterative approach is used.
2.2. Modeling fleet development
The shared and non-shared car fleets are modeled as separate entities. Starting with the non-shared fleet, development in the fleet is set to be linear. Hence, the number of cars to be added a particular year is calculated as the difference between the number of cars in the fleet the following year and the current year, adjusting for the cars removed. The provisional number of cars removed is based on the ratio between average annual distance traveled and average lifetime distance traveled among cars, multiplied with the number of cars in the fleet, as is shown in EquationEquation (1)(1)
(1) . In the equation, the number of cars removed is denoted nremoved, total vehicle distance traveled during the average vehicle life dlifetime, the average yearly vehicle kilometers distance traveled dannual and the number of cars in the fleet nfleet. Age-differentiated removal rates are used to decide the share of non-shared cars to be removed from each age group based on Algers (Citation2017).
(1)
(1)
After calculating the total number of cars removed and added annually, shares of BEVs, PHEVs and ICEVs (Internal Combustion Engine Vehicles) are assigned among the added cars. The shares of BEVs and PHEVs are set first, and ICEVs are set to constitute the remaining share. The subcategories used for ICEVs are gasoline, diesel, and hybrid electric cars using gasoline, as these currently dominate and have been forecasted to do so in 2030 as well (SEA, Citation2019a; Trafikanalys, Citation2020). The share of biofuel use is described in Section 2.3.2.
The market share of BEVs among non-shared cars is set to increase following an S-curve, which has been argued to be a likely pattern for BEV adoption (Gnann et al., Citation2018). The PHEV market share is set to follow an S-curve until 2025, and thereafter to follow a linear development, indicating the uncertainty characterizing the development of the PHEV market share (see, e.g., Gnann et al., Citation2018). EquationEquations (2)(2)
(2) and Equation(3)
(3)
(3) show how the market shares of BEVs (xBEV) and PHEVs (xPHEV) are calculated. In the equations, yn is the year for which the market share is estimated, while A, B, and C are fitting parameters. Shares of BEVs and PHEVs added together exceeding 1 are adjusted downwards to equal 1, while maintaining their relative relationship in terms of size.
(2)
(2)
(3)
(3)
Parameters A and B are calculated using the least square method, fitting an S-curve to the historic development of BEV and PHEV based on market shares between 2010 and 2020, and forecasted market shares for 2021–2022 (see ). The C-parameter is set so that the PHEV-to-BEV ratio achieves the distribution specified in the respective scenarios (see Section 4.6).
Table 1. Parameter values for estimation of PHEV and BEV market shares, and the coefficient of determination (R2).
In order to make the number of electric cars equal to those specified in the scenarios, the removal rate for all cars is increased. The addition of cars is then adjusted upwards, maintaining a linear fleet development. The removed cars are distributed between 2023 and 2030, in order to have a gradual change in the removal during 2023 and 2024, after which the number of cars is set to be constant until 2030, simulating policy measures to achieve the scenarios. This leads to an annual number of cars removed as is specified in EquationEquation (4)(4)
(4) , where x is the adjustment factor resulting from increased removal rate.
(4)
(4)
The shared car fleet it is set to develop linearly as well. Added cars are taken from the non-shared car fleet, including cars aged 0–10 years. The shares among cars added are based on the shares of the respective age segments and vehicle categories in the non-shared fleet. Shared cars are set to remain shared for 5 years before being returned to the non-shared fleet. Formerly shared cars are removed the year their lifetime distances are reached, considering average annual distances during the years as shared and non-shared, respectively.
Moving cars to and from the shared fleet causes deviations from the linear development in the non-shared fleet. The deviations are compensated for by adding cars with the same distribution in terms of vehicle categories as those added and removed cars in the non-shared fleet that particular year. The sum of average yearly vehicle kilometers per car in the two fleets is set to be constant, except for a reduction in vehicle kilometers among households sharing cars instead of using privately owned cars (see Section 4.1.3).
2.3. Data
2.3.1. Vehicles and vehicle kilometers
For 2018, distribution of ICEVs, PHEVs, and BEVS and number of cars per age-group are based on statistics available from Statistics Sweden (Citation2021). The age distribution is set to reflect new car sales reported by BilSweden (Citation2021) 2018 and Trafikanalys (Citation2018) 2007–2017, in terms of shares of vehicles per category within the respective age groups. For the years before 2006 shares in the fleet from Trafikanalys (Citation2010) are used, as no information on new car sales was found. To account for cars that are only registered part of the year, numbers from Trafikanalys (Citation2019a) are used to scale up the resulting figures. PHEVs are set to use gasoline as main fuel for the internal combustion engine, as gasoline currently dominates among PHEVs (Trafikanalys, Citation2020). The same is done for HEVs. Deviations will most likely have little impact (see, e.g., SOU, Citation2021, p. 679).
The number of shared cars in 2018 is set to 1840, based on Miljöbarometern (Citation2019), and is assumed to have the same distribution between ICEVs, BEVS, and PHEVS as the overall fleet. Shared cars in the fleet 2018 are assumed to be from that same year. This has minor consequences for the overall performance of the fleet, since the number of shared cars was so small.
The annual average kilometers traveled by cars is set to 12,000 km based on Trafikanalys (Citation2019a), and does not change over time. The annual average distance traveled among shared cars is set to 20,000 km based on personal communication with one car sharing company (MoveAbout) and one car sharing interest organization (Bilpoolernas Riksförbund). The figure increases linearly to 25,000 km in 2030, as car sharing organizations improve the degree of utilization with increasing experience of service provision, and an increased user density in the areas where car sharing is employed.
Lifetime vehicle kilometers traveled is set to be the same among all categories of cars as well. For non-shared cars, the value is 200,000 km based on Cox et al. (Citation2020). No data on the lifetime distances among shared cars was found, so instead the average lifetime vehicle kilometers value between non-shared cars and taxis are used. The reason is that intensive use allows less time for calendar aging to occur, thus likely allowing more lifetime vehicle kilometers. An estimate for lifetime vehicle kilometers among taxis of 360,000 km was gathered from personal communication with Taxi Stockholm AB, leading to a corresponding value for shared cars being 280,000 km.
Data on the number of cars added and removed, as well as average distances driven is updated to reflect real values for 2019 and 2020 (Statistics Sweden, Citation2021; Trafikanalys, Citation2021b, Citation2021c). A forecast made by Trafikanalys (Citation2021a) estimating the number of new and removed cars is used as estimates for 2021 and 2022, as the figures are deemed to be good approximations.
2.3.2. Environmental parameters 2018
For specific direct emissions in 2018, data derived from the Swedish Transport Administration (STA) (Citation2021) is used as the starting point, which includes age group-specific values distributed between categories of vehicles. The dataset is based on information supplied by vehicle producers, and it deviates from real-world values. Therefore, the values are scaled. To get the scaling factor, total emissions from passenger cars, as reported by STA (Citation2020a) (exact figures given in personal communication), are divided by specific emissions from STA (Citation2021) multiplied by driving distances per category of vehicle and group of age, as reported by Trafikanalys (Citation2019b) taking the share of renewable fuel used into account.
Specific direct emissions are used to estimate specific direct energy use based on emissions per liter of gasoline and diesel, respectively, from STA (Citation2019). Specific energy use for 2018 among BEVs is based on the data used for the report from the Swedish Energy Agency (SEA) (Citation2019a) received through personal communication with the SEA (Citation2019a), as STA (Citation2021) did not include corresponding values. Due to lack of data in the set, PHEVs are set to have the same specific energy use as BEVs when driving electric for 2018. When PHEVS are propelled using fuels, the energy use is based on that of HEVs, adjusted. PHEVs typically weigh 150–250 kg more than HEVs (Ricardo, Citation2020), and according to Reynolds and Kandlikar (Citation2007), a 100 kg increase in weight leads to a 0.4 l/100 km increase in fuel use.
Indirect emissions from production, maintenance, and the end-of-life phases of vehicles as well as electric car battery energy storage capacity among new cars, and per kWh indirect fossil fuel emissions are based on Ricardo Result Viewer, with permission, a data file presented along with the report “Determining the environmental impacts of conventional and alternatively fueled vehicles through LCA” (Ricardo, Citation2020). The report investigates direct and indirect emissions from vehicles in a European context for 2020–2050 as part of the study. The values are (in this article) weighted to represent a 35% share of large cars/SUVs and a 65% share of smaller/mid-sized cars, based on 2020 market shares reported by BilSweden (Citation2020). Average battery storage capacity among cars already in the fleet is estimated using figures from Ricardo as well, and while this could result in an overestimation, the current installed battery capacity is negligible compared to the ones in the scenarios. Since the Ricardo dataset includes values for 2020 and 2030, the values for 2018 are estimated with linear extrapolation.
Specific indirect emissions for electric power for vehicle propulsion 2018 are based on Sandgren and Nilsson (Citation2021). The figures represent a life cycle perspective and are based on a Nordic energy mix. They include considerations of imported and exported power and correspond to the average value for 2016–2018. Specific indirect emissions from biofuel are based on the EU directive 2018/2001 on the promotion of the use of energy from renewable sources (2018), which establishes minimum GHG emissions reduction levels for the periods 2015–2020 as well as 2021 and onwards. The directive specifies conditions for how land use change effects should be considered.
The share of renewable fuel used by ICEVs and PHEVs (when in fuel use mode) is estimated to be 18.7% in 2018, based on the distances traveled by categories of cars as reported by Trafikanalys (Citation2019a) and the share of renewables commonly used in fuels of such cars (SEA, Citation2019b). PHEV UF is set to 40%, a weighted average based on PHEV UFs documented by Plötz et al. (Citation2022) in a European context for private and company cars respectively (47 and 13%). The weighting is made to account for the large difference between UFs and is based on the share of cars in the fleet that are owned by private persons and in other ways respectively (Trafikanalys, Citation2022).
2.3.3. Environmental parameters beyond 2018
For environmental parameters gathered from Ricardo (Citation2020), changes in values are derived from the same report. The figures are based on their baseline scenario, which took implemented and currently planned EU and national policies into consideration. The Ricardo dataset is used to estimate improvements in specific direct emissions from fuel use as well, which in turn is used to estimate improvements in specific energy use. Battery production emissions are 107 kg and 35 kg CO2e/kWh for 2018 and 2030 respectively, based on Ricardo (Citation2020). Important reasons behind the decrease in emissions are the de-carbonization of the European energy system, and the reduction in energy use for battery manufacturing.
For electric propulsion, improvements in specific energy use are based on figures received from SEA (Citation2019a). Changes in indirect emissions from electric power used for propulsion are based on Taljegard et al. (Citation2019). The study analyzes a range of scenarios for the electricity system in the Nordic countries and Germany, following a large-scale introduction of electric vehicles. An average of the scenario values is used, with the original scenarios in the paper by Taljegard et al differing between 86 and 112 gCO2/kWh. This means slightly different system boundaries, as compared to the values used for 2018. The difference does not affect the comparison significantly as the number of electric kilometers driven in 2018 was low.Footnote1
Finally, indirect vehicle related emissions are summarized for 2018 and 2030 in . Specific direct emissions, indirect emissions and energy use for 2018 and 2030 are shown in . When nothing else is stated, changes in environmental parameters beyond 2018 are set to be linear. Battery energy storage capacities are 82 and 85 kWh for BEVs in 2018 and 2030, respectively, and 13 kWh for PHEVs during the whole period. The PHEV UF is assumed to be constant over time.
Table 2. Indirect emissions from vehicle production, maintenance and end-of-life in 2018 and 2030, respectively (based on Ricardo, Citation2020, with modifications).
Table 3. Specific direct and indirect emissions as well as energy use in 2018 and 2030, among new cars.
2.3.4. Reflections on data use
Sources representative of the Swedish context is prioritized, but occasionally such data is not available. For example, Ricardo (Citation2020) is used to assess environmental performance with regards to several environmental aspects. That study is aimed at a wider European context and in some cases includes data that are more representative of the global level. It is difficult to know the share of new Swedish cars that originate from EU. According to BilSweden (Citation2019, p. 28) roughly 75% of new Swedish cars originate from companies based in EU. These are typically companies which have most of their production or their headquarters in Europe (BilSweden, Citation2019, p. 28). Another example is indirect emissions from electricity for electric vehicle propulsion in 2030, where the estimated value applies to the wider Scandinavia and Germany.
In the article, we aim to mix datasets from different contexts as little as possible, due to large differences between reported values. To give one example, greenhouse gas emissions from the production of vehicles differ widely, and, for example, Kawamoto et al. (Citation2019) report on emissions from gasoline and diesel cars of 5.5 tons of CO2, while Ricardo (Citation2020) reports CO2e values of 8.9–15.6 tons, depending on model and vehicle category (see, e.g., Elgowainy et al., Citation2018; Hawkins et al., Citation2013). Despite our ambition not to mix datasets, a considerable number of different sources are needed to cover the aspects explored in this article.
Furthermore, this article does not consider the relation between quantities of usage and effects per unit. An example of why this consideration could matter is given in the paper by Taljegard et al. (Citation2019), where the particularities of electrification (e.g., if cars are charged in a “smart” way) affects the emissions per unit of electric energy. While a deeper analysis of the co-variation is beyond the scope of this article, examining the relation between quantities and effects per unit is something that could be considered for future work, in particular the relation between biofuel or electric power use and the resulting specific emissions.
3. Target and current trajectory
As noted in the introduction, the selected target provides an illustrative case relevant not least to countries and regions with targets for the transport sector. The selected level used includes a 70% reduction in direct GHG emissions for the Swedish passenger car fleet by 2030, as compared to the levels in 2010. It is based on the wider target for the Swedish domestic transport sector (excluding air traffic) (Ministry of the Environment, Citation2018). Included are tailpipe emissions from fossil fuel use in vehicles, similar to the scope in the national statistics used to evaluate the official target for the transport sector, which is harmonized with the IPCC’s method guidelines (SEA, Citation2019a, p. 37). In addition, the target considered for this paper includes use of sustainable levels of biofuels (see Section 4.1).
The rate at which direct emissions have been declining since 2010 has been deemed insufficient in order to reach the 2030 target for the transport sector (Kågeson, Citation2019; Sveriges Miljömål, Citation2023; STA, Citation2020b).
A few recent developments are worth mentioning. First, between 2019 and 2022 the number of electric cars grew from 41,000 to 163,000, and their share of the new car market grew from 11 to 54%. During the same period, the total number of new cars decreased 18.5% on an annual basis (Statistics Sweden, Citation2023b). Secondly, through the policy instrument “Reduktionsplikten” (own translation: reduction obligation) a mandatory reduction of GHG intensity of fuels has been introduced. Fuel distributors need to reduce emissions from the fuel that they distribute in line with the rates (SEA, Citation2019a, p. 14). However, the Swedish government elected in September 2022, has announced their intention of substantially lowering the required emissions reduction obtained by alternative fuels.
Summing up, it is unlikely that present and proposed policies will suffice to achieve the target considered in this article. In addition, sustainable levels of biofuel use for the passenger car fleet range from 1.4 to 6.5 TWh, according to our estimates (see Section 4.1). Until recently, the trajectory suggested considerably higher levels of use (see, e.g., SOU, Citation2013; STA, Citation2020b). The gap between sustainable levels of biofuels and the need for biofuels in order to reach the transport targets indicates that further changes in the transport system are needed to reach transport emissions targets.
4. Building blocks and scenarios
4.1. Sustainable use of biofuels
Levels of biofuel use in the scenarios are selected based on two different perspectives. The first level is set so that the same use per capita would be possible on a global scale. While this is a rather restrictive level in comparison to what is used in the work of, for example, Swedish agencies, it provides one way for allocation that may be considered to be just from a global distributive justice perspective on biofuel.
IEA has developed a Sustainable Development Scenario in line with United Nations Sustainable Development Goals and the Paris Agreement for the coming decades (IEA, Citation2020a, p. 28). According to the report, the quantity of biofuels used in 2019 was 95 Mtoe (1105 TWh), and in the Sustainable Development Scenario this increases to 390 Mtoe (4536 TWh) by 2040 (IEA, Citation2020a, p. 137). Bioenergy (and biofuels) use in the scenario is aligned with earlier assessments of what is sustainable, according to the report. However, studies have suggested sustainable levels that are higher as well as lower. Assuming a linear increase, 2.9 PWh will be available in 2030. Based on the world population reaching 8.5 billion in that year (United Nations, Citation2019), and the Swedish population reaching 11 million (Statistics Sweden, Citation2020), a global per-capita allocation would leave 3.8 TWh of biofuel for Sweden.
The second level is assigned based on how much biofuel that can be produced using raw materials from Sweden. This is set to be 17.5 TWh, suggested by SEA (Citation2016), based on Börjesson (Citation2016) with minor adjustments. Residual biomass would stand for 60%–70% of this amount, assuming a similar share for residual biomass as in non-transport sectors. It could be noted that even for Sweden specifically, a range of studies exist suggesting different levels to be sustainable, ranging between 15 and 30 TWh according to STA (Citation2020b, p. 21).
In this article, biofuels are allocated between sectors based on energy use. According to SEA (Citation2020), the energy used in domestic transport 2018 amounted to 84.5 TWh, and energy delivered in Sweden and used internationally by sea and air transport amounted to 30.9 TWh. Adding the roughly 14 TWh used by non-road mobile machinery annually (SEA, Citation2016), the total level of fuel use in 2018 was roughly 130 TWh. The passenger car fleet used 47.6 TWh in 2018, constituting 37% on the basis of total energy content. Multiplying this share by the volumes of biofuels assigned from a global and Swedish perspective, respectively, leaves 1.4 and 6.5 TWh to be used by the car fleet. In the scenarios developed, we allow a deviation of 5% at most from these respective levels.
There is an ongoing discussion regarding the circumstances under which biofuels contribute to GHG emissions reductions. When alternative land use is considered, for example, growing crops for human consumption and plants or trees that sequester carbon, biofuels are not necessarily the best option from a climate point of view. A number of factors weigh in on the balance, including how the carbon sink in forests and soil and biofuel production techniques develop over time (Ambaye et al., Citation2021; Ricardo, Citation2020). It is beyond the scope of this article to make a deeper analysis of potential GHG emissions reductions from biofuel use.
4.2. Electric cars
Three scenarios for the Swedish car fleet have been published by the SEA (Citation2019a). The number of electric cars ranges from 0.8 to 2.9 million in their scenarios, illustrating what high and low rates of electric car adoption could mean. However, the increase in electric cars’ market share has surpassed those outlined by SEA. Due to this, an adjustment is made, setting the low and high levels for 2030 to 1.5 and 3 million electric cars instead.
Two out of three scenarios from SEA (Citation2019a) include high numbers of electric cars; however, the share held by BEVs varies between roughly 40 and 60% of all electric cars. In this article, these two levels are adopted to explore how the distribution between BEVs and PHEVs affects the investigated parameters.
4.3. Car sharing
SEA (Citation2019a) does not include car sharing in their scenarios. The Swedish Road Administration (Citation2003), however, estimated the theoretical potential at roughly 25% of all Swedish households. This is used as the degree of car sharing in the 2030-scenarios with a high level of car sharing in this article. The current level is considerably lower. According to SOU (Citation2020, pp. 61–71) there were 2435 shared cars in Sweden in 2019, operated by the five largest actors. Adding to this are a few thousand cars shared peer-to-peer. Recent years have seen a rapid increase in the number of cars, and number of people involved in car sharing (SOU, Citation2020, pp. 61–71). Therefore, the level car-sharing in the scenarios corresponding to a low level of car sharing is set to 2.5%, which represents a slower increase than in the high scenario but still a considerable increase from today.
The number of shared cars needed for car sharing households is calculated as the ratio between the annual average vehicle kilometers of shared cars and the average vehicle kilometers driven by car sharing households in shared cars. The latter value is set to one fourth of the average distance traveled by non-shared cars (including those using non-shared cars), in order to demonstrate that (1) those participating in car sharing typically belong to groups that drive considerably less, and (2) that average driving distance typically is reduced even further after joining car sharing schemes (see, e.g., Duncan, Citation2011; Chen & Kockelman, Citation2016; Shaheen et al., Citation2019). Based on the number of households in 2030, according to Statistics Sweden (Citation2020), and the figures explained above, the number of shared cars is set to 15,500 (low level) and 155,000 (high level).
4.4. Internal combustion engine vehicles
Total emissions and biofuel use allowed by the target of each scenario were divided by average specific emissions and specific energy use among cars, in order to derive a feasible number of fossil and bio based kilometers for each scenario. Dividing by the average annual vehicle kilometers of cars in the fleet resulted in a starting point regarding the number of ICEVs that could be sustained. As direct emissions and energy use differ between cars, the cars removed from and added to the fleet affect the number of kilometers that can be accommodated within the stipulated targets. Therefore, an iterative approach is taken to determine the number of ICEVs that could be sustained, using the model explained in Section 2.3.
As distribution between subcategories of ICEVs is not the focus of this article, shares are simply set to the average distribution among non-electric ICEV categories in the three scenarios from SEA (Citation2019a). The number of cars using ethanol and biogas as their primary fuel is set to zero because representative data are missing in the dataset used, and the effect on the investigated parameters is deemed likely to be very small, since such cars are likely to be few in Sweden by 2030 (SEA, Citation2019a).
4.5. Car access
When assigning the number of households with car access, the share of households having one, two, and three or more non-shared cars is based on BilSweden (Citation2019, p. 19), and the total share that have car access is based on Trafikanalys (Citation2017a). With the number of cars according to Trafikanalys (Citation2017b), the average number of cars among households having three or more cars is estimated to be 3.5.
For car sharing households, the share accessing cars solely by means of sharing is set to 80%, with the remaining 20% assumed to have only one non-shared car. This is roughly in line with the study by Martin et al. (Citation2010), where the number of car sharing households that owned 0 and 1 cars made up 80% and 17% respectively.
4.6. Combining building blocks into scenarios
The building blocks are combined into six different scenarios. Abbreviations will be used from this point onwards in order to make referring to the scenarios simpler. The abbreviations indicate the level of penetration from electric cars and sharing, as well as biofuel use.
For electrification, the levels are:
LowE – 1.5 million electric cars with equal shares of BEVs and PHEVs
HighE – 3 million electric cars with equal shares of BEVs and PHEVs
BEVE – 3 million electric cars whereof 60% BEVs
PHEVE – 3 million electric cars whereof 60% PHEVs
LowS – 15,500 shared cars
HighS – 155,000 shared cars
GlobalB – 1.4 TWh
SwedishB – 6.5 TWh
Table 4. The number of shared and non-shared cars in six scenarios for 2030 and in 2018 for reference.
5. Evaluating and comparing scenarios
5.1. Transport volumes and car access
All scenarios include a decrease in total kilometers traveled as compared to 2018, between 14 and 42% in total, or 21 and 47% on a per-capita basis. The transport volumes in the scenarios can be compared to forecasts which often point to an increase in transport volume. One example is the frequently used forecast from STA (2018), in which the total number of passenger kilometers traveled by car is projected to increase by 1% annually between 2014 and 2040. The total number of vehicle kilometers by the fleet in the respective scenarios is shown in .
Figure 1. Vehicle kilometers by type of energy used in the scenarios. Reference values for comparison for 2018 and 2030 from Trafikanalys (Citation2019a) and STA (Citation2020c), respectively.
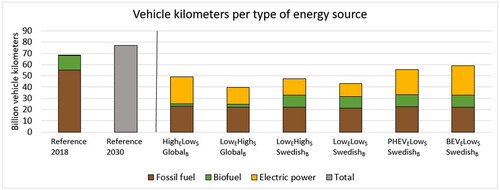
The share of electric vehicle kilometers is considerable in all scenarios, 27%–49% of total vehicle kilometers. The difference in transport volumes between the PHEVELowSSwedishB and BEVELowSSwedishB is small, despite the higher number of cars driven using electric power only. Regardless of what electric car type that dominates, a high rate of electrification contributes considerably to greater transport volumes within the considered boundaries. Still, the increase in electric vehicle kilometers is not enough to completely compensate for decreased fossil and biofuel use. A higher degree of sharing allows a slightly higher number of vehicle kilometers, notable when comparing the LowEHighSSwedishB and LowELowSSwedishB scenarios. However, it is worth noting that one of the main effects of sharing is a reduction in car travel.
While the high electrification scenarios yield the highest car access, high levels of sharing makes a significant contribution, which is most notable when comparing LowELowSSwedishB and LowEHighSSwedishB. The number of households with access to shared cars, non-shared cars, or both in the scenarios are shown in . There are differences between having access to a privately owned car and a shared car, and access to the two is therefore presented separately.
Figure 2. Number of households with access to shared and non-shared cars, shared cars only, and non-shared cars only, in the 2030-scenarios as well as an estimate for 2018. The number of shared cars in 2018 is assumed to be negligible. Reference values for 2018 from Statistics Sweden (Citation2023a) (number of households) and BilSweden (Citation2019) (share with car access).
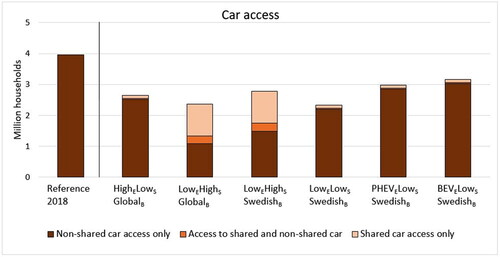
Assuming the same number of people per household as in 2018, the share of the population with car access would be considerably lower than the current levels reported by, for example, BilSweden (Citation2019) or Trafikanalys (Citation2017a). However, as the number of people with car access is estimated in a different way in this article (Section 4.5), comparison can only be indicative.
5.2. Indirect greenhouse gas emissions
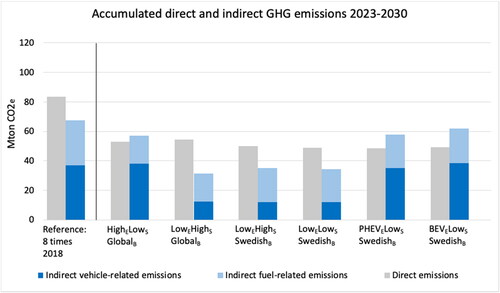
The share of indirect emissions out of total emissions was 45% in 2018. In the three scenarios with high electrification, the share is 52–56%, considering the period 2023–2030, despite a smaller vehicle fleet but due mainly to high production of electric vehicles. In the scenarios with low electrification and a very much reduced car fleet, the share has fallen somewhat (see ).
Figure 3. Accumulated direct GHG emissions and indirect fuel and vehicle cycle GHG emissions. The first column group refers to 2018 data multiplied by a factor eight to make them comparable to the following six column groups, representing accumulated emissions 2023-2030 in the six scenarios.
About 40% of emissions are covered by the EU Emissions Trading System, EU ETS. Emissions within the system require emission allowances. The emission allowances are traded on a market, and the amount of emission allowances is decreasing every year. During the current phase of EU ETS (Directive (EU) Citation2023/959), emission allowances are reduced by 62% in 2030 as compared to 2005. The EU climate policy also includes a Carbon Border Adjustment Mechanism (CBAM) connected to the EU ETS. It is expected to hinder carbon leakage through a carbon pricing system applied on energy-intensive products imported into the EU (c.f. European commission Citation2021a). Most of the indirect emissions would either occur within the European Union’s Emissions Trading System (EU ETS), or within areas covered by the suggested EU Carbon Border Adjustment Mechanism (CBAM).
Since total emissions within EU ETS have a set budget, it is hard to justify a target for emissions from subsectors of EU ETS. Instead, we argue that scenarios in line with the reduction in annual allowances issued could indicate their feasibility within the EU policy target for which the system is set in place. Hence, we compare indirect emissions reductions from the passenger car fleet with the levels set for the ETS, regardless of whether they are European or non-European emissions, and whether or not they are covered by ETS or CBAM. There is further complexity within the system that is not reflected in this approach, it is, for example, possible to transfer allowances between years, and saved allowances build up in the Market Stability Reserve (MSR). Allowances in the MSR can be annulled if a certain quantity of excess is reached (European Commission, Citation2021b). Hence the approach is a simplification, but we argue that it is reasonable with emissions from the car fleet being reduced at a pace similar to the reductions in allowances in EU ETS as a whole, in order to reach climate targets.
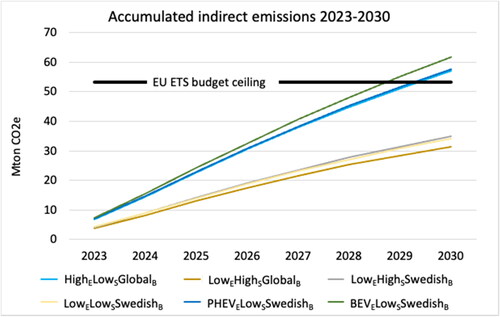
In , the accumulated indirect emissions 2023–2030 in the 2030-scenarios are compared to the EU ETS budget ceiling, provided the indirect emissions keep their share of total emissions within EU ETS. The approach has similarities to the one used by Pietzcker et al. (Citation2021), addressing the transition of the EU power system until 2030. The EU ETS budget ceiling is calculated from Pahle et al (Citation2023, Figure 1), and is based on the current regulations with a linear reduction of emission allowances from 2027 down to zero in 2039 as well as some assumptions regarding annulments of emission allowances from the market stability reserve (MSR). Since the population size in the EU is not expected to change to any greater extent between 2023 and 2030 (Eurostat, Citation2020), roughly the same numbers apply on a per-capita basis. The accumulated emissions 2023–2030 reaches the budget ceiling already around 2029 in all scenarios with high electrification, i.e. HighELowSGlobalB, PHEVELowSSwedishB and BEVELowSSwedishB (see ).
Figure 4. The accumulated indirect emissions in the scenarios 2023-2030 and a comparative “budget ceiling” for indirect emissions within EU ETS. Staying below the budget ceiling means indirect emissions do not increase beyond their current share of total emissions within EU ETS.
EU has also decided to introduce an emissions trading system for buildings and road transport. The system is expected to start in 2027, but it may be delayed. We do not take that part into account in this article.
5.3. Battery utilization and demand
The battery energy storage capacity of the fleet is determined by the number of PHEVs and BEVs. It is worth noting that even though all of the scenarios result in large increases of battery use, the difference between the scenario with the lowest battery demand and the one with the highest is more than a factor 2. Total battery energy storage capacity in the scenarios is shown in .
Table 5. Fleet total battery energy storage capacity in GWh, including an estimate for 2018 as reference, with per car battery capacities based on Power Circle (Citation2018).
While there are no target levels for battery use in Sweden, the levels in the scenarios can be placed in a global context. The IEA (Citation2020b, p. 23) estimates an increase in global demand from 170 GWh in 2020 to 1.5–3 TWh by 2030. If supply matches demand, and if the demand increase is assumed to be linear, roughly 9–16 TWh of batteries will have been supplied for use in electric vehicles between 2018 and 2030. With negligible rates of batteries reaching the end of life-phase during the time period, and a world population based on United Nations (Citation2019), global average battery capacity per capita would be 1.0–1.9 kWh. With the Swedish population in 2030 based on Statistics Sweden (Citation2020), per-capita use in the scenarios ranges from 6.6 to 15.1 kWh, 3.5–15.1 times the global average, allocated to the passenger car fleet alone.
The relatively high level of battery use and the challenges that come with batteries can be seen as a motivation for intensifying battery use. To explore how BEVs, PHEVs, and modes of use relate to battery utilization, the number of electric vehicle kilometers traveled per kWh of battery energy storage capacity and year could be a useful metric. The result of applying the metric to the scenarios is shown in . Due to uncertainty regarding how much shared PHEVs are driven using electric power, such cars are not included.
Table 6. Fleet battery utilization in the scenarios (electric vehicle km/(kWh*year)).
The high sharing scenarios have the highest number of electric vehicle kilometers per kWh and year. The BEVELowSSwedishB scenario results in the lowest number of electric vehicle kilometers per kWh, while the PHEVELowSSwedishB scenario results in a considerably higher number.
5.4. Fleet development to 2030
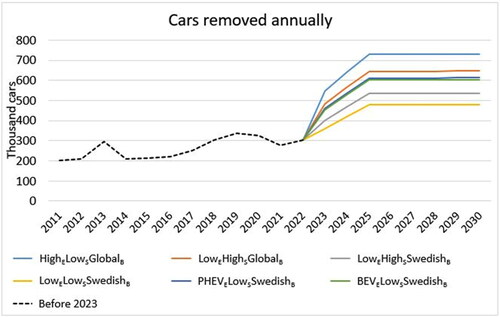
All scenarios include a decrease in the number of cars per capita, with some of them entailing particularly large reductions. This constitutes a break in the current trend of a growing vehicle fleet. The number of cars removed annually in the scenarios is shown in . A large increase in removal rate is needed to reach the scenarios, reflected by the elevated levels after 2022.
Figure 5. Total number cars removed annually between 2023 and 2030. Included are also, the historical numbers for 2011 to 2020 (Trafikanalys, Citation2019b) and a forecast from Trafikanalys (Citation2021a) for 2021 and 2022.
While average annual number of cars removed between 2023 and 2030 is much higher than historical levels in all scenarios, the numbers of cars added varies in comparison to historical levels of additions. The high electrification scenarios include a considerable increase in the number of cars added annually, while the remaining scenarios result in a decrease. The average annual removal and addition of cars for 2023–2030 as compared to the averages during 2011–2020 is shown in .
Table 7. Average annual rate of removal and addition of cars for 2023–2030 in the scenarios divided by the averages during 2011–2020.
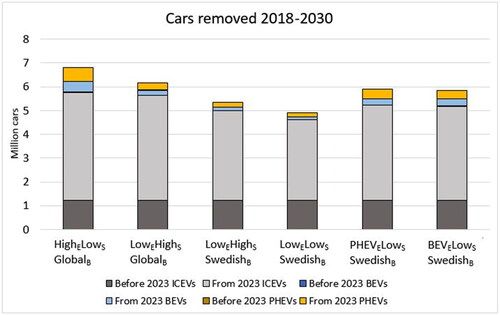
The number of cars added and removed during the whole period is shown in and , including the distribution between vehicle categories. The number of ICEVs added during 2023–2030 is low compared to the number of electric cars added in all scenarios. At the same time, ICEVs dominate among removed cars.
Figure 6. ICEVs, PHEVs, and BEVs added during 2018–2030 in the scenarios. For the years before 2023, statistics and short-term forecasts from Trafikanalys (Citation2021a) are used.
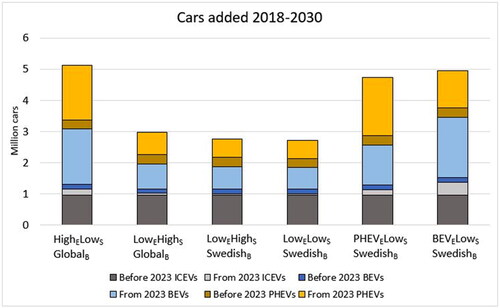
Figure 7. ICEVs, PHEVs, and BEVs removed during 2018–2030 in the scenarios. For the years before 2023, statistics and short-term forecasts from Trafikanalys (Citation2021a) are used.
The number of ICEVs added is higher in the BEVELowSSwedishB scenario than in the other scenarios. This is partly due to the low number of PHEVs, which leaves more fuel to use in ICEVs. Another reason is that low penetration of car sharing results in few vehicle kilometers per car, which means that more cars can be sustained with the same volumes of fossil fuel and biofuel. Finally, another reason is that the number of non-shared cars removed due to aging depends on the number of cars in the fleet (see Section 2.2). This demonstrates how a larger fleet means a greater total calendar wear, due to the higher number of cars.
5.5. Tradeoffs
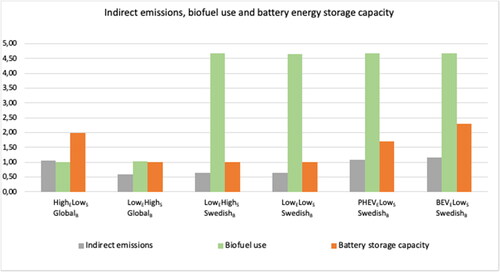
The scenarios include tradeoffs between increasing car access and travel on the one hand, and higher emissions and resource use on the other. This can be seen by comparing , which shows car access and travel distance to , which shows indirect emissions, as well as the use of biofuel and batteries.
Figure 8. Number of households with car access and total travel distance in the scenarios normalized against the scenario maximum. In 2018, the value for car access was 1.25 times index = 1, and the value for distance traveled was 1.16 times index = 1.
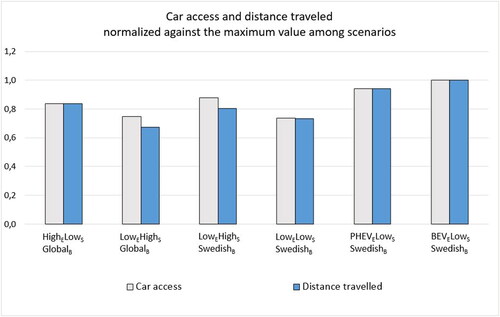
Figure 9. Accumulated indirect emissions 2023-2030, biofuel use and battery energy storage capacity in the scenarios. Indirect emissions are normalized against the long term EU ETS ceiling (see Section 5.2). Biofuel use and Battery storage capacity are normalized against the scenario minimum. In 2018, biofuel use was 6.1 times the scenario minimum, and battery storage capacity was 0.02 times the scenario minimum.
6. Discussion
6.1. Sharing
There are several potential challenges and tensions associated with the scenarios depicted in this article. One of these is reaching and maintaining the high level of car sharing characterizing some of the scenarios. While car sharing has grown in popularity in recent years, the pace would have to increase considerably. The trend could benefit from an increased focus on the climate, yet there may also be challenging countertrends, such as a continuously growing economy making more people able to afford a car of their own.
The scenarios where the level of car sharing is high have considerably lower levels of car access and transport volumes compared to present levels. Increased levels of car sharing provide car access to a greater number of people per car, and to some extent increase the transport volumes that can be accommodated within the set target, if, for example, electric and/or more efficient cars are used. Certainly, there are differences between owning a car and accessing one via car sharing, in terms of convenience and other practical aspects (Berg et al., Citation2019; Sprei & Ginnebaugh, Citation2018), and the two are not directly substitutable. However, with the fixed target we investigate here, sharing should not only be compared to owning a private car, but also with having no access at all to a car. Due to the low vehicle access, it may be the low electrification, low sharing, Swedish biofuel scenario that is the most difficult to realize.
Realizing larger reductions of kilometers traveled by car will likely need strong policy interventions, such as higher fuel taxes, a distance-based (per kilometer) tax, and investments in alternatives that make accessibility by other means of transport more advantageous (see, e.g., STA, Citation2020a for examples in a Swedish context). Providing alternatives to car use will be important in order to avoid large losses in availability and frustration among the population.
One potential tension arises from car sharing being more suitable for densely populated areas. This circumstance is an argument for increasing use of e.g. geographically differentiated costs per kilometer and/or parking fees rather than generally increased fuel taxes, in order not to produce unfair conditions and dissatisfaction among the rural population. There are other groups less suitable for car sharing as well, who may require special consideration (see, e.g., Duncan, Citation2011).
Challenges and tensions also arise in relation to emissions reductions (and sustainability advantages) of car sharing being behavior dependent. For example, the set 50% reduction in car travel needs to be sustained, and in the high sharing scenarios, this is despite a new user segment enlisting. Already today, reported reductions in vehicle kilometers among those enrolled in car sharing differ between studies; in three meta-studies the reduction ranges between 6 and 80% (Chen & Kockelman, Citation2016; Loose, Citation2015; Shaheen et al., Citation2019). Alternatives to privately owned cars need to be convenient enough to be preferred yet should not be so convenient that it leads to an increase in travel overall. Achieving this will probably require the cost of car travel to increase at the same time as measures are taken to increase the (relative) attractiveness of shared cars, with attention to the net effect achieved.
Regarding the role of electric car sharing, it has been suggested to have great potential relating to emissions reductions (see Chen & Kockelman, Citation2016; Shaheen et al., Citation2019). In order to explore whether such effects would be significant on the level of the fleet as a whole, two alternative scenarios were created out of the low electrification, high sharing, and global biofuel scenario. In the first shared cars were BEVs and in the second ICEVs, while maintaining the total numbers of cars per category in the fleet as a whole. The difference between the two scenarios in terms of life cycle emissions was small, indicating a rather limited potential for the combination (shared electric) to achieve emissions reductions on the fleet level, even with a high level of sharing.
The magnitude of the differences is linked to the relatively small share of transport volume contributed by car sharing in the scenarios. It can also be mentioned that there are indications of electric car sharing having the potential to contribute to a greater acceptance of EVs and associated technology (Schlüter & Weyer, Citation2019). Such effects are not included in this analysis. Still, emissions avoided through reductions in overall distance traveled and the higher utilization rate of specific vehicles, leading to fewer cars being needed, are less technology dependent and constitute major effects from sharing.
In this article, cars set to be shared drive longer distances during their lifetime. The underlying rationale is that more intensive use gives less time for calendar aging. Several factors weigh in, and Chen and Kockelman (Citation2016) finds that shared cars may in fact be subdued to greater wear and tear than non-shared cars. Hence, the longevity of shared cars is a potential subject of future studies, and the role of shared electric cars may be of particular interest, as some signs indicate electric car batteries are worn by calendar aging to a greater extent than by intensity of use (GEOTAB, Citation2020). In addition, anecdotal evidence is used to select the average annual distance traveled by shared cars. The average annual distance traveled by shared cars is another potential topic for the future.
Finally, previous research indicates that cars used for sharing often are younger and more energy efficient (cf. Chen & Kockelman, Citation2016; Shaheen et al., Citation2019). As a result of the model design, shared cars are roughly the same age or up to 3 years younger than non-shared cars in the scenarios. It is possible that shared cars will be comparatively younger in 2030. However, great uncertainties remain and a trend toward peer-to-peer sharing might contribute to the average age among shared cars increasing, as car owners see an opportunity for additional earnings to be made from their old cars.
6.2. Electrification
In the high electrification scenarios technological substitution dominates. That electric cars fit relatively well with the current way cars are used has been pointed to by, for example, Sperling (Citation2018) and Sprei (Citation2018). Köhler et al. (Citation2020) point to the challenge of moving to lifestyles less reliant on car-ownership despite the current strong private car regime. Still, there are barriers to the continuous increase of electric cars, including geographical distribution of power production and transmission, as well as charging infrastructure (see, e.g., Nykvist & Nilsson, Citation2015).
In addition, a question of interest that arises as electric cars continue to proliferate is: who is stuck with the rapidly value depreciating ICEVs, sustained by a fuel infrastructure in decline? It may be the rural population, who need to travel longer by car and therefore need a greater range than economically feasible electric cars can provide. The situation could be even worse if they have to rely on a poorly developed charging infrastructure. Another example of a group at risk of disbenefitting are those already economically disadvantaged, who cannot afford an electric car.
The challenges with ramping up battery production, with links to raw material availability was pointed to in the introduction. Attention needs to be directed to the development so that emissions reductions from rapid electrification of the passenger car fleets in some regions or countries does not come at the expense of reducing emissions elsewhere. The high electrification scenarios include a considerable level of use, with battery capacity in Swedish passenger cars growing to up to 15.1 times the global per capita level in 2030 (see Section 5.3). Adding the social and environmental impacts as well as the geopolitical risks related to raw material extraction and battery production (see, e.g., IEA, Citation2019b, p. 22), yields potential tensions in a development similar to the one in the high electrification scenarios. It is noteworthy that total battery capacity in the scenarios differ with a factor of two, with the highest level of use in the high BEV, low sharing, Swedish biofuel scenario and the lowest in the low electrification scenarios.
The new metric (electric vehicle km/(kwh*year)) can help clarify aspects of resource consumption, which are likely to become an increasing concern. For example, in the high PHEV scenario total battery capacity is 26% lower than in the high BEV scenario, while the total kilometers traveled is only 6% lower. Expressed using the new metric, the high PHEV scenario performs a 12% higher value, demonstrating the potential of reaching higher degrees of battery utilization through the use of PHEVs. The high sharing scenarios achieve the highest value for the metric, and the difference between high sharing (Swedish biofuel) and the high BEV scenario is 25%. This is an indicator of the potential for shared cars to increase the degree of battery utilization.
It should be noted that higher battery utilization requires PHEVs’ share of distance traveled using electricity to remain at a high level (here 40%), despite penetration of new user segments, a behavioral issue relatable to that of car sharing. The future of PHEV UFs is highly uncertain and will depend on e.g. the extent to which PHEVs are used privately, charging infrastructure development, energy prices, etc. Therefore, it is important to continuously monitor PHEV UFs. It might even be necessary to implement directed policies aimed at creating incentives for a higher share of electric propulsion.
6.3. Indirect emissions and resource use
The share of total emissions constituted by indirect emissions differs greatly between the three scenarios with high electrification and the three with low electrification. While the former have a significantly higher share for accumulated indirect emissions 2023–2030 compared to 2018, the latter have a lower share (see ). The reason is not only a higher share for electric cars, but also that the total vehicle fleet is larger in the high electrification scenarios (albeit still smaller than in 2018). Thus, the policy-recommendation by Dirnaichner et al. (Citation2022), to aim at reduced passenger car fleet size is valid (even with a high share of electric cars).
In this article, we relate all indirect emissions to the EU Emissions Trading System, EU ETS (see Section 5.2). All indirect emissions after passing the EU ETS budget ceiling will require that other sectors within EU ETS reduce their emissions more. In a way, it means that when indirect emissions pass the EU ETS-ceiling, it lowers the ceiling for other sectors, since the total EU ETS budget is in principle fixed. All three scenarios with high numbers of electric cars pass through that ceiling already around 2029. The other three seem to be quite in line with EU ETS budget with zero-emissions in 2039. This is an indication that a fast increase of electric vehicles risks coming into conflict with other sectors, regarding the available room for emissions. In this paper, this is so despite the vehicle fleet being considerably smaller than in 2023. There are implications for targets and regulations that consider the vehicle use phase only. This includes the Swedish official target as well as targets of other countries and regions aimed at the transport sector specifically (cf. International Transport Forum, Citation2018 & Citation2021). While electric cars, and low-emission cars in general are favored by the use-phase scope, potential life cycle emissions reductions from, for example, sharing are not reflected in full. Hence, there is a risk for sub-optimization in the pursuit of reducing total emissions. Therefore, targets designed to include the whole life cycle may be an alternative (see e.g. Hawkins et al., Citation2013).
In the current policy environment however, it is appropriate to complement addressing the life cycle emission of cars by addressing direct and indirect emissions separately (and therefore to set targets separately as well). The reason is that emissions within the EU ETS have direct implications on emissions allowances in other parts of the trading system, and although it could be argued that similar effects exist for any system with emissions targets, the consequences are direct in trading systems such as EU ETS. If emissions increase in one part of the system, they have to decrease in another. EU ETS can be distinguished through, for example, the legal tools available for stricter steering, the effect on the price for allowances and the linear trajectory of how emissions allowances within the system are to decrease.
The scenarios clarify the tradeoffs between a decrease in transport volumes and car access on the one hand, and high use of biofuels and batteries as well as high indirect emissions on the other ( and ). Shared cars and PHEVs can contribute to using resources more efficiently. However, local emission savings from substitution strategies entail a risk of producing challenges and tensions elsewhere. Using more resources than what is available within a region or country occurs at the expense of resource use elsewhere. This is a perspective that seems to gain marginal consideration in current policymaking and an area that we identify as in need of improvement.
Finally, accumulated indirect emissions from electric power for vehicle propulsion range between 1.1 and 2.1 Mton CO2e in the scenarios and constitute a minor part of total indirect emissions (approximately 5%). The static approach used to estimate emissions from electric power (see Section 2.3.3), therefore has marginal effect on total indirect emissions. Still, future work could clarify the effect on emissions per unit energy from introducing electric cars at various levels in the region. In addition, in other regions of the world emissions per unit of electric power are higher. In those cases, a static method to estimate emissions from electric cars might be more problematic.
6.4. Fleet development
A considerable reduction in the number of ICEVs is required to reach a state like the one in the 2030-scenarios, which may be achieved by reducing new sales and by increasing the rate of removal from the fleet. Increased rates of car removals are used to reach the 2030-scenarios in the modelling behind this article. Both strategies necessitate finding effective and acceptable policy instruments. Constraining sales of new ICEVs may be attractive from a public finance perspective, for example, but may be resisted by car manufacturers and customers.
One way to facilitate removal could be by reintroducing a scrapping premium, which existed in Sweden until 2007 (Swedish Environmental Protection Agency, Citation2018). A potential source of inspiration is Finland, where a temporary emissions-based scrapping premium has been introduced, including an even greater reward if a new low (direct) emission car, electric bike or public transport ticket is purchased in conjunction (Valtioneuvosto, Citation2021).
Increasing the number of electric cars is possible to achieve by measures aimed at increasing market shares, without increasing the total volume of new cars. However, even at the current rate of increase, the vast majority of cars to be sold in the remainder of this decade will be electric (see Section 5.4). Hence, measures aimed solely at increasing market shares will be too little, too late. With increased removal, some increase in new car sales is likely, as replacement for removed cars. Still, some scenarios require the increase in new cars to be substantial, and subsidies stimulating new electric car sales might be needed in conjunction.
It is beyond the scope of this article to determine the balance between measures aimed at increasing the number of electric cars and measures aimed at lowering the number of new ICEVs. A potential interesting venue for policy development could start out in a zero-sum system, similar to the Bonus-Malus-system operating in Sweden until recently, which favors low-emission vehicles at the expense of higher-emission vehicles (c.f. Habibi et al., Citation2019).
7. Conclusion
In this article, we explored target-fulfilling scenarios for the Swedish passenger car fleet in 2030, focusing on the role of electrification and car sharing. The general findings at each bullet point below should be relevant for high income countries.
Kilometers traveled by passenger cars need to be reduced in order to align with the above-mentioned targets. Kilometers traveled are reduced by 21%–47% per capita (by 14%–42% in total) in the scenarios compared to 2018.
The number of electric cars is important for the kilometers that can be traveled within the GHG target, and with sustainable biofuel use. The share of electric transport ranges between 27 and 49% in the scenarios.
A high number of shared vehicles is less important for travel distances, but is important for maintaining high car access.
A rapid electrification is likely to increase the share of indirect emissions, as illustrated by the three high electrification scenarios, in which this share has increased to 52–56% during the period 2023–2030 as compared to 45% in 2018. This means that the scenarios with high electrification do not match the speed at which emissions allowances within the EU ETS are reduced, despite the vehicle fleet being considerably smaller than in 2018. This points to the need of addressing life cycle emissions from cars, and shows that using emission targets focused on use-phase emissions only, could contribute to unfeasible demands for reductions in other sectors included in the EU ETS.
Total battery energy storage capacity grows in all scenarios. Starting from less than 1 GWh in 2018, it reaches between 73 and 168 GWh in the scenarios by 2030. This could result in a per capita use in Sweden 3.5–15.1 times higher than the global average.
A new metric (electric vehicle kilometers/(kWh*year)) is introduced to measure how efficiently the fleet’s total battery capacity is used. This metric demonstrates how the share of plug-in hybrid electric cars and shared battery electric cars affect the degree of battery utilization. The value varies from 166 to 208 electric vehicle kilometers/(kWh*year) among scenarios.
Current trends in fleet development will not be sufficient if the scenarios are to be reached. In the fleet-developments explored during 2023–2030, the removal rate is between 80 and 180% higher than the average levels in 2011–2020. In addition, fleet development for scenarios with a high number of electric cars include an increase in the total number of new cars per year (roughly 20%–40%), while the remaining scenarios require a decrease (roughly 40%–50%). The number of ICEVs added during 2023–2030 is low in all scenarios. Such transformations of the fleet require strong policy interventions.
Tradeoffs between biofuel use, indirect emissions, battery use, transport volumes, and car access have been visualized and highlighted. Our findings indicate that tensions may result when resource and (indirect) emission-intensive futures for the passenger car fleet are put in a wider context. The alternative is a greater focus on reducing transport volume, which is linked to car access and in turn entails other challenges. What kind of electric cars become dominant, and to what extent car sharing grows more common, including the rate of electrification among shared cars, are some of the factors affecting the tradeoffs.
Finally, this article presents two main methodological contributions:
While emissions beyond the use-phase should be considered, emissions within an emissions trading system should be presented separately from emissions not within the system and from emissions within other emissions trading systems. Emissions outside the vehicle use phase need to be considered to ensure that emissions are reduced in an absolute sense and not merely transferred to other parts of the life cycle. Still, adding life cycle emissions together may be inappropriate in situations when part of the emissions from the life cycle in question is within an emissions trading system like EU ETS. The reason is that emissions reductions within one part of the trading system have immediate implications on the emissions allowed in other parts of the system. As a consequence, we present direct emissions and indirect emissions separately, but in the same figure, in this article. Our approach entail simplifications, since some of the indirect emissions are not within EU ETS, but it is a start regarding how this can be dealt with in the future. It should also be noted that even though we claim that this is the most reasonable way of presenting data at this point in time, policy changes, such as a reform of EU ETS, could change this. For example, in the latest reform of EU ETS, it was decided to create a new emissions trading system for fossil fuels used to power cars and heat buildings from 2027.
Measuring battery use efficiency may be important for increased resource efficiency. A lack of resources for battery production is a potential challenge. We find that the use of the metric vehicle kilometers/(kWh*year) provides a step toward including a wider resource perspective when it comes to battery metals. The use of the metric focuses attention on the effective use of the batteries over time as a way of reducing excessive resource use.
Disclosure statement
None.
Additional information
Funding
Notes
1 With PHEV UF 40%, and with 0.7 and 0.2 billion VKT travelled by PHEVs and BEVs (see Trafikanalys 2019), emissions from electric power for EV propulsion in 2018 is 0.01 million metric tons of CO2. A negligible amount as compared to the total emissions.
References
- Algers, S. (2017). Bilparkens utveckling 2017–2030 med hänsyn till nya styrmedel – en simuleringsstudie.
- Ambaye, T. G., Vaccari, M., Bonilla-Petriciolet, A., Prasad, S., van Hullebusch, E. D., & Rtimi, S. (2021). Emerging technologies for biofuel production: A critical review on recent progress, challenges and perspectives. Journal of Environmental Management, 290, 112627. https://doi.org/10.1016/j.jenvman.2021.112627
- Andersson, Ö., & Börjesson, P. (2021). The greenhouse gas emissions of an electrified vehicle combined with renewable fuels: Life cycle assessment and policy implications. Appl. Energy, 289, 116621. https://doi.org/10.1016/j.apenergy.2021.116621
- Automotive News Europe. (2020). Audi pauses e-tron production on battery shortages [WWW Document]. https://europe.autonews.com/automakers/audi-pauses-e-tron-production-battery-shortages.
- Berg, J., Henriksson, M., & Ihlström, J. (2019). Comfort first ! Vehicle-sharing systems in urban residential areas: The importance for everyday mobility and reduction of car use among pilot users. Sustainability, 11(9), 2521. https://doi.org/10.3390/su11092521
- BilSweden. (2019). Bilismen i Sverige 2019. https://www.bilsweden.se/statistik/bilismen-i-sverige/2019.
- BilSweden. (2020). Var fjärde ny bil laddbar i februari [WWW Document]. https://www.bilsweden.se/statistik/Nyregistreringar_per_manad_1/nyregistreringar-2020/var-fjarde-ny-bil-laddbar-i-februari.
- BilSweden. (2021). Databas nyregistreringar [WWW Document]. https://www.bilsweden.se/statistik/databas-nyregistreringar.
- Börjeson, L., Höjer, M., Dreborg, K. H., Ekvall, T., & Finnveden, G. (2006). Scenario types and techniques: Towards a user’s guide. Futures, 38(7), 723–739. https://doi.org/10.1016/j.futures.2005.12.002
- Börjesson, P. (2016). Potential för ökad tillförsel och avsättning av inhemsk biomassa i enväxande svensk bioekonomi. Rapport. 97. Lund University. https://lup.lub.lu.se/search/files/7279231/B_rjesson_P._2016._Rapport_nr_97_Milj_och_energisystem_Lunds_Universitet.pdf
- Chen, T. D., & Kockelman, K. M. (2016). Carsharing’s life-cycle impacts on energy use and greenhouse gas emissions. Transportation Research Part D: Transport and Environment, 47, 276–284. https://doi.org/10.1016/j.trd.2016.05.012
- Cox, B., Bauer, C., Mendoza Beltran, A., van Vuuren, D. P., & Mutel, C. L. (2020). Life cycle environmental and cost comparison of current and future passenger cars under different energy scenarios. Applied Energy, 269, 115021. https://doi.org/10.1016/j.apenergy.2020.115021
- Directive (EU) 2023/959 of the European Parliament and of the Council of 10 May 2023 amending Directive 2003/87/EC establishing a system for greenhouse gas emission allowance trading within the Union and Decision (EU) 2015/1814 concerning the establishment and operation of a market stability reserve for the Union greenhouse gas emission trading system (Text with EEA relevance), https://eur-lex.europa.eu/eli/dir/2023/959/oj
- Dirnaichner, A., Rottoli, M., Sacchi, R., Rauner, S., Cox, B., Mutel, C., Bauer, C., & Luderer, G. (2022). Life-cycle impacts from different decarbonization pathways for the European car fleet. Environmental Research Letters, 17(4), 044009. https://doi.org/10.1088/1748-9326/ac4fdb
- Duncan, M. (2011). The cost saving potential of carsharing in a US context. Transportation, 38(2), 363–382. https://doi.org/10.1007/s11116-010-9304-y
- Electrive. (2020). Kia prioritises Europe over US in face of battery trouble [WWW Document]. https://www.electrive.com/2020/02/27/kia-prioritises-europe-over-the-us-in-the-face-of-battery-trouble/.
- Elgowainy, A., Han, J., Ward, J., Joseck, F., Gohlke, D., Lindauer, A., Ramsden, T., Biddy, M., Alexander, M., Barnhart, S., Sutherland, I., Verduzco, L., & Wallington, T. J. (2018). Current and future United States light-duty vehicle pathways: Cradle-to-grave lifecycle greenhouse gas emissions and economic assessment. Environmental Science & Technology, 52(4), 2392–2399. https://doi.org/10.1021/acs.est.7b06006
- Ellingsen, L. A. W., Singh, B., & Hammer Stromman, A. (2016). The size and range effect: Life-cycle greenhouse gas emissions of electric vehicles. Environmental Research Letters, 11(5), 054010. https://doi.org/10.1088/1748-9326/11/5/054010
- Emilsson, E., & Dahllöf, L. (2019). Lithium-ion vehicle battery production. Report. c444 IVL.
- European Commission. (2016). Transport emissions [WWW Document]. https://ec.europa.eu/clima/eu-action/transport-emissions_en.
- European Commission. (2021a). Carbon Border Adjustment Mechanism: Questions and Answers [WWW Document]. https://ec.europa.eu/commission/presscorner/detail/en/qanda_21_3661.
- European Commission. (2021b). Directorate-General for Climate Action, Review of the EU ETS market stability reserve: final report, Publications Office of the European Union, 2021, https://doi.org/10.2834/046513.
- European Commission. (2022). Fit for 55. https://www.consilium.europa.eu/en/policies/green-deal/fit-for-55-the-eu-plan-for-a-green-transition/#:∼:text=The%20Commission%20presented%20the%20proposal,in%20the%2fossil%20fuels%20sector.
- European Parliament. (2019). Koldioxidutsläpp från bilar i siffror (nyhetsgrafik) [WWWDocument]. https://www.europarl.europa.eu/news/sv/headlines/society/20190313STO31218/koldioxidutslapp-fran-bilar-i-siffror-nyhetsgrafik.
- Eurostat. (2020). World Population Day: Population trends up to 2100 [WWW Document]. https://ec.europa.eu/eurostat/en/web/products-eurostat-news/-/EDN-20200711-1.
- Garcia, R., & Freire, F. (2017). A review of fleet-based life-cycle approaches focusing on energy and environmental impacts of vehicles. Renewable and Sustainable Energy Reviews, 79, 935–945. https://doi.org/10.1016/j.rser.2017.05.145
- Gassner, A., Lederer, J., Kovacic, G., Mollay, U., Schremmer, C., & Fellner, J. (2021). Projection of material flows and stocks in the urban transport sector until 2050 – A scenario-based analysis for the city of Vienna. Journal of Cleaner Production, 311, 127591. https://doi.org/10.1016/j.jclepro.2021.127591
- GEOTAB. (2020). What can 6,000 electric vehicles tell us about EV battery health? [WWW Document]. URL, https://www.geotab.com/blog/ev-battery-health/.
- Gnann, T., Stephens, T. S., Lin, Z., Plötz, P., Liu, C., & Brokate, J. (2018). What drives the market for plug-in electric vehicles? - A review of international PEV market diffusion models. Renewable and Sustainable Energy Reviews, 93, 158–164. https://doi.org/10.1016/j.rser.2018.03.055
- Habibi, S., Hugosson, M. B., Sundbergh, P., & Algers, S. (2019). Car fleet policy evaluation: The case of bonus-malus schemes in Sweden. International Journal of Sustainable Transportation, 13(1), 51–64. https://doi.org/10.1080/15568318.2018.1437237
- Handelsblatt. (2020). Daimler verschärft seinen Sparkurs: Bis zu 15.000 Mitarbeiter sollen gehen [WWW Document]. https://www.handelsblatt.com/unternehmen/industrie/autokonzern-daimler-verschaerft-seinen-sparkurs-bis-zu-15-000-mitarbeiter-sollen-gehen/25522776-all.html?ticket=ST-9308396-kxu2dvZnWVCr7hBIEYWz-cas01.example.org.
- Harris, S., Mata, É., Plepys, A., & Katzeff, C. (2021). Sharing is daring, but is it sustainable? An assessment of sharing cars, electric tools and offices in Sweden. Resources, Conservation and Recycling. 170, 105583. https://doi.org/10.1016/j.resconrec.2021.105583
- Hawkins, T. R., Singh, B., Majeau-Bettez, G., & Strømman, A. H. (2013). Comparative environmental life cycle assessment of conventional and electric vehicles. Journal of Industrial Ecology, 17(1), 53–64. https://doi.org/10.1111/j.1530-9290.2012.00532.x
- Höjer, M., Gullberg, A., & Pettersson, R. (2011). Technological forecasting & social change backcasting images of the future city—Time and space for sustainable development in Stockholm. Technological Forecasting and Social Change, 78(5), 819–834. https://doi.org/10.1016/j.techfore.2011.01.009
- IEA. (2018). Global EV Outlook 2018.
- IEA. (2019a). World Energy Outlook 2019.
- IEA. (2019b). Global EV Outlook 2019.
- IEA. (2020a). Energy Technology Perspectives 2020.
- IEA. (2020b). Global EV Outlook 2020. https://doi.org/10.1787/d394399e-en
- IEA. (2022). Global EV Outlook 2022.
- International Transport Forum. (2018). Transport CO2 and the Paris Climate Agreement: Reviewing the Impact of Nationally Determined Contributions, OECD Publishing.
- International Transport Forum. (2021). Transport CO2 and the Paris Climate Agreement: Where Are We Six Years Later?
- Kågeson, P. (2019). Klimatmål på villovägar ? En ESO-rapport om politiken för utsläppsminskningar i vägtrafiken. Regeringskansliet, Finansdepartementet.
- Kawaguchi, T., Murata, H., Fukushige, S., & Kobayashi, H. (2019). Scenario analysis of car-And ride-sharing services based on life cycle simulation. Procedia CIRP, 80, 328–333. https://doi.org/10.1016/j.procir.2019.01.051
- Kawamoto, R., Mochizuki, H., Moriguchi, Y., Nakano, T., Motohashi, M., Sakai, Y., & Inaba, A. (2019). Estimation of CO2 Emissions of internal combustion engine vehicle and battery electric vehicle using LCA. Sustain, 11, 1–15. https://doi.org/10.3390/su11092690
- Köhler, J., Turnheim, B., & Hodson, M. (2020). Low carbon transitions pathways in mobility: Applying the MLP in a combined case study and simulation bridging analysis of passenger transport in the Netherlands. Technological Forecasting and Social Change, 151, 119314. https://doi.org/10.1016/j.techfore.2018.06.003
- Liljenström, C. (2021). Life cycle assessment of transport systems and transport infrastructure life cycle assessment of transport systems and transport infrastructure investigating methodological approaches and quantifying. KTH Royal Institute of Technology.
- Loose, W. (2015). The State of European Car- Sharing. Bundesverband Carsharing e. V. Final Repo, 84 https://www.eltis.org/sites/default/files/trainingmaterials/the_state_of_carsharing_europe.pdf.
- Martin, E., Shaheen, S., & Lidicker, J. (2010). Impact of carsharing on household vehicle holdings. Transportation Research Record: Journal of the Transportation Research Board, 2143(1), 150–158. https://doi.org/10.3141/2143-19
- Miljöbarometern. (2019). Antal bilpoolsbilar [WWW Document]. https://2030.miljobarometern.se/nationella-indikatorer/beteendet/bilpooler-b3h/bilpoolsbilar/.
- Ministry of the Environment. (2018). Sweden wants tougher EU targets for CO2 emissions from passenger cars [WWW Document]. https://www.government.se/press-releases/2018/06/sweden-wants-tougher-eu-targets-for-co2-emissions-from-passenger-cars/.
- Ny, H., Borén, S., Nurhadi, L., Schulte, J., Robèrt, K.-H., & Broman, G. (2018). On Track for 2030: Roadmap for a fast transition to sustainable personal transport.
- Nykvist, B., & Nilsson, M. (2015). The EV paradox - A multilevel study of why Stockholm is not a leader in electric vehicles. Environmental Innovation and Societal Transitions, 14, 26–44. https://doi.org/10.1016/j.eist.2014.06.003
- Pahle, M., Günther, C., Osorio, S., and Quemin, S. (2023, February 28). The emerging endgame: The EU ETS on the road towards climate neutrality. Available at SSRN: https://ssrn.com/abstract=4373443
- Peters, J. F., & Weil, M. (2016). A critical assessment of the resource depletion potential of current and future lithium-ion batteries. Resources, 5(4), 46. https://doi.org/10.3390/resources5040046
- Pietzcker, R. C., Osorio, S., & Rodrigues, R. (2021). Tightening EU ETS targets in line with the European Green Deal: Impacts on the decarbonization of the EU power sector. Applied Energy, 293, 116914. https://doi.org/10.1016/j.apenergy.2021.116914
- Plötz, P., Link, S., Ringelschwendner, H., Keller, M., Moll, C., Bieker, G., Dornoff, J., & Mock, P. (2022). Real-world usage of plug-inhybrid vehicles in Europe – A 2022 update on fuel consumption, electric driving, and CO2 emissions. International Council on Clean Transportation.
- Power Circle. (2018). Elbilsläget 2018. https://www.mynewsdesk.com/se/power-circle-ab/documents/elbilslaeget-2018-med-ny-prognos-85299.
- Reynolds, C., & Kandlikar, M. (2007). How hybrid-electric vehicles are different from conventional vehicles: The effect of weight and power on fuel consumption. Environmental Research Letters, 2(1), 014003. https://doi.org/10.1088/1748-9326/2/1/014003
- Ricardo, (2020). Determining the environmental impacts of conventional and alternatively fuelled vehicles through LCA. ED11344 - Issue Number 3.
- Sandgren, A., & Nilsson, J. (2021). Emissionsfaktor för nordisk elmix med hänsyn till import och export. In SMED Rapport.
- Schlüter, J., & Weyer, J. (2019). Car sharing as a means to raise acceptance of electric vehicles: An empirical study on regime change in automobility. Transportation Research Part F: Traffic Psychology and Behaviour, 60, 185–201. https://doi.org/10.1016/j.trf.2018.09.005
- SEA. (2016). Förslag till styrmedel för ökad andel biodrivmedel i bensin och diesel. Energimyndigheten. https://www.energimyndigheten.se/contentassets/c306a31d10444944818cd520bf975475/styrmedel-for-okad-anvandning-av-biodrivmedel-i-bensin-och-diesel.pdf.
- SEA. (2019a). Komplettering till Kontrollstation 2019 för reduktionsplikten. Energimyndigheten. https://www.energimyndigheten.se/globalassets/fornybart/hallbara-branslen/reduktionsplikt/kontrollstation-2019.pdf.
- SEA. (2019b). Drivmedel 2018. Bromma, Energimyndigheten. https://www.energimyndigheten.se/globalassets/statistik/drivmedel-2018.pdf.
- SEA. (2020). Energiläget 2020. https://www.energimyndigheten.se/globalassets/statistik/energilaget/energilaget-i-siffror-2020.xlsx.
- Shaheen, S., Cohen, A., & Farrar, E. (2019). Carsharing’s impact and future. In Advances in transport policy and planning (1st ed.). Elsevier Inc. https://doi.org/10.1016/bs.atpp.2019.09.002
- SOU. (2013). Fossilfrihet på väg. SOU 2013:84. Stockholm, Sweden.
- SOU. (2020). Motorfordonspooler – på väg mot ökad delning av motorfordon. SOU 2020:22, Stockholm, Sweden.
- SOU. (2021). I en värld som ställer om Sverige utan fossila drivmedel. SOU 2021:48. Stockholm, Sweden.
- Sperling, D., Pike, S., Chase, R., & Shaheen, S. (2018). In D. Sperling (Ed.), Three Revolutions: Steering automated, shared, and electric vehicles to a better future (pp 1–76). Island Press. https://doi.org/10.5822/978-1-61091-906-7
- Sprei, F. (2018). Disrupting mobility. Energy Research & Social Science, 37, 238–242. https://doi.org/10.1016/j.erss.2017.10.029
- Sprei, F., & Ginnebaugh, D. (2018). Unbundling cars to daily use and infrequent use vehicles—the potential role of car sharing. Energy Efficiency. 11(6), 1433–1447. https://doi.org/10.1007/s12053-018-9636-6
- STA. (2019). Handbok för vägtrafikens luftföroreningar. https://bransch.trafikverket.se/for-dig-i- branschen/miljo–-for-dig-i-branschen/Luft/Dokument-och-lankar-om-luft/handbok-for-vagtrafikens-luftfororeningar/.
- STA. (2020a). Trafikverkets Miljörapport 2020. Swedish Transport Admininstration: Borlänge http://trafikverket.diva-portal.org/smash/record.jsf?pid=diva2%3A1548629&dswid=-556.
- STA. (2020b). Scenarier för att nå klimatmålet för inrikes transporter. http://trafikverket.diva-portal.org/smash/record.jsf?pid=diva2%3A1548629&dswid=-556.
- STA. (2020c). Trafikverkets Basprognoser 2020-06-15. https://bransch.trafikverket.se/for-dig-i-branschen/Planera-och-utreda/Planerings–och-analysmetoder/Samhallsekonomisk-analys-och-trafikanalys/Kort-om-trafikprognoser.
- STA. (2021). Vägtrafikens utsläpp 2020. Swedish Transport Administration: Borlänge https://bransch.trafikverket.se/contentassets/7ce1527807fa44ff9aa195ab440d5184/pm-vagtrafikens-utslapp-220207.pdf.
- Statistics Sweden. (2020). Befolkningsframskrivning efter födelseregion, kön och år: V. 2020040809:30. https://www.scb.se/hitta-statistik/statistik-efter-amne/befolkning/befolkningsframskrivningar/befolkningsframskrivningar/.
- Statistics Sweden. (2021). Fordonsstatistik [WWW Document]. https://www.scb.se/hitta-statistik/statistik-efter-amne/transporter-och-kommunikationer/vagtrafik/fordonsstatistik/.
- Statistics Sweden. (2023a). Antal hushåll efter region och år [WWW Document]. https://www.statistikdatabasen.scb.se/pxweb/sv/ssd/START__BE__BE0101__BE0101S/HushallT05/table/tableViewLayout1/.
- Statistics Sweden. (2023b). Nyregistrerade fordon [WWW Document]. https://www.scb.se/hitta-statistik/statistik-efter-amne/transporter-och kommunikationer/vagtrafik/fordon/.
- Sveriges Miljömål. (2023). Utsläpp av växthusgaser från inrikes transporter [WWWDocument]. https://www.sverigesmiljomal.se/etappmalen/utslapp-av-vaxthusgaser-fran-inrikes-transporter/.
- Swedish Environmental Protection Agency. (2018). Producentansvar för bilar [WWW Document]. https://www.naturvardsverket.se/vagledning-och-stod/producentansvar/producentansvar-for-bilar/.
- Swedish Road Administration. (2003). Gör plats för svenska bilpooler! https://trafikverket.ineko.se/Files/sv-SE/10560/RelatedFiles/2003_88_gor_plats_for_svenska_bilpooler.pdf.
- Taljegard, M., Göransson, L., Odenberger, M., & Johnsson, F. (2019). Impacts of electric vehicles on the electricity generation portfolio – A Scandinavian-German case study. Applies Energy, 235, 1637–1650. https://doi.org/10.1016/j.apenergy.2018.10.133
- Trafikanalys. (2010). Fordon 2009. https://www.trafa.se/vagtrafik/fordon/.
- Trafikanalys. (2017a). RVU Sverige - den nationella resvaneundersökningen 2015–2016. https://www.trafa.se/kommunikationsvanor/RVU-Sverige/.
- Trafikanalys. (2017b). Körsträckor 2016. https://www.trafa.se/vagtrafik/fordon/.
- Trafikanalys. (2018). Korttidsprognoser för vägfordonsflottan 2018 [WWW Document]. (vagtrafik). https://www.trafa.se//prognoser-for-fordonsflottans-utveckling-7462/.
- Trafikanalys. (2019a). korstrackor_2018_reviderad. https://www.trafa.se/vagtrafik/korstrackor/.
- Trafikanalys. (2019b). Fordon 2018. https://www.trafa.se/vagtrafik/fordon/.
- Trafikanalys. (2020). Vägfordonsflottans PM utveckling till år 2030 2020:7. Stockholm.
- Trafikanalys. (2021a). Korttidsprognoser för vägfordonsflottan 2021 [WWW Document]. https://www.trafa.se/vagtrafik/korttidsprognoser-for-vagfordonsflottan-2021-12283/.
- Trafikanalys. (2021b). Körstrackor 2020. https://www.trafa.se/vagtrafik/korstrackor/.
- Trafikanalys. (2021c). Fordon 2020. https://www.trafa.se/vagtrafik/fordon/.
- Trafikanalys. (2022). Fordon 2021. https://www.trafa.se/vagtrafik/fordon/.
- United Nations. (2019). Probabilistic Population Projections based on the World Population Prospects 2019. Rev, 1.
- Valtioneuvosto (2021)., Ändring av lagen om skrotningspremie träder i kraft. https://valtioneuvosto.fi/sv/-/andring-av-lagen-om-skrotningspremie-trader-i-kraft.