
 ?Mathematical formulae have been encoded as MathML and are displayed in this HTML version using MathJax in order to improve their display. Uncheck the box to turn MathJax off. This feature requires Javascript. Click on a formula to zoom.
ABSTRACT
Historical city centres are critical-built environments prone to earthquake risk because of the features of the complex network of Architectural Heritage, facing Open Spaces (OSs) and the users hosted by them. Structural measures, such as building retrofitting actions, and non-structural measures, like emergency and evacuation planning, could be jointly set up to improve the safety of the Historical Built Environments since they aim to face the effects of damage across the OSs and so on the users’ movement. This work adopts a simulation-based approach to assess the individual and combined efficiency of these structural and non-structural measures. Risk indices focused on the evacuation process are used to this end, considering the final effects on the users’ movement and safety. Results show how seismic retrofitting strategies could be located in critical “hot-spots” in the urban fabric to additionally support the evacuation plan, thus reducing implementation efforts for the stakeholders.
1. Introduction
Historical city centres are complex Built Environment characterised by a compound and stratified network of Architectural Heritage, Open Spaces among them (i.e. streets and squares) and hosted users (Rus, Kilar, and Koren Citation2018; Martina Russo et al. Citation2020; José L. P. Aguado, Ferreira, and Lourenço Citation2018). Thus, when a disaster strikes such a Historical Built Environment (HBE), the risk level depends on the interactions between the hazard-related conditions, the morphological and constructive features of the Architectural Heritage and the Open Spaces, their cultural, artistic, economic and social value, as well as the variety and interconnection of hosted functions affecting the hosted users’ exposure (Gavarini Citation2001; Martino et al. Citation2016; Martins et al. Citation2020; Romão and Paupério Citation2021). The definition of effective Disaster Risk Reduction (DRR) and Disaster Risk Management (DRM) measures should jointly take into account these elements, thus understanding the correlation between the disaster event, its consequences on the HBE depending on its vulnerabilities, and its effects on the hosted users in immediate emergency and post-disaster response phases (Tiago M. Ferreira et al. Citation2020).
Such an approach is particularly important in the case of sudden-onset disasters, such as earthquakes, flash floods, and fires, because they are unpredictable, and their effects quickly arise by provoking direct and indirect threads for the exposed users (French et al. Citation2019; PreventionWeb — UNDRR Citation2020). The Open Spaces (OSs) in the HBE play a pivotal role at the urban scale since they can represent the effective network used by (1) users to leave the riskiest parts of the HBE and restore safety conditions through the evacuation process, and by (2) rescuers to access the HBE and support the damaged users (M. Rus, Kilar, and Koren Citation2018; Russo et al. Citation2021; Zhao et al. Citation2017).
In this general context, earthquakes undoubtedly represent one of the challenging sudden-onset disasters in the context of HBE (Gavarini Citation2001). Like for other urban-scale disasters, such as for example for floods (English et al. Citation2019; Lumbroso and Davison Citation2018) and fires (Durak, Erbil, and Akıncıtürk Citation2011; Granda and Ferreira Citation2019; Veeraswamy et al. Citation2018), the risk level in the OSs as well as in the HBE as a whole is firstly affected by the combination between the physical vulnerability of the elements composing the HBE and the severity of the hazard, thus implying risks for the hosted users, especially in the immediate emergency response phases, i.e. the evacuation (Bernardini, D’Orazio, and Quagliarini Citation2016; Der Sarkissian et al. Citation2020; French et al. Citation2019; Shrestha, Sliuzas, and Kuffer Citation2018).
Firstly, besides the direct effects in terms of economic losses and life losses due to the building damage, the combination between the earthquake severity and the Architectural Heritage vulnerability also affects the damage grade across the OSs (Bernardini, Lucesoli, and Quagliarini Citation2020; Lagomarsino Citation2006; José L. P. Aguado, Ferreira, and Lourenço Citation2018). Different levels of OSs availability by users moving on foot or rescuers moving by vehicles can appear because of the façade damage and the related debris. Such damage grade can vary from slight (small debris due to non-structural elements such as plasters, cornices, decorations and chimneys) to heavy (up to the complete blockage of the OSs in consequence of the deposition of debris resulting from building collapses). Slight damage mainly and limitedly slows down the users’ evacuation speed (Lu et al. Citation2019). Heavy damage can also hinder users’ evacuation and rescuers’ access processes in smaller or wider areas of the HBE, and also trapping people (Santarelli et al. Citation2018a). The higher the damage grade, the more long-lasting the effect in the post-disaster and recovery phases (Goretti and Sarli Citation2006). Different previous works have tried to trace the vulnerability-earthquake severity-damage grade-debris entity correlation using expeditious methods, which are simultaneously quick to apply and reliable. In view of the above, DRR and DRM measures should be calibrated before the disaster to reduce the negative impacts of the earthquake on the whole HBE system and on each composing OS, moving down to an acceptability grade according to prevention, preparedness, emergency response, and recover criteria given by consolidated guidelines and approaches (Raikes et al. Citation2019).
Hence, understanding the building vulnerability is essential to moving towards structural measures for DRR (PreventionWeb — UNDRR Citation2020). These measures usually adopt engineering techniques and technologies to improve the resistance and resilience against the hazard. In the earthquake context, they mainly include the seismic retrofitting of the Architectural Heritage (Tiago Miguel De Matteis et al. Citation2020; Ferreira, Maio, and Vicente Citation2017; Petrovčič and Kilar Citation2020) and the identification or creation of evacuation shelters, which the population can use in the aftermath of an earthquake (Hu, Sheu, and Xiao Citation2014; Yao et al. Citation2021). Although structural measures seem to be the best way to reduce the direct losses on the population as well as the effects on the OSs and on the evacuation paths network at both short and longer terms, their implementation is essentially affected by strong coordination between all the stakeholders in the HBE (including both public and private entities), as well as significant costs (Bernardini, D’Orazio, and Quagliarini Citation2016). To this end, focused interventions could be promoted in the HBE, starting from the identification of “hotspots” in the urban fabric where the damage effects seem to be more sensible for the whole OSs and HBE risk. However, these approaches to structural measures should be firstly supported by non-structural measures aimed at encouraging private–public partnership and private initiative, including specific policies and laws, building codes, land-use planning regulations, and insurance programs.
At the same time, other non-structural measures involving preparation and evacuation planning, as well as public risk-awareness programs, could significantly support DRR and DRM (Bernardini, D’Orazio, and Quagliarini Citation2016; Kaveh, Javadi, and Moghanni Citation2020; Lu et al. Citation2019; Yao et al. Citation2021). As for other disasters at the single-building scale, such as in the case of fires (Marrion Citation2016), emergency and evacuation planning assumes a paramount role in increasing the safety of the HBE and its users. Besides the series of actions from the rescuers’ standpoint, they mainly include the definition of gathering areas and evacuation paths to be used by the HBE users. As a consequence, they can be ideally adapted depending on the effective scenario to be faced in terms of damage, and thus on the vulnerability of the buildings, which depends on the aforementioned structural measures implementation (Giuliani, De Falco, and Cutini Citation2020; Italian technical commission for seismic micro-zoning Citation2014). Such non-structural measures are more flexible and involve lower implementation costs than most of the structural measures. Nevertheless, an effective design of the emergency and evacuation plan in an HBE should not be only based on a proper users’ information and awareness campaign but also the proper emergency scenario assessment considering both the physical elements and the users’ evacuation behaviours (Bernardini, D’Orazio, and Quagliarini Citation2016).
Most of the current approaches and practices to emergency and evacuation planning as non-structural measures do not include such factors in a merged manner. This can affect the assessment of the combined effect of the structural and non-structural measures. As for other disasters affecting a single building (e.g., fires (Caliendo et al. Citation2020)) or urban areas (e.g. floods (Lumbroso and Davison Citation2018)), earthquake emergency simulation models can be used to point out which probable phenomena can mainly affect the user–user and the user–HBE interactions during the evacuation process (D’Orazio et al. Citation2014; Kimms and Maiwald Citation2018; Lu et al. Citation2019). Input scenarios conditions in terms of earthquake severity can be correlated to different structural and non-structural measures separately or jointly. The effects of seismic retrofitting interventions on the emergency and evacuation process can be assessed in light of the enhancement of the users’ safety across the OSs and the whole HBE. Users’ awareness of the evacuation plan can also be simulated by moving from adopting “spontaneous” evacuation behaviours up to “guided” evacuation conditions. In this way, this performance-based methodology can allow decision-makers to look for the best balance between structural and non-structural measures depending on the efforts and effectiveness of their combination.
This paper adopts this simulation-based standpoint to compare the effectiveness of structural and non-structural measures for earthquake risk reduction in the context of the HBE. Existing methodologies for building vulnerability and damage assessment (thus relating to structural measures) and evacuation simulation (thus relating to non-structural measures) are combined. The simulation-based approach enables the representation of the effects of different measures in the HBE and on its users by assessing their separated and combined effectiveness according to quantitative risk indexes. The indexes are focused on the assessment of the probable outdoor emergency and evacuation process conditions in view of the significance of interactions between the users, the OSs and the level of damage across them. A significant case-study application is investigated to provide evidence of the approach capability
2. Methods
The work is composed of three main parts: (1) building vulnerability assessment to provide input data for damage (debris) scenario prediction, to trace the bases for structural measures regarding the physical elements of the HBE; (2) simulation of the evacuation process considering the damage scenario of the HBE, to trace the bases for non-structural measures correlated to the emergency evacuation plan; (3) assessment of risk-reduction measures in a separated and combined manner, based on the previous assessment actions. The method is applied to a significant case study (the historical centre of Coimbra, Portugal) where different scenarios of structural and non-structural measures are investigated.
2.1. Building vulnerability and damage assessment leading to structural measures
The buildings’ vulnerability is assessed here using the index-based approach proposed by (Tiago M. Ferreira, Vicentea, and Varum Citation2014). Differently from the well-known (Benedetti and Petrini Citation1984)’s methodology that served as the basis and inspiration to (Tiago M. Ferreira, Vicentea, and Varum Citation2014)’s approach, this latter is not targeted to the entire building, but only to assess the seismic vulnerability of the façade wall. The interest in “isolating” the façade wall and assessing its vulnerability as a discrete element lies in the fact that the inadequate seismic response of these elements is often responsible for significant human and economic losses, as well as the blockage of evacuation paths and the isolation of urban areas as a result of buildings debris across the OSs (José Luís Palomino Aguado Citation2017).
According to this approach — which was recently recalibrated by (Tiago Miguel Ferreira, Maio, and Vicente Citation2017) for the Portuguese context based on real damage data–, individual vulnerability is measured utilising an index that is obtained as the weighted sum of the 13 evaluation parameters given in , each of which related to 4 classes, Cvi, of increasing vulnerability: A, B, C, and D. The relative importance of each parameter is also taken into account through the weighting factor pi, as in EquationEquation (1)(1)
(1) .
Table 1. Vulnerability index methodology: parameters, associated classes and weights
Based on the above-presented vulnerability index, , it is then possible to estimate the level of damages that each building façade is likely to suffer and, from that, the volume of debris resulting from seismic events of a specific magnitude. The experimental-based method proposed by (Santarelli, Bernardini, and Quagliarini Citation2018) is used to this end. The debris depth d [m] generated by a façade wall can be calculated by resorting to EquationEquation (2)
(2)
(2) , where
is the vulnerability of the façade wall — refer to EquationEquation (1)
(1)
(1) –, w [d] is the width of the facing OS, and
and
[-] are the ratios between the earthquake Moment Magnitude and the maximum expected value for the area (or region), and between the height of the façade and w.
The space in front of the building is considered blocked by debris whenever the value of the debris depth d is larger than the width w of the facing OS.
2.2. Evacuation process simulation leading to non-structural measures
The simulation of the evacuation process is performed according to an existing and previously validated microscopic model to assess the evacuation process under different conditions in terms of non-structural and structural measures. This microscopic approach allows considering interactions between each user, other users and the physical elements of the HBE during the evacuation process. The full description of the model is offered by (D’Orazio et al. Citation2014), and a summary of the main features is provided below in consideration of the goals of this work.
The model adopts a Social Force Model (SFM)-based approach to the users’ movement in the OSs in the HBE (Lakoba, Kaup, and Finkelstein Citation2005), that is combined with an agent-based modelling module that ensures the representation of different evacuation behaviours by each of the users (Bernardini, Lovreglio, and Quagliarini Citation2019). The model considers that users can exit the building where they are located. Percentages of users’ participation in the earthquake can be imposed depending on the earthquake intensity considered for the simulation, according to the EMS-98 approach, and thus considering the possible damage of buildings (Grünthal Citation1998). Then, users move in the OSs in the HBE toward a gathering area according to two main possibilities, ensuring the possible inclusion of non-structural measures effects. In “spontaneous” evacuation conditions, people are “not aware” of the evacuation plan, and they will move far from debris and gather into the nearest free of debris area. In “guided” evacuation conditions, people are “aware” of the plan and will try to move towards the nearest gathering area defined by the plan itself through the shortest available path. These “guided” conditions can be effectively implemented by users’ awareness and training campaigns, wayfinding signs, and rescuers’ deployment in the OSs of the HBE (Bernardini, Lovreglio, and Quagliarini Citation2019; Yasufuku et al. Citation2017).
Considering both “spontaneous” and “guided” conditions and in relation to the effects of structural measures, users are assumed to: (1) adopt safety behaviours towards buildings and debris, thus maintaining a local safety distance from physical elements of the HBE; (2) avoid using paths blocked by debris. Users adapt their local velocity and motion direction depending on attractive and repulsive SFM-based forces between other pedestrians (i.e., trying to remain close with users moving in the same direction but avoiding collisions with them). They also try to maximise their individual evacuation speed, considered as equal to 2.1 ± 0.5 m/s (Gaussian distribution), depending on the interactions mentioned above. Since the model adopts a probabilistic approach to motion interaction solving, a set of at least 10 simulations has to be performed, and evacuation simulation outcomes should be investigated by considering their statistical significance (i.e. average values, percentage-based value) (D’Orazio et al. Citation2014).
2.3. Assessment of risk-reduction measures
The effectiveness of risk reduction measures is assessed according to a performance-based approach using data on the evacuation process simulation as one of the main inputs, in view of the impacts of HBE scenario conditions and risk-reduction measures on the users’ safety in the OSs (Bernardini, D’Orazio, and Quagliarini Citation2016). In particular, this work focuses its attention on the risk evacuation of gathering areas in the evacuation plan. According to general criteria for evacuation safety assessment (Caliendo et al. Citation2020; Lumbroso and Davison Citation2018) and to earthquake-oriented assessment (Bernardini, D’Orazio, and Quagliarini Citation2016), the following risk indicators are considered and combined into macroscale and microscale risk indexes RI according to the Analytical Hierarchy Process approach (Saaty Citation1980). The macroscale RI is used to summarise the earthquake risk for the whole HBE considered in the simulation process, while the microscale RI assesses the risk level for each gathering area in the HBE.
Once a user has reached a gathering area, he/she is considered in a “safe” position where to remain and be supported by rescuers. Thus, the evacuation time Te [s] allows tracing the time during which the users can be exposed to critical scenario conditions while evacuating. To avoid the effects of latecomers who can be affected by specific individual features, interaction in motion or initial critical position (D’Orazio et al. Citation2015; Shiwakoti, Sarvi, and Rose Citation2008), Te is here evaluated considering 95% of users arrived at the gathering area. In addition, Te is rounded by 5s according to the standard deviations of the results. Lower Te, lower the threats for the users arriving at a gathering area.
The number of users arrived at a gathering area at the end of the simulation time Ntot [persons] expresses how many users will reach these safety conditions. The value can also be expressed in percentage terms regarding the whole number of simulated users Ntot,perc [%]. For each gathering area in the HBE, absolute Nga [persons] and percentage Nga,perc [%] values are assessed. The evacuation curve can also be considered to generally depict the users’ arrival at the gathering areas over simulation time. The higher the Ntot, the less significant the debris-users interactions in the evacuation process or the higher the effectiveness of the evacuation plan in case of “guided” conditions.
At the same time, higher Nga implies more significant crowding effects in the gathering areas. In order to quantify them, the occupancy rate Or [-] in the gathering area is calculated. It summarises the possibility that users who arrived at a gathering area can remain in it and wait for the rescuers’ arrival without critical conditions in terms of physical contact. Or is calculated as in EquationEquation (3)(3)
(3) :
where ai is the minimum area of a standing user without physical contact with other individuals, equal to 0.3 m2 (Klüpfel and Meyer-König Citation2014) and Aga and Ad,ga are respectively the whole area and the area of debris [m2] into the gathering area ga. This value is capped by 1 to point out maximum crowding conditions inducing physical contact between standing users.
The risk along the paths to reach a gathering area is expressed according to two main indicators. The tortuosity T [-] traces the ratio between the minimum linear path length of a user and his/her simulated trajectory. Thus, T≥ 1. The higher T, the higher the influence of local crowding and debris characterisation. The path risk index Pga,p [-] is calculated according to EquationEquation (4)(4)
(4) , considering a given ga and for a specific path p leading to it:
where Ap and Ad,p are respectively the whole area and the area of debris [m2] into the path p and Nga,p is the number of people using p to reach the ga. In this sense, Pga,p considers the interaction between the users and the debris across p towards ga, by ideally considering all the users as contemporarily placed over p, thus pursuing a conservative approach in the risk assessment, which can maximise the impact of these interactions. For a given ga, the overall paths risk P [-] is then defined as the sum of the related Pga,p.
resumes the results of the Analytical Hierarchy Process for the RI evaluation (performed by https://bpmsg.com/ahp/, last access: 05/07/2021). According to a pairwise comparison between the risk indicators, each risk indicator is associated with a weight corresponding to its importance in the RI. In particular, Te is considered as less important than other indicators because it is more important that users do not experience critical interactions with the other evacuees and the debris. On the contrary, the most important risk indicators are Or and Pga,p since they resume the effective interactions between the users’ flow and between the users’ flow and the debris into the OSs in the HBE. According to the above pairwise comparison, the outcoming consistency ratio is equal to 2.7%<10%, thus lower than the acceptability threshold. The same weights are used for both the macro and the micro-scale RI, but each risk indicator is normalised depending on the micro or macro scale of application, as shown in . The normalisation is performed: (a) at the macroscale, by considering different alternative scenarios in terms of structural and non-structural measures, so as to rank the overall risk conditions and assess the effectiveness of the measures for the whole HBE; (b) at the microscale, by considering different alternative scenarios, as for the microscale comparison, and/or the different ga in the same scenario, so as to assess the effectiveness in respect of the different OSs into the HBE. RI is then calculated as the sum of risk indicators multiplied by their related weight, and it ranges from 0 to 1 (maximum risk level).
Table 2. Analytical Hierarchy Process for the risk index evaluation. Additional notes to perform comparisons at the macroscale and microscale levels are provided
In addition to the risk indicators mentioned above, the position of users placed out of a gathering area is also considered in risk assessment so as to point out where people can spontaneously gather because of surrounding critical conditions due to building damage and HBE configuration (e.g., path length) (Santarelli et al. Citation2018b; Shrestha, Sliuzas, and Kuffer Citation2018). This analysis also ensures assessing if areas should be added in the evacuation plan or their position should be modified to better rescue people where they can “spontaneously” gather.
2.4. Structural and non-structural measures in the context of the case study
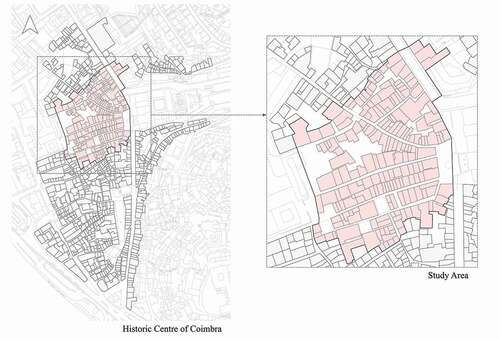
In this work, the Historic Centre of Coimbra — one of the oldest and most important Portuguese cities due to its historical and cultural significance — is used as a case study to apply the methodology described above. As reported by (Vicente, Ferreira, and Da Silva Citation2015), this historic centre is characterised by a complex and irregular urban fabric full of ancient unreinforced masonry buildings (potentially seismically vulnerable) located in narrow streets and winding alleys, characteristics that make it a particularly interesting HBE to the analysed in the scope of this research.
The analysis is performed considering the area displayed in . This area is characterised by unsafe critical conditions in respect of the urban centre, resulting from the coexistence of (1) an exceptionally irregular urban fabric and (2) a set of buildings that are particularly vulnerable to seismic events due to their age and structural characteristics.
Figure 1. Identification of the study area.
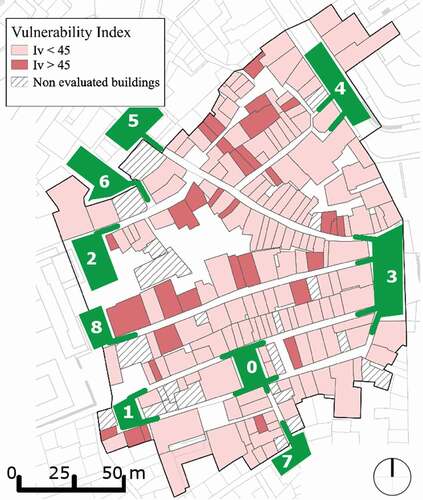
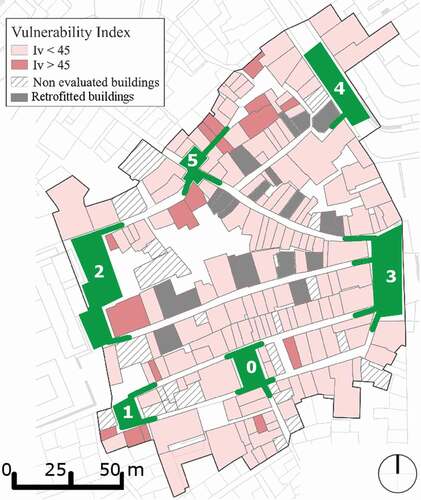
shows the HBE layout considering in the simulations by outlining the building vulnerability according to the proposed vulnerability index and identifying the gathering areas’ position with their identification codes used below. These gathering areas are located in the HBE by considering the widest OSs (i.e. largest squares), which can attract the users during the evacuation process because of their lower interference levels with possible debris from the facing buildings (Bernardini, Lovreglio, and Quagliarini Citation2019; Italian technical commission for seismic micro-zoning Citation2014; Shrestha, Sliuzas, and Kuffer Citation2018). Some of the gathering areas (namely 2, 3, 4, 7, 8) are also located at the boundaries of the analysed areas, thus being directly accessible by rescuers in the immediate aftermath by the main streets network. According to an in-situ survey on the population density in the considered area, simulations consider 1200 users, who are homogeneously distributed in the HBE layout.
Figure 2. Case study HBE layout: building vulnerability and position of gathering areas (in green, including identification code).
The following scenarios s are then simulated to compare measures effectiveness by using RI:
s1: “spontaneous” evacuation conditions (people not aware of the original evacuation plan) and current building vulnerability (see ). This can be assumed as the “worst” scenario in terms of adopted measures.
s2: “guided” evacuation conditions (people aware of the original evacuation plan) and current building vulnerability (see ). This scenario allows exposed users to react during the immediate aftermath adequately. Substantial efforts on physical vulnerability can be avoided, but major complexities due to the awareness campaign towards the population exist;
s3: “guide” evacuation conditions by revising the evacuation plan used in s1 and s2, but still considering the current building vulnerability. This scenario depends on the results of the s2 since the gathering areas are reorganised to consider the OSs that effectively attract evacuees according to the scenario s1 results. In this sense, when Nga,p < 10%, the related gathering area is deleted or merged if another one is located nearby. As for s2, it has a limited required structural effort but could imply users’ awareness and guidance needs;
s4: “guided” evacuation conditions according to the evacuation plan in s3 and retrofit interventions at the “hot-spots” in the HBE. “Hotspots” are the critical buildings mainly interfering with the evacuation process across the OSs. This can be assumed as the “base” conditions in terms of adopted measures and focused efforts for structural measures.
These scenarios are also defined according to the capabilities of adopted models for both building vulnerability and damage assessment and for evacuation process simulation, as discussed above.
Finally, according to a conservative approach for damage assessment, all the scenarios consider an earthquake magnitude of 5.6 Mw, thus referring to the maximum local magnitude of historical earthquakes in Coimbra. The maximum simulation time is assumed to be equal to 350s. This time value is the one needed by a user moving in “non-emergency” conditions (1 m/s) to go across the overall HBE over its OSs.
3. Results and discussion
Results on the considered simulated scenarios are firstly traced starting from the original conditions of the HBE, that is, by referring to s1 and s2, thus providing basic insights for scenario s3 and s4 organisation. The second part of the section introduces s3 and s4 results and then compares and discusses all the results outcomes by focusing on the Risk Index (RI)-based assessment.
In this general context, compares the evacuation curve for the considered scenarios, while respectively trace the risk indicators and their normalisation at the microscale (that is, for each gathering area ga) and macroscale. Finally,displays the RI results for the scenarios, both at the microscale and the macroscale.
Table 3. Simulation results for the considered risk indicators, in the different tested scenarios s, and by considering the microscale assessment for each gathering area and the macroscale assessment. “-“ means that the gathering area has been removed from the evacuation plan. *: the ga is merged in s3 and s4; **: the ga in s3 and s4;is placed nearby the one in s1 and s2.
Table 4. Simulation results for the considered normalised risk indicators, in the different tested scenarios s, and by considering the microscale assessment for each gathering area and the macroscale assessment. “-“ means that the gathering area has been removed from the evacuation plan. *: the ga is merged in s3 and s4; **: the ga in s3 and s4;is placed nearby the one in s1 and s2.
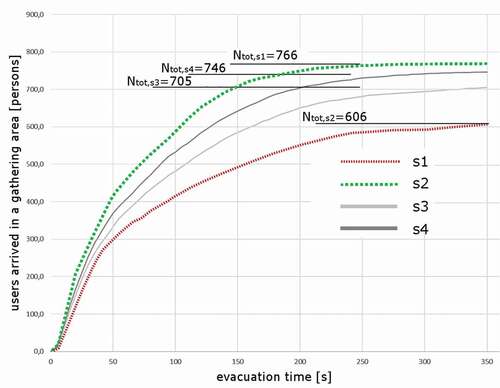
Figure 3. Evacuation curves for the considered scenarios: the worst scenario in terms of Ntot is shown in red, while the best is represented in green.
3.1. Simulation outcomes for structural and non-structural measures definition
Scenario s1 refers to “spontaneous” evacuation conditions (people not aware of the original evacuation plan) and current building vulnerability (see ). The related simulation results point out that 606 persons are able to reach a gathering area, which represents about 50% of the whole simulated population. shows the number of users arriving at a gathering area over time. Te (considering the 95% of users arrived at the gathering area) is equal to 220s. Although the last simulated user arrives in a gathering area at the end of the simulation, a horizontal trend of the evacuation curve can be noticed for time values above the Te threshold. This trend remarks that the last tails in the evacuation process can be related to latecomers (D’Orazio et al. Citation2015; Ronchi et al. Citation2013; Shiwakoti, Sarvi, and Rose Citation2008). Their evacuation process could be affected by their significant initial distance from the gathering area or from repulsive-related phenomena with debris and other users along the path. These users’ conditions do not affect the overall process trend.
) shows the use of the gathering areas ga (green ga have Nga,perc≥10% while yellow ga have Nga,perc<10%) and the main position of users placed out of a gathering area (assuming again the places collecting at least 10% of non-arrived users), according to spontaneous gathering phenomena considered in the simulation model. In scenario s1, people placed along the longer street prefer not to continue the evacuation process but spontaneously gather in the first available part of the OSs (including the streets), where building damage and debris allows them to stop. In fact, as shown by , the effects of debris on the OSs are mainly noticed along the streets, while the squares and so the gathering areas are marginally occupied by debris (<10% of their Aga). Furthermore, the debris presence highly impacts the P values, as shown in . P is higher for those gathering areas of which paths are affected by the higher debris areas (mainly ga 5).
Figure 4. Oss usage for gathering purposes according to the original evacuation plan, for: (a) s1; (b) s2. Gathering areas (and their accesses) are highlighted in green when Nga,perc≥10% and in yellow when Nga,perc<10%. “Spontaneous” gathering areas are shown: in blue, for those placed along the streets; in violet, for those placed at the crossroads.
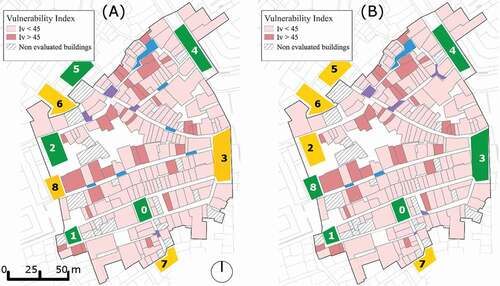
Figure 5. Streets debris evaluation for the current building vulnerability, by showing streets with >50% (red) and <50% (yellow) of the area occupied by debris. Streets blockage positions induced by debris are also shown by “X”. All the gathering areas are marginally occupied by debris (<10%).
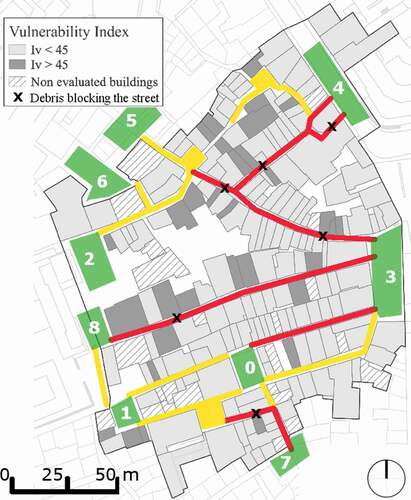
Given the above, some of the ga in the evacuation plan shown in (i.e. ga 6, 7, 8) are not effectively reached by the individuals. These areas are mainly placed: (1) at the end of the longest streets in the HBE layout (i.e. ga 8), or (2) at the HBE boundaries, near another ga placed into the HBE (i.e. ga 7), or (3) near to relevant crossroads (i.e. ga 6). Due to their marginal role in the evacuation process (Nga,perc ≤1%), these ga are not assessed for s1 conditions, as also shown in . All the other gathering areas are not affected by overcrowding (see Or<1 in ). At the same time, some users placed at a short distance from one of these ga prefer to remain at the nearest wider spaces (e.g. at a crossroad, as for violet areas in ). Finally, some users placed at a short distance from one of these ga prefer to remain at the nearest wider spaces (e.g. at a crossroad, as for violet areas in ).
Making people aware of the ga position seems to increase the safety of the individuals if considering the Ntot value, as shown by the green curve in . In s2, 766 users can arrive at a ga, which is + 26% comparing to s1. In s1, many users spontaneously stopped along the streets or in a crossroads connected to a nearby gathering area, as shown by comparing blue and violet areas in and the path blockage points (“X” symbols) in . In s2, these users are aware of the near ga, and so they move towards them and reach them. Therefore, the number of people out of the gathering areas decreases (see blue and violet areas in )), the evacuation flow increases, and Te slightly decreases (−23% in respect of s1) but have the same trend as s1 (see ). As for s1, all the other gathering areas are not characterised by overcrowding conditions (see the Or<1 in ).
According to such results and considering that “guided” conditions can indeed increase the safety of the users through Ntot, the non-structural measures proposal about the reorganisation of the evacuation plan can be based on s2-related areas where people effectively gather. The ga 6 and ga 7 is still not used by at least 10% of the users and thus can be removed from the plan. They are pretty close to other gathering areas (i.e. ga 2 and ga 5 for ga 6; ga 0 for ga 7), so the related users can be guided towards these areas indeed. The ga 5 still has most people gathering in the near crossroad placed into the HBE. Thus, the ga 5 can be moved to this position. Finally, ga 2 and ga 8 could be merged since they are placed nearby. This choice can also support the rescuers’ actions since users can be hence grouped in the same OSs.
Similarly, considering s1 and s2, results about the path blockage positions depending on buildings debris suggest where “hot spots” are placed in the urban fabric, and so where structural measures should be focused. Three building retrofitting solutions aimed at reducing the likelihood of the out-of-plane collapse of the façade wall and, in this way, the deposition of debris, are considered in this work:
Improvement of the wall-to-wall connections through effectively tying walls together with steel tie-rods: Ties have been extensively used for the seismic retrofitting of ancient buildings by connecting opposing walls. Although timber tie beams can also be used, they are typically composed of steel rods with diameters normally ranging between 16 and 20 mm fastened to the masonry walls through steel anchor plates whose dimensions should also be carefully defined in order to avoid shear failure of the masonry (see ). When properly executed, this retrofitting technique allows for enhancing the “box behaviour” of the building, reducing the likelihood of out-of-plane instability and collapse. As illustrated in , steel tie rods are typically introduced beneath floors to avoid interferences with the habitable spaces.
Improvement of the wall-to-floor connections employing steel angle brackets anchored to walls through steel connectors and anchor plates: The strengthening of the connections between old timber floors and masonry walls is traditionally achieved with the use of timber wedges, which ensure a tight mechanical connection between the joists and the walls (Tiago Miguel Ferreira, Mendes, and Silva Citation2019). Whenever these timber wedges are not present — which is relatively frequent in ordinary historical buildings like those investigated in this work–, the implementation of this technique involves installing metal brackets, steel straps and ties to connect the timber floors to the walls (see ).
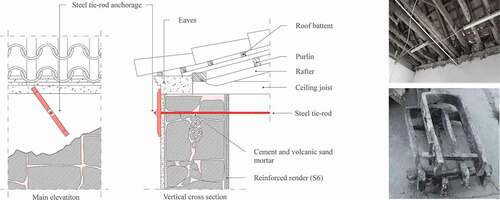
Enhancement of the structural performance of the roofing system through the installation of steel tie-rods underneath the ceiling joists: This solution is similar to the above-described improvement of the wall-to-wall connections, but, in this case, the steel tie-rods are installed at the roof level. These ties, placed underneath the ceiling joists, allows sustaining any horizontal thrust forces that may be generated in the event of an earthquake. The details and an example of the application of this technique are illustrated in .
Figure 6. Improvement of the wall-to-wall connections using steel tie rods. Adapted from (Tiago Miguel Ferreira, Maio, and Vicente Citation2017).
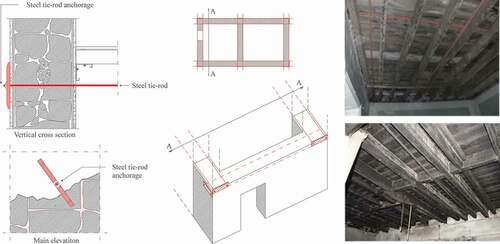
Figure 7. Improvement of the wall-to-floor connections through steel angle brackets. Adapted from (Tiago Miguel Ferreira, Maio, and Vicente Citation2017).
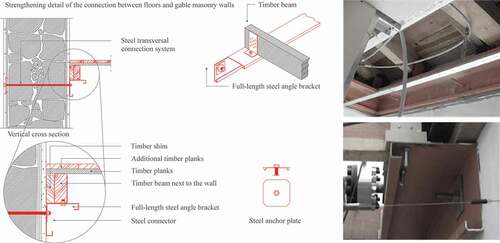
Figure 8. Improvement of the wall-to-roof connections using steel tie rods. Adapted from (Tiago Miguel Ferreira, Maio, and Vicente Citation2017).
In view of the above, resumes both the evacuation plan reorganisation (to be considered in both s3 and s4) and the buildings to be retrofitted according to the interventions mentioned above (to be only considered in s4).
Figure 9. Revised evacuation plan: new position of gathering areas (and their accesses) according to s1 and s2 outcomes. Building to be retrofitted in s4 are also shown.
3.2. Effectiveness of structural and non-structural measures
The reorganisation of the evacuation plan according to seems to be the first fundamental measure to reduce the users’ risk in the case study HBE. In fact, s3 is characterised by the arrival of 705 users at a ga (−8% in comparison to s2) while s4 by 746 users (−3% in comparison to s2), implying an increase of the number of arrived evacuees >16% in respect of “spontaneous” evacuation conditions from s1. Ntot in s3 and s4 decreases because of the smaller number of ga. As shown by it is worthy of notice that, in both s3 and s4: (1) Te are similar to those of the other scenarios; (2) Nga,perc are pretty similar and always close or higher than 10% as the considered reference threshold; (3) the crowding effects in the gathering areas are not relevant as shown by Or. From a simple Ntot-Te standpoint, such results demonstrate that reducing the number of gathering areas does not affect the overall process and simplifies the rescuers’ access to exposed users.
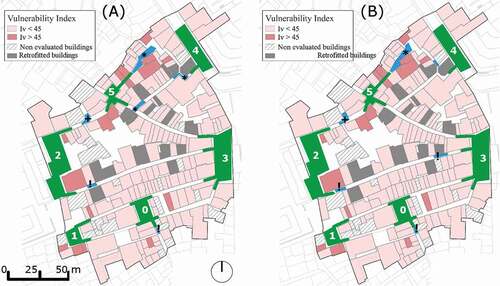
In s3, shows how the non-structural measures by themselves can also reduce the number of users placed out of a ga at the end of the simulation (see the blue areas )). In s4, supporting the evacuation plan reorganisation with buildings retrofitting at the “hot-spots” can additionally reduce these issues, as shown by . In both s3 and s4, we can notice that:
some areas where people still spontaneously gather are still affected by the building debris (see the blue areas marked by * in ). The relevance of these areas decreases in s4 (see ). These areas can be considered as additional “hot-spots” to be solved according to the aforementioned structural measures;
some other areas where people still spontaneously gather are close to the ga 8 (see the blue areas marked by ! in ). Wayfinding signs could be placed here to remark the position of a near ga, or rescuers could be sent to these areas to support the users while moving to the ga itself;
only one area (marked by * in ) remains an attractor for the users’ evacuation, being the wider crossroad in its part of the HBE. The wayfinding problem could be faced here as for the point mentioned above.
Figure 10. Oss usage for gathering purposes according to the revised evacuation plan as in , for: A- s3 and B- s4. “Spontaneous” gathering areas are shown in blue and identified by: *, for areas similar to s1 and s2; +, for those placed near to a deleted gathering area; !, for close to a new gathering area.
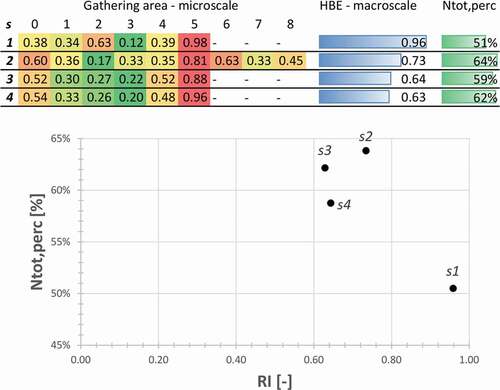
RI also remarks on the risk reduction given by s3 and s4 as shown by and considering the macroscale results. Each macroscale RI is calculated herein by normalising the risk indicators by the maximum values in all the scenarios. A reduction up to about −30% is reached in s4 in respect of s1, which, as expected, is the riskiest scenario. At the same time, the RI-Ntot,perc scatterplot at the bottom of graphically underlines how all the risk-reduction measures increase Ntot,perc and reduce RI. Although s2 seems to have the higher Ntot,perc, its RI is about 10% higher than the one in s4. In all the scenarios, the impact of Te and T seems to be limited (see the small, normalised, variation of these macroscale values in ), while the highest impact (in terms of variation between the scenarios) is given by P. The reason essentially relies on the combined impact between the debris presence and the attractiveness of the ga in terms of arrived users. In s4, the debris presence is the less significant of all the simulated scenarios and the evacuation flows towards the gathering areas can be optimised, thus leading to the lowest normalised P values.
Figure 11. Summary of RI results at the microscale and macroscale, by stressing, on the bottom, the correlation between RI and Ntot,perc in the four scenarios.
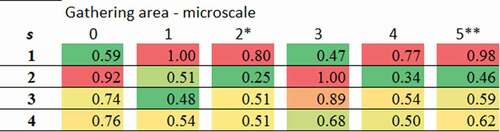
Similar remarks to the proposed RI can relate to the microscale standpoint. The upper part of shows the RI results by normalising the risk indicators for the given scenario (thus, results should be analysed according to a horizontal view, that is, line by line). In s3 and s4, some gathering areas are merged (i.e. ga 2 and ga 8) or placed nearby the one considered in s1 and s2 (i.e. ga 5). However, the risk indicators and the RI can still effectively describe the scenarios conditions since they normalise the conditions of the ga in respect of its effective features. In all the scenarios, the riskiest ga is the ga 5. As expected, this result is mainly due to P (see ), which assesses the combined impact between the debris presence and the attractiveness of the ga in terms of arrived users.
Finally, resumes the analysis of RI by normalising the values considering each ga in the different scenarios (thus according to a column-by-column view). These results also remark that the riskiest scenario is s1, which is characterised by 4 maximum ga-related RI values over 6. In this way, the results confirm that the proposed assessment methods can also be used to compare the performance of the same OS in different boundary conditions in terms of non-structural and structural measures.
Figure 12. Summary of RI results at the microscale and macroscale, by stressing, on the bottom, the correlation between RI and Ntot,perc in the four scenarios. *: the ga is merged in s3 and s4; **: the ga in s3 and s4; is placed nearby the one in s1 and s2.
4. Conclusions
Historical Built Environments (HBEs) are relevant scenarios for natural hazards, especially in the case of urban contexts, due to their complex morphological, constructive, and functional features. Earthquakes undoubtedly represent one of the most challenging disasters to be faced by adequate risk reduction measures. Structural and non-structural measures are well defined in this background, but methods to assess their effectiveness should be improved.
This work adopts a performance-based approach for risk reduction measures evaluation, using a simulation model to represent the HBE conditions during the immediate earthquake response. The model jointly considers the physical vulnerability (to simulate the earthquake-induced damage) and the users’ behaviours in an emergency (to simulate the evacuation process). It focuses on the network of streets and squares in the HBE because of the paramount role of such Open Spaces (OSs) during the first emergency phases. Simulation results are then assessed through a novel risk index used at both the microscale (that is, considering each of the investigated OSs) and the macroscale (considering the whole HBE). The risk of each OS used as gathering areas is evaluated by considering the debris and users’ presence inside it and along their related evacuation paths. Several scenarios comprising different levels of risk reduction measures are investigated by focusing on (1) the evacuation plan and the users’ awareness as main non-structural measures, and (2) the building retrofitting as a structural measure. In this work, non-structural measures are considered to be applied before structural ones in view of their lower practical implementation efforts and ideal adaptation to different HBE conditions and events. A significant case study application is then provided to compare them (the historical centre of Coimbra, Portugal).
Results show how non-structural measures seem to significantly impact the HBE safety since they can allow users to evacuate towards a safe condition in one of the gathering areas. This work demonstrates that the simulation of original HBE scenario conditions (that is, according to the original emergency plan and building vulnerability) could help safety planners reorganise the gathering areas to reduce their number while improving their positions, which should depend on the probable users’ access availability. Limiting the number of gathering areas can also boost the rescuers’ actions, focusing them on the HBE layout. To this aim, although if targeted on a few critical “hotspots” over the OSs, structural measures can also reduce the risks in the OSs and increase the number of users who can arrive at a gathering area. For instance, considering the case study application, retrofitting interventions are just calibrated on about 10% of buildings placed along the most significant paths affected by negative interferences between users and earthquake-induced damages during the evacuation. However, according to the risk reduction measures combinations assumed for the performed simulations, this work results show that non-structural measures seem to reduce of about −20% the original risk level. In comparison, their association with non-structural measures lead to a smaller risk reduction (about −30%). Future works should apply the methodology on other case studies and other structural/ non-structural measures combinations to possibly derive general trends in the impact ratio between these risk reduction measures.
Hence, the proposed performance-based approach can support both First Responders and Local Administration to assess risks in the HBE and coordinate actions aimed at Disaster Risk Reduction (DRR) and Management (DRM). The latter will take advantage of simulation-based analysis to encourage public and private stakeholders to perform building retrofitting interventions starting from the “hot-spots” in the urban fabric, while the former will consider the effects of structural measures on the OSs damage to assess the evacuation plan effectiveness through simulation models based on the users’ behaviour representation. It is worthy of notice that this work mainly aims to verify the effects of risk reduction measures on the evacuation process by itself. Therefore, methods to verify economic aspects for structural measures (i.e., cost assessment of building retrofitting interventions; public-private support) and users’ awareness and preparedness for non-structural methods (e.g., organisation of dissemination activities about the emergency plan; implementation of wayfinding signs across the OSs) should be addressed in future research. In this sense, users’ social and individual vulnerability in the HBE should be more deeply included. Since this work considers average evacuation behaviours and responses to demonstrate the approach capabilities, future steps should improve the description of specific individual features (e.g. effective motion abilities of users; cultural and economic factors affecting risk perception and preparedness) and consider these issues into the performance-based approach. This action will increase the reliability of the application of the methods with reference to the specific case studies.
Disclosure statement
No potential conflict of interest was reported by the author(s).
References
- Aguado, J. L. P., T. M. Ferreira, and P. B. Lourenço. 2018. The use of a large-scale seismic vulnerability assessment approach for masonry façade walls as an effective tool for evaluating, managing and mitigating seismic risk in historical centers. International Journal of Architectural Heritage 12 (7–8):1259–75. doi:https://doi.org/10.1080/15583058.2018.1503366.
- Aguado, J. L. P. 2017. Vulnerability assessment as a tool to mitigate and manage seismic risk in old urban areas, University of Minho.
- Benedetti, D., and V. Petrini. 1984. On seismic vulnerability of masonry buildings: Proposal of an evaluation procedure. L’industria Delle Construzioni 18:66–78.
- Bernardini, G., M. D’Orazio, and E. Quagliarini. 2016. Towards a ‘Behavioural Design’ approach for seismic risk reduction strategies of buildings and their environment. Safety Science 86 (July):273–94. doi:https://doi.org/10.1016/j.ssci.2016.03.010.
- Bernardini, G., M. Lucesoli, and E. Quagliarini. 2020. Sustainable planning of seismic emergency in historic centres through semeiotic tools: Comparison of different existing methods through real case studies. Sustainable Cities and Society 52 (January):101834. doi:https://doi.org/10.1016/j.scs.2019.101834.
- Bernardini, G., R. Lovreglio, and E. Quagliarini. 2019. Proposing behavior-oriented strategies for earthquake emergency evacuation: A behavioral data analysis from New Zealand, Italy and Japan. Safety Science 116 (July):295–309. doi:https://doi.org/10.1016/j.ssci.2019.03.023.
- Caliendo, C., P. Ciambelli, R. Del Regno, M. G. Meo, and P. Russo. 2020. Modelling and numerical simulation of pedestrian flow evacuation from a multi-storey historical building in the event of fire applying safety engineering tools. Journal of Cultural Heritage 41 (January):188–99. doi:https://doi.org/10.1016/j.culher.2019.06.010.
- D’Orazio, M., E. Quagliarini, G. Bernardini, and L. Spalazzi. 2014. EPES – Earthquake pedestrians׳ evacuation simulator: A tool for predicting earthquake pedestrians׳ evacuation in urban outdoor scenarios. International Journal of Disaster Risk Reduction 10 (PA). Elsevier:153–77. doi:https://doi.org/10.1016/j.ijdrr.2014.08.002.
- D’Orazio, M., S. Longhi, P. Olivetti, and G. Bernardini. 2015. Design and experimental evaluation of an interactive system for pre-movement time reduction in case of fire. Automation in Construction 52 (April). Elsevier B.V.:16–28. doi:https://doi.org/10.1016/j.autcon.2015.02.015.
- De Matteis, G., V. Corlito, M. Guadagnuolo, and A. Tafuro. 2020. Seismic vulnerability assessment and retrofitting strategies of Italian masonry churches of the Alife-Caiazzo diocese in caserta. International Journal of Architectural Heritage 14 (8):1180–95. doi:https://doi.org/10.1080/15583058.2019.1594450.
- Der Sarkissian, R., C. Abdallah, J. M. Zaninetti, and S. Najem. 2020. Modelling intra-dependencies to assess road network resilience to natural hazards. Natural Hazards 103 (1). Springer Science and Business Media B.V.:121–37. doi:https://doi.org/10.1007/s11069-020-03962-5.
- Durak, S., Y. Erbil, and N. Akıncıtürk. 2011. Sustainability of an architectural heritage site in Turkey: Fire risk assessment in Misi village. International Journal of Architectural Heritage 5 (3):334–48. doi:https://doi.org/10.1080/15583051003642721.
- English, E. C., M. Chen, R. Zarins, P. Patange, and J. C. Wiser. 2019. Building resilience through flood risk reduction: The benefits of amphibious foundation retrofits to heritage structures. International Journal of Architectural Heritage, December:1–9. doi:https://doi.org/10.1080/15583058.2019.1695154.
- Ferreira, T. M., N. Mendes, and R. Silva. 2019. Reducing the seismic vulnerability of existing buildings: Assessment and retrofit. Buildings 9 (6):148. doi:https://doi.org/10.3390/buildings9060148.
- Ferreira, T. M., R. Maio, and R. Vicente. 2017. Analysis of the impact of large scale seismic retrofitting strategies through the application of a vulnerability-based approach on traditional masonry buildings. Earthquake Engineering and Engineering Vibration 16 (2):329–48. doi:https://doi.org/10.1007/s11803-017-0385-x.
- Ferreira, T. M., R. Vicentea, and H. Varum. 2014. Seismic vulnerability assessment of masonry facade walls: Development, application and validation of a new scoring method. Structural Engineering and Mechanics 50 (4):541–61. doi:https://doi.org/10.12989/sem.2014.50.4.541.
- Ferreira, T. M., X. Romão, P. B. Lourenço, E. Paupério, and N. Martins. 2020. Risk and resilience in practice: Cultural heritage buildings. International Journal of Architectural Heritage, May:1–3. doi:https://doi.org/10.1080/15583058.2020.1759007.
- French, E. L., S. J. Birchall, K. Landman, and R. D. Brown. 2019. Designing public open space to support seismic resilience: A systematic review. International Journal of Disaster Risk Reduction 34 (March). Elsevier:1–10. doi:https://doi.org/10.1016/j.ijdrr.2018.11.001.
- Gavarini, C. 2001. Seismic risk in historical centers. Soil Dynamics and Earthquake Engineering 21 (5):459–66. doi:https://doi.org/10.1016/S0267-7261(01)00027-6.
- Giuliani, F., A. De Falco, and V. Cutini. 2020. The role of urban configuration during disasters. A scenario-based methodology for the post-earthquake emergency management of Italian historic centres. Safety Science 127 (February). Elsevier:104700. doi:https://doi.org/10.1016/j.ssci.2020.104700.
- Goretti, A., and V. Sarli. 2006. Road network and damaged buildings in urban areas: Short and long-term interaction. Bulletin of Earthquake Engineering 4 (2):159–75. doi:https://doi.org/10.1007/s10518-006-9004-3.
- Granda, S., and T. M. Ferreira. 2019. Large-scale vulnerability and fire risk assessment of the historic centre of Quito, Ecuador. International Journal of Architectural Heritage, September:1–15. doi:https://doi.org/10.1080/15583058.2019.1665142.
- Grünthal, G. 1998. European macroseismic scale 1998 (EMS-98), Vol. 15. Luxembourg: Cahiers Du Centre Européen de Géodynamique et de Séismologie 15. Centre Européen de Géodynamique et de Séismologie.
- Hu, Z.-H., J.-B. Sheu, and L. Xiao. 2014. Post-disaster evacuation and temporary resettlement considering panic and panic spread. Transportation Research Part B: Methodological 69. Elsevier Ltd:112–32. doi:https://doi.org/10.1016/j.trb.2014.08.004.
- Italian technical commission for seismic micro-zoning. 2014. Handbook of analysis of emergency conditions in urban scenarios (Manuale per l’analisi della condizione limite dell’emergenza dell’insediamento urbano (CLE); in Italian), Edited by F. Bramerini, and S. Castenetto. 1st ed. Rome, Italy: BetMultimedia 978-88-97457-00-8 .
- Kaveh, A., S. M. Javadi, and R. M. Moghanni. 2020. Emergency management systems after disastrous earthquakes using optimization methods: A comprehensive review. Advances in Engineering Software 149 (July). Elsevier:102885. doi:https://doi.org/10.1016/j.advengsoft.2020.102885.
- Kimms, A., and M. Maiwald. 2018. Bi-objective safe and resilient urban evacuation planning. European Journal of Operational Research 269 (3):1122–36. doi:https://doi.org/10.1016/j.ejor.2018.02.050.
- Klüpfel, T., and H. Meyer-König. 2014. PedGo guardian: An assistant for evacuation decision making. In Pedestrian and evacuation dynamics 2012, ed. U. Weidmann, U. Kirsch, and M. Schreckenberg, 445–54 978-3-319-02446-2 . Switzerland: Springer International Publishing. https://link.springer.com/book/10.1007/978-3-319-02447-9.
- Lagomarsino, S. 2006. On the vulnerability assessment of monumental buildings. Bulletin of Earthquake Engineering 4 (4):445–63. doi:https://doi.org/10.1007/s10518-006-9025-y.
- Lakoba, T. I., D. J. Kaup, and N. M. Finkelstein. 2005. Modifications of the Helbing-Molnar-Farkas-Vicsek social force model for pedestrian evolution. Simulation 81 (5):339–52. doi:https://doi.org/10.1177/0037549705052772.
- Lu, X., Z. Yang, G. P. Cimellaro, and Z. Xu. 2019. Pedestrian evacuation simulation under the scenario with earthquake-induced falling debris. Safety Science 114 (April). Elsevier:61–71. doi:https://doi.org/10.1016/j.ssci.2018.12.028.
- Lumbroso, D., and M. Davison. 2018. Use of an agent-based model and Monte Carlo analysis to estimate the effectiveness of emergency management interventions to reduce loss of life during extreme floods. Journal of Flood Risk Management 11 (January):S419–S433. doi:https://doi.org/10.1111/jfr3.12230.
- Marrion, C. E. 2016. More effectively addressing fire/Disaster challenges to protect our cultural heritage. Journal of Cultural Heritage 20 (July). Elsevier Masson SAS:746–49. doi:https://doi.org/10.1016/j.culher.2016.03.013.
- Martino, A., F. Fatiguso, G. De Tommasi, and J. Casal. 2016. Accidental impacts on historical and architectural heritage in port areas: The case of brindisi. International Journal of Architectural Heritage, June. doi:https://doi.org/10.1080/15583058.2016.1204486.
- Martins, A. N., A. A. Pereira, C. Forbes, J. L. M. P. de Lima, and D. Matos. 2020. Risk to cultural heritage in baixa pombalina (Lisbon downtown) - A transdisciplinary approach to exposure and drivers of vulnerability. International Journal of Architectural Heritage, April:1–23. doi:https://doi.org/10.1080/15583058.2020.1745322.
- Petrovčič, S., and V. Kilar. 2020. Design considerations for retrofitting of historic masonry structures with externally bonded FRP systems. International Journal of Architectural Heritage, December:1–20. doi:https://doi.org/10.1080/15583058.2020.1853278.
- PreventionWeb - UNDRR. 2020. Accessed January 10. https://www.preventionweb.net/terminology#D.
- Raikes, J., T. F. Smith, C. Jacobson, and C. Baldwin. 2019. Pre-disaster planning and preparedness for floods and droughts: A systematic review. International Journal of Disaster Risk Reduction 38 (May). Elsevier Ltd:101207. doi:https://doi.org/10.1016/j.ijdrr.2019.101207.
- Romão, X., and E. Paupério. 2021. An indicator for post-disaster economic loss valuation of impacts on cultural heritage. International Journal of Architectural Heritage 15 (5):678–97. doi:https://doi.org/10.1080/15583058.2019.1643948.
- Ronchi, E., E. D. Kuligowski, P. A. Reneke, R. D. Peacock, and D. Nilsson. 2013. The process of verification and validation of building fire evacuation models, NIST Technical Note 1822.
- Rus, K., V. Kilar, and D. Koren. 2018. Resilience assessment of complex urban systems to natural disasters: A new literature review. International Journal of Disaster Risk Reduction 31 (January). Elsevier Ltd:311–30. doi:https://doi.org/10.1016/j.ijdrr.2018.05.015.
- Russo, M., M. Angelosanti, G. Bernardini, E. Cantatore, A. D’Amico, E. Currà, F. Fatiguso, G. Mochi, and E. Quagliarini. 2020. Morphological systems of open spaces in built environment prone to sudden-onset disasters. International Conference on Sustainability in Energy and Buildings SEB 2020, Split, Croatia, 1–10.
- Russo, M., M. Angelosanti, G. Bernardini, E. Cantatore, A. D’Amico, E. Currà, F. Fatiguso, G. Mochi, and E. Quagliarini. 2021. Morphological systems of open spaces in built environment prone to sudden-onset disasters. In Sustainability in energy and buildings 2020 (Part of the smart innovation, systems and technologies book series - SIST, Volume 203 – 2190-3018), ed. J. Littlewood, R. J. Howlett, and L. C. Jain, 321–31. Singapore: Springer. doi:https://doi.org/10.1007/978-981-15-8783-2_27.
- Saaty, T. L. 1980. The analytic hierarchy process: Planning, Priority Setting, Resource Allocation. In Priority setting. Resource allocation. London: MacGraw-Hill, New York International Book Company 978-0070543713 .
- Santarelli, S., G. Bernardini, and E. Quagliarini. 2018. Earthquake building debris estimation in historic city centres: From real world data to experimental-based criteria. International Journal of Disaster Risk Reduction 31 (October):281–91. doi:https://doi.org/10.1016/j.ijdrr.2018.05.017.
- Santarelli, S., G. Bernardini, E. Quagliarini, and M. D’Orazio. 2018. New indices for the existing city-centers streets network reliability and availability assessment in earthquake emergency. International Journal of Architectural Heritage 12 (2):153–68. doi:https://doi.org/10.1080/15583058.2017.1328543.
- Shiwakoti, N., M. Sarvi, and G. Rose. 2008. Modelling pedestrian behaviour under emergency conditions – State-of-the-art and future directions. 31st Australasian Transport Research Forum (ATRF) October 2-3 Gold Coast, Queensland, Australia, 457–73.
- Shrestha, S. R., R. Sliuzas, and M. Kuffer. 2018. Open spaces and risk perception in post-earthquake Kathmandu city. Applied Geography 93 (April). Pergamon:81–91. doi:https://doi.org/10.1016/J.APGEOG.2018.02.016.
- Veeraswamy, A., E. R. Galea, L. Filippidis, P. J. Lawrence, S. Haasanen, R. J. Gazzard, and T. E. L. Smith. 2018. The simulation of urban-scale evacuation scenarios with application to the swinley forest fire. Safety Science 102 (February):178–93. doi:https://doi.org/10.1016/j.ssci.2017.07.015.
- Vicente, R., T. M. Ferreira, and J. A. R. M. Da Silva. 2015. Supporting urban regeneration and building refurbishment. Strategies for building appraisal and inspection of old building stock in city centres. Journal of Cultural Heritage 16 (1):1–14. doi:https://doi.org/10.1016/j.culher.2014.03.004.
- Yao, Y., Y. Zhang, T. Yao, K. Wong, J. Y. Tsou, and Y. Zhang. 2021. A GIS-based system for spatial-temporal availability evaluation of the open spaces used as emergency shelters: The case of Victoria, British Columbia, Canada. ISPRS International Journal of Geo-Information 10 (2):63. doi:https://doi.org/10.3390/ijgi10020063.
- Yasufuku, K., Y. Akizuki, A. Hokugo, Y. Takeuchi, A. Takashima, T. Matsui, H. Suzuki, and A. T. K. Pinheiro. 2017. Noticeability of illuminated route signs for tsunami evacuation. Fire Safety Journal 91 (May). Elsevier Ltd:926–36. doi:https://doi.org/10.1016/j.firesaf.2017.04.038.
- Zhao, L., H. Li, Y. Sun, R. Huang, Q. Hu, J. Wang, and F. Gao. 2017. Planning emergency shelters for urban disaster resilience: An integrated location-allocation modeling approach. Sustainability (Switzerland) 9 (11):1–20. doi:https://doi.org/10.3390/su9112098.