
 ?Mathematical formulae have been encoded as MathML and are displayed in this HTML version using MathJax in order to improve their display. Uncheck the box to turn MathJax off. This feature requires Javascript. Click on a formula to zoom.
ABSTRACT
This article presents the results of the numerical simulations of a dynamic experimental campaign on the shaking table. The specimen is a full-scale masonry cross vault without and with the textile-reinforced mortar used as a strengthening solution. The specimen was tested in the scope of the European project SERA.ta 07 “Seismic Response of Masonry Cross Vaults: Shaking table tests and numerical validations”. The specimen replicates a generic cross-section of a central bay located in the lateral nave of a three-nave church, where the recurrent in-plane shear mechanism is induced. Finite element model (FEM) and discrete element model (DEM) were built and calibrated based on the experimental frequencies and mode shapes. Then, a unidirectional seismic action was applied to the numerical model in order to develop shear damage in the shell of the vault. A detailed description of the two simulations and their main outcomes are presented. The response was evaluated based on the displacements, damage, collapse mechanisms and hysteretic behaviour.
1. Introduction
This article centres on numerically investigating the in-plane shear behaviour of masonry cross vaults subjected to seismic loading. It aims to establish a basis for comparing Finite Element Modelling (FEM) and Discrete Element Modelling (DEM) in assessing the seismic responses of complex masonry structures. This research aligns with the objectives of the European project SERA.ta 07, titled ‘Seismic Response of Masonry Cross Vaults: Shaking Table Tests and Numerical Validations.’ The project involves both experimental and numerical validation of masonry cross-vault responses, including reduced- (Bianchini et al. Citation2022) and full-scale (Bianchini et al. Citation2019, Citation2023) specimens. As part of the main objective of this paper and of the SERA.ta project, the numerical models (FEM and DEM) were fundamental to fundamental to design the full-scale mortared vault, which underwent testing on the 3D LNEC shaking table (Lisbon), and to evaluate the efficiency of different advanced modelling strategies for the seismic performance assessment of masonry vaults. The vault was made of regular solid clay bricks (radially arranged). After being tested, it was repaired and strengthened at the extrados with textile reinforced mortar (TRM) solution. The specimen represents the vault of a lateral nave of a central bay of a generic three-nave church. It has asymmetric boundary conditions: on the external side it rests on a stiff lateral wall, while from the interior side, it rests on a colonnade (more sensitive to seismic actions).
This paper addresses the application of the two numerical modelling approaches for the analysis of masonry cross vaults, based on the previously performed shaking table tests. This is undertaken to fulfil one of the objectives of the SERA.ta project, namely the assessment of the reliability of numerical models to forecast the seismic behaviour of full-scale masonry cross vaults. The numerical approaches, used in the simulations reported herein, are based on the Finite Element Method (FEM) and Discrete Element Method (DEM).
FEM has become the most used and versatile method of structural analysis because it uses the continuum theory, and it allows obtaining an accurate representation of a structure. Contrarily, to the limit analysis (Grillanda et al. Citation2020; Milani Citation2022; Milani, Milani, and Tralli Citation2009; Tralli, Alessandri, and Milani Citation2014), which depicts only the maximum load capacity of the vault, FEM permits the evaluation of the development of damage during the analysis and it considers the combination of various parameters, in terms of material properties, modelling elements, non-linear and linear analysis and loading conditions. In every point of the structure and at every step of the load, relations between stress and strain are described thanks to complex constitutive laws (Lourenço Citation1996), allowing an extensive range of possibilities to describe, among others, masonry structures (Roca et al. Citation2010), among those, vaults (Creazza et al. Citation2000; Milani et al. Citation2019). Nevertheless, FEM continuum macro-models attract wide scientific interest since they offer a certain degree of simplification and allow to upscale the meso-mechanical characteristics of the components to the macro-scale. Indeed, macro-models represent a computationally efficient way to model large structures, which can hardly be modelled with discrete approaches. Moreover, the FEM macro-modelling approach allows the meticulous implementation of the strengthening technique (TRM) at the extrados (Ramaglia et al. Citation2017; Szołomicki, Berkowski, and Barański Citation2014) and its simulation within the complex dynamics of the vault. In DEM, the material is observed as an assembly of distinct masonry units, rigid or deformable, which interact along their boundaries (interfaces) behaving according to frictional behaviour (Giresini et al. Citation2014; Lemos Citation2007). This ensures a precise simulation of the separation between blocks, including the sliding at the joints. In particular, the DEM approach allows to build discontinuous models and to evaluate the response for large displacements, which is particularly relevant for studying the behaviour of masonry vaults considering the arrangement of the units near the collapse. Several static applications of DEM simulations on cross or groin vaults are available (Fang et al. Citation2018; Foti, Mazzotti, and Savoia Citation2015; Lengyel Citation2017; Lengyel and Bagi Citation2015; Lengyel and Károly Németh Citation2018; Mcinerney and Dejong Citation2015; Mele Van et al. Citation2012), but dynamic applications are missing in the literature.
For the purpose of this study, the numerical simulations are carried out using software based on the FEM, namely DIANA 10.5 (Citation2022), and software based on the DEM, namely 3DEC 7.0 (Citation2019a), replicating the shaking table tests using nonlinear time history analyses.
The paper is organized as follows: Section 1 presents the introduction to the problem and briefly summarizes the geometrical, construction and experimental aspects of the vaults; Section 2 summarises the experimental outcomes to better compare with the numerical results. Section 3 describes the methodology and strategy undertaken to build the numerical models; in Section 4, the results of modal updating, and calibration obtained from the finite element model and the discrete element method are, respectively, presented, and compared with the experimental dynamic results, including a discussion on the two different approaches; lastly, Section 5 presents the nonlinear dynamic analysis results and the main pros and cons of each modelling strategy. The main contribution of this paper, summarised in Section 6, is linked to the seismic assessment of vaulted structures by means of numerical models (FEM and DEM), which are rarely compared and validated based on experimental results, mainly using the full-scale specimens.
2. Brief description of the experimental campaign
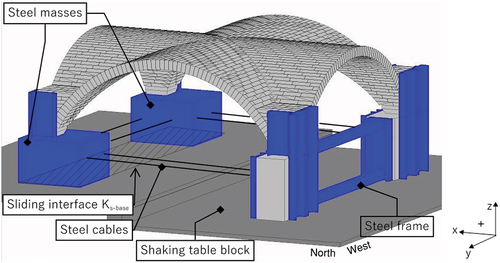
The specimen aims to cause in-plane shear behaviour in the vault for different amplitudes of ground motions. Thus, the integration of a proper boundary conditions system, including wheels and cables, was fundamental for achieving this outcome. The final optimised design of the specimen is presented in , which was obtained after several numerical analyses and where the boundary conditions, cable dimensions and steel profiles were examined.
Figure 1. Geometrical model of the full-scale specimen. (dimensions in m).
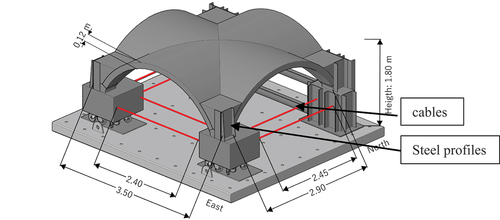
Also, the specimen’s geometry and boundary conditions setup were designed considering the dimensions and load capacity of the 3D LNEC shake table. Some dimensions are fixed, namely the square plan (3.5 × 3.5 ), net span (2.9 m), the rise (1.20 m) and constant thickness (.12 m). The total height of the specimen is equal to 1.80 m and the lengths of the three pairs of steel cables with Φ32 mm diameter (red lines in ) are equal to 2.40 m along the eastern edge and equal to 2.45 m along the North and South edges. Their rod ends are characterised by plain spherical bearings, to allow the rotational movement of their supports. The purpose of Steel cables is to avoid torsional effects of the piers and ensure the in-plane shear mechanism during the dynamic action. Two movable piers, located along the eastern side of the vault, are left free to slide. In this way, their movements in the longitudinal and transverse directions are allowed when horizontal dynamic load is applied to the vault. The other two masonry piers on the western side are fixed to a reinforced concrete slab placed on the shaking table, to simulate the external wall of the church. In order to increase the piers’ stiffness and to avoid relative displacements between the two piers, a steel frame made with IPE and UPN profiles was applied. The weight of the roof and the weight of the columns, which host the supports of the vault, are also considered through equivalent masses: four steel masses, with dimensions .84 m × .84 m × .27 m and 1.2 tons each, are placed below the movable supports. An overlying infill is built in correspondence with the vault’s four corners up to 50% of the rise of the shell of the vault (Gaetani, Citation2016). Steel elements (UPN and HE profiles) are added along the height of the supports and along the boundaries of the infill to avoid local failures at the corners. The steel profiles aim also to increase the stiffness of the supports and prevent possible bending deformation. Two threaded rods, named as connectors, with a diameter of ϕ20 mm and length of 50 cm, are vertically inserted within the thickness of each fixed pier to avoid localised cracks close to the base of the shell of the vault. The construction of the unstrengthened specimen (UNS) followed the guidelines gathered from ancient treatises and historical information (Breymann Citation1885; Fitchen Citation1961; Heyman Citation1995; Pasquale Di Citation1996; Rolla Citation1869; Ungewitter and Mohrmann Citation1890). Those treatises suggest a specific methodology, construction techniques and building progression, which can be summarised by the following steps for the unstrengthened vault (UNS): (i) realisation of the boundary conditions system; (ii) realization of the centring; (iii) construction of the shell of the vault; (iv) hardening. Once the first set of shaking table tests were performed on the unstrengthened configuration, the specimen was repaired from the previous damage and strengthened (SM), following the instructions provided by Kerakoll, which are as follows: (i) closing the cracks with Geocalce antisismico F and preparing the holes for the injections; (ii) grout injections of all the medium/severe cracks with Geocalce antisismico FL; (iii) let the liquid mortar harden for 28 days and then clean the shell; (iv) placing and anchoring the TRM system (Geosteel grid 200), embedded in the thin layer of compatible mortar (Geocalce antisismico F); (v) hardening for 28 days.
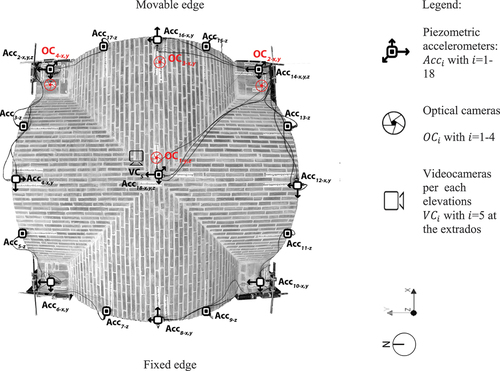
Regarding the experimental setup, displacement transducers (), optical cameras (
), load cells (
) and piezometric accelerometers (
) were used to measure the response of the test specimen, both in the seismic and dynamic identification tests. The four optical cameras were hung by an external scaffolding, whose basement is outside of the shaking table, to avoid noise in the recorded measurements. The 32 accelerometers were placed directly on the extrados of the vault, anchored to the upper surface of a timber element fixed to the shell. Six load cells (
) measure the tension forces in the cables. A pre-stress force of 5 KN was applied to the steel cables at the beginning of each shaking table test. The evolution of damage occurring in the test specimen was recorded by five video cameras (
) to draw a complete set of crack maps. Four cameras are located in front of each elevation (
with
from 1 to 4), one action camera, named
, was anchored to a piper scaffolding above the vault to record the damage at the extrados of the vault during the tests. presents the setup both for the unstrengthened specimen (UNS) and the strengthened specimen (SM).
Figure 2. Setup of the unstrengthened model (UNS) and strengthened model (SM).
The selected input, for both UNS and SM specimens, was the time series, named “AQA”, recorded during the L’Aquila earthquake, along the North-South component, which occurred on the of April 2009 (). The maximum absolute acceleration, velocity and displacement of the target input are equal to 4.25 m/
, 26.33 cm/s and 3.70 cm, respectively. The effective duration of the earthquake (
) is equal to 5.34 s out of a total duration of 25 s. A band pass filter between the range of .05–20 Hz and a Butterworth filter with a sixth pole order was applied to remove the line base derivation (Faccioli and Roberto Citation2005). The seismic tests on the UNS specimen were performed until it attained a level of damage, which does not compromise its structural equilibrium so that it is still possible to be repaired. For the SM specimen, it is important to ensure the performance of a reliable number of step percentages of the input to create a proper capacity curve to be compared with the unstrengthened one. In this case, the unique upper bound limit, besides the shaking table capacity, is the integrity of the equipment above the extrados.
Figure 3. Time histories of the target input signals of AQA earthquake: accelerations, velocities, and displacements.
Before and after each sequence of shaking table tests, dynamic identification tests (DIT) were performed to check the reduction of frequencies/damage with the increase in seismic action. The input signals used in the DIT correspond to a “white noise” with about 160 s duration, large frequency range and low amplitude. The intense phase lasts 110 seconds and the maximum absolute accelerations are about .45 m/ and .94 m/
in the North-South and East-West directions, respectively. This low amplitude avoids further damage in the test specimen between one shock and the following one. The DIT inputs are kept constant for all the dynamic identification test series, without scaling factors, in both configurations. Each DIT was performed unidirectionally, exciting the structure before along the North-South direction and then along the East-West direction. For what concerns the UNS specimen, nine dynamic identification tests are performed: four in the North-South direction (DIT
-UNS-Y) and four in the East-West direction (DIT
-UNS-X), with
from 0 to 3 (). The maximum level of 75% of the target input is reached during the seismic test on the UNS specimen, while, for the SM specimen, the level of 150% of the target amplitude is reached and 14 dynamic identification tests are performed ().
Table 1. List of tests carried out on the unstrengthened test specimen: dynamic identification tests (DIT) and shaking table tests (ST).
Table 2. List of tests carried out on the strengthened test specimen: dynamic identification tests (DIT) and shaking table tests (ST).
For more insights on the construction process, material characterisation tests and experimental results, the reader is referred to Bianchini et al. (Citation2023).
3. Numerical modelling
In Section, the two modelling strategies, FEM macro-modelling and DEM approaches are described. Some specific geometric modifications were required to develop the numerical models based on each software characteristic to better replicate the exact geometry and materials properties. In total, three numerical models were calibrated and studied:
DEM‒UNS: discrete element model to replicate the unstrengthened configuration.
FEM‒UNS: continuous macro-model to replicate the unstrengthened configuration.
FEM‒SM: continuous macro-model to replicate the repaired and strengthened configuration.
The DEM-SM model, which considers the application of TRM technology, was not developed at this stage of the research due to the lack of appropriate elements to simulate this strengthening technique in 3DEC 7.0. An option could have been to build extrados cables made of homogenised material. However, this may significantly compromise the precision of TRM modelling in DEM and increase the computational demands.
3.1. Finite element models: FEM‒UNS and FEM‒SM
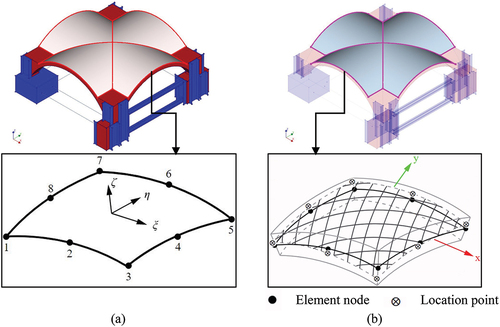
The geometry of the FEM models of the full-scale masonry vault was built in AutoCAD 3D, transforming the shell of the vault and the infill into a continuous solid element (). The geometry was exported in different iges files and a specific geometry group was associated with each portion of the model, according to the distribution of the materials. The FEM model characteristics are here described and summarised in :
the geometry of steel profiles and steel frame was simplified to avoid complex elements, which counteract the regularity of the mesh.
the system of wheels was discarded in the FEM model, being numerically irreplicable. It was replaced by only vertical constraints, directly applied below the steel masses.
between the steel masses and the vertical constraints, a very low shear stiffness boundary interface (CQ48I) was inserted. CQ48I is an interface element between two planes in a three-dimensional configuration. It allows movement along the longitudinal direction with low friction. On the other hand, the elements along the Western edge were perfectly fixed to the shaking table block through a rigid connection. This assumption was driven to improve the calibration of FEM‒UNS and FEM‒SM.
three couples of steel cables were placed as in the experimental specimen and modelled using truss elements. Their cross-section and density are equal to 8.04e-04
and 7800 kg/
two couples of vertical steel bars with 3.10e-04
Figure 4. FEM‒UNS macro-model of the full-scale vault in DIANA environment: (a) geometry, (b) mesh of the model.
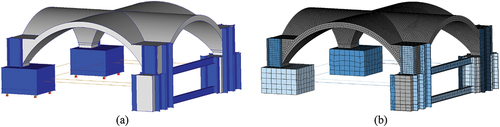
Table 3. Element types of the numerical FEM‒UNS and FEM – SM models built in DIANA 10.5 (Citation2022).
The representation of masonry elements was conducted using continuum solid elements with a quadratic twenty-node isoparametric solid brick element (CHX60 in ). The mesh size is constant and equal to 4 cm along the shell to guarantee the presence of three elements within the thickness of the vault (six integration points). Mesh size ranges from 1 cm to 12 cm for the steel elements as a function of their smaller thickness dimension. The three couples of steel cables, meshed per division, are modelled as 1D elements, namely enhanced truss element (L6TRU) — a two-node directly integrated truss element, suitable for non-linear dynamic analysis.
The non-linear behaviour of the masonry is ruled out by the Total Strain Crack Rotating model (TSCR) (Selby and Vecchio Citation1997). This model describes the tensile and compressive behaviour of a material with one stress-strain relation, which is evaluated in the principal directions of the strain vector that defines the direction of the cracks (DIANA 10.5 Citation2022). In this work, a hysteretic diagram with exponential tension‒softening for the tensile behaviour and linear for the compressive behaviour was adopted (). Tensile strength was set at the value of .1 MPa for the masonry of the shell of the vault and of the infill, while .3 MPa for the masonry of the fixed piers. The mode-I fracture energy
was assumed equal to .02 N/mm (Lourenço and Gaetani Citation2022; Lourenço and Pereira Citation2018).
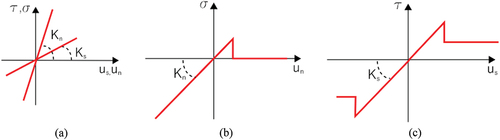
Figure 5. Constitutive laws used in the FEM–UNS and FEM–SM models: (a) non-linear hysteretic behaviour of masonry elements, (c) Mohr–coulomb criterion for sliding interface.
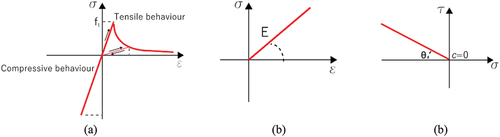
The compressive behaviour was assumed to be linear since the maximum principal stress was checked at the end of the preliminary dynamic analyses, and it was observed that cracking is the unique type of damage and no crushing occurs. All the steel elements present linear elastic behaviour. The sliding interface follows Mohr–Coulomb friction behaviour to simulate frictional slip along the interface elements below the steel masses (). To allow the in-plane shear mechanism, the adopted values of stiffnesses are the following: 20.0e6 KN/
- almost infinite to avoid any separation and interpenetration
2.0 KN/
- to allow almost pure sliding. The friction angle
was set at the very low value of 2°, while cohesion
and dilatancy
angle are null.
For what concerns the FEM‒SM model, the TRM technique was modelled as reinforcement sheets, namely a reinforcement grid embedded in the curved shell layer elements (CQ40S), both placed above the extrados of the shell. CQ40S simulates the mortar Geocalce F (). The reinforcement grid requires specification of the diameters and spacings of the grid, which is given by KeraKoll technical specifications to be equal to 1717 mm (). DIANA 10.5 (Citation2022) automatically calculates and applies the equivalent thickness parameter for the reinforcement grids based on the given spacings. The location of the grid in the curved shell element must be within the thickness domain of the element, meaning that the eccentricity along
axis of the grid should be smaller than half the thickness of the curved element. For simplicity, the thickness of the Geocalce F was kept constant along the extrados and is equal to 10 mm. The material behaviour of mortar Geocalce F and the reinforcement grid (Geosteel grid 200) is linear elastic and the maximum stresses were verified at the end of the analysis.
Figure 6. Strengthened FEM‒SM macro-model of the full-scale vault in DIANA 10.5 (Citation2022) environment: (a) shell element (CQ40S) for the Geocalce F, (b) embedded grid to simulate geosteel grid 200.
Since during the shaking table tests, no cracks or separation between the mortar and the bricks (delamination) were observed, the mortar layer, including the reinforcement, was modelled as a linear elastic material (Bianchini et al. Citation2023). This assumption depends on each case and the expected behaviour, as shown in studies by (Bertolesi et al. Citation2020) for cross vaults and barrel vaults/arches (Alejo Guerra et al. Citation2021).
The role of the grout injections, used to repair the intrados of the vault after the first tests, has to be considered in the numerical model to avoid a high level of damage at the intrados, cracking, and inconsistent results. As stated by Lourenço and Gaetani (Citation2022), grout injection affects the strengths and Young’s modulus. However, very few examples of modelling of grout injections are available in the literature (Doran et al. Citation2020; Rickstal Van Citation2000), mainly using the micro-modelling approach, which is in this case computationally unsustainable, due to the size of the model. In this work, the grout injections were modelled as five solid curved shapes along the diagonals from the intrados within the thickness of the vault for a height of 8 cm (), in the FEM‒SM model. In these five shapes, the higher linear elastic characteristics of the Mortar Geocalce FL, following the TSCR model, were applied, like the masonry shell, adopting tensile strength 1.3 MPa and .8 for Geocalce F and Geocalce FL respectively. The linear elastic values were gathered from the material characterisation tests for Mortar Geocalce FL ().
Figure 7. Grout injections modelled in the strengthened FEM‒SM model in DIANA 10.5 (Citation2022): (a) damaged intrados at the end of the ST–UNS–75%, (b) solid elements to simulate injections (intrados and north elevation).
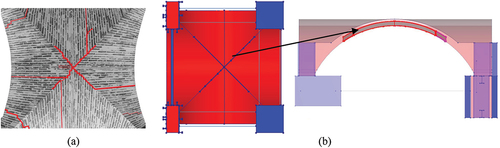
Table 4. Mechanical properties for the TRM system adopted in the numerical FEM‒SM (DIANA 10.5 Citation2022.).
3.2. Discrete element model:DEM‒UNS
The geometry of the DEM model of the full-scale masonry vault was built in Rhinoceros® (McNeel Robert Citation2008), and it corresponds to a model formed by 1399 blocks with an error smaller than 2% when comparing the experimental and numerical volume. The geometry is exported layer by layer from Rhinoceros and a specific geometry group was associated with each portion, according to the distribution of the materials along the model. The boundary conditions were slightly discretised to fulfil the syntax of 3DEC 7.0 (Citation2019a) satisfying some requirements, in particular:
the geometry of the steel profiles and the steel frame was simplified to avoid concave elements.
a rigid solid element “shaking table block”, fully constrained and aligned with the axis of symmetry of the vault was introduced to apply the input to its centroid. Since the system of wheels was discarded in the DEM model, being numerically irreplicable, the shaking table block has an irregular stepped cross-section, which allows to take into account the height of the system of wheels (see ).
Figure 8. Geometry of the DEM model in 3DEC 7.0 environment.
between the steel masses and the shaking table block, a very low shear stiffness joint
three couples of steel cables were added as in the experimental specimen. The cross-section and density of the steel cables are equal to 8.04e-04
The Young’s modulus of the steel cables is 210 GPa and the yield strength is equal to
350 MPa. The bond stiffness of grout (
) and the bond strength of grout (
) are equal to 6753.6 MPa/mm and 1400 MPa/mm, respectively (Mehrotra, Arede, and Dejong Citation2015). All the other blocks follow a rigid block model, which is appropriate for problems involving units of strong material, like the brick masonry of the vault. All the contacts that do not consider the shell of the vault (bricks to steel elements, steel elements to steel elements, shaking table to bricks, shaking table to steel elements) were assumed as elastic joints (blue cross symbol in ). The behaviour of the elastic joints () is governed by normal and shear joint stiffness, and no yielding can occur (Itasca Consulting Group, Inc Citation2019b).
Figure 9. List of joints contact of the DEM model in 3DEC 7.0 environment.
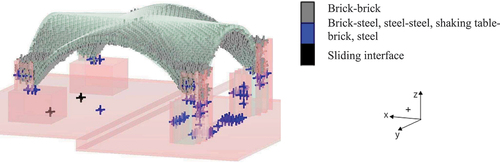
Figure 10. Contacts behaviour in the DEM model: (a) elastic joint model between brick-steel, shaking table-brick, shaking table-steel and steel-steel, (b) Mohr–coulomb criterion between brick-brick in the normal direction, (c) Mohr–coulomb criterion between brick-brick in the tangential direction.
On the other hand, the joints along the shell of the vault (grey brick–brick contacts in ) are modelled considering the classic Mohr–Coulomb frictional criterion, with zero-thickness. This is the most common non-linear contact model choice used in the literature for simulating blocks’ interaction. Within the Mohr-Coulomb criterion, cohesion and friction angle simulate the shear behaviour, whereas the uniaxial behaviour is controlled by the tensile strength. Upon exceeding the tensile strength, the normal stress is set to zero, and the shear strength is lost, showing a relatively brittle material behaviour (Pulatsu et al. Citation2023). Since the Mohr – Coulomb criterion for the brick-to-brick contacts was assumed, the joint stiffness was simulated as a combination of unit and mortar stiffness, according to Equation 1 ((Pulatsu et al. Citation2020; Senthivel and Paulo Citation2009) and Equation 2 (Senthivel and Paulo Citation2009);
is of the mortar (2800 MPa);
is the Young’s modulus of the blocks (6200 MPa);
and
are the heights of the masonry bricks (230 mm and 45 mm respectively in the parallel and perpendicular plan in respect to the orientation of the webs); and
is the mortar joints’ thickness (10 mm) fixed along all the webs. For this study, these values of stiffness,
and
are the initial values for the calibration of the DEM model.
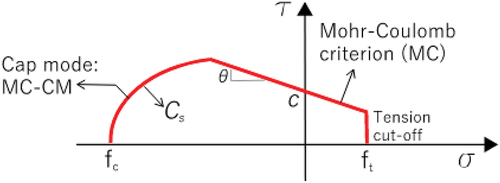
In addition to the classic Mohr – Coulomb (MC), a combined material behaviour of Mohr – Coulomb criterion with shear, crushing and cracking, implemented in 3DEC by Pulatsu et al. (Citation2020), here named as MC‒CM, was also used with DEM – UNS model. Both contact constitutive laws share the same tension – shear coupling formulation, while they differ in the compression – shear regime, as represented in . MC‒CM varies the shear strength once the compression stress exceeds a specific limit. The yield function for the cap mode implemented for MC‒CM is ruled out by the non-dimensional constant , which controls the shape of the function. A value of
close to zero makes the cap mode tending the compression cut-off curve (MC);
equal to 9 has been recommended by Lourenço and Gaetani (Citation2022).
Figure 11. Failure surface implemented for Mohr–coulomb (MC) and combined material behaviour of Mohr–coulomb (MC‒CM). Adapted by Pulatsu (Citation2023).
The non-linear parameters were also defined for DEM with MC‒CM model, namely the tensile strength ( = .1 MPa), compressive strength (
= 1.0 MPa), the fracture energy in tension (
0.02 kN/m), in shear (
0.15 kN/m) and in compression (
= 0.8 kN/m), based on the recommendations of Lourenço and Gaetani (Citation2022). The same value (
= 0.1 MPa) was used in the FEM and DEM models. However, this is justified considering the observed failure mode in the experimental campaign. During the tests, failure consistently occurred only at the mortar joints, with no observed cracks or damage within the bricks themselves. This suggests that the overall tensile resistance of the masonry is primarily governed by the strength of the mortar. Using the same
value in both models aligns with the observed behavior. In FEM model, the homogenized
effectively captures the average tensile resistance of the mortar-dominated failure plane. Similarly, in the DEM model,
directly controls the strength of the cohesive bonds representing the mortar joints.
4. Model updating
The model updating is part of the validation of the numerical models and it contributes to the calibrated numerical model behaves according to the experimental specimen, at least in the linear range. The calibration of the numerical models (DEM‒UNS and FEM‒UNS, FEM‒SM) is performed by comparing the frequencies and mode shapes of the numerical models with the experimental modal parameters obtained from the dynamic identification tests. The elastic stiffness properties of the joints (DEM model) and of the homogenised values of the masonry and interfaces (FEM model) were the parameters set for modal updating. However, the two numerical approaches follow two different methods. The calibration of the FEM‒UNS and FEM-SM models was carried out through an eigenvalue analysis, while, for the DEM‒UNS model, a time domain analysis was performed. For simplicity, justified by the predominant in-plane shear behaviour, the numerical models are uniquely calibrated based on the first mode.
The first experimental global mode of UNS vault has a frequency that ranges from 6.15 Hz (undamaged configuration) to 5.57 Hz (most damaged configuration). The corresponding first natural period of the specimen in the undamaged configuration is equal to . This mode corresponds to the pure in-plane shear behaviour of the system along the North-South direction. Similarly, the first experimental global mode of SM vault has a frequency that ranges from 6.15 Hz (undamaged configuration: DIT-0-SM-Y) to 4.5 Hz (most damaged configuration: DIT-6-SM-Y) after the 150% of the seismic tests (). This mode corresponds to a pure shear behaviour of the system along the North-South.
In order to verify that the detected mode shapes are consistent between the several shocks while the damage increases, the Model Assurance Criterion (MAC) was computed for all the dynamic identification tests ( and ) according to Equation 3.
and
are the mode shape vectors for two different modal conditions (DIT
) and
is the number of degrees of freedom, hence, the positions of the accelerometers and the corresponding nodes in numerical models. MAC values vary between 0 and 1: a value close to 0 indicates that the modes are inconsistent; while MAC equal to 1 indicates fully consistent mode shapes (Pastor, Binda, and Harčarik Citation2012).
4.1. Finite element model: FEM‒UNS and FEM‒SM
The model updating is based on the results of the dynamic identification tests, minimising the differences between the experimental modal properties and the numerical ones. This calibration consists of tuning and optimising the Young’s modulus of the masonry of the shell and the infill, to obtain a good matching of experimental data and simulation of the model, starting from the preliminary material properties, obtained from the material characterisation tests (see Bianchini et al. (Citation2023)). The calibration only involves the linear elastic properties of the masonry shell, while the linear elastic parameters of the masonry-fixed piers and steel elements are constant.
Using the original Young’s modulus of the masonry (2.22 GPa), the first global frequency of FEM‒UNS has a value of 7.99 Hz, which is 30% higher than the experimental one. Because of that, it is necessary to decrease Young’s modulus, remaining close to realistic values expected from the literature and National Codes for masonry with solid bricks (Fernandes et al. Citation2010; Ministero delle Infrastrutture e Trasporti Citation2019). In particular, it was reduced to about half of the original value estimated through the material characterisation tests (.96 GPa) to match the first frequency. This highlights that the stiffness of the vault is significantly lower than what is expected and measured quasi-statically during the axial compression tests. With the calibrated value of Young’s modulus (.96 GPa), the MAC value is equal to .92 for the FEM‒UNS model, by performing eigenvalue analysis, representing a good matching with the in-plane shear mechanism of the UNS specimen (.
Figure 12. Mode shapes of the first modes of the specimens (UNS and SM) and numerical models: (a) DIT‒0–UNS–Y test, (b) first mode obtained from eigenvalue analysis for FEM‒UNS model, (c) DIT‒0–SM–Y test; (d) first mode obtained from eigenvalue analysis for FEM‒SM model.
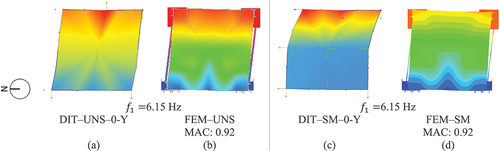
The same calibration approach was adopted for the FEM‒SM model. The material properties of the Grid Geosteel 200, Mortar Geocalce F and Mortar Geocalce FL were kept constant and equal to the values obtained from the material characterisation tests (). However, since after being repaired the UNS specimen can present minor cracking, the Young’s modulus of the masonry of the shell and infill was slightly corrected with a lower value, namely .93 GPa, to respect the coherence in terms of frequency and mode shapes (). This assumption is realistic, given the fact that the masonry shell suffered severe damage because of the previous shocks, and micro-cracks can remain after the repair of the specimen. The MAC value of the first frequency between the DIT — SM–0-Y and the FEM‒SM model is again .92.
The similarity in frequencies between the unstrengthened and strengthened vaults can be attributed to the extensive grout injections performed after the initial tests and to the very thin layer of TRM system which can be considered as a negligible addition of mass to the system. Grout injections effectively closed and repaired all the joints, particularly at the locations where the accelerometers were placed, restoring continuity in the shell of the vault, leading to similar overall vibration frequencies. All the numeral modal components (both horizontal and vertical) are very similar to the experimental ones, with the exception of the two horizontal components in the Y direction at mid-span of both free edge for the strengthened configuration. Although the MAC is very good (.92), from the top view the numerical and experimental mode shapes can appear a bit different (only two modal components). This aspect may be related mainly with some noise/disturbances in the signals of these two accelerometers during the dynamic identification tests and/or the repairing of the vault.
The final non-linear material properties of the masonry, Geocalce F and Geocalce FL in tension are listed and recalled in .
Table 5. Final properties after the calibration for FEM‒UNS and FEM‒SM models. Calibrated properties.
4.2. Discrete element model: DEM‒UNS
3DEC software capacity to determine natural frequencies and eigenvalues encounters a constraint when deformable blocks are introduced. Thus, eigenvalue analysis cannot be easily performed; because of this, a specific calibration process is needed (Gomes and Lemos Citation2020). The calibration of the DEM‒UNS model is composed of two main stages. In the first stage, a time history of velocities of about 150 s duration was applied along the NS direction at the centroid of the shaking table block, which corresponds to the duration of the dynamic identification tests. Secondly, when the analysis was finished, the acceleration time histories, numerically recorded under this noise-vibration state, were exported at the same locations as the accelerometers of the specimen.
In this way, the response at the measurement locations is compared with the experimental results in terms of frequency peaks and mode shapes. The time series of the response is processed using the Frequency Response Functions (FRF) to determine the natural frequencies, as seen in .
Figure 13. Comparison of frequency response functions obtained from the numerical modelling and the dynamic identification tests. (DIT‒0–UNS–Y, red dashed line) and the numerical model (DEM‒UNS, black solid line).
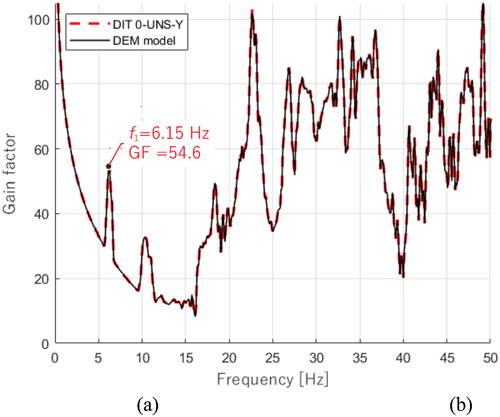
The match of the first frequency and mode shape was obtained by adopting an iterative process, where and
of the joints and the
below the steel masses were changed, to fulfil a good agreement with the tests. In particular,the initial values of
and
(in both parallel and perpendicular direction) were reduced until the modal updated values of 16.3 MPa/mm and 6.5 MPa/mm, respectively. The value of
is realistically connected with the calibrated Young’s modulus of masonry of the FEM – UNS model (.96 GPa) by the relation
, given the width of the units
in 3DEC block equal to 60 mm.
For the a very low value (almost equal to zero) was obtained, while the normal stiffness
was defined to avoid separation and interpenetration between the steel masses and the shaking table block. In this case, its value was set at 20 MPa/mm, when the first frequency is stabilised. summarises the final material properties of the joints after the calibration of the DEM‒UNS model.
Table 6. Final properties of joints after the calibration for classic Mohr–Coulomb criterion in DEM‒UNS model. Calibrated properties.
It can be observed that, with these values, the first frequency of the in-plane shear mode obtained by the numerical dynamic identification is well matched with the experimental results (.). For modes 2 and 3, a quite good agreement of numerical and experimental frequencies is also found, but it was discarded by the numerical calibration of the DEM model in terms of mode shapes, since they present lower MAC values and are not fundamental for the direction of the seismic action ().
Figure 14. DEM calibration: (a) MAC matrix, (b) first mode shape between DIT (red) and DEM‒UNS (blue) model performing vibration analysis.
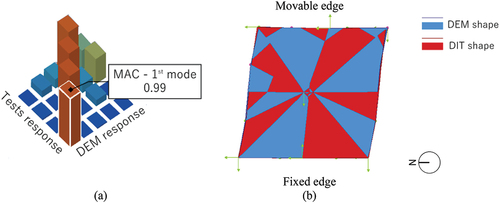
presents the matrix of the coefficients for the first mode. The orange-coloured values correspond to high MAC values, indicating a good correspondence between experimental and numerical results, close to the unit for the first mode (MAC 0.99). The graphical representation of the first mode shapes (experimental and DEM model) is presented in , where it is possible to observe that the two shapes exhibit a remarkable degree of overlap, visually testifying the result of the calibration process.
5. Non-linear dynamic analysis
Dynamic analyses with time integration were performed with DEM‒UNS and FEM‒UNS and FEM‒SM models, combining the non-linear behaviour of the materials and the seismic actions. The goal was to validate the models by comparing the numerical results with the experimental response of the full-scale vault, including the damage and the collapse mechanism. Another point is the discussion of the results obtained by the two strategies (FEM and DEM), considering the quality of the results, the time duration of analyses and the computational efforts.
Based on the experimental testing protocol, the following analyses were performed, as listed in . Incremental non-linear dynamic analyses were carried out, when possible, considering the seismic input applied in series (all the inputs applied as a continuous ground motion in the same analysis). In this way, the accumulation of damage is considered and the real incremental input loading, implemented on the shaking table tests, was simulated ( in Section 2). While restarting simulations is a common practice for nonlinear static analyses in DIANA, it presents significant challenges when applied to nonlinear time-history simulations: running files dimensions rapidly increase becoming unmanageable, exceeding storage capacity, and unforeseen and cumulative errors may be introduced, compromising data integrity. Thus, this approach was only considered in DEM‒UNS, while for FEM‒UNS model, each seismic action was applied in the undamaged state. Moreover, only the last seismic shock of the strengthened configuration (ST – SM–150%) was simulated through FEM‒SM model.
Table 7. List of analyses carried out on the unstrengthened and strengthened numerical models.
5.1. Numerical set-up
The accelerograms recorded by the shaking table’s actuators during the tests were filtered before being used as input for the numerical analyses (Faccioli and Roberto Citation2005). The filtered accelerogram was directly applied at the base of the FEM models (acting at the level of the boundary conditions). For DEM‒UNS model, the corresponding velocities were applied to the centroid of the “shaking table” block, obtained by integrating the filtered signals over time.
For what concerns FEM‒UNS and FEM‒SM models, the secant (Quasi-Newton) iterative method, with a convergence criterion based on the internal energy and tolerance equal to , and the line search algorithm were considered. Hilber-HughesTaylor (HHT) time integration method, with
, was adopted, which introduces numerical dissipation without degrading the accuracy (Faria Citation1994), while the parallel direct sparse solver was adopted to solve the system of equations.
The integration time step was defined to be smaller than the first natural period of the specimen
with interest for the behaviour of the structure over 20. The obtained ratio (.01 s) allows to take into account the contribution of the period
with an error of less than 5%. Moreover, the time step should be much smaller than the total duration of the earthquake (25 s) (Mendes Citation2012). For simplicity,
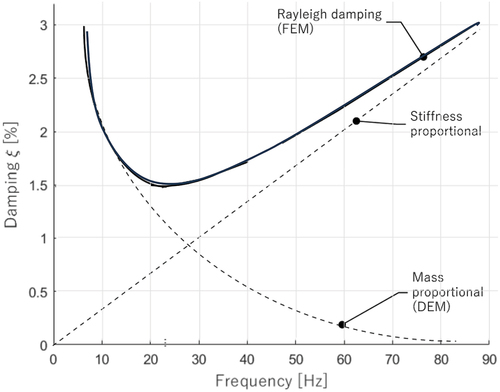
was set at the value of .005 s, which is equal to the time step of the signals of the experimental tests. With these characteristics, one analysis with a total duration of 25 s takes around 14 days to run. The two damping constants, valid for FEM‒UNS and FEM‒SM, are α (2.165) and β (1e-05), defined based on the eigenvalue analysis results, for which the first 28 modes with a cumulative mass participation of about 86% in each horizontal direction (x and y) were considered. The assumed damping ratio
is equal to 3% (), as suggested by other studies on masonry structures (Mendes and Lourenço Citation2014; Parisse et al. Citation2021). The central finite-difference procedure was used as a time integration method in DEM‒UNS. The time step of the DEM analysis
must be lower than a critical value to ensure numerical stability. In this case,
is equal to
, which allows to obtain an acceptable analysis duration. This
is associated with the criterion adopted for the damping, for which, only the mass proportional formulation was adopted (). In conclusion, being
sufficiently big, Rayleigh damping’s contribution (mass proportional only) can be contemplated. From DEM‒UNS, the minimum value of Rayleigh damping is reached for a frequency equal to 23.00 Hz and has a damping ratio equal to 1.49%. One analysis with a total duration of 25 s takes around 1 day to run.
Figure 15. Viscous damping of the numerical models.
5.2. Non-linear dynamic analysis of the unstrengthened models: DEM‒UNS and FEM‒UNS
The responses of DEM‒UNS and FEM‒UNS were compared with the results obtained in the shaking table tests, using the same parameters as in the analysis of the experimental behaviour of the specimen, namely the deformed shapes and principal strains used as cracks indicators, displacements profiles and maximum absolute displacements along the movable edge and at the key of the vault, horizontal seismic coefficients, accelerations response, and drifts.
presents the comparison between the damage maps between the shaking table tests during ST – UNS–75% and numerical simulation results for the same seismic sequence. In DEM‒UNS, the crack pattern is represented by the deformed shapes, which are plotted with a deformation factor of 100 to better visualise the opening of the joints. In FEM‒UNS, the damage is represented by the distribution of principal tensile strains along the numerical model — an indicator of the cracking. DIANA considers a ‘scan’ output command to plot the cumulative strain distribution over time.
Figure 16. Evolution of cracks at the extrados: (a) ST–UNS–75, (b) deformed shapes of DEM‒UNS model (deformation factor: 100), (c) strains distribution in FEM‒UNS model.

At the beginning of the analysis, the same crack along the NW/SE diagonal appears in both numerical models at 3.00 s and, similarly at
3.16 s, the opposite diagonal crack is observed. When the direction of the input changes, the deformed shape of DEM‒UNS model also changes and the numerical model can close diagonal cracks, previously opened. For this time instant,
3.16 s, the crack that surrounds the NW corner above the boundaries of the infill is visible in DEM‒UNS, while in FEM‒UNS is still not present. Since
3.60 s, both diagonal cracks remain open until the end of the analysis, as in the experimental tests. It is only at
6.41 s that the hinges are recognisable in the numerical simulations. The first hinge appears on the Western and Southern webs in DEM‒UNS, while in FEM‒UNS they are diametrically opposite to the diagonals. Their severity and length are underestimated in comparison with the experimental tests and their locations are shifted of some rows. Both models present the cracks at the boundaries of the infill of the Western edge at
6.41 s. At the end of the analysis (
25 s), both DEM‒UNS and FEM‒UNS show a very similar distribution of cracks, coherent with the experimental evidence, mainly while comparing the NW corner and the fixed edge. The main difference is represented by the hinge located along the Eastern web, represented by a transverse crack, which is visible in DEM‒UNS, while in FEM‒UNS, it is only partially developed. It is noted that, due to the characteristic of the DEM‒UNS, the same shifting of the webs, which was observed at the end of ST – UNS–75%, is detected.
For what concerns the previous seismic numerical analysis (ST – UNS–25%, ST – UNS–50%), no relevant damage was observed in the numerical models, in which the behaviour remains mainly linear.
The damage was plotted uniquely from the extrados, being the most representative view for the description of the damage distribution of the unstrengthened configuration.
The average errors of the maximum displacement peaks between numerical and experimental displacements are very different for DEM‒UNS (
42%) and the FEM‒UNS (
15%), considering the experimental results in the longitudinal direction as reference (see ). When looking at the average value of the root mean square of displacement (RMSD) in the longitudinal direction (NS), it is possible to notice that the average error
of DEM‒UNS and FEM‒UNS models are equal to
24% and
17%, respectively. This highlights the fact, that despite the numerical computational effort, FEM‒UNS better depicts the deformability of the specimen. As anticipated in Section 3, the combined material behaviour of Mohr–Coulomb criterion (MC‒CM) is also considered to simulate cut-off tensile strength and compressive strength with DEM‒UNS model. The distribution of damage and cracks occurrence for MC‒CM is similar to the one shown in for MC, while in terms of peaks of displacements and RMSD, MC‒CM brings improvements to the results (). Still, while comparing the transverse response at the last seismic test, it is highlighted that the displacements are on average underestimated.
Table 8. Peak values and root mean square of displacements (RMSD) and average errors between the results measured by for each seismic test of the unstrengthened specimen and obtained by DEM‒UNS and FEM‒UNS models.
Those considerations are more visible by looking at ., where the RMSDs are plotted in function of the seismic input. Until ST‒UNS‒50%, the experimental and numerical values follow the same trend for optical cameras ,
,
. The highest difference (0.2 mm) is very low and occurs in DEM with MC. However, the numerical models follow the experimental results with less accuracy for the last seismic input, in which a more remarkable scatter appears for ST‒UNS‒75% and higher damage occurs. The numerical response of
() differs more from the tests because of the unexpected amplification and damage localised on the S-E corner. Thus,
is no longer considered for further discussions in this research. In general, and comparing the two DEM models, DEM with MC‒CM achieves better results in terms of displacements, while DEM with MC underestimates the displacement capacity.
Figure 17. Rmsds in the longitudinal direction: (a) ,
,
, (b)
.
presents the comparison between the displacements of the experimental specimen and the numerical models for two instants, for 75% of the earthquake. The displacement fields are coherently showing in-plane shear deformation in both cases and, in general, quite symmetric between the positive and negative directions. On average, their absolute values are lower than the experimental. The response in the positive direction (from South to North) is very similar, comparing the two numerical models, while in the negative direction, at 0.4.31 s, FEM‒UNS presents more deformability than DEM‒UNS.
Figure 18. Comparison of the displacement profiles between experiments and numerical responses.
From the numerical analyses of the unstrengthened configuration is possible to arise some important conclusions:
all the optical cameras’ response is well described by the numerical models, apart for
for ST — UNS–75%, when higher non-linearities occur and start being predominant, FEM depicts the response of the vault in a satisfying way, even if the analysis discards the accumulation of damage. Between the two material behaviours implemented in the DEM model, the model with MC‒CM is closer to the experimental displacements.
FEM and DEM with MC‒CM models provide a more accurate prediction of the force — displacement response. However, FEM model requires high computational effort.
the maximum drift of the vault (evaluated as the ratio between the maximum absolute displacement and the span of the vault) for the last seismic test was evaluated by comparing the response of
It is important to mention that the input of 75% did not cause the full collapse, but it induced a severe damage state that allowed the repair and the application of the strengthening.
5.3. Non-linear dynamic analysis for the strengthened model: FEM‒SM
The TRM strengthening technique, used in the experimental campaign, is an innovative and powerful reinforcement solution that is rarely implemented in the FEM models for walls and even less while dealing with vaulted structures (Allahvirdizadeh, Oliveira, and Silva Citation2019; Milani et al. Citation2019), and never implemented in three-dimensional DEM models. 3DEC software considers only steel bars, partially embedded in masonry elements (Mehrotra Citation2018; Smoljanović, Nikolić, and Živaljić Citation2015) or externally bonded reinforcement modelled through a few truss elements connected to the vault through non-linear contacts, considering equivalent spacings and properties to be able to represent the real grid distribution of the TRM (Gobbin, de Felice, and Lemos Citation2020; Lemos et al. Citation2022).
In light of the results of the unstrengthened models and to decrease the computational effort, as anticipated in Section 2, the FEM‒SM was only used to evaluate the response of the vault for the last shaking table test (ST — SM–150%).
The same analysis characteristics, described for FEM-UNS, are still valid and the response of FEM‒SM was compared to the results obtained in the shaking table tests, using the same parameters as in the analysis of the experimental behaviour of the specimen, namely: deformed shapes and principal strains used as cracks indicators, displacements profiles and maximum absolute displacements along the movable edge and at the key of the vault and drifts.
In general, the numerical results are rigorous in depicting the experimental damage, mainly while comparing the final distribution at the end of the analysis. . presents the comparison between the numerical damage, represented by the distribution of tensile strains for different elevations, with the experimental damage observed at the end of ST — SM–150%.
Figure 19. Damage map for: (a) ST–SM–150%, (b) principal strains distribution in FEM‒SM model.
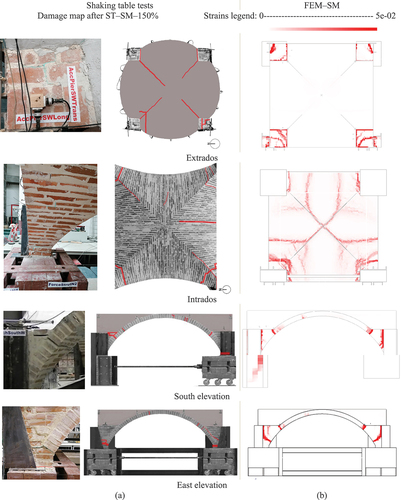
Observing the extrados, the numerical diagonal cracks are characterised by a lower severity in comparison with the experimental ones, maybe due to the perfect bound of the TRM system in the numerical model. The damage at the fixed pier, mainly the one located at the SW corner, is coincident. The hinges are recognisable in the numerical simulations from both lateral views, with particular attention to the SW angle, which is correctly the most damaged. The severity of damage at the intrados is overestimated in FEM‒SM, but the strains coherently develop at the boundaries of the locations where the injections were simulated and where better material properties were applied. Moreover, at the intrados, the four corners are also damaged, in the same location where the thickness of the vault decreases at the boundaries of the infill. The main difference corresponds to the lack of an uplifting movement, which occurs between the steel masses and the impost of the vault along the Eastern edge. This mechanism can be simulated through additional interface elements, whose calibration would require further investigations and experimental considerations.
presents the comparison between the experimental displacement profiles and the numerical ones at 4.31 s, for the 150% earthquake. The displacement fields in the numerical models present an in-plane shear deformation and, on average, their absolute values are remarkably similar to the experimental ones for all the optical cameras. In the strengthened case,
behaves more homogenously together with the other corner points. At this instant, both the experimental specimen and FEM‒SM model registered more limited transverse displacement at the key point of the eastern arch (
).
Figure 20. In-plane deformation profiles of the strengthened configuration for the ST–SM–150% when all the optical cameras measure the maximum displacements. Deformation factor: 10.
By looking at the absolute displacements in the longitudinal direction (NS) (), it is possible to notice that the average error of FEM‒SM model is equal to 1.2% and 6.4% when comparing the peaks values and the RMSD, respectively. These outputs highlight the quality of the strengthened FEM model results and validate the methodology used for modelling the strengthening technique.
Table 9. Peak values and root mean square (RMSD) of displacements and average errors obtained from of the ST — SM–150% and the FEM‒SM model.
However, similarly to the FEM‒UNS model, FEM‒SM underestimates the transverse capacity of the shell of the vault, suggesting the need of further investigation to increase the deformability in direction, to better replicate the uplifting of the shell.
The last outcomes presented for FEM‒SM model allow to arise important conclusion:
the tensile principal strains distribution well replicates the experimental distribution of damage, highlighting the most vulnerable part of the structure when it is strengthened at the extrados, namely the fixed piers and the supports of the vault. In a generic church, those parts are stronger due to the presence of massive lateral walls, transverse arches and pillars.
the consideration of the grout injections allowed to achieve realistic damage without causing high principal strains at the intrados, which would have also caused convergency problems.
the displacement response is well described by the numerical model. They have an acceptable error in comparison with the experiments (less than 10%).
if the maximum drift of the vault for the last seismic test is evaluated by comparing the response of
6. Conclusions
This article presents the main results from the numerical simulations of the shaking table tests carried out at LNEC (Lisbon) with a full-scale masonry groin vault made with clay bricks under unstrengthened and strengthened conditions. The numerical simulations with the finite element model and discrete element model aim at defining the comparison between the experimental tests and the numerical outcomes of the vault when in-plane shear behaviour is induced to the shell. Moreover, the finite element model aims at assessing the effectiveness of the TRM strengthening solution when implemented as a layered shell at the extrados. For both configurations (unstrengthened and strengthened) the results of the dynamic calibration and the seismic analyses were described and compared. The elaboration of reliable numerical models based on experimental data constitutes one of the solid bases for further structural studies and designs on masonry vaults. Three numerical models were considered: FEM‒UNS (unstrengthened numerical finite element model), DEM‒UNS (unstrengthened numerical discrete element model), and FEM‒SM (strengthened numerical finite element model). Those numerical models were calibrated using the model updating, namely considering the first mode, which is associated with the in-plane shear mechanism, excited by the direction of the input. The calibration process of numerical models plays an important role in the subsequent non-linear analysis, as the non-linear simulation depends also on the linear mechanical properties considered for masonry material. The main changes were applied to Young’s modulus of the masonry for FEM‒UNS and FEM‒SM, and the stiffness of the joints in DEM‒UNS.
In what concerns the mode shapes, the MAC values showed that the correlation between the experimental and numerical modal displacements is good in the longitudinal direction for all the models (FEM‒UNS, DEM‒UNS and FEM‒SM models). With this respect, it is important also to notice that the evaluation of the experimental modal parameters before any seismic test is important for the calibration of the numerical model. The calibration should be taken as part of the whole validation process and considered one of the most fundamental parts of the numerical analysis.
The quality of the numerical results of the non-linear dynamic analyses agrees with the conclusions of the model updating.
This paper also discusses the effect of different contact constitutive laws within the DEM framework, namely two contact models: Mohr–Coulomb (MC) and combined material behaviour of Mohr–Coulomb with shear, crushing and cracking (MC‒CM).
From the results obtained from non-linear time history analyses, it is possible to conclude that:
the correct simulation of the experimental boundary conditions in the most realistic way demonstrated an important role in the numerical analysis of the structure. In this study, it was observed that the boundary interface below the steel masses influenced the response.
the FEM–UNS implemented in this work, with the rotating total strain crack constitutive model adopted for masonry, demonstrated to be accurate enough for the study and general understanding of the non-linear dynamic behaviour of unreinforced masonry vaults. It simulated the displacement response with an acceptable approximation, but requiring a relevant computational effort.
in the modelling of the unstrengthened vault, the numerical analysis of last seismic input (ST‒UNS‒75%) for both FEM and DEM model is on the safe side compared with the tests.
FEM and DEM models are generally capable of replicating the collapse mechanism observed during the shaking table tests in terms of cracks, the opening of the joints and the time occurrence of the experimental damage, but the FEM fails in terms of computational efforts. DEM‒MC presents more difficulties in replicating the ultimate displacements and the hysteretic behaviour than FEM. Those difficulties are recovered by MC‒CM behaviour assigned to the joints, which improved the results in terms of displacement. FEM lacks in terms of computational effort (14 times the duration of DEM analysis).
FEM – SM demonstrated to be accurate for the study and the general understanding of the non-linear dynamic behaviour of strengthened masonry vaults when both grout injections and TRM applications were simulated. Grout injections which are rarely taken into account on FEM models according to their realistic distribution on the masonry representing a novelty in this study.
as a future work, accounting the decrease of the natural frequency caused by the previous earthquake (eigenvalue analysis after the nonlinear dynamic analysis using the tangential stiffness) may be a useful procedure for evaluating the damage evolution as function of seismic input increase.
Acknowledgments
This work was supported by the SERA.TA project “Seismic Response of Masonry Cross Vaults: Shaking table tests and numerical validations”. This work is financed by national funds through FCT - Foundation for Science and Technology, under grant agreement [SFRH/BD/136831/2018] attributed to the 1st author.
Disclosure statement
No potential conflict of interest was reported by the author(s).
Additional information
Funding
References
- Alejo Guerra, L. E., N. Mendes, P. B. Lourenço, and G. Martínez. 2021. Protecting the historic buildings of Mexico: The barrel vault of San Agustin Church in Morelia. Journal of Performance of Constructed Facilities 35:2. doi:10.1061/(ASCE)CF.1943-5509.0001556
- Allahvirdizadeh, R., D. V. Oliveira, and R. A. Silva. 2019. Numerical modeling of the seismic out-of-plane response of a plain and TRM-Strengthened rammed earth subassembly. Engineering Structures 193 (May):43–56. doi:10.1016/j.engstruct.2019.05.022.
- Bertolesi, E., B. Torres, J. M. Adam, P. A. Calderón, and J. J. Moragues. 2020. Effectiveness of textile reinforced mortar (TRM) materials for the repair of full-scale timbrel masonry cross vaults. Engineering Structures 220 (April):110978. doi:10.1016/j.engstruct.2020.110978.
- Bianchini, N., C. Calderini, N. Mendes, P. Xavier Candeias, and P. B. Lourenço. 2023. Postdiction competition - Sera.Ta - seismic response of masonry cross vaults: Shaking table tests and numerical validations. Zenodo 2023. doi:10.5281/zenodo.7624791.
- Bianchini, N., N. Mendes, C. Calderini, P. Candeias, and P. B. Lourenço. 2023. Shaking table testing of an unstrengthened and strengthened with textile reinforced mortar (TRM) full-scale masonry cross vault. International Journal of Architectural Heritage 1–26. doi:10.1080/15583058.2023.2295900.
- Bianchini, N., N. Mendes, P. Xavier Candeias, C. Calderini, M. Rossi, and P. B. Lourenço. 2022. Seismic response of a small-scale masonry groin vault: Experimental investigation by performing quasi-static and shake table tests. Bulletin of Earthquake Engineering 1–23. doi:10.1007/s10518-021-01280-0.
- Bianchini, N., M. Nuno, P. B. Lourenço, C. Calderini, and R. Michela 2019. “Seismic assessment of masonry cross vaults through numerical nonlinear static and dynamic analysis.” In COMPDYN 2019 7th ECCOMAS Thematic Conference on Computational Methods in Structural Dynamics and Earthquake Engineering, ed. M. Papadrakakis, and M. Fragiadakis, 600–12. Crete, Greece. doi:10.7712/120119.6942.18709.
- Breymann, G. A. 1885. Costruzioni in Pietra e Strutture Murali. In Costruzione Dei Coperti in Pietra Naturale Ed in Mattoni. (in Italian). Stoccarda: Biblioteca Internazionale dell’Ingegnere.
- Creazza, G., M. Renato, S. Anna, and V. Renato. 2000. Analyses of masonry vaulted structures by using 3D damage Model. In ECCOMAS 2000 European Congress on computational methods in applied sciences and engineering, ed. E. Oñate, K. Morgan, J. Periaux, and E. Stein, Vol. 128, 646. Barcelona. doi:10.1061/(ASCE)0733-9445(2002)128:5(646).
- DIANA 10.5. 2022. Finite element modelling software. Delft, Netherlands.
- Doran, B., N. Yuzer, S. Aktan, D. Oktay, and S. Ulukaya. 2020. Numerical modeling of traditional masonry walls strengthened with grout injection. International Journal of Architectural Heritage 14 (10):1517–32. doi:10.1080/15583058.2019.1618970.
- Faccioli, E., and P. Roberto. 2005. Elementi Di Sismologia Applicata All’ingegneria. Bologna: Pitagora. (In Italian).
- Fang, D. L., R. K. Napolitano, T. L. Michiels, and M. Sigrid. 2018. Assessing the stability of unreinforced masonry arches and vaults: A comparison of analytical and numerical strategies. International Journal of Architectural Heritage 13 (5):648–62. doi:10.1080/15583058.2018.1463413.
- Faria, R. 1994. Evaluation of the seismic behaviour of concrete dams via continuum damage Model. Portugal: University of Porto.
- Fernandes, F. M., P. B. Lourenço, and F. Castro. 2010. Ancient clay bricks : Manufacture and properties. In Materials, technologies and practice in historic heritage structures, ed. M. B. Dan, 1st, Springer. doi:10.1007/978-90-481-2684-2
- Fitchen, J. 1961. The construction of gothic cathedrals. Phoenix ed. Chicago: The University of Chicago Press.
- Foti, D., C. Mazzotti, and M. Savoia. 2015. Structural behaviour of historical stone arches and vaults: Experimental tests and numerical analyses. Key Engineering Materials 2:43–48. doi:10.4028/www.scientific.net/KEM.628.43.
- Gaetani, A. 2016. Seismic Performance of Masonry Cross Vaults : Learning from Historical Developments and Experimental Testing. PhD Thesis, University of Minho.
- Giresini, L., C. Butenweg, M. Andreini, A. De Falco, and M. Sassu. 2014. “Numerical calibration of macro-element for vaulted systems in historic churches.” In 9th International Conference on Structural Analysis of Historical Constructions, ed. F. Peña, and M. Chávez, 14–17. Mexico City, Mexico.
- Gobbin, F., G. de Felice, and J. V. Lemos. 2020. A discrete element Model for masonry vaults strengthened with externally bonded reinforcement. International Journal of Architectural Heritage 15 (12):1959–72. doi:10.1080/15583058.2020.1743792.
- Gomes, J. P., and J. V. Lemos. 2020. Characterization of the dynamic behavior of a concrete arch dam by means of forced vibration tests and numerical models. Earthquake Engineering and Structural Dynamics 49:679–94. doi:10.1002/eqe.3259.
- Grillanda, N., A. Chiozzi, G. Milani, and A. Tralli. 2020. Efficient meta-heuristic mesh adaptation strategies for NURBS upper–bound limit analysis of curved three-dimensional masonry structures. Computers and Structures 236:106271. doi:10.1016/j.compstruc.2020.106271.
- Heyman, J. 1995. The stone skeleton: Structural engineering of masonry architecture. 2nd Edited by. Cambridge: Cambridge University Press. doi:10.1016/0020-7683(66)90018-7.
- Itasca Consulting Group, Inc. 2019a. 3DEC 7.0—three-Dimensional distinct element code. Minneapolis, MN.
- Itasca Consulting Group, Inc. 2019b. 3DEC online manual. 3DEC Manual.
- Lemos, J. V. 2007. Discrete element modeling of masonry structures. International Journal of Architectural Heritage 1:190–213. doi:10.1080/15583050601176868.
- Lemos, J. V., G. Francesca, F. Tamás, and S. Vasilis. 2022. Discrete element modelling of masonry arch bridges, arches and vaults. In From corbel arches to double curvature vaults: Analysis, conservation and restoration of architectural heritage masonry structures, ed. G. Milani, and V. Sarhosis, 233–56. Cham: Springer International Publishing. doi:10.1007/978-3-031-12873-8_5.
- Lengyel, G. 2017. Discrete element analysis of gothic masonry vaults for self-weight and horizontal support displacement. Engineering Structures 148:195–209. doi:10.1016/j.engstruct.2017.06.014.
- Lengyel, G., and K. Bagi. 2015. Numerical analysis of the mechanical role of the ribs in groin vaults. Computers and Structures 158:42–60. doi:10.1016/j.compstruc.2015.05.032.
- Lengyel, G., and R. Károly Németh. 2018. The mechanical behavior of ribs in masonry groin vaults subjected to seismic load. International Journal of Architectural Heritage 13 (6):886–900. doi:10.1080/15583058.2018.1491652.
- Lourenço, P. B. 1996. Computational Strategies for Masonry Structures. PhD thesis, Delft University of Technology. doi:10.1080/90-407-1221-2.
- Lourenço, P. B., and A. Gaetani. 2022. Finite element analysis for building assessment: Advanced use and practical recommendations. New York: Taylor & Francis Group.
- Lourenço, P. B., and J. M. Pereira. 2018. Recommendations for advanced modeling of historic earthen sites: Seismic retrofitting project research report. Los Angeles, CA: Getty Conservation Institute.
- Mcinerney, J., and M. J. Dejong. 2015. Discrete Element Modeling of Groin Vault Displacement Capacity. International Journal of Architectural Heritage 9 (8):1037–49. doi:10.1080/15583058.2014.923953.
- McNeel Robert, A. 2008. Rhinoceros NURBS modeling for Windows.
- Mehrotra, A. 2018. A computational tool for seismic collapse assessment of masonry structures. no December.
- Mehrotra, A., A. Arede, and M. J. Dejong. 2015. Discrete element modeling of a post-tensioned masonry arch. Civil-Comp Proceedings 1–16. doi:10.4203/ccp.108.49.
- Mele Van, T., J. McInerney, M. J. Dejong, and P. Block. 2012. Physical and computational discrete modelling of masonry vault collapse. In Structural Analysis of Historical Constructions, ed. J. Jasieńko, 2552–60. Wrocław: Jerzy Jasieńko (Ed.).
- Mendes, N. 2012. Seismic Assessment of Ancient Masonry Buildings : Shaking Table Tests and Numerical Analysis. PhD thesis, University of Minho.
- Mendes, N., and P. B. Lourenço. 2014. Sensitivity analysis of the seismic performance of existing masonry buildings. Engineering Structures 80:137–46. doi:10.1016/j.engstruct.2014.09.005.
- Milani, G. 2022. Simple lower bound limit analysis Model for masonry double curvature structures. Computers and Structures 269:106831. doi:10.1016/j.compstruc.2022.106831.
- Milani, G., E. Milani, and A. Tralli. 2009. Upper bound limit analysis model for FRP-Reinforced masonry curved structures. Part I: Unreinforced masonry failure surfaces. Computers and Structures 87 (23–24):1534–58. doi:10.1016/j.compstruc.2009.07.010.
- Milani, G., M. Valente, M. Fagone, T. Rotunno, and C. Alessandri. 2019. Advanced non-linear numerical modeling of masonry groin vaults of major historical importance: St John Hospital Case Study in Jerusalem. Engineering Structures 194 (May):458–76. doi:10.1016/j.engstruct.2019.05.021.
- Ministero delle Infrastrutture e Trasporti. 2019. Circolare esplicativa delle norme tecniche per le costruzioni. issued 2019.
- Parisse, F., S. Cattari, R. Marques, B. L. Paulo, G. Magenes, K. Beyer, M. K. Bruno Calderoni, D. Malomo, C. Filippo Manzini, M. A. Erberik, et al. 2021. Benchmarking the Seismic Assessment of Unreinforced Masonry Buildings from a Blind Prediction Test. Structures 31:982–1005. doi:10.1016/j.istruc.2021.01.096.
- Pasquale Di, S. 1996. L’arte Del Costruire. Tra Conoscenza e Scienza. Venezia: Marsilio.
- Pastor, M., M. Binda, and T. Harčarik. 2012. Modal assurance criterion. Procedia Engineering 48:543–48. doi:10.1016/j.proeng.2012.09.551.
- Pulatsu, B. 2023. Coupled elasto-softening contact models in DEM to predict the in-plane response of masonry walls. Computational Particle Mechanics 10 (6):1759–70. doi:10.1007/s40571-023-00586-x.
- Pulatsu, B., E. Erdogmus, P. B. Lourenço, J. V. Lemos, and J. Hazzard. 2020. Discontinuum analysis of the fracture mechanism in masonry prisms and wallettes via discrete element method. Meccanica 55:505–23. doi:10.1007/s11012-020-01133-1.
- Pulatsu, B., E. Erdogmus, P. B. Lourenço, J. V. Lemos, and K. Tuncay. 2020. Simulation of the In-Plane Structural Behavior of Unreinforced Masonry Walls and buildings using DEM. Structures 27:2274–87. doi:10.1016/j.istruc.2020.08.026.
- Pulatsu, B., S. Gonen, P. B. Lourenço, J. V. Lemos, and J. Hazzard. 2023. Computational investigations on the combined shear–torsion–bending behavior of dry-joint masonry using DEM. Computational Particle Mechanics 10:249–60. doi:10.1007/s40571-022-00493-7.
- Ramaglia, G., G. Piero Lignola, A. Balsamo, A. Prota, and G. Manfredi. 2017. Seismic strengthening of masonry vaults with abutments using textile-reinforced mortar. Journal of Composites for Construction 21 (2):04016079. doi:10.1061/(asce)cc.1943-5614.0000733.
- Rickstal Van, F. 2000. Grout injection of masonry, scientific approach and modeling.
- Roca, P., M. Cervera, G. Gariup, and L. Pelà. 2010. Structural analysis of masonry historical constructions. Classical and advanced approaches. Archives of Computational Methods in Engineering 17 (3):299–325. doi:10.1007/s11831-010-9046-1.
- Rolla, E. 1869. “Cenni Sulle Volte (in Italian).” Master thesis, Università di Torino.
- Selby, R. G., and F. J. Vecchio. 1997. A constitutive Model for analysis of reinforced concrete solids. Canadian Journal of Civil Engineering 24 (3):460–70. doi:10.1139/l96-135.
- Senthivel, R., and B. L. Paulo. 2009. Finite element modelling of deformation characteristics of historical stone masonry shear walls. Engineering Structures 31 (9):1930–43. doi:10.1016/j.engstruct.2009.02.046.
- Smoljanović, H., Ž. Nikolić, and N. Živaljić. 2015. A finite-discrete element Model for dry stone masonry structures strengthened with steel clamps and bolts. Engineering Structures 90:117–29. doi:10.1016/j.engstruct.2015.02.004.
- Szołomicki, J. P., P. Berkowski, and J. Barański. 2014. Computer Modelling of Masonry Cross vaults strengthened with fi ber reinforced polymer strips. Archives of Civil and Mechanical Engineering 15 (3): 1–16. doi:10.1016/j.acme.2014.05.006.
- Tralli, A., C. Alessandri, and G. Milani. 2014. Computational methods for masonry vaults: A review of recent results. The Open Civil Engineering Journal 8 (1):272–87. doi:10.2174/1874149501408010272.
- Ungewitter, G. G., and K. Mohrmann. 1890. Lehrbuch Der Gotischen Konstruktionen. 3rd ed. Leipzig: Weigel.