
 ?Mathematical formulae have been encoded as MathML and are displayed in this HTML version using MathJax in order to improve their display. Uncheck the box to turn MathJax off. This feature requires Javascript. Click on a formula to zoom.
ABSTRACT
Cell division is important in human aging and cancer. The estimation of the number of cell divisions (mitotic age) of a given tissue type in individuals is of great interest as it allows not only the study of biological aging (using a new molecular aging target) but also the stratification of prospective cancer risk. Here, we introduce the MiAge Calculator, a mitotic age calculator based on a novel statistical framework, the MiAge model. MiAge is designed to quantitatively estimate mitotic age (total number of lifetime cell divisions) of a tissue using the stochastic replication errors accumulated in the epigenetic inheritance process during cell divisions. With the MiAge model, the MiAge Calculator was built using the training data of DNA methylation measures of 4,020 tumor and adjacent normal tissue samples from eight TCGA cancer types and was tested using the testing data of DNA methylation measures of 2,221 tumor and adjacent normal tissue samples of five other TCGA cancer types. We showed that within each of the thirteen cancer types studied, the estimated mitotic age is universally accelerated in tumor tissues compared to adjacent normal tissues. Across the thirteen cancer types, we showed that worse cancer survivals are associated with more accelerated mitotic age in tumor tissues. Importantly, we demonstrated the utility of mitotic age by showing that the integration of mitotic age and clinical information leads to improved survival prediction in six out of the thirteen cancer types studied. The MiAge Calculator is available at http://www.columbia.edu/∼sw2206/softwares.htm.
Introduction
The lifetime risks of many cancers are suggested to be correlated with the lifetime number of cell divisions of normal stem cells within those tissues [Citation1,Citation2]. Thus, the estimation of the number of cell divisions, that is, the construction of molecular mitotic clocks of a given tissue type in individuals allows stratification according to prospective cancer risk. Progress was made very recently with the construction of the DNA methylation-based mitotic-like clock epiTOC [Citation3]. This mitotic-like clock focuses on Polycomb group promoter CpGs and selected those CpGs for which DNA methylation levels increase with chronological age and are unmethylated in fetal tissues. By correlating the tick rate prediction from the model to the rate of stem cell divisions in normal tissues and an mRNA expression-based mitotic index in cancer tissues, this model is demonstrated to approximate a mitotic-like clock.
Here, we approached the same problem differently and introduced MiAge, a novel statistical model that quantitatively estimates mitotic age of a tissue using DNA methylation data. MiAge uses a molecular clock hypothesis [Citation4]. As a cell divides during normal human development and aging, in theory, the greater the number of divisions, the greater the number of somatic replication errors. Based on this molecular clock hypothesis, the majority of epigenetic changes in a genome as a cell divides are neutral (“passenger”), with minimal selective value. Those passenger changes are “odometer-like” clicks of a molecular clock [Citation5,Citation6]. The proposed MiAge statistical model utilizes the stochastic replication errors accumulated during cell divisions. Per cell division, two events could occur at a CpG site when epigenetic patterns are inherited: an existing methyl group may be lost (failure of maintenance) or a new methyl group may be added (de novo methylation) [Citation7]. Observed methylation levels at CpG sites thus may change stochastically over many cell divisions according to the probabilities of failure of maintenance and de novo methylation. Under the MiAge model, there are four types of CpG sites as a cell divides: (i) sites with methylation levels monotonically increasing over cell divisions if they have low initial methylation levels at the first cell generation, low probability of failure of maintenance and high probability of de novo methylation, which we name increasing-methylated CpGs and are informative in inferring mitotic age; (ii) sites with methylation levels monotonically decreasing over cell divisions if they have high initial methylation levels at the first cell generation, high probability of failure of maintenance, and low probability of de novo methylation, which we name decreasing-methylated CpGs and are informative in inferring mitotic age; (iii) sites with stationary methylation levels over cell divisions that are not informative in inferring mitotic age; and (iv) sites with unstable methylation levels, which are dynamic but not informative in inferring mitotic age. The MiAge model assumes site-specific parameters at a CpG site: the methylation level at the first cell generation, the probability of failure of maintenance, and the probability of de novo methylation are the same for all tissue samples of the same type. By comparing observed to expected methylation levels at present-day genome under the MiAge model, we are able to estimate the total number of cell divisions a tissue sample has gone through, as well as the site-specific parameters of selected CpGs that are most informative in inferring mitotic activities using a selection procedure imbedded in the MiAge model. We applied the MiAge model to training data of DNA methylation measures of 4,020 tumor and adjacent normal samples of 8 cancer types and built the MiAge Calculator that consists of a panel of 286 increasing-methylated CpGs that are mitotic-activity-informative together with their estimated site-specific parameters, which can be applied to methylation data of new samples of other tissue types to estimate their mitotic age. We tested this non-tissue-specific property of the MiAge Calculator using testing data of DNA methylation measures of 2,221 tumor and adjacent normal samples of 5 cancer types different from the 8 cancer types in the training data. We further validated the MiAge Calculator by showing high correlations between estimated mitotic age and three surrogate measures of the unknown true mitotic age.
Although we focused on cancer applications, the MiAge Calculator is readily applicable to aging studies using DNA methylation measures to estimate mitotic age as a new molecular target of aging marker.
Results
Estimation of mitotic age using a novel statistical framework based on DNA methylation transmission
MiAge statistical model
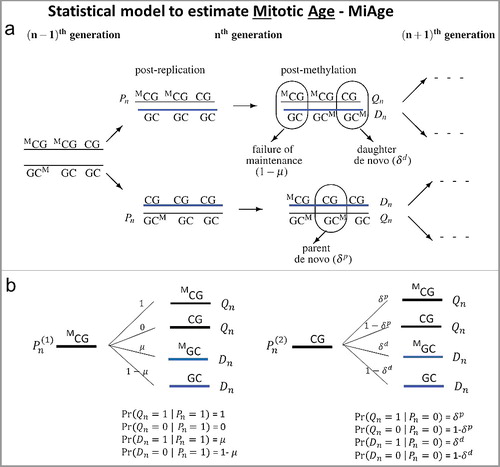
The MiAge model quantitatively estimates total number of cell divisions, i.e., mitotic age, of a tissue sample using DNA methylation data. To model changes in methylation patterns accumulated through cell divisions across CpGs, MiAge uses a previously developed model for methylation transmission process per cell division ((a)) [Citation7], from which we derived all possible probabilistic methylation transition events at a CpG ((b)), where Pn is the methylation status (1 if methylated and 0 otherwise) of a pre-replication parent strand in the nth cell generation; Qn is the methylation status of a post-methylation parent strand; Dn is the methylation status of a post-methylation daughter strand; µ is the probability of maintaining methylation during a cell division; and δp and δd are the probabilities of de novo methylation event on the parent and daughter strand. Thus Xn = (Qn+Dn)/2 is the mean methylation status of the double strands at a CpG site on one sister chromosome in the nth cell generation in one cell. The key feature of MiAge that makes the estimation of mitotic age possible is that the mean methylation status of the double strands of one sister chromosome Xn at a CpG in the nth cell generation of one cell only depends on Xn-1, that of the previous (n-1)th cell generation. That is, the probability distribution of Pr(Xn|Xn-1) can be readily derived based on the methylation transmission process as a function of the probabilities of de novo methylation δp, δd, the probability of failure of maintenance, 1-µ [see Supplementary Materials for detailed derivation of Pr(Xn|Xn-1)]. We can safely assume that the two sister chromosomes have the same transition process during cell divisions, thus having the same Xn at the CpG.
Figure 1. The methylation transmission process of the MiAge model. (a) During a cell division, each of the two strands of a DNA molecule becomes a parent strand, which is used as a template to synthesize a daughter strand. During the intermediate post-replication stage, daughter strands are completely unmethylated, whereas parent strands have the same methylation patterns as before. Subsequently, methyl groups are added to cytosines. In this process, failure of maintenance and/or de novo methylation events can occur with certain probabilities. (b) All methylation transition events that happen within a cell division. At a CpG site, Pn is the methylation status (1 if methylated and 0 otherwise) of a pre-replication parent strand in the nth cell generation; Qn is the methylation status of a post-methylation parent strand; Dn is the methylation status of a post-methylation daughter strand; µ is the probability of maintaining methylation during a cell division; and δp and δd are the probabilities of de novo methylation event on the parent and daughter strand. Thus Xn = (Qn+Dn)/2 is the mean methylation status of the double strands at a CpG site on one sister chromosome in the nth cell generation in one cell.
By recursively applying the methylation transmission probability Pr(Xn|Xn-1), we can derive E(Xn), the mean methylation level at a CpG in the nth cell generation of a tissue sample assuming all cells of this tissue sample have gone through the same number of cell divisions n [see Supplementary materials for detailed derivation of E(Xn)]. If we introduce the index i for CpG sites and index j for tissue samples, we can model the mean methylation level at CpG i in the njth cell generation of tissue sample j, , using EquationEquation (1)
(1)
(1) .
(1)
(1)
Here we assume parameters ,
at CpG site i are site-specific and are the same across samples. Here
describes the average rate of de novo methylation at CpG i, and
describes the fidelity of methylation maintenance at CpG i, and E(X1,i) is the methylation level at CpG i in the 1st cell generation. When
we have
and
. That is, the methylation status is perfectly transmitted with no random errors as cell divides, i.e.,
. We assume that every CpG is methylated independently of other CpGs in the genome.
With methylation measures at many CpG sites from many samples, we can estimate number of cell divisions nj of sample j and parameters ai, bi, and of CpG i by minimizing the following objective function in EquationEquation (2)
(2)
(2) , which compares the observed methylation level at CpG i of sample j, βi,j to expected methylation level under the MiAge model,
, across all samples and CpG sites.
(2)
(2)
Here, f is the sum of squares of the difference between observed and expected methylation levels, summed over all samples at CpG i, and then summed over all CpGs. Details of the optimization procedure are in the Materials and methods section.
MiAge is coupled with a procedure to select informative CpGs
As we pointed out, under the MiAge model, there are four types of CpG sites as cell divides depending on the value of the site-specific parameters ,
: (i) sites with increasing-methylated levels, which are informative in inferring mitotic age; (ii) sites with decreasing-methylated levels, which are also informative in inferring mitotic age; and (iii) sites with stationary-methylation levels, which are not informative in inferring mitotic age; and (iv) sites with unstable methylation levels, which are dynamic but are not informative in inferring mitotic age.
We need to separate informative CpGs from uninformative CpGs. The second step of MiAge is thus an iterative procedure to simultaneously select informative CpGs while estimating mitotic age nj during the optimization procedure of EquationEquation (2)(2)
(2) . To do this, we proposed an informativeness score si for CpG i, and a cutoff c0 for si to determine which sites are informative, prior to the optimization procedure of the objective function in EquationEquation (2)
(2)
(2) . The detailed description of the informativeness score si and the procedure to define the cutoff c0 are provided in the Materials and methods section.
Unidentifiability problem of MiAge
One important caveat when minimizing the objective function f in EquationEquation (2)(2)
(2) is that there is no unique solution minimizing f. As explained in more detail in the Materials and methods section, the sets
and
for a constant c give the same value of f with different sets of site-specific parameters ai, bi, and
. That is, if the true mitotic age is
, the best estimate will be
for some constant c. Thus, the estimated mitotic age is proportional to the true mitotic age and should be interpreted as a relative number rather than an actual number. Similarly, the estimated site-specific parameters ai, bi, and
are also proportional to the true values. However, this unknown constant is the same for all samples, thus the estimated relative mitotic ages are comparable across samples.
Simulation Studies of MiAge
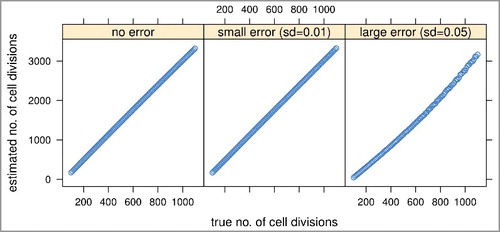
We conducted a set of simulation studies to investigate the feasibility and performance of MiAge and the robustness of MiAge to misspecifications of several key model assumptions. To mimic real DNA methylation data, the site-specific parameters ai, bi, and for each CpG i were set as the estimates from applying MiAge to TCGA BRCA Illumina HumanMethylation450 (450K) array data of 745 tumor samples and 96 adjacent normal samples. Specifically, using those site-specific parameter estimates, we calculated
using the EquationEquation (1)
(1)
(1) for about 450K CpGs of 101 tissue samples setting the true mitotic age nj for sample j, j = 1,…,101 to range from 100 to 1,100 increasing by 10. We considered three error settings: no error when observed methylation levels βi,j equal to the expected methylation levels, βi,j = E(Xnj,i); small errors βi,j = E(Xnj,i)±ϵi,j, ϵi,j∼N(0,0.01); and large errors βi,j = E(Xnj,i)±ϵi,j, ϵi,j∼N(0,0.05). The histograms of the three sets of simulated methylation values and the real methylation values of the 841 TCGA breast tumor and adjacent normal samples suggested that real methylation data is in between the small and large error scenarios (Supplementary Figure S1). The mitotic age estimates of MiAge model from the three error settings are all very much proportional to the true mitotic age even with large errors added (), which indicates that MiAge is feasible with the unidentifiability problem. The estimated and true values of the site-specific parameters
,
of the selected informative CpGs for the three error settings are also proportional (Supplementary Figure S3). In the following simulation settings, we simulated methylation values with large errors added.
Figure 2. Simulation studies to assess the feasibility and performance of the MiAge model. We compared estimated mitotic ages vs. true mitotic ages of all simulated tissue samples in the three error settings. The proportional relationship between the estimated vs. the true mitotic ages indicates MiAge is feasible even with the unidentifiability problem.
We next investigated the robustness of MiAge when the assumption that the site-specific parameters ,
at CpG i are the same across samples is not met. To do so, we simulated methylation data allowing each sample j to have different site-specific parameters. With methylation data simulated this way (see Materials and methods for details of the simulation steps), we estimated mitotic ages using MiAge that assumes the same site-specific parameters across samples. The estimated and true mitotic age in this simulation scenario are very much proportional (Supplementary Figure S4), indicating that MiAge is robust to this key assumption.
Another key assumption of MiAge is that all cells of tissue sample j have gone through the same number of cell divisions nj. To investigate the model robustness to this assumption, we simulated methylation values βi,j for CpG i sample j as a mixture of methylation values from two or more different types of cells whose true mitotic ages are different (see Materials and methods for detailed simulation steps). The results suggest that when a tissue sample is a mixture of two or more different cell types with very different true mitotic ages, if the proportion of one cell type is high, the mitotic age estimated using MiAge that assumes cellular homogeneity is very much proportional to the true mitotic age of the dominating cell type (Supplementary Figure S5).
We next examined if we can combine DNA methylation datasets from multiple tissue types and compare the estimated mitotic ages across tissue types. We simulated methylation values of two tissue types allowing a bigger between-tissue difference than a within-tissue difference across samples in site-specific parameters (see Materials and Methods for detailed simulation steps). The results, again, suggest that the estimated mitotic age is very much proportional to the true mitotic age (Supplementary Figure S6).
Building the MiAge Calculator
Training and testing data from TCGA for the MiAge Calculator
We obtained 450K DNA methylation data of cancer types with enough number of adjacent normal samples from TCGA in order to compare estimated mitotic ages of tumor samples to that of adjacent normal samples from same patients. Our simulation study suggested a minimum sample size of 30 for accurate mitotic age estimations (Supplementary Figure S7). TCGA cancer types that meet this criterion include breast invasive carcinoma (BRCA, 745 tumor and 96 normal samples), colon adenocarcinoma (COAD, 301 tumor and 38 normal samples), head and neck squamous cell carcinoma (HNSC, 530 tumor and 50 normal samples), kidney renal papillary cell carcinoma (KIRP, 276 tumor and 45 normal samples), kidney renal clear cell carcinoma (KIRC, 325 tumor and 160 normal samples), liver hepatocellular carcinoma (LIHC, 292 tumor and 50 normal samples), lung adenocarcinoma (LUAD, 466 tumor and 32 normal samples), lung squamous cell carcinoma (LUSC, 359 tumor and 42 normal samples), prostate adenocarcinoma (PRAD, 503 tumor and 50 normal samples), thyroid carcinoma (THCA, 515 tumor and 56 normal samples), and uterine corpus endometrial carcinoma (UCEC, 439 tumor and 34 normal samples).
Of these 11 cancer types, we used 8 cancer types (BRCA, COAD, HNSC, KIRP, LIHC, PRAD, THCA, UCEC) to build the MiAge Calculator, and used the rest 3 cancer types (LUAD, LUSC, KIRC) to test the non-tissue-specific property of the MiAge Calculator. In order to have more cancer types in the testing data, we added two more TCGA cancer types that have the largest number of samples with DNA methylation data and some adjacent normal samples: bladder urothelial carcinoma (BLCA, 419 tumor and 21 normal samples), and stomach adenocarcinoma (STAD, 395 tumor and 2 normal samples). For most of the TCGA cancer patients, one primary tumor sample was taken. For a few patients, one from primary tumor and one from metastasized tumor were taken. Rarely, multiple primary tumor samples were taken from one patient. For validation steps correlating mitotic age with unknown true mitotic age, we will use all samples. For correlating mitotic age with clinical variables and for survival prediction, we will use primary tumor only and for those with multiple primary tumor samples, we will use averaged mitotic age from multiple primary tumor samples for the patient.
Building the MiAge Calculator with training data of 8 TCGA cancer types
With the MiAge model, we built the MiAge Calculator, a non-tissue-specific mitotic age calculator, using the training data of 8 TCGA cancer types. There are two major steps in building the MiAge Calculator: i) to select a panel of “mitotic clock CpGs” that are neither tumor-related nor tissue-specific but are mostly informative in measuring mitotic activities and ii) to estimate site-specific parameters ,
of the selected panel of “mitotic clock” CpGs.
In identifying a panel of “mitotic clock” CpGs, the idea is that there exist “odometer-like” CpGs that are neither tumor-related nor tissue-specific but are mostly related to mitotic activities so that the defined panel of informative CpGs are considered as “mitotic clock” CpGs and can be used for other tissue types in other studies. For each of the 8 TCGA cancer types in the training data, we applied the MiAge model to DNA methylation data of available tumor and normal samples and identified 8 sets of informative CpGs that are either increasing- or decreasing-methylated (see detailed steps for selecting “mitotic clock” CpGs in Supplementary Materials). We then overlapped these 8 sets of informative CpGs and obtained 268 increasing-methylated CpGs and 4,014 decreasing-methylated CpGs. Both increasing- and decreasing-methylated are a known frequent characteristic of a variety of cancers but seem to affect different DNA sequences, with hypermethylation playing a transcription silencing role at promoters of many tumor suppressor genes and hypomethylation playing a less understood and more complicated role, including activation of tumor promoting genes and increased karyotypic instability [Citation8–15]. Recent research has shown that age-associated methylation changes observed within normal samples are more coherently observed within tumor samples at age-hypermethylated sites than age-hypomethylated sites [Citation16]. This is also supported by Yang et al [Citation3]. who also used age-hypermethylated sites in their mitotic-like clock epiTOC and showed that hypomethylation did not correlate well with the mitotic index in cancer tissue. Therefore, we chose to use the panel of 268 increasing-methylated CpGs to build the MiAge Calculator. We conducted a sensitivity analysis using the combined panel of the 268 increasing-methylated CpGs and the 4,014 decreasing-methylated CpGs as the selected panel of 4,282 “mitotic clock” CpGs and observed a lot weaker correlations between estimated mitotic ages and several surrogate measures of the unknown true mitotic ages (Supplementary Figure S9 for results of the sensitivity analysis using 4,282 CpGs). This supports our choice of the panel of 268 increasing-methylated CpG sites as the selected informative sites, which is also consistent with previous publications [Citation3,Citation16]. Information on these 268 CpGs is presented in Supplementary Table S2, where averaged informativeness scores were obtained from the 8 sets of informativeness scores from the eight cancer types in the training data.
We then estimated site-specific parameters ,
of the selected panel of 268 “mitotic clock CpGs”. To do so, we further randomly selected the same number of tumor and adjacent normal pairs from each of the 8 cancer types in the training data. This is because, the objective function in EquationEquation (2)
(2)
(2) is the sum of squares of the differences between expected and observed methylation values across all samples and all CpGs. If the number of samples of a cancer type is much greater than that of other cancer types, it may dominate the objective function and drive the optimization process in its favor. Among the 8 cancer types in the training data, UCEC has the smallest number of adjacent normal samples (n = 34). We thus randomly selected 34 tumor and adjacent normal pairs from other 7 cancer types. Using this data with 8 cancer types of 34 tumor and adjacent normal pairs each, we obtained the estimates of site-specific parameters
,
of the selected panel of 268 “mitotic clock CpGs” through minimizing the objective function in EquationEquation (2)
(2)
(2) . These parameter estimates of the 268 “mitotic clock CpGs” are then built-in the MiAge Calculator. The MiAge Calculator can be applied to estimate mitotic ages of any tissue samples using the DNA methylation data of this panel of 268 CpGs by minimizing the objective function in EquationEquation (2)
(2)
(2) .
With the panel of 268 increasing-methylated “mitotic clock” CpGs (Supplementary Table S2) and the built-in site-specific parameter estimates of the 268 “mitotic clock” CpGs, we can estimate mitotic ages, which are proportional to the true mitotic ages by an unknown constant c. Since this constant c is the same for all samples, the estimated mitotic ages are comparable across samples, across tissue types, and across studies. The MiAge Calculator is computationally efficient with running time increasing linearly with the number of samples. With 500 samples, it takes 25 seconds on Intel(R) Xeon(R) CPU E5-2630 0 @ 2.30GHz.
Stability of the MiAge Calculator with respect to the selection procedure
Having different number of tumor types in the training set may change the mitotic informative clock sites selected that are commonly increasing-methylated across these tumor types. We therefore investigated how stable the MiAge Calculator is with respect to the number of tumor types used in selecting the mitotic clock sites. When we defined the mitotic clock sites as those commonly increasing-methylated in at least 6 tumor types in the training data, 19,593 mitotic clock sites were selected. In doing so, we worked on all 28 possible combinations of 6 tumor types out of the 8 tumor types and the 19,593 mitotic clock sites are the overlapping sites out of the 28 sets of mitotic clock CpGs selected from the 28 possible 6 tumor sets. When we used 7 tumor types, 4,253 sites were similarly selected, compared to the 268 sites selected when we used all 8 tumor types. Although the number of selected mitotic clock sites varies, the mitotic age estimates using the three different sets of mitotic clock sites are highly correlated. We calculated mitotic age of tumor and normal samples of all cancer types (n = 6,261) and the correlation between mitotic age estimates using 268 sites and that using 4,253 sites is 0.97. The correlation between mitotic age estimates using 268 sites and that using 19,593 sites is 0.89, and the correlation between mitotic age estimates using 4,253 sites and that using 19,593 sites is 0.96. These results show that the mitotic age estimated using the MiAge Calculator is very robust with respect to the number of tumor types used in the training data for selecting mitotic clock informative sites.
In addition, in building the MiAge Calculator, after the selection of the 268 increasing-methylated mitotic clock CpGs, we randomly selected subsamples in each of the 8 tumor types so that every tumor type is represented by equal number of samples. This is because, the objective function EquationEquation (2)(2)
(2) that estimates mitotic age is the sum of squares of the differences between expected and observed methylation values across all samples and all CpGs. If the number of samples of a cancer type is much greater than that of other cancer types, it may dominate the objective function and drive the optimization process in its favor. To investigate the impact of the random subsamples on the site-specific parameter estimates of the 268 sites,
,
, we also conducted additional analyses where we repeated the random subsampling procedure 10 times and estimated the site-specific parameters of the 268 clock sites. We then estimated mitotic ages of tumor and adjacent normal samples of all cancer types (n = 6,261) using these 10 sets of site-specific parameter estimates. We found that the averaged correlation between the 10 sets of parameter estimates using the new subsamples and the parameter estimates built-in the MiAge Calculator using the first set of subsample is 0.934 for
, 0.923 for
and 0.996 for
. The averaged correlation between the 10 sets of 6,261 mitotic age estimates of tumor and normal samples of all cancer types (n = 6,261) using the 10 sets of site-specific parameter estimates and that using the MiAge Calculator is 0.999. These results show that the MiAge Calculator is very robust with respect to the samples used for its training.
Performance of the MiAge Calculator
Validation of the non-tissue-specific property of the MiAge Calculator using a testing data of 5 different cancer types
We first validated the non-tissue-specific property of the MiAge Calculator using a testing data of DNA methylation measures of 2,221 samples of 5 independent TCGA cancer types: BLCA, KIRC, LUAD, LUSC, and STAD. Within each cancer type in the testing data, we first built a temporary tissue-specific calculator using tumor and adjacent normal tissue samples from the cancer type only and then compared the mitotic ages estimated using the temporary tissue-specific calculator with the mitotic ages estimated using the non-tissue-specific MiAge Calculator. Within each of the 5 cancer types in the testing data, the correlations are 0.98 for BLCA, 0.99 for KIRC, 0.96 for LUAD, 0.92 for LUSC, and 0.94 for STAD. The high correlations indicate that the MiAge Calculator using a panel of 268 CpGs selected across the 8 cancer types in the training data is indeed non-tissue-specific. The MiAge Calculator therefore can be applied to DNA methylation data of the panel of selected 268 CpGs from any tissue types.
Validation of MiAge Calculator using surrogate measures of unknown true mitotic ages
Having validated the non-tissue-specific property of the MiAge Calculator in several independent cancer types in the testing data, we next validated the MiAge Calculator by correlating mitotic age estimates with several surrogate measures of unknown true mitotic ages. We correlated (i) the mitotic age estimates of some cell cultures with their passage numbers; (ii) the mitotic age estimates of TCGA tumor samples with number of somatic mutations accumulated in the same tumor samples across the 13 cancer types in the training and testing data; and (iii) the mitotic age estimates of TCGA adjacent normal samples that are proliferative with patients’ chronological ages.
Using the MiAge Calculator, we first estimated mitotic ages of 31 human embryonic stem (ES) cells and 35 human induced pluripotent stem (iPS) cells and then compared those with their passage numbers ((a)) [Citation17]. Although ES cells and iPS cells are different from tumor cells, the MiAge Calculator can be applied to their methylation measures to estimate the number of cell divisions of these cells, since the MiAge Calculator is based on mitotic clock informative CpG sites whose methylation alteration patterns are mostly related to mitotic activities. The ES cells, although different from tumor and adjacent normal cells, keep dividing when replication errors during cell divisions cumulate. The passage numbers of these cell lines correlate very well with their mitotic age estimates with r = 0.76 (P = 6.6e-07) for the ES cells and r = 0.42 (P = 0.01) for the iPS cells. It is expected that the correlation for the iPS cells is weaker since iPS cells are artificially derived from a non-pluripotent cell (adult somatic cell) by inducing a set of specific genes. Thus, their passage numbers may not reflect true mitotic age accurately.
Figure 3. Validation of the MiAge Calculator using three surrogate measures of unknown true mitotic ages. (a) Correlating mitotic ages of cell cultures with their passage numbers. With 31 human embryonic stem (ES) cells, the correlation is r = 0.76 (P = 1.3e-11). With 35 human induced pluripotent stem (iPS) cells, the correlation is r = 0.42 (P = 0.01). (b) Correlating mitotic ages of tumor tissues with number of somatic mutations in the same tumor tissues within each of the 13 cancer types. Seven cancer types show significant correlations, r = 0.44 (P = 2.4e-15) for BRCA, r = 0.47 (P = 3.4e-10) for PRAD, r = 0.45 (P = 2e-7) for STAD, r = 0.33 (P = 0.00018) for KIRC, r = 0.31 (P = 0.0022) for LIHC, r = 0.27 (P = 1.2e-05) for HNSC, and r = 0.25 (P = 0.043) for UCEC. (c) Correlating mitotic ages of adjacent normal tissues of selected proliferative tissue types with patients’ chronological ages, where 4 tissue types show significant correlations, r = 0.64 (P = 1.3e-05) for COAD, r = 0.37 (P = 1.6e-06) for KIRC, r = 0.48 (P = 7.7e-04) for KIRP, and r = 0.46 (P = 1.8e-04) for LIHC.
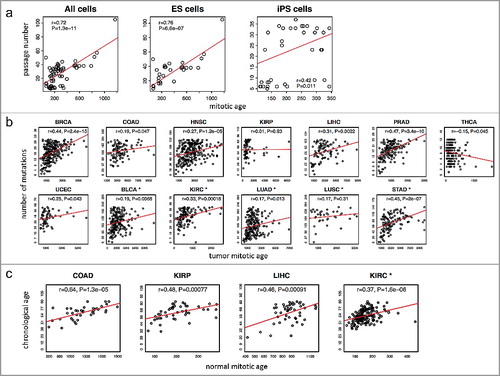
The investigation of the relationship between the mitotic age estimates of tumor samples and the number of somatic mutations accumulated in the same tumor samples suggests a high correlation in 7 cancer types out of the 13 cancer types in the training and testing data ((b)), r = 0.44 (P = 2.4e-15) for BRCA, r = 0.47 (P = 3.4e-10) for PRAD, r = 0.45 (P = 2e-7) for STAD, r = 0.33 (P = 0.00018) for KIRC, r = 0.31 (P = 0.0022) for LIHC, r = 0.27 (P = 1.2e-05) for HNSC, and r = 0.25 (P = 0.043) for UCEC.
Alexandrov et al [Citation18]. recently investigated clock-like mutational processes in human somatic cells and found two mutational signatures, signatures 1 and 5, which correlate with patients’ chronological ages. We correlated our estimated mitotic ages of tumor samples with the number of mutations of these two mutational signatures (Supplementary Figure S10). Our mitotic ages are significantly correlated with signature 1 in most tissue types, especially for BRCA (r = 0.31, P = 7.6e-16), COAD (r = 0.25, P = 0.00024), HNSC (r = 0.31, P = 4.5e-13), KIRP (r = 0.24, P = 0.0027), PRAD (r = 0.41, P = 2.6e-13) and STAD (r = 0.36, P = 1.9e-10), but less correlated with signature 5.
Lastly, for the selected renewable tissue types that are not under hormonal effect [Citation19], the estimated mitotic ages of TCGA normal adjacent tissues correlate well with patients’ chronological ages ((c)), r = 0.64 (P = 1.3e-05) for COAD, r = 0.37 (P = 1.6e-06) for KIRC, r = 0.48 (P = 7.7e-04) for KIRP, and r = 0.46 (P = 1.8e-04) for LIHC.
These high correlations between the mitotic age estimates of the MiAge Calculator and the surrogate measures of the unknown true mitotic ages provide some degree of validation of the MiAge Calculator.
Associating mitotic age with clinical variables
More accelerated mitotic age of tumor samples is associated with worse survivals across the 13 cancer types
We next examined mitotic age of tumor and adjacent normal samples across the 13 cancer types. We noticed that the mean mitotic age estimates of normal thyroid tissues of THCA patients was the smallest while that of the normal colon tissues of the COAD patients as the largest (Supplementary Table S3). Out of the 13 cancer types studied, colon, head and neck, liver, lung, and thyroid were also previously studied and the lifetime numbers of normal stem cell divisions of these tissues were calculated [Citation1]. The order of mean mitotic age estimates of adjacent normal tissues of these five tissue types from TCGA was THCA (thyroid) < LUSC (lung) < LUAD (lung) <HNSC (head and neck) < LIHC (liver) < COAD (colon) and agrees perfectly with the order of the number of normal stem cell divisions in the lifetime of those tissues previously calculated [Citation1]: thyroid < lung < head and neck < liver < colon. Moreover, we show that mitotic age is universally accelerated in tumor tissues compared to adjacent normal tissues across the 13 cancer types in the training and testing data (Supplementary Table S3).
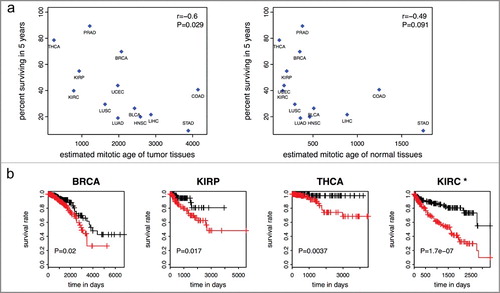
We next showed that worse survivals of many cancer types are associated with more accelerated mitotic age of tumor samples of those cancer types. Specifically, the mean mitotic age estimates of the 13 tumor tissue types are negatively correlated (r = −0.6, P = 0.029) with the percent surviving in 5 years of those cancer types ((a)). A weaker correlation between that of the 13 adjacent normal tissue types and percent surviving in 5 years (r = −0.49, P = 0.091) was observed. When we excluded STAD tissues for which only two normal samples were available, the correlation became −0.32 (P = 0.31). In Tomasetti and Vogelstein‘s paper [Citation1], the authors concluded a high positive correlation between cancer incidence rates and population level number of lifetime stem cell divisions in a hypothetical population. Here we concluded a high negative correlation between cancer survival rates and individual level number of cell divisions per lifetime in TCGA cancer patients.
Figure 4. Mitotic age of tumor tissues and cancer survival. (a) Higher averaged estimated mitotic ages of tumor tissues are associated with lower 5-year survival rates across the 13 cancer types in the training and testing data with r = −0.6 (P = 0.029) (left panel). The correlation is weaker and not significant for mitotic age of normal adjacent tissues (right panel). (b) Higher mitotic age is associated with worse survival in some cancers.
Higher mitotic ages are associated with more advanced tumors
We examined the association between the estimated mitotic age of a tumor sample with the T/N/M staging variables that describe the extent of the cancer. As shown in (a), the mitotic ages of tumor tissues increase significantly as the level of the T staging variable increases in general, except for cancer types like COAD, HNSC, and LIHC (Supplementary Table S4, (a)) after adjusting chronological age. This could partially be explained by the difference in definitions of the T staging system across different tumor types. For example, in stomach, colon, and liver cancers, T stages are determined by the extent of spread rather than the size of tumors while for breast, kidney, thyroid, and lung cancers, T stages are mainly determined by the tumor sizes. Specifically, the T stage of colon cancer is determined by the extent of spread through layers forming the colon wall; the T stage of liver cancer is mainly determined by whether the cancer has grown into nearby blood vessels or organs; while for breast cancer, T = 1,2,3 is for tumors of increasing sizes and T = 4 is for tumors of any size growing into the chest wall or skin. The mitotic age estimates correlate better with the T stage variable indicating tumor sizes than that indicating tumor spread, as tumor sizes are more directly related with the number of cell divisions. We also noticed that the mitotic age estimates of tumor tissues significantly increase as chronological ages increase, as expected for most tissue types, but not for KIRP and LUSC. However, for KIRP and LUSC, the mitotic ages of adjacent normal tissues are positively correlated with chronological age. This may imply that for these tissue types, tumors of older patients tend to divide slower than those of younger patients. UCEC, BLCA, and PRAD were excluded from this analysis since T stage information was not available for UCEC and there were no or too few T = 1 stage tumors for BLCA and PRAD.
Figure 5. TNM staging variables and mitotic age estimates of tumor tissues. The plots show the regression coefficients and corresponding 95% CIs associating TNM staging variables and mitotic age estimates of tumor tissues adjusting for chronological age. (a) T variable assumes a number from 1 to 4 and describes tumor sizes and its spread to nearby tissues with higher T numbers indicating larger tumors or wider spread to nearby tissues. is the increase in mitotic ages for the group with T = k compared to the reference group with T = 1. (b) N variable assumes a number from 0 to 3 and describes the number of lymph nodes that have cancerous cells with N = 0 indicating no cancer in any lymph nodes and higher N numbers indicating a greater spread to nearby lymph nodes. N = 2 and N = 3 tumors were grouped together due to sparse data for most cancer types.
is the increase in mitotic ages for the group with N = k compared to the reference group with N = 0. (c) M variable determines if cancer has metastasized to other organs of the body with M = 0 indicating no metastasis and M = 1 indicating metastasis.
is the increase in mitotic ages for the metastasized group compared to the group with no metastasis.
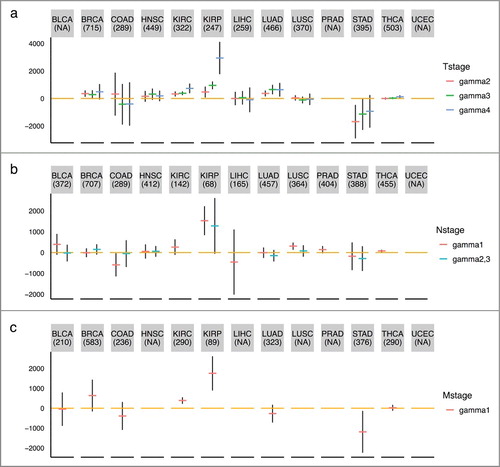
As shown in (b), the mitotic ages of tumor tissues increase as tumor N stage (number of lymph nodes) increases for KIRP and THCA (Supplementary Table S4) after adjusting for chronological age. There is no N stage information for UCEC. For LIHC, PRAD and THCA, there are no N = 2,3 tumors. As shown in (c), we observed that only for KIRC and KIRP, the mitotic ages of the primary tumors that were metastasized are significantly higher than those of the primary tumors that were not metastasized (Supplementary Table S4) after adjusting for chronological age. This implies that metastasis does not necessarily occur late in tumor progression for many tumors. HNSC, LIHC, PRAD, UCEC, and LUSC were excluded from this analysis, as the number of patients that have metastatic tumors is less than five. It is important to point out that the not-so-strong associations between mitotic age and number of lymph nodes and metastasis status is not a limitation of the MiAge model, but, in fact, an advantage of mitotic age since this means the mitotic age could provide additional information that current clinical information does not offer. It also reflects that biological processes underlying development of lymph nodes and metastasis might be unrelated to cell divisions.
Combination of mitotic age with TNM stage information improves prediction of patient survival in six out of thirteen cancer types studied
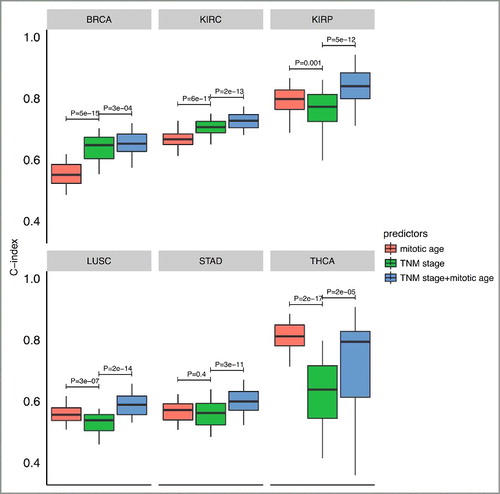
Finally, we investigated the prognostic value of mitotic age as a predictor of patient survival within each of the 13 TCGA cancer types. We asked whether the use of mitotic age could lead to improved prediction accuracy of patient survival in integration with existing TNM stage information in individual cancers. To assess this clinical utility of the mitotic age-based survival predictor, we performed a two-fold cross validation analysis within each of the 13 cancer types (see details in Materials and methods). Briefly, for each cancer, in each cross validation, we randomly split patients into a training group of 50% patients and a testing group of the remaining 50% patients. Then a Cox regression was used to build the predictive model either using mitotic age only, using TNM stage information only, or using TNM stage information plus mitotic age. We then applied the predictive model built from the training group in the testing group to test the model and repeated the cross validation procedure 100 times. We used C-index to measure the prediction accuracy of the model, where a C-index of 1 indicates perfect prediction accuracy and a C-index of 0.5 indicates random guess.
As shown in , in 6 cancer types out of the 13 cancer types studied, integrating mitotic age with TNM stage information significantly improves the discriminatory power of clinical information alone (clinical versus clinical + mitotic age P = 3e-04 for BRCA with two-sided paired Wilcoxon rank sum test; P = 2e-13 for KIRC; P = 5e-12 for KIRP; P = 2e-14 for LUSC; P = 3e-11 for STAD; and P = 2e-05 for THCA). C-index results from multiple prediction models for all 13 cancer types are provided in Supplementary Figure S8. This improved prediction accuracy across multiple cancers was not due to over-fitting since the training group and the testing group was completely separated with independent patients in the cross validation procedure. This result illustrates the potential value of utilizing mitotic age as a new predictor to improve cancer prognosis. Further studies are required in order to evaluate the clinical potential of MiAge, e.g., see if there is an independent prognostic value considering TNM stage, tumor size, and patient age.
Figure 6. Boxplots of C-index of different survival predictors of 6 cancer types from cross-validation procedures. The plots show the distribution of C-indexes from 100 rounds of cross-validation. P-values are from a paired (two-sided) Wilcoxon rank sum test comparing different survival predictors.
Comparison of MiAge and epiTOC
The MiAge Calculator uses a panel of 268 mitotic clock CpGs that were commonly identified as increasing-methylated sites when the MiAge model was applied to DNA methylation data of each of the 8 TCGA cancer types in the training data. These 268 mitotic clock sites together with their estimated site-specific parameters ,
make up the MiAge Calculator, which can be applied to estimate mitotic ages of any samples using their DNA methylation data of the 268 CpGs by minimizing the objective function in EquationEquation (2)
(2)
(2) .
The epiTOC selected 385 CpG sites that satisfy the following three criteria: (i) CpGs that are unmethylated in fetal tissue encompassing 11 different fetal tissue types; (ii) CpGs in gene promoters marked by the PRC2 polycomb repressive complex [Polycomb group targets (PCGTs)] in human embryonic stem cells; and (iii) CpGs exhibiting age-associated hypermethylation [false discovery rate (FDR) <0.05] [Citation3]. For any given sample, epiTOC estimates mitotic-like clock, “pcgtAge”, as the average DNA methylation level over these 385 CpG sites, which represents the age-cumulative increase in DNA methylation level at these sites due to putative cell-replication errors.
Although both methods selected increasing-methylated sites, only two CpG sites overlap between our 268 mitotic clock sites and their 385 epiTOC sites (). In spite of this difference, mitotic age from the MiAge Calculator and pcgtAge from epiTOC of both tumor and adjacent normal samples are highly correlated across all tumor types, ranging from 0.7 to 0.97 ().
Table 1. CpG sites that are commonly used in the MiAge Calculator and epiTOC.
Table 2. Correlations between mitotic age estimates from the MiAge Calculator and pcgtAge for tumor and adjacent normal samples across tumor types.
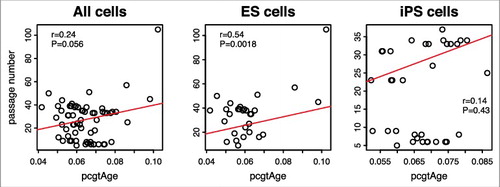
However, unlike for tumor and adjacent normal samples, mitotic age estimates of the 31 human ES cells and 35 human iPS cells from the MiAge Calculator and pcgtAge from epiTOC are much less correlated (r = 0.29). Moreover, the correlation between pcgtAge of the 31 ES cells and 35 iPS cells and their passage numbers is only 0.24 (), much lower than that observed with the mitotic age estimated using the MiAge Calculator, which is 0.72.
Figure 7. Passage number vs. pcgtAge for ES and iPS cells. The plot shows the correlation between pcgAge of cell cultures and their passage numbers. With 31 human embryonic stem (ES) cells, the correlation is r = 0.54 (P = 0.0018). With 35 human induced pluripotent stem (iPS) cells, the correlation is r = 0.14 (P = 0.43). With ES and iPS cells combined, the correlation is r = 0.24 (P = 0.056).
Discussion
Although it has been long established that cell division is essential for the development of human cancer, no quantitative method exists that can directly estimate total number of cell divisions for cancer risk stratification or prognosis. Very recently, independent progress was made where an epigenetic mitotic-like clock was developed focusing on Polycomb-group promoter CpGs from which tick rates were predicted and shown to correlate with the rate of stem cell divisions in normal tissues, as well as an mRNA-based mitotic index in cancer tissue. Here, we developed the MiAge Calculator that can estimate mitotic ages of any tissue types using DNA methylation data of a panel of 268 selected “mitotic clock” CpGs. The MiAge Calculator is based on the MiAge model, a novel statistical model that models the stochastic replication errors accumulated in epigenetic inheritance process to infer mitotic ages. The MiAge model couples with an iterative procedure to select CpGs that are informative for the mitotic activities. Using the training data of 4,020 samples from 8 cancer types, we built the MiAge Calculator that contains a panel of 268 selected informative CpGs and the parameter estimates of the rate of de novo methylation, rate of the fidelity of methylation maintenance, and the methylation level in the starting methylation state of these 268 selected CpGs so that the MiAge Calculator can be readily applied by other researchers to any tissue samples that have DNA methylation data of the selected 268 CpGs.
Although we acknowledge that due to the unidentifiability problem of MiAge, current estimates of mitotic age are proportional to the true mitotic ages by an unknown constant c, this unknown constant is the same for all samples. Thus, the mitotic age estimates of the MiAge Calculator are comparable across samples, across tissue types, and across studies. Importantly, the non-tissue-specific property of the MiAge Calculator was validated in five independent cancer types in the testing data and the mitotic age estimates were further validated using several surrogate measures of unknown true mitotic ages. With human ES cells and human iPS cells, the mitotic ages of these cells are correlated with their passage numbers (r = 0.76 for the ES cells and r = 0.42 for the iPS cells). Also supporting this, mitotic ages of TCGA tumor samples correlate with the number of somatic mutations accumulated in the same tumor samples in 7 out of the 13 cancer types studied in the training and testing data.
Assessment of mitotic ages of TCGA normal adjacent tissue types that were also previously studied where the dynamics of stem cell divisions of these tissue types have been described experimentally suggests a perfect agreement in the order of the magnitude of the mitotic age estimates of TCGA normal adjacent tissues of the MiAge Calculator and number of cell divisions of normal stem cells calculated for hypothetical tissue samples with known dynamics of stem cell divisions [Citation1]. Another important finding of ours that shows a negative correlation (r = −0.6) between mitotic ages of tumor tissues and the percent surviving in 5 years across the 13 TCGA cancer types agrees with the previous conclusion that the lifetime risks of many cancers are positively correlated with the lifetime number of cell divisions of normal stem cells within those tissues in hypothetical subjects from a different angle [Citation1]. Although the association between mitotic age of TCGA tumor tissues and number of lymph nodes and metastasis status are less conclusive, we consider this an advantage of the mitotic age that measures something current clinical information does not. Mitotic age is only observed to be associated with lymph nodes in KIRP and THCA and with metastasis status in KIRC and KIRP; therefore, reflect biological processes underlying development of lymph nodes and metastasis might be unrelated to cell divisions.
Finally, with cross-validation analyses, we evaluated the prognostic value of mitotic age and compared it to that of clinical information for predicting patient survival. We show that the mitotic age can be used as a predictor for patient survival, with improved prediction accuracy integrating mitotic age and clinical information than that of clinical predictors alone in 6 out of the 13 cancer types studied. This promising result calls for further studies to fully explore the utility of mitotic age in each individual cancer for different clinical applications.
The MiAge Calculator can be readily applied to methylation measures from the MethylationEPIC array. Two hundred and forty-one sites out of the 268 selected mitotic clock CpGs are also on the EPIC array. Note that if methylation measures from 450K and EPIC array are going to be combined, a normalization step to calibrate 450K data and EPIC data should be conducted, where we could use the R code from Horvath https://labs.genetics.ucla.edu/horvath/dnamage/NORMALIZATION.R. For bisulfite sequencing data, the MiAge Calculator can also be readily applied if sequencing data are processed into methylation percentages. Although with the greater coverage of the EPIC array and sequencing data the MiAge Calculator may be updated if data were available, our sensitivity analysis using different subsets of the mitotic informative CpGs showed that the mitotic age estimates are highly correlated with almost all correlations greater than 0.9.
The MiAge Calculator was built using the 450K data without Type I/II probe normalization but with sites on sex chromosomes and sites overlapping with single nucleotide polymorphisms (SNPs) being removed. We also investigated the potential impact of having or not having Type I/II probe normalization on building the MiAge Calculator. We found that the estimates of the site-specific parameters of the 268 mitotic clock CpGs using methylation data with and without Type I/II probe normalization are almost perfectly correlated with a correlation of 0.999 for , 0.999 for
, and 0.996 for
. The mitotic age estimates of tumor and adjacent normal samples of all tumor types (n = 6,261) using methylation data with and without Type I/II probe normalization are also almost perfectly correlated (r = 0.9995). Finally, the mitotic age estimated using the 268 site-specific parameter estimates from Type I/II probe normalized methylation measures are almost perfectly correlated with that estimated using the MiAge Calculator (r = 0.9988). These findings suggest that the MiAge Calculator is very robust and can be readily applied to other types of methylation data with different data processing steps.
The MiAge Calculator together with the source code is available for downloading at http://www.columbia.edu/∼sw2206/softwares.htm. The MiAge Calculator can be applied to any tissue types of any cancer type. The current statistical framework of the MiAge Calculator is applicable to DNA methylation proportion data. Other type of DNA methylation data generated from other platforms, such as sequencing platforms, can be used with the MiAge Calculator if processed from counts data to proportion data.
Although we focused on cancer applications of the MiAge Calculator, it is readily applicable to aging studies using DNA methylation measures to estimate mitotic age as a new molecular target of aging marker.
Materials and methods
MiAge is coupled with a procedure to select informative CpGs.
At each CpG i, we can safely assume the fidelity of methylation maintenance is between 0 and 1 because the methylation maintenance rate µi is in general close to 1 and the de novo methylation rates
are close to 0 [Citation7,Citation20]. For those CpGs with
, we have
, which means the methylation levels in the
cell generation of sample j are the same as that in the 1st cell generation. Thus, CpGs with bi = 1 are not informative in estimating mitotic age. For CpGs with unstable methylation levels, e.g., when both probabilities for failure of maintenance (
) and the de novo methylation rates
are comparatively high, their fidelity of methylation maintenance
will be small. These CpGs have
for a reasonable range of
(e.g., if
,
when
) according to EquationEquation (1)
(1)
(1) . Therefore, those CpGs are like CpGs with
and are not informative in estimating mitotic age. For those uninformative CpGs, we have
for some site-specific nuisance parameter
that is unrelated to mitotic age
. For all other informative CpGs, methylation levels either monotonically increase as nj increases (increasing-methylated CpGs) if
or monotonically decrease otherwise (decreasing-methylated CpGs).
The second step of MiAge is thus an iterative procedure to update the separation of informative CpGs modeled with from uninformative CpGs modeled with
. With each CpG site being labeled as informative or uninformative, the objective function f in EquationEquation (2)
(2)
(2) which measures the discrepancy between the observed methylation measures and the expected methylation measures under the MiAge model becomes:
(3)
(3) where
sums over all tissue samples j = 1,…,J at uninformative CpG i, and
sums over all tissue samples j = 1,…,J at informative CpG i, and I() is an indicator function.
Informativeness score  and cutoff
Since we do not know a priori which CpGs are informative, we need to determine this during the model fitting procedure. To do so, we developed an informativeness score for each CpG i, defined as
. The informativeness score
for each CpG i is the difference of residual sum of squares between the two models for CpG site i: model for uninformative sites
and model for informative sites
. By comparing which of the two models fit the observed methylation data at CpG site i better, we choose between whether the CpG site i is informative or uninformative. Because the model for informative sites has more parameters, the residual sum of squares for CpG i (the sum of squares of the difference between observed and expected methylation levels, summed over all tissue samples at CpG i) under the model for uninformative sites:
will be larger than that under the model for informative sites:
. Note that
is average of methylation values for CpG site i across all samples.
Thus, we need to define a cutoff c0 (>0, to be discussed next) for prior to the optimization process of the objective function in EquationEquation (3)
(3)
(3) . Once c0 is determined, it is fixed during the iterative optimization procedure where sites with
are set as informative and sites with
are set as uninformative. The objective function f then becomes:
(4)
(4) To determine the cutoff c0, we calculated
for each CpG site i under the “null model” when methylation levels do not change as cell divides. Under the “null model”, we assigned mitotic age nj to each tissue sample j generated randomly from a Unif(100, 3000) distribution and calculated
for each CpG site i. Note that in calculating
, we treated randomly generated
for tissue sample j as known, but estimated site-specific parameters
minimizing
. Here,
can be considered as the decrease in the residual sum of squares purely due to over-fitting. Therefore, we set
over all available CpG sites as the cutoff c0. We conducted a simulation study to investigate the impact of different cutoffs on the performance of MiAge. The simulation results support the choice of
(Supplementary Materials).
Optimization procedure
With c0 determined, we estimate the parameters and other site-specific parameters
minimizing the objective function in EquationEquation (4)
(4)
(4) through the following iterative optimization process.
Let denote the initial value of mitotic age assigned to each tissue sample j. Given
, at CpG site i, we calculate
and determine if CpG i is informative (if
) or uninformative (if
). In calculating
, we estimate site-specific parameters
minimizing
and
, respectively subject to the following linear inequality constraints
We then update
to minimize the following objective function given these site-specific parameters
with the constraint
and obtain
. We iteratively repeat the above steps until
converges. We used the R function ‘optim’ to find parameters minimizing a given function.
Unidentifiability problem of MiAge
One important caveat when minimizing the objective function f in EquationEquation (4)(4)
(4) is that there is no unique solution minimizing f. This is because
Therefore, the sets and
for a constant c give the same value of f with different sets of site-specific parameters
and
if
and
,
. That is, if the true mitotic age of tissue sample j is
, the best estimate will be
for some constant c. Thus, the estimated mitotic age is proportional to the true mitotic age and should be interpreted as a relative number rather than an actual number. Similarly, the estimated site-specific parameters for CpG site i are also proportional to the true values. This is because when
is close to 1 for informative sites, we have
.
is also linearly related with
because
.
Simulation studies of MiAge
We conducted a set of simulation studies to investigate the robustness of MiAge when the assumption that the site-specific parameters ,
at CpG i are the same across samples is not met. To do so, we simulated methylation data allowing each sample j to have different site-specific parameters. Note the correspondence between site-specific parameters
and the original parameters on methylation transmission rates
at CpG i:
, and
, where parameters
and
cannot be separated. Specifically, for each sample j, we first simulated site-sample-specific parameters
and
, where
were simulated from
and
is the parameter estimated from the TCGA BRCA data. Other site-sample-specific parameters
and
were similarly simulated. With these site-sample-specific parameters, we then calculated the expected methylation level
at CpG i for sample j given nj using EquationEquation (1)
(1)
(1) and added large errors
.
We also investigated the robustness of MiAge when the assumption that all cells of tissue sample j have gone through the same number of cell divisions nj is not met, but instead a tissue sample is a mixture of different types of cells with different mitotic ages. We simulated methylation values βi,j for CpG i of sample j as a mixture of methylation values from two or more different types of cells whose true mitotic ages are different. We first simulated mixture samples consisting of two cell types, with proportion of the dominating cell type = 0.7, 0.8, 0.9 (see Supplementary Materials for detailed simulation steps). We then simulated mixture samples consisting of three cell types, with proportion of the dominating cell type = 0.7, 0.8, 0.9 and proportion of each of the other two minor cell types = 0.15, 0.1, 0.05, respectively. Similarly, we simulated mixture samples consisting of four cell types with proportion of the dominating cell type = 0.7, 0.8, 0.9 and proportion of each of the other three minor cell types = 0.1, 0.0667, 0.0333, respectively.
We further investigated if multiple DNA methylation datasets from multiple tissue types can be combined and the mitotic age estimates across different tissue types can be compared. Here, we allowed the site-specific parameters ,
at CpG i to be first different across tissue types then different across samples within a tissue type (see Supplementary Materials for detailed simulation steps).
Validation of MiAge Calculator as non-tissue-specific using testing data of 5 different TCGA cancer types
The MiAge Calculator built with the training data of 8 cancer types is expected to be non-tissue-specific and can be applied to any tissue types. We validated this property using the testing data of 5 independent TCGA cancer types. To do so, we first built a temporary tissue-specific calculator for each cancer type in the testing data. To build the temporary tissue-specific mitotic age calculator for each cancer, we used the same panel of selected 268 “mitotic clock” CpGs but estimated the site-specific parameters using available tumor and adjacent normal samples of each cancer type in the testing data instead of using the MiAge Calculator built-in parameters estimates. We then examined the correlation between mitotic ages estimated using the MiAge Calculator and mitotic ages estimated using the temporary tissue-specific calculator for each cancer type in the testing data. High correlations indicate that the MiAge Calculator is non-tissue-specific and can be applied to DNA methylation data of the selected panel of 268 “mitotic clock CpGs” of any tissue types.
Validation of MiAge Calculator using surrogate measures of unknown true mitotic ages
We next validated the MiAge Calculator by correlating estimated mitotic ages with several surrogate measures of the unknown true mitotic age: (i) correlating mitotic ages of cell cultures with their passage number; (ii) within each of the 13 cancer types in the training and testing data combined, correlating mitotic ages of TCGA tumor samples with number of somatic mutations accumulated in the same tumor samples; and (iii) correlating mitotic ages of adjacent normal samples with the patients’ chronological age within each of the selected tissue types that are proliferative.
We obtained 450K DNA methylation data of 31 human ES cells and 35 human iPS cells [Citation17]. We estimated mitotic ages of these cell cultures using the MiAge Calculator and correlated them with the passage numbers of these cell cultures.
Within each of the 13 cancer types, we then investigated the relation between the estimated mitotic age of tumor samples and the number of somatic nucleotide mutations accumulated in the same tumor samples. Although somatic mutations are acquired during each cell division with very low probabilities, the number of somatic mutations accumulated can reflect the total number of cell divisions the cell has undergone. One potential problem of using this measure is that there are samples with much higher mutation rates than others due to factors like environmental mutagens or mutations in genes that maintain genomic stability. Those samples tend to accumulate more somatic mutations and their mitotic ages might be overestimated [Citation21]. To correlate number of somatic mutations in tumor samples and their mitotic age estimates, we thus restricted to tumor samples with number of somatic mutations below the median of all samples within that tumor type. To calculate the number of somatic mutations per tumor sample, we also excluded mutations in candidate cancer driver genes identified by the MutSIG algorithm at FDR ≤0.3 [Citation22].
Lastly, within each of these renewable tissue types out of the 13 tissue types in the training and testing data combined, we compared the estimated mitotic ages of adjacent normal samples with the chronological ages of the patients. While the mitotic age of a tumor tissue is usually larger than that of the adjacent normal tissue from the same patient, the tumor and adjacent normal samples of the same patient have the same chronological age. Mitotic ages of normal proliferative tissues that consist of mitotic cells capable of proliferation may correlate better with chronological age while mitotic ages of tissues that do not divide or tissues whose divisions are under hormonal effect may not correlate well with chronological age. Therefore, we compared mitotic ages of adjacent normal tissues from the major renewable organs such as colon, liver, and kidney with their chronological ages.
High correlations between the mitotic age estimates and the surrogate measures provide some degree of validation of the MiAge Calculator.
Correlation of individual-level mitotic age with individual-level clinical information and survival within each cancer
Within each cancer, we evaluated associations between mitotic age of tumor samples with widely used T/N/M staging variables that describe the extent of the cancer. For the TCGA T/N/M staging variables, the T variable describes tumor sizes and its spread to nearby tissues; the N variable describes the number of lymph nodes that have cancerous cells; the M variable determines if cancer has metastasized to other organs of the body. To examine the relationship between mitotic age of tumor samples with the T/N/M staging variables, we fit the following linear regression adjusting for patients’ chronological ages: (4)
(4) where I is an indicator for the T/N/M staging variable with T = 1/N = 0/M = 0 as the reference group. Therefore,
can be considered as the increase in mitotic ages for the T/N/M staging variables of group k compared to the reference group. The estimate of
is the increase in mitotic ages per one year increase in chronological age. We also examined mitotic age estimates of tumor samples to that of the matched adjacent normal samples and examined the association between time to death and dichotomized mitotic age of tumor samples categorized at median using Kaplan-Meier curves and the log-rank test.
Evaluation of estimated mitotic age as a survival predictor using cross-validation
Within each of the 13 cancer types, we evaluated and compared the survival prediction using clinical information alone, using mitotic age alone, and using clinical information plus mitotic age. We used two-fold cross validation where in each round of cross validation we randomly split cancer patients into two groups with 50% patients in the training group and the remaining 50% patients in the testing group. We used even split to ensure there are enough death events in both groups. With the training group, we built the survival prediction model based on estimated mitotic age, clinical information with one of the TNM staging variables, whichever is the most significant, and clinical information plus estimated mitotic age. After the model was built using the training group, we used the testing group to test the prediction accuracy of the predictive model using the C-index [Citation23], where a C-index of 1 indicates perfect prediction and a C-index of 0.5 indicates random guess. We repeated the cross validation 100 times and compared C-indexes from different predictive models using a paired (two-sided) Wilcoxon rank sum test.
Disclosure of potential conflicts of interest
No potential conflicts of interest were disclosed.
Supplementary_material.rar
Download (4.4 MB)Related Research Data
References
- Tomasetti C, Vogelstein B. Variation in cancer risk among tissues can be explained by the number of stem cell divisions. Science. 2015;347:78–81. doi:10.1126/science.1260825. PMID:25554788
- Wu S, Powers S, Zhu W, et al. Substantial contribution of extrinsic risk factors to cancer development. Nature. 2016;529:43–47. doi:10.1038/nature16166. PMID:26675728
- Yang Z, Wong A, Kuh D, et al. Correlation of an epigenetic mitotic clock with cancer risk. Genome Biol. 2016;17:205. doi:10.1186/s13059-016-1064-3. PMID:27716309
- Bromham L, Penny D. The modern molecular clock. Nat Rev Genet. 2003;4(3):216–224. doi:10.1038/nrg1020. PMID:12610526
- Shibata D. Inferring human stem cell behaviour from epigenetic drift. J Pathol. 2009;217(2):199–205. doi:10.1002/path.2461. PMID:19031430
- Shibata D, Tavar S. Counting Divisions in a Human Somatic Cell Tree: How, What and Why. Cell Cycle. 2006;5(6):610–614. doi:10.4161/cc.5.6.2570. PMID:16582617
- Genereux DP, Miner BE, Bergstrom CT, et al. A population-epigenetic model to infer site-specific methylation rates from double-stranded DNA methylation patterns. Proc Natl Acad Sci U S A. 2005;102:5802–5807. doi:10.1073/pnas.0502036102. PMID:15827124
- Ehrlich M.. DNA methylation in cancer cells. Epigenomics. 2010;1(2):239–259. doi:10.2217/epi.09.33.
- Wilson AS, Power BE, Molloy PL. DNA hypomethylation and human diseases. Biochimica et Biophysica Acta. 2007;1775:138–162. PMID:17045745
- Ehrlich M. DNA methylation in cancer: too much, but also too little. Oncogene. 2002;21(35):5400–5413. doi:10.1038/sj.onc.1205651. PMID:12154403
- Kulis M, Esteller M. DNA methylation and cancer. Adv Genet. 2010;70:27–56. PMID:20920744
- Ehrlich M. Cancer-linked DNA hypomethylation and its relationship to hypermethylation. Curr Top Microbiol Immunol. 2006;310:251–274. PMID:16909914
- Shahrzad S, Bertrand K, Minhas K, et al. Induction of DNA Hypomethylation by Tumor Hypoxia. Epigenetics. 2007;2:119–125. doi:10.4161/epi.2.2.4613. PMID:17965619
- Hon GC, Hawkins RD, Caballero OL, et al. Global DNA nypomethylation coupled to repressive chromatin domain formation and gene silencing in breast cancer. Genome Res. 2012;22:246–258. doi:10.1101/gr.125872.111. PMID:22156296
- Jones PA. DNA methylation and cancer. Cancer Res. 1986;46:461–466. PMID:2416425
- Lin Q, Wagner W. Epigenetic aging signature are coherently modified in cancer. PLoS Genet. 2015;11(6):e1005334. doi:10.1371/journal.pgen.1005334. PMID:26110659
- Nazor KL, Altun G, Lynch C, et al. Recurrent variations in DNA methylation in human pluripotent stem cells and their differentiated derivatives. Cell stem cell. 2012;10:620–634. doi:10.1016/j.stem.2012.02.013. PMID:22560082
- Alexandrov LB, Jones PH, Wedge DC, et al. Clock-like mutational processes in human somatic cells. Nat Genet. 2015;47(12):1402–1407. doi:10.1038/ng.3441. PMID:26551669
- Cooper GM, Hausman RE. The cell: A molecular approach. 6th edition. Sunderland (Massachusetts): Sinauer Associates. 2013.
- Laird CD, Pleasant ND, Clark AD, et al. Hairpin-bisulfite PCR: assessing epigenetic methylation patterns on complementary strands of individual DNA molecules. Proc Natl Acad Sci USA. 2004;101(1):204–209. doi:10.1073/pnas.2536758100. PMID:14673087
- Youn A, Simon R. Using passenger mutations to estimate the timing of driver mutations and identify mutator alterations. BMC Bioinformatics. 2013;14:363. doi:10.1186/1471-2105-14-363. PMID:24330428
- Lawrence MS, Stojanov P, Polak P, et al. Mutational heterogeneity in cancer and the search for new cancer-associated genes. Nature. 2013;499:214–218. doi:10.1038/nature12213. PMID:23770567
- Pencina MJ, D'Agostino RB. Overall C as a measure of discrimination in survival analysis: model specific population value and confidence interval estimation. Stat Med. 2004;23:2109–2123. doi:10.1002/sim.1802. PMID:15211606