
ABSTRACT
Sessile serrated adenomas/polyps (SSA/Ps) are the putative precursors of the ~20% of colon cancers with the CpG island methylator phenotype (CIMP). To investigate the epigenetic phenotype of these precancers, we prospectively collected fresh-tissue samples of 17 SSA/Ps and 15 conventional adenomas (cADNs), each with a matched sample of normal mucosa. Their DNA was subjected to bisulfite next-generation sequencing to assess methylation levels at ~2.7 million CpGs located predominantly in gene regulatory regions and spanning 80.5Mb; RNA was sequenced to define the samples’ transcriptomes. Compared with normal mucosa, SSA/Ps and cADNs exhibited markedly remodeled methylomes. In cADNs, hypomethylated regions were far more numerous (18,417 vs 4288 in SSA/Ps) and rarely affected CpG islands/shores. SSA/Ps seemed to have escaped this wave of demethylation. Cytosine hypermethylation in SSA/Ps was more pervasive (hypermethylated regions: 22,147 vs 15,965 in cADNs; hypermethylated genes: 4938 vs 3443 in cADNs) and more extensive (region for region), and it occurred mainly within CpG islands and shores. Given its resemblance to the CIMP typical of SSA/Ps' putative descendant colon cancers, we refer to the SSA/P methylation phenotype as proto-CIMP. Verification studies of six hypermethylated regions in an independent series of precancers demonstrated DNA methylation markers’ high potential for predicting the diagnosis of SSA/Ps and cADNs. Surprisingly, proto-CIMP in SSA/Ps was associated with upregulated gene expression; downregulation was more common in cADNs. In conclusion, the epigenetic landscape of SSA/Ps differs markedly from that of cADNs. These differences are a potentially rich source of novel tissue-based and noninvasive biomarkers.
Introduction
The serrated pathway of tumorigenesis appears to give rise to approximately one out of five sporadic colon cancers - more specifically, those with the CpG island methylator phenotype (CIMP) [Citation1–Citation6]. First described in 1999 by Toyota et al. [Citation7], the CIMP hallmark is a remarkably high level of age-independent cytosine methylation involving CpG dinucleotide clusters (i.e., CpG islands), which are generally unmethylated in normal somatic cells [Citation8]. Abnormal methylation of these residues is one of the epigenetic changes associated with gene silencing and it has been reported in virtually all types of human cancer [Citation9–Citation12]. In CIMP colon cancers, however, this aberrant methylation occurs much more frequently [Citation3] and is therefore more likely to involve CpG islands within the promoters of genes with functional relevance for tumorigenesis. The DNA mismatch repair (MMR) gene MLH1, for instance, is silenced in ~55% of CIMP colon cancers [Citation2], and its loss results in a hypermutated, microsatellite-unstable phenotype [Citation13–Citation16] that impacts both the prognosis of the disease and its sensitivity to chemotherapeutics [Citation2,Citation17,Citation18].
At the precancerous level, the World Health Organization (WHO) currently recognizes three classes of serrated colorectal lesions: hyperplastic polyps, traditional serrated adenomas (TSAs), and sessile serrated adenomas/polyps (SSA/Ps) [Citation19]. The latter two are both thought to have malignant potential, but SSA/Ps are considered the most likely precursors of CIMP colon malignancies. Like CIMP cancers, large SSA/Ps develop mainly in the proximal colon and frequently express the constitutively activated BRAFV600E serine/threonine kinase [Citation6,Citation15,Citation20,Citation21]. The hyperactive MAPK signaling caused by this mutant protein is thought to be responsible for many features of the serrated colorectal tumors, including the CIMP [Citation22–Citation25].
Early endoscopic removal of advanced precancerous lesions has proved to be the most effective way to reduce colon cancer-related mortality, and large proximal-colon SSA/Ps are now considered no less dangerous in this sense than cADNs, which are the most frequent colon cancer precursors [Citation26]. However, SSA/Ps are easier to miss during endoscopy, partly because of their location but also because of their morphology [Citation21,Citation27–Citation29]. They are nearly always flat or sessile lesions with poorly defined borders and colors resembling those of the normal mucosa, features that impede both their detection and complete endoscopic resection [Citation30]. Finally, pathologic diagnosis of serrated lesions is still subject to substantial inter-examiner variability, so endoscopically resected SSA/Ps are likely to be misclassified [Citation6,Citation21,Citation29,Citation31]. These factors converge to create an obvious gap in colorectal cancer prevention, reflected by the significant over-representation of the CIMP and proximal-colon locations among interval cancers (i.e., those diagnosed within 2 years of a negative colonoscopy) [Citation32].
Closure of this gap could be hastened by the identification of robust sets of molecular SSA/P biomarkers: stool-based diagnostic panels for use in noninvasive pre-colonoscopy screening programs, and tissue-based panels for more reliable diagnosis of these lesions in pathology laboratories. DNA methylation changes offer several advantages for use as pre-colonoscopy screening markers. Not only are they the most stable of known epigenetic marks [Citation33,Citation34], they also occur early in tumorigenesis [Citation9–Citation11,Citation35–Citation38]. Furthermore, differentially methylated regions of the genome far outnumber gene mutations in precancerous colon tumors, and they tend to be found across most lesions (unlike mutations, which are likely to be tumor subset-specific [Citation39–Citation41]).
These considerations prompted us to quantitatively characterize genome-wide DNA hypermethylation in a prospectively collected series of SSA/Ps, each with a paired sample of normal mucosa, and to see how the epigenetic phenotype of SSA/Ps compares with those of cADNs and of CIMP colon cancers themselves. Our primary aim was to identify strong DNA methylation-based biomarker candidates with the potential for improving the identification and differential diagnosis of precancerous colorectal lesions. Our secondary aim was to determine the extent to which changes in the precancers' methylome are reflected in their gene expression profile. To this end, we subjected the same tissue series to RNA-sequencing analysis, which also allowed us to identify numerous lesion-specific transcriptional dysregulations with potential for development as histopathologic biomarkers.
Results
A total of 64 fresh colon tissue samples – 17 histologically classified as SSA/Ps and 15 considered cADNs (), each with matched samples of normal mucosa – were subjected to both genome-wide bisulfite sequencing and RNA sequencing. The BRAFV600E mutation was found in 15 (88%) of the SSA/Ps and none of the cADNs. KRAS mutations were present in BRAF-wildtype SSA/Ps and in 6 (40%) of the 15 cADNs. As expected for early-stage serrated tumors, none of the SSA/Ps exhibited immunohistochemical evidence of MLH1 silencing.
Table 1. Characteristics of the prospectively collected precancerous lesions.
Proto-CIMP SSA/Ps
) shows the results of unsupervised, multidimensional scaling (MDS) analysis of the DNA methylomes of the fresh-tissue series, as determined by genome-wide bisulfite sequencing. For comparison purposes, we used the same method to re-analyze DNA samples from 6 proximal-colon cancers (and matched normal mucosa samples) collected in a previous study [Citation42] (Supplementary Table 1). The methylation data neatly segregated all neoplastic tissues from their paired normal controls (dimension 1) and SSA/P from cADN samples (dimension 2), and the CIMP(+) and CIMP(-) cancers (i.e., the former corresponding to the CIMP-high cancers described by Hinoue et al [Citation3]., the latter to those investigators’ non-CIMP cancers) clustered with the SSA/Ps and cADNs, respectively.
Figure 1. Differentially methylated cytosines (DMCs) in precancerous and cancerous colon lesions. a. MDS plot (Supplementary Experimental Procedures) of DNA methylation levels in SSA/Ps (n = 16); cADNs (n = 15); CIMP(+) cancers (n = 3); CIMP(-) cancers (n = 3); and matched samples of normal mucosa for each lesion. b. Volcano plots showing the magnitude (x axis) and statistical significance (y axis) of the differential methylation observed at DMCs identified in SSA/Ps and cADNs. X-axis: The magnitude of differential methylation was calculated as the M:T ratio (no. methylated reads/total no. reads) for the tumor sample minus M:T ratio for matched normal-tissue control. Black dots: DMCs with absolute methylation differences of <0.1 and P-values > 0.01. Yellow and blue dots: highly significant (P-value < 0.01) DMCs (hypermethylated and hypomethylated, respectively). c. Density plot showing variance at the hypermethylated (top) and hypomethylated (bottom) DMCs (yellow and blue dots of panel B, respectively). d. UpSet plots showing hypermethylated (left) and hypomethylated (right) DMC sets in SSA/Ps and cADNs and their overlaps. Exact numbers of lesion-specific (•) and shared (•-•) DMCs appear above the bars. e. Overlaid density plots showing the distributions of hypo- and hypermethylated DMCs in SSA/Ps and cADNs (left), and CIMP(+) and CIMP(-) cancers (right). X-axis as described in panel B.
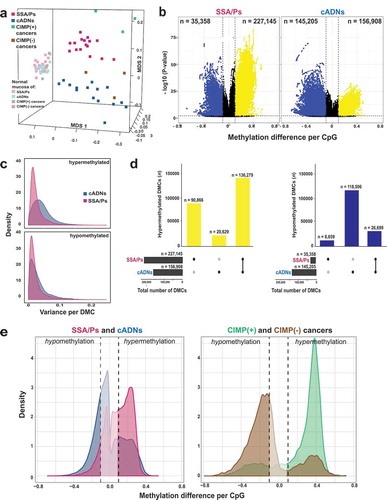
Cytosines displaying differential methylation in the precancerous lesions relative to their counterparts in matched normal tissues (DMCs) abounded in both SSA/Ps (n = 262,503) and cADNs (n = 302,113). Hypomethylated DMCs were much more frequent in cADNs, while hypermethylated DMCs were more common in SSA/Ps (). The lower P-values for the hypermethylated DMCs in SSA/Ps probably reflect the more uniform hypermethylation levels seen across these lesions (). Forty percent of the hypermethylated DMCs in SSA/Ps were unique to these precancers, while 87% of those in cADNs were also present in SSA/Ps (). Consistent with findings shown in , the CIMP(+) cancers also displayed more hypermethylation and less hypomethylation than their CIMP(-) counterparts, although both types of differential methylation were more striking in the cancer methylomes than in those of the precursors (), a pattern that reflects the increasing divergence of the lesions’ methylation profiles as they move progressively along the two different tumorigenic pathways.
As for differentially methylated regions (DMRs) (regions containing at least three consecutive DMCs with directionally identical methylation changes, separated from one another by ≤50 bp), those that were hypermethylated were, as expected, more numerous in SSA/Ps, while hypomethylated DMRs were much more common in cADNs (). Most hypermethylated DMRs were detected in both types of precancers, but a substantial number were SSA/P-specific (). By contrast, hypomethylated regions tended to be cADN-specific (). Hypomethylation was also more likely to be found outside CpG-rich areas and within introns and intergenic regions (). In both cancer precursor classes, hypermethylated DMRs were located prevalently in CpG islands/shores and gene promoters.
Figure 2. Differentially methylated regions (DMRs) in precursor lesions and proto-CIMP in SSA/Ps. a. Volcano plots showing the median differential methylation (x-axis) and its statistical significance (y-axis) for DMRs found in SSA/Ps and cADNs. (See legend for cutoffs and color codes) b. UpSet plots showing the lesion-specificity of hypermethylated and hypomethylated DMRs found in precancerous tumors. Exact numbers of lesion-specific (•) and shared (•-•) DMRs appear above the bars. c. Genomic location of DMRs in SSA/Ps vs cADNs. d. Scatterplots showing the extent of methylation at regions hypermethylated in both SSA/Ps and cADNs, and located within CpG islands (dots in the left panel) or 4-kb peri-TSS windows, i.e., TSS plus 2000-bp upstream and downstream flanking regions (dots in the right panel). In addition, CpG islands or peri-TSS windows with at least one hypermethylated CpG in either SSA/Ps or cADNs are included in the two graphics (i.e., dots along the y or x axis, respectively). e. Venn diagrams showing overlap between sets of genes in SSA/Ps and cADNs whose peri-TSS window contained at least one hypermethylated DMR.
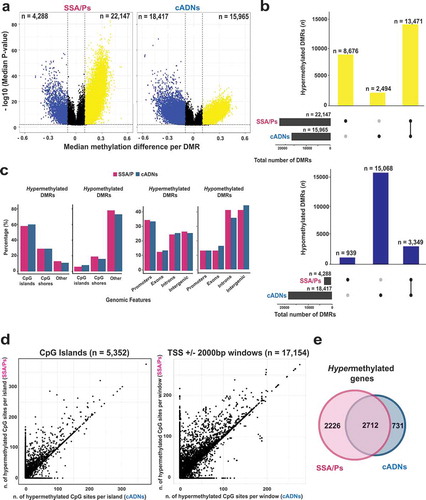
Next, to investigate the extension of this hypermethylation, we analyzed all of the CpG islands and the peri-transcription start site (peri-TSS) windows (consisting of the 2000-bp upstream and the 2000-bp downstream from the TSS) that contained at least one hypermethylated DMC in SSA/Ps, in cADNs, or in both. Interestingly, in both genomic areas, hypermethylated DMCs were more numerous in SSA/Ps than in cADNs () and the example in Supplementary Figure 1). Furthermore, some SSA/P-specific DMRs displaying relatively mild hypermethylation seemed to correspond to longer, more intensely methylated regions seen in CIMP(+) colon cancers (e.g., the large CpG island shared by the bidirectional promoters of the MLH1 and EPM2AIP1 genes). As shown in Supplementary Figure 2A, aberrant methylation of this island involves both the EPM2AIP1 and MLH1 promoters in CIMP(+) cancers, where the MLH1 expression loss triggers MMR deficiency. In SSA/Ps, the hypermethylation is instead confined to the EPM2AIP1 promoter and associated with a decrease in the expression of this gene (Supplementary Figure 2B and C). While methylation at this locus has been investigated in cell lines [Citation43], tissue-based data are lacking on the specific region where the serrated tumor-associated hypermethylation appears to begin.
As shown in ), genes whose peri-TSS window included at least one hypermethylated DMR were appreciably more common in SSA/Ps than cADNs. (Affiliation of DMRs to genes is described in Supplementary Experimental Procedures; the genes themselves are listed in Supplementary Table 2.)
Collectively, the data presented above indicate that distinctive methylome features of CIMP(+) colon cancers are readily detectable in their putative precursors, SSA/Ps (albeit in less marked forms). Therefore, this early-stage hypermethylator phenotype will be referred to hereafter as proto-CIMP.
Targeted verification of DMR-based biomarker candidates for identifying colon-cancer precursors
To explore their potential as DNA-based diagnostic markers, we performed targeted verification studies on 6 of the hypermethylated DMRs listed in Supplementary Table 2 (3 that were SSA/P-specific and 3 others shared by SSA/Ps and cADNs). The selection was subjective and based on visual inspection of the methylation patterns across all samples in the Integrative Genomics Viewer (IGV). Factors considered included pattern variation across tumor samples and baseline methylation levels in paired normal mucosa samples. The hypermethylation patterns in our freshly-collected tissue samples of the 6 biomarker candidates and those of other DMRs currently utilized as colon-cancer markers in clinical research [Citation3,Citation15] are shown in Supplementary Figure 3.
Figure 3. Bisulfite pyrosequencing verification of 6 hypermethylated DMRs. Methylation levels at each CpG site of (a) 3 SSA/P-specific DMRs and (b) 3 DMRs shared between SSA/Ps and cADNs. Verification assay results in 61 FFPE colon tissue samples (left) are compared with those of genome-wide bisulfite sequencing of the fresh tissue series (right). DMR-containing loci (red box) and CpG islands (blue horizontal bars) are schematically represented below graph pairs. c. Hierarchical clustering heatmap of the 61 FFPE tissue samples based on the mean methylation level across all CpGs in each DMR. The cADN cluster contains two subgroups, probably reflecting their different frequencies of KRAS mutations. The SSA/P cluster also contains a subgroup of lesions with higher levels of methylation at all 6 markers, presumably reflecting these patients’ significantly older age when the lesions were discovered (mean: 66.3 years versus 54.5 years in the subgroup with lower methylation levels; P = 0.01). Significant differences between subgroups regarding other clinical variables (Supplementary Table 3) were not observed.
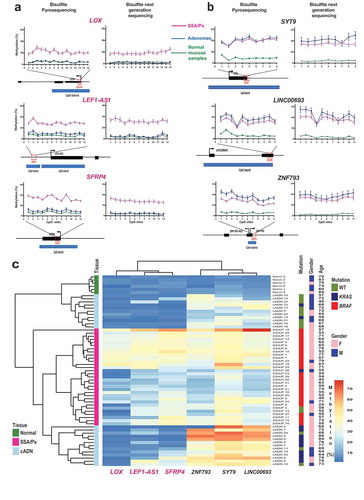
Bisulfite pyrosequencing assays were developed to verify our biomarker candidates in the independent series of FFPE samples (Supplementary Table 3). The results () fully confirmed genome-wide bisulfite DNA sequencing data on single-CpG methylation levels within each DMR candidate. The 6-marker panel distinguished precancerous lesions from normal mucosa and SSA/Ps from cADNs ()) with 96.7% accuracy (Supplementary Figure 4A). Preliminary data on FFPE samples of TSAs (four KRAS-mutant, one KRAS/BRAF wild-type) and colon cancers analyzed with this panel (Supplementary Figure 4B) suggest that the KRAS-mutant TSA methylome more closely resembles that of cADNs than that of SSA/Ps and confirm findings shown in ), whereby colon cancer clustering with SSA/Ps or cADNs appears to be CIMP status-dependent.
Figure 4. Analysis of the SSA/P and cADN transcriptomes in light of the lesions’ methylome profiles. (a) MDS plot and (b) hierarchical clustering heatmap of the 17 SSA/Ps and 15 cADNs and their normal mucosal samples. Asterisks indicate the two samples with intermediate profiles (for details, see ). Hierarchical clustering in B was based on expression levels of the 10,000 genes with most highly variable expression. c. Venn diagrams showing the precursor-lesion specificity of the most dysregulated genes (P-value < 10−10 and log2 fold change > 1). d. Scatter plots showing the variable relation between the magnitude of differential DNA methylation (x axis) and the expression (y axis) for SSA/Ps (vs matched normal mucosa samples). Genes with at least one DMR (P-value < 0.05) in their peri-TSS windows and dysregulated expression (P-value < 0.05) are shown. Red dots: subsets of genes with a median methylation difference of ≥ 0.1 and log2 fold change in expression of >1. ZIC2, ZIC5, and HUNK are highlighted to illustrate the heterogeneous relation between DNA methylation and gene expression. e. Methylation levels (top) and gene expression (bottom) data for the ZIC2, ZIC5, and HUNK loci in SSA/Ps (pink), cADNs (blue), and corresponding samples of normal mucosa (light-pink and light blue, respectively). Areas outlined in black are those displaying differential methylation (see details in Supplementary Figures 5 and 6).
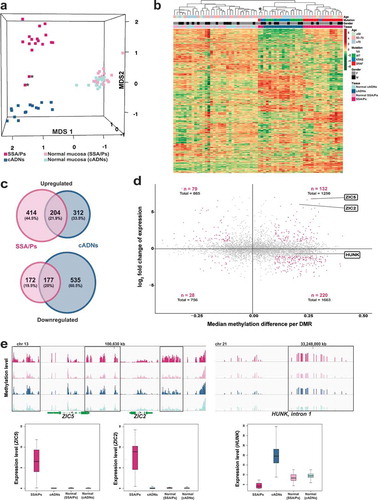
Figure 5. In situ hybridization analysis of ZIC2, HUNK, and ANXA10 mRNAs in SSA/Ps and cADNs. ZIC2 expression (red punctate labeling) is (a) present in SSA/Ps and (b) absent in cADNs. HUNK (brown punctate labeling) is (c) almost absent in SSA/Ps (very low-level expression was present at the bottom of serrated crypts, see inset) and (d) expressed in cADNs. Control staining for ANXA10, a known SSA/P-specific marker[Citation25,Citation73–Citation75] was (e) strongly positive in SSA/Ps (dense red punctate labeling) and (f) absent in cADNs.
![Figure 5. In situ hybridization analysis of ZIC2, HUNK, and ANXA10 mRNAs in SSA/Ps and cADNs. ZIC2 expression (red punctate labeling) is (a) present in SSA/Ps and (b) absent in cADNs. HUNK (brown punctate labeling) is (c) almost absent in SSA/Ps (very low-level expression was present at the bottom of serrated crypts, see inset) and (d) expressed in cADNs. Control staining for ANXA10, a known SSA/P-specific marker[Citation25,Citation73–Citation75] was (e) strongly positive in SSA/Ps (dense red punctate labeling) and (f) absent in cADNs.](/cms/asset/982914f5-9e61-46db-97ee-f50b67238102/kepi_a_1543504_f0005_c.jpg)
The SSA/P and cADN transcriptomes
To explore how the methylome profiles reported above are reflected in the transcriptomes of precancerous colon lesions, we performed RNA sequencing-based gene expression analyses on the 64 fresh-tissue samples used for methylation profiling. The results readily segregated most precancers into SSA/Ps and cADNs (). MetaCore enrichment analysis of the most strikingly dysregulated genes in the precancers ( and Supplementary Table 4) identified pathways involved in ‘Cell adhesion_extracellular remodelling’ and ‘Development_WNT signaling’ as the ones most markedly altered in SSA/Ps and cADNs, respectively.
As shown in ), the major gene expression alterations in cADNs were usually downregulations, whereas increased expression was more common in SSA/Ps. The predominance of upregulated transcription in lesions displaying proto-CIMP illustrates the emerging complexities of DNA methylation’s relation to transcription. Although hypermethylation of promoter CpG islands is frequently cited as a silencing epigenetic mark [Citation44], the relation between peri-TSS methylation and gene expression levels in our samples varied widely. For example, as shown in ), substantial hypermethylation was associated with significantly upregulated expression of ZIC2 and ZIC5 but mildly reduced expression of HUNK. Inverse (hypermethylation with downregulation, hypomethylation with upregulation) and positive (hypermethylation with upregulation, hypomethylation with downregulation) relations were encountered with similar frequencies. Furthermore, significantly dysregulated expression was also observed for many genes which – unlike those represented in ) – had no evidence of aberrant promoter methylation. ) (and Supplementary Figures 5 and 6) provide more details on the relations between gene expression and DNA methylation at the ZIC2, ZIC5, and HUNK loci. In situ hybridization-based tissue staining patterns for ZIC2 and HUNK mRNAs in precancerous lesions are shown in .
Discussion
Previous studies have analyzed DNA methylation alterations in colon cancers with an eye to their exploitation as diagnostic markers. In 2006, Weisenberger et al. analyzed methylation at 195 genetic loci and identified a panel of 5 DMRs that discriminated between CIMP and non-CIMP colon cancers [Citation15]. This panel was refined by the same group based on the analysis of ~27,000 CpG sites [Citation3]. Although several groups have also used these panels (and other previously-identified sets of cancer-associated methylation markers [Citation7]) to classify precancerous colon lesions [Citation14,Citation20,Citation45–Citation53], their diagnostic potential in this setting is uncertain. While some regions might be aberrantly methylated from the outset of colon tumorigenesis, other DMRs could conceivably be present in cancers but absent or poorly developed in early-stage colon tumors (e.g., that affecting the MLH1 promoter).
Dehghanizadeh et al. recently attempted to explore this uncharted territory using a microarray-based assay to assess methylation at ~450,000 CpG sites [Citation41]. However, the series of precancerous lesions they studied included only 5 SSA/Ps (archival samples: fresh or FFPE) and 3 cADNs (all from patients with familial polyposis), and, with the exception of one of the SSA/Ps, none of the precancerous lesions were accompanied by a paired sample of normal mucosa. Our methylation analysis included a total of 64 prospectively collected, fresh-tissue samples representing the two major classes of sporadic precancerous colon lesions, SSA/Ps and cADNs, and patient-matched samples of non-neoplastic tissues. The results show that DMR profiles can distinguish colon cancer precursors from normal colon tissues, and they can also differentiate between the SSA/Ps and cADNs. Hypermethylation within gene regulatory regions – a common feature of tumorigenesis in general – was encountered frequently in both types of precancers. However, in SSA/Ps it is appreciably more pervasive, and it shares many features (albeit in milder forms) with the hypermethylation typical of the CIMP(+) colon cancers believed to develop from SSA/Ps – hence our referral to the SSA/P phenotype as proto-CIMP (a generally descriptive term that highlights the progressive nature of the biological process underlying the phenotype, not intended for clinical use in the classification of precancerous colorectal lesions). Global hypomethylation of the genome is also a common feature of tumorigenesis, and it was clearly evident in both cADNs and CIMP(-) colon cancers. It has also been reported in a single SSA/P investigated with whole-genome bisulfite sequencing [Citation41]. However, our data indicate that SSA/Ps and CIMP(+) cancers are generally spared from the wave of demethylation that occurs during conventional colorectal tumorigenesis (at least within the 80.5 Mb area of the genome we investigated). This epigenetic phenotype might thus be a novel feature of CIMP tumorigenesis. As such, it clearly deserves further investigation with a whole-genome study of methylation in several precursor lesions of different types.
The six markers verified in this study (LOX, LEF1-AS1, SFRP4, ZNF793, SYT9, and LINC00693) displayed high accuracy (97%) in distinguishing the colon precancers from normal mucosa and also in differentiating between the two main classes of precancerous tumors. However, the long list of DMRs we identified (Supplementary Table 2) should be scrupulously mined to find additional markers, which can be used to develop a precolonoscopic stool-DNA test that excels in both sensitivity (i.e., detection of precancerous as well as cancerous lesions) and specificity (i.e., differentiation of SSA/Ps/CIMP(+) cancers and cADNs/CIMP(-) cancers). Indeed, the vast majority of DMRs we identified in the precancers, including the 6 markers, appear to undergo little or no negative selection during transformation and therefore were also present in colon cancers. Recently, a stool-DNA test, whose targets include aberrant BMP3 and NDRG4 methylation, has produced promising results in the pre-colonoscopy detection of cancers and advanced precancerous lesions of the colon (including advanced SSA/Ps) [Citation54]. As shown in Supplementary Figure 3Q and R, these markers, which were also in our list, performed well in the identification of our CIMP(+) and proto-CIMP tumors.
The results of our RNA sequencing studies confirm the increasing body of evidence highlighting the complex relation between DNA methylation and gene expression [Citation44]. Emphasis in the literature has frequently been placed on the association between gene silencing and hypermethylation of promoter CpG islands, since the latter is an established mechanism underlying cancer-related inactivation of tumor suppressor genes (e.g., MLH1 in colon tumorigenesis) [Citation43,Citation55,Citation56]. Analysis of our data failed to reveal any genes with established tumor-suppressor functions among those with downregulated expression and peri-TSS hypermethylation in precancerous lesions. HUNK, for example, encodes a protein kinase that appears to negatively regulate normal intestinal cell proliferation [Citation57], but it also seems to promote mammary tumorigenesis [Citation58]. As for its methylation pattern, a substantial portion of HUNK’s peri-TSS window was hypermethylated in the CIMP(+) cancers. In contrast, the methylation observed in SSA/Ps was reduced in level and confined to a shorter stretch of CpG sites. (The latter feature recalls the aberrant methylation involving the CpG island shared by the EPM2AIP1 and MLH1 promoters, which affected the MMR gene promoter only in the more advanced stages of tumorigenesis.) The methylation present in the SSA/Ps was nonetheless associated with mildly reduced HUNK expression () and Supplementary Figure 5A). Interestingly, HUNK methylation (even milder than that seen in SSA/Ps) was also identified in some cADNs, where it was associated with upregulated expression of the gene (Supplementary Figure 5B).
Consistent with previous reports [Citation3,Citation59], the CpG island hypermethylation events we detected mainly affected the promoter regions of genes displaying little or no expression in precancerous and normal mucosa. Some of these genes are known to be marked during embryonic development by polycomb repressive complex 2 (PRC2), which mediates H3K27 trimethylation, a hallmark of gene silencing. During tumorigenesis, these loci display increases in DNA methylation together with decreases in H3K27me3. The mechanisms responsible for these changes are incompletely understood [Citation60–Citation64], but they are believed by some to tighten repression of the target gene’s expression, rendering it more difficult to induce [Citation65].
Notably, however, the markedly dysregulated gene expression in our SSA/Ps tended to involve upregulation rather than downregulation ()), despite the lesions’ proto-CIMP. Indeed, several upregulated genes exhibited hypermethylation in their proximal regulatory regions ()). For example, the ZIC2/ZIC5 locus ( and details in Supplementary Figure 6) was methylated strongly and extensively in SSA/Ps – and less so in cADNs – and yet, the expression of these two genes was re-activated only in the SSA/Ps (after PRC2 repression during embryonic development). Additional work is needed to unravel the ties between DNA methylation and gene expression at this locus (and others) in SSA/Ps and cADNs. The fairly small differences in the two lesions’ hypermethylation patterns might well be associated with more marked differences at the chromatin level.
Gene expression is also modulated by cis epigenetic signals other than DNA methylation, including myriad histone modifications, and by long-range regulatory signals, such as those classically involving enhancers via CTCF-mediated chromatin loop formation [Citation66]. And, naturally, differential transcription-factor expression in the two types of lesions (e.g., the SSA/P-specific re-expression of ZIC2 and ZIC5, whose roles in tumorigenesis are completely unknown) will be reflected in these proteins’ differential binding patterns in gene regulatory regions. The temporal coordination of these factors is highly complex and involves substantial backward regulation. For example, the binding affinity of many transcription factors – and CTCF – varies with the methylation status of their binding sites and, contrary to common belief, many factors preferentially bind methylated DNA [Citation67–Citation70]. Altered DNA methylation patterns in SSA/Ps and cADNs thus create different platforms for recruiting DNA – and chromatin-binding proteins, leading to changes in gene expression patterns, such as alternative promoter usage [Citation71,Citation72]
Regardless of their functional relations with our DNA methylation data, the transcriptome differences we documented between SSA/Ps and cADNs can also be fruitfully exploited to develop tissue staining assays to differentiate these lesions with confidence. The extensive list of genes in Supplementary Table 4 represents a rich source of promising candidate markers that can be used for this purpose. For tissue staining, the recently developed in situ hybridization method we employed is straightforward and produces highly sensitive and specific results. It is a valuable alternative when specific antibodies are unavailable or do not perform well in immunohistochemistry, and excellent for tissue staining of non-coding RNAs.
Our list of potential expression-based SSA/P markers shows overlap with those identified by other groups (e.g., ANXA10, which is reportedly a highly specific marker of serrated-pathway colon tumors [Citation25,Citation73–Citation75]). Indeed, our transcriptomic data appreciably extend previously published microarray findings [Citation76–Citation78] and are similar to RNA sequencing-based results from another group [Citation74,Citation79] (Supplementary Figure 7A). However, separate signatures are also needed for other types of serrated lesions and lesions typically found outside the proximal colon (hyperplastic polyps in particular, which are encountered very frequently). These areas are already being explored in several studies [Citation73,Citation79,Citation80], including the previously mentioned study based on RNA sequencing, which showed that SSA/Ps can be differentiated from hyperplastic polyps based on transcriptome profiles (Supplementary Figure 7B) [Citation79].
In conclusion, our study represents the most comprehensive genome-wide comparison of DNA methylation and gene expression in SSA/Ps and cADNs. The 6 verified markers in this study could be supplemented with other promising candidates from our DMR dataset and validated in future studies on a larger series of precancerous lesions. As with the gene expression, the sample set should be extended to involve all types of colonic tumors, including those from the distal colon. The findings from such studies will have clinical implications for the pre-colonoscopy stool-DNA-based detection – and identification – of early-stage colon tumors and for their more accurate molecular histological diagnosis.
Patients and methods
Analyses of prospectively collected tissues
Tissues
The fresh tissues used to study DNA methylation and gene expression were prospectively collected during colonoscopies performed between 2014 and 2017 at Cremona Hospital (Italy) or Zurich Triemli Hospital (Switzerland). The study was approved by both hospitals’ research ethics committees. Donors provided written consent to tissue collection, testing, and data publication. Samples were numerically coded to protect donors’ rights to confidentiality and privacy. Precancerous lesions were collected from the cecum or ascending colon during colonoscopies that were negative for cancers (). Each lesion was accompanied by a control sample of normal mucosa located >2 cm from the tumor (essential if baseline differences between tissue donors are to be accounted for). Lesions analyzed had: 1) maximum diameters of ≥10 mm (to ensure that sufficient tissue was left for the histological examination) and 2) Paris class Is or IIa morphologic features (i.e., sessile polyps and nonpolypoid lesions that were slightly elevated above the surrounding mucosa) [Citation81] to increase the likelihood of including SSA/Ps. Tissue samples were placed in tubes filled with AllProtect Tissue Reagent (Qiagen, Hilden, Germany), held at 4°C overnight, and stored at −80°C prior to simultaneous DNA/RNA extraction with Qiagen’s AllPrep Mini Kit. All study tissues were histologically classified according to WHO criteria [Citation19] by an expert gastrointestinal pathologist at the hospital furnishing the lesion.
BRAF and KRAS mutation analysis
All samples were subjected to standard Sanger sequencing (Supplementary Experimental Procedures) to identify mutations in BRAF exon 15 (site of the mutational hotspot that gives rise to the V600E variant) and KRAS exon 2 (codons 12 and 13, which are frequently mutated).
Genome-wide bisulfite DNA sequencing and RNA sequencing
For methylation analysis, sequencing libraries were prepared using 1 microgram of DNA per sample, according to the Roche SeqCapEpi CpGiant protocol (Roche, Rotkreutz, Switzerland) (Supplementary Experimental Procedures), and bisulfite-converted prior to capture with a pre-designed probe pool (Roche-NimbleGen, Madison, WI). This target-enrichment procedure allowed us to interrogate 80.5Mb of the genome containing ~2.7 x 10⁶ CpG sites, with thorough coverage of intra- and intergenic CpG islands and those in gene promoters, and more limited coverage of CpG shores and CpG nucleotides in enhancers and gene bodies. Captured libraries were sequenced on an Illumina 2500 system (Illumina, San Diego, CA) (125-bp paired-end reads).
RNA sequencing was restricted to samples with total RNA integrity numbers exceeding 6.5. Poly-A RNA was isolated from 100 ng of total RNA. PCR-amplified cDNA sequencing libraries were prepared according to the Illumina TruSeq Stranded mRNA Library preparation protocol and sequenced on an Illumina HiSeq 4000 system (150-bp paired-end reads).
Analysis of methylome and transcriptome data
Bisulfite- and RNA-sequencing reads were aligned to the GRCh37/hg19 human reference genome using Bismark/Bowtie 2 [Citation82] and Salmon [Citation83], respectively. Quality-control analysis excluded one SSA/P (S14 in ) from the methylome analysis because the probe pool’s target capture specificity in its matched normal mucosa sample was low. Differentially methylated cytosines (DMCs) (i.e., those displaying hyper- or hypo- methylation in tumor tissues vs. matched normal controls) were identified using the BiSeq R-package [Citation84]. Differentially methylated regions (DMRs) were defined as clusters of adjacent DMCs that were consistently hyper- or hypomethylated. (Data pre-processing, quality control, and BiSeq analysis are described in Supplementary Experimental Procedures.) Genes displaying significant differential expression in precancerous lesions (vs matched samples of normal mucosa) were identified using the edgeR R-package [Citation85] (details in Supplementary Experimental Procedures).
Raw methylome and transcriptome data are deposited in ArrayExpress (accession numbers: E-MTAB-6952; E-MTAB-6951; E-MTAB-6949).
FFPE tissue studies
Tissues
Fresh-tissue findings on DNA methylation were verified in formalin-fixed, paraffin-embedded (FFPE) colon tissues (precancerous and normal mucosa) collected proximal to the splenic flexure. The tissues were obtained from the Zurich University Hospital Pathology Archives with local ethics committee approval and written donor consent (Supplementary Table 3). DNA was extracted from samples using the truXTRAC kit (Covaris, Woburn, MA) (Supplementary Experimental Procedures). FFPE samples were histologically classified and genotyped for BRAF and KRAS, as described above for the prospectively collected tissue series.
Bisulfite pyrosequencing
DNA methylation patterns at 6 selected DMRs were verified in the independent FFPE sample series with bisulfite pyrosequencing. DNA (500 ng per sample) was treated with sodium bisulfite using the Zymo Research DNA Methylation Lightning kit (Zymo Research, Irvine, CA). The bisulfite-converted DNA (20 ng) was amplified using biotinylated primers, and PCR products were pyrosequenced on a PyroMark Q24 Autoprep system (Qiagen) (Supplementary Experimental Procedures; Supplementary Table 5). The accuracy of the 6-marker panel in distinguishing the two types of precancerous lesions was calculated with a support vector machine model (Supplementary Experimental Procedures).
In-situ hybridization and immunohistochemistry
In situ-hybridization studies of representative lesions were performed with the RNAscope 2.0 assay (Advanced Cell Diagnostics, Hayward, CA), which uses multiple probes for each RNA and branched DNA molecules to amplify signals (Supplementary Experimental Procedures). MLH1 immunohistochemistry was performed on all lesions, as previously described [Citation56].
List of abbreviations
| cADNs | = | Conventional adenomas |
| CIMP | = | CpG island methylator phenotype |
| DMCs | = | Differentially methylated cytosines |
| DMRs | = | Differentially methylated regions |
| FFPE | = | Formalin-fixed, paraffin-embedded |
| IGV | = | Integrative genomics viewer |
| MDS | = | Multidimensional scaling |
| MMR | = | DNA-mismatch repair |
| PRC2 | = | Polycomb repressive complex 2 |
| SSA/Ps | = | Sessile serrated adenomas/polyps |
| TSAs | = | Traditional serrated adenomas |
| TSS | = | Transcription start site |
| WHO | = | World Health Organization |
Declarations
Ethics approval and consent to participate
Ethics approval was received from the ethics committees at both Triemli Hospital, Zurich, Switzerland (KEK-ZH-Nr: 2015-0068 and BASEC-Nr.: 2015-00185) and Cremona Hospital, Italy (Comitato Etico d’Area Cremona Mantova Lodi, protocollo 13728/16).
Consent for publication
Not applicable.
Availability of data and material
The datasets generated and analyzed during the current study are available in the ArrayExpress repository (accession numbers: E-MTAB-6952; E-MTAB-6951; E-MTAB-6949).
Competing interests
The authors declare that they have no competing interests.
Supplemental Material
Download Zip (31.6 MB)Acknowledgments
We thank Martin Roszkowski, Vera van der Weijden, Hadi Gharibi, Anette Hunziker, Catharine Aquino, and Brigitta Tomlinson for their technical support, help, and productive discussions, and Marian Everett Kent for editing the manuscript.
Disclosure statement
No potential conflict of interest was reported by the authors.
Supplementary Material
supplemental data for this article can be accesssed here.
Additional information
Funding
Related Research Data
References
- Jass JR Serrated adenoma of the colorectum and the DNA-methylator phenotype. Nat Clin Pract Oncol. 2005 Aug;2(8):398–405. PubMed PMID: 16130936.
- Phipps AI, Limburg PJ, Baron JA, et al. Association between molecular subtypes of colorectal cancer and patient survival. Gastroenterology. 2015 Jan;148(1):77–87 e2. . PubMed PMID: 25280443; PubMed Central PMCID: PMCPMC4274235.
- Hinoue T, Weisenberger DJ, Lange CP, et al. Genome-scale analysis of aberrant DNA methylation in colorectal cancer. Genome Res. 2012 Feb;22(2):271–282. . PubMed PMID: 21659424; PubMed Central PMCID: PMCPMC3266034.
- Okugawa Y, Grady WM, Goel A Epigenetic alterations in colorectal cancer: emerging biomarkers. Gastroenterology. 2015 Oct;149(5):1204–1225 e12. . PubMed PMID: 26216839; PubMed Central PMCID: PMCPMC4589488.
- Ijspeert JEG, Vermeulen L, Meijer GA, et al. Serrated neoplasia-role in colorectal carcinogenesis and clinical implications. Nat Rev Gastroenterol Hepatol. 2015 Jul;12(7):401–409. . PubMed PMID: 25963511.
- Bettington M, Walker N, Clouston A, et al. The serrated pathway to colorectal carcinoma: current concepts and challenges. Histopathology. 2013 Feb;62(3):367–386. . PubMed PMID: 23339363.
- Toyota M, Ahuja N, Ohe-Toyota M, et al. CpG island methylator phenotype in colorectal cancer. Proc Natl Acad Sci U S A. 1999 Jul 20;96(15):8681–8686. PubMed PMID: 10411935; eng.
- Deaton AM, Bird A CpG islands and the regulation of transcription. Genes Dev. 2011 May 15;25(10):1010–1022. PubMed PMID: 21576262; PubMed Central PMCID: PMCPMC3093116.
- Feinberg AP, Ohlsson R, Henikoff S The epigenetic progenitor origin of human cancer. Nat Rev Genet. 2006 Jan;7(1):21–33. PubMed PMID: 16369569.
- Jones PA, Baylin SB The epigenomics of cancer. Cell. 2007 Feb 23;128(4):683–692. PubMed PMID: 17320506; PubMed Central PMCID: PMCPMC3894624.
- Issa JP Aging and epigenetic drift: a vicious cycle. J Clin Invest. 2014 Jan;124(1):24–29. PubMed PMID: 24382386; PubMed Central PMCID: PMCPMC3871228.
- Rodriguez-Paredes M, Esteller M. Cancer epigenetics reaches mainstream oncology. Nat Med. 2011 Mar;17(3):330–339. PubMed PMID: 21386836.
- Boland CR, Goel A Microsatellite instability in colorectal cancer. Gastroenterology. 2010 Jun;138(6):2073–2087 e3. PubMed PMID: 20420947; PubMed Central PMCID: PMCPMC3037515.
- O’Brien MJ, Yang S, Mack C, et al. Comparison of microsatellite instability, CpG island methylation phenotype, BRAF and KRAS status in serrated polyps and traditional adenomas indicates separate pathways to distinct colorectal carcinoma end points. Am J Surg Pathol. 2006 Dec;30(12):1491–1501. PubMed PMID: 17122504.
- Weisenberger DJ, Siegmund KD, Campan M, et al. CpG island methylator phenotype underlies sporadic microsatellite instability and is tightly associated with BRAF mutation in colorectal cancer. Nat Genet. 2006 Jul;38(7):787–793. PubMed PMID: 16804544; eng.
- Bettington M, Walker N, Rosty C, et al. Clinicopathological and molecular features of sessile serrated adenomas with dysplasia or carcinoma. Gut. 2017 Jan;66(1):97–106. PubMed PMID: 26475632.
- Carethers JM, Smith EJ, Behling CA, et al. Use of 5-fluorouracil and survival in patients with microsatellite-unstable colorectal cancer. Gastroenterology. 2004 Feb;126(2):394–401. PubMed PMID: 14762775.
- Le DT, Uram JN, Wang H, et al. PD-1 blockade in tumors with mismatch-repair deficiency. New Engl J Med. 2015 Jun 25;372(26):2509–2520. PubMed PMID: WOS:000356788200007; English.
- Bosman FT, Carneiro F, Hruban RH, et al. WHO classification of tumors of the digestive system. Lyon: International Agency for Research on Cancer Publisher; 2010.
- Kambara T, Simms LA, Whitehall VL, et al. BRAF mutation is associated with DNA methylation in serrated polyps and cancers of the colorectum. Gut. 2004 Aug;53(8):1137–1144. PubMed PMID: 15247181.
- Rex DK, Ahnen DJ, Baron JA, et al. Serrated lesions of the colorectum: review and recommendations from an expert panel. Am J Gastroenterol. 2012 Sep;107(9):1315–29; quiz 1314, 1330. PubMed PMID: 22710576; PubMed Central PMCID: PMCPMC3629844.
- Fang M, Ou J, Hutchinson L, et al. The BRAF oncoprotein functions through the transcriptional repressor MAFG to mediate the CpG Island methylator phenotype. Mol Cell. 2014 Sep 18;55(6):904–915. PubMed PMID: 25219500; PubMed Central PMCID: PMCPMC4170521.
- Carragher LA, Snell KR, Giblett SM, et al. V600EBraf induces gastrointestinal crypt senescence and promotes tumour progression through enhanced CpG methylation of p16INK4a. EMBO Mol Med. 2010 Nov;2(11):458–471. PubMed PMID: 20941790; PubMed Central PMCID: PMCPMC3394506.
- Rad R, Cadinanos J, Rad L, et al. A genetic progression model of Braf(V600E)-induced intestinal tumorigenesis reveals targets for therapeutic intervention. Cancer Cell. 2013 Jul 8;24(1):15–29. PubMed PMID: 23845441; PubMed Central PMCID: PMCPMC3706745.
- Sakamoto N, Feng Y, Stolfi C, et al. BRAF(V600E) cooperates with CDX2 inactivation to promote serrated colorectal tumorigenesis. Elife. 2017 Jan 10;6. doi: 10.7554/eLife.20331. PubMed PMID: 28072391; PubMed Central PMCID: PMCPMC5268782.
- Lieberman DA, Rex DK, Winawer SJ, et al. Guidelines for colonoscopy surveillance after screening and polypectomy: a consensus update by the US multi-society task force on colorectal cancer. Gastroenterology. 2012 Sep;143(3):844–857. PubMed PMID: 22763141.
- Singh H, Nugent Z, Demers AA, et al. The reduction in colorectal cancer mortality after colonoscopy varies by site of the cancer. Gastroenterology. 2010 Oct;139(4):1128–1137. PubMed PMID: 20600026.
- East JE, Vieth M, Rex DK Serrated lesions in colorectal cancer screening: detection, resection, pathology and surveillance. Gut. 2015 Jun;64(6):991–1000. PubMed PMID: 25748647.
- Gourevitch RA, Rose S, Crockett SD, et al. Variation in pathologist classification of colorectal adenomas and serrated polyps. Am J Gastroenterol. 2018 Jan 30. PubMed PMID: 29380819. 113 431–439
- Pohl H, Srivastava A, Bensen SP, et al. Incomplete polyp resection during colonoscopy-results of the complete adenoma resection (CARE) study. Gastroenterology. 2013 Jan;144(1):74–80 e1. PubMed PMID: 23022496.
- Bettington M, Walker N, Rosty C, et al. Critical appraisal of the diagnosis of the sessile serrated adenoma. Am J Surg Pathol. 2014 Feb;38(2):158–166. PubMed PMID: 24418851.
- Sawhney MS, Farrar WD, Gudiseva S, et al. Microsatellite instability in interval colon cancers. Gastroenterology. 2006 Dec;131(6):1700–1705. PubMed PMID: 17087932.
- Bird AP Use of restriction enzymes to study eukaryotic dna methylation .2. Symmetry of methylated sites supports semi-conservative copying of methylation pattern. J Mol Biol. 1978;118(1):49–60. PubMed PMID: WOS:A1978EM86300003; English.
- Wu H, Zhang Y Reversing DNA methylation: mechanisms, genomics, and biological functions. Cell. 2014 Jan 16; 156 (1–2): 45–68. PubMed PMID: 24439369; PubMed Central PMCID: PMCPMC3938284.
- Menigatti M, Cattaneo E, Sabates-Bellver J, et al. The protein tyrosine phosphatase receptor type R gene is an early and frequent target of silencing in human colorectal tumorigenesis. Mol Cancer. 2009;8:124. doi: 1476-4598-8-124 [pii]
- Menigatti M, Truninger K, Gebbers JO, et al. Normal colorectal mucosa exhibits sex- and segment-specific susceptibility to DNA methylation at the hMLH1 and MGMT promoters. Oncogene. 2009 Feb 12;28(6):899–909. PubMed PMID: 19060925; eng.
- Menigatti M, Staiano T, Manser CN, et al. Epigenetic silencing of monoallelically methylated miRNA loci in precancerous colorectal lesions. Oncogenesis. 2013 Jul 15;2:e56. PubMed PMID: 23857251; PubMed Central PMCID: PMCPMC3740287.
- Suzuki H, Watkins DN, Jair KW, et al. Epigenetic inactivation of SFRP genes allows constitutive WNT signaling in colorectal cancer. Nat Genet. 2004 Apr;36(4):417–422. PubMed PMID: 15034581.
- Nikolaev SI, Sotiriou SK, Pateras IS, et al. A single-nucleotide substitution mutator phenotype revealed by exome sequencing of human colon adenomas. Cancer Res. 2012 Dec 1;72(23):6279–6289. PubMed PMID: 23204322.
- Lin SH, Raju GS, Huff C, et al. The somatic mutation landscape of premalignant colorectal adenoma. Gut. 2017 Jun 12. doi: 10.1136/gutjnl-2016-313573. PubMed PMID: 28607096.
- Dehghanizadeh S, Khoddami V, Mosbruger TL, et al. Active BRAF-V600E is the key player in generation of a sessile serrated polyp-specific DNA methylation profile. PLoS One. 2018;13(3):e0192499. PubMed PMID: 29590112; PubMed Central PMCID: PMCPMC5873940.
- Di Pietro M, Bellver JS, Menigatti M, et al. Defective DNA mismatch repair determines a characteristic transcriptional profile in proximal colon cancers. Gastroenterology. 2005 Sep;129(3):1047–1059. PubMed PMID: 16143142.
- Lin JC, Jeong S, Liang G, et al. Role of nucleosomal occupancy in the epigenetic silencing of the MLH1 CpG island. Cancer Cell. 2007 Nov;12(5):432–444. PubMed PMID: 17996647; PubMed Central PMCID: PMCPMC4657456.
- Jones PA Functions of DNA methylation: islands, start sites, gene bodies and beyond. Nat Rev Genet. 2012 May 29;13(7):484–492. PubMed PMID: 22641018.
- Kim YH, Kakar S, Cun L, et al. Distinct CpG island methylation profiles and BRAF mutation status in serrated and adenomatous colorectal polyps. Int J Cancer. 2008 Dec 01;123(11):2587–2593. PubMed PMID: 18798261.
- Vaughn CP, Wilson AR, Samowitz WS Quantitative evaluation of CpG island methylation in hyperplastic polyps. Mod Pathol. 2010 Jan;23(1):151–156. PubMed PMID: 19855373.
- Maeda T, Suzuki K, Togashi K, et al. Sessile serrated adenoma shares similar genetic and epigenetic features with microsatellite unstable colon cancer in a location-dependent manner. Exp Ther Med. 2011 Jul;2(4):695–700. PubMed PMID: 22977561; PubMed Central PMCID: PMCPMC3440750.
- Dhir M, Yachida S, Van Neste L, et al. Sessile serrated adenomas and classical adenomas: an epigenetic perspective on premalignant neoplastic lesions of the gastrointestinal tract. Int J Cancer. 2011 Oct 15;129(8):1889–1898. PubMed PMID: 21154739; PubMed Central PMCID: PMCPMC3206997.
- Burnett-Hartman AN, Newcomb PA, Potter JD, et al. Genomic aberrations occurring in subsets of serrated colorectal lesions but not conventional adenomas. Cancer Res. 2013 May 1;73(9):2863–2872. PubMed PMID: 23539450; PubMed Central PMCID: PMCPMC3815695.
- Fernando WC, Miranda MS, Worthley DL, et al. The CIMP phenotype in BRAF mutant serrated polyps from a prospective colonoscopy patient cohort. Gastroenterol Res Pract. 2014;2014:1–10. PubMed PMID: 24812557; PubMed Central PMCID: PMCPMC4000649.
- Yamamoto E, Suzuki H, Yamano HO, et al. Molecular dissection of premalignant colorectal lesions reveals early onset of the CpG island methylator phenotype. Am J Pathol. 2012 Nov;181(5):1847–1861. PubMed PMID: 22995252.
- Worthley DL, Whitehall VL, Buttenshaw RL, et al. DNA methylation within the normal colorectal mucosa is associated with pathway-specific predisposition to cancer. Oncogene. 2010 Mar 18;29(11):1653–1662. PubMed PMID: 19966864.
- Park SJ, Rashid A, Lee JH, et al. Frequent CpG island methylation in serrated adenomas of the colorectum. Am J Pathol. 2003 Mar;162(3):815–822. PubMed PMID: 12598316.
- Imperiale TF, Ransohoff DF, Itzkowitz SH, et al. Multitarget stool DNA testing for colorectal-cancer screening. N Engl J Med. 2014 Apr 03;370(14):1287–1297. PubMed PMID: 24645800.
- Herman JG, Umar A, Polyak K, et al. Incidence and functional consequences of hMLH1 promoter hypermethylation in colorectal carcinoma. Proc Natl Acad Sci U S A. 1998 Jun 9;95(12):6870–6875. PubMed PMID: 9618505.
- Truninger K, Menigatti M, Luz J, et al. Immunohistochemical analysis reveals high frequency of PMS2 defects in colorectal cancer. Gastroenterology. 2005 May;128(5):1160–1171. PubMed PMID: 15887099.
- Reed KR, Korobko IV, Ninkina N, et al. Hunk/Mak-v is a negative regulator of intestinal cell proliferation. BMC Cancer. 2015 Mar 8;15:110. doi: 10.1186/s12885-015-1087-2. PubMed PMID: 25881306; PubMed Central PMCID: PMCPMC4367870.
- Yeh ES, Belka GK, Vernon AE, et al. Hunk negatively regulates c-myc to promote Akt-mediated cell survival and mammary tumorigenesis induced by loss of pten. Proc Natl Acad Sci U S A. 2013 Apr 9;110(15):6103–6108. PubMed PMID: 23520049; PubMed Central PMCID: PMCPMC3625285.
- Bergman Y, Cedar H DNA methylation dynamics in health and disease. Nat Struct Mol Biol. 2013 Mar;20(3):274–281. PubMed PMID: 23463312.
- Schlesinger Y, Straussman R, Keshet I, et al. Polycomb-mediated methylation on Lys27 of histone H3 pre-marks genes for de novo methylation in cancer. Nat Genet. 2007 Feb;39(2):232–236. PubMed PMID: 17200670.
- Widschwendter M, Fiegl H, Egle D, et al. Epigenetic stem cell signature in cancer. Nat Genet. 2007 Feb;39(2):157–158. PubMed PMID: 17200673.
- Mohn F, Weber M, Rebhan M, et al. Lineage-specific polycomb targets and de novo DNA methylation define restriction and potential of neuronal progenitors. Mol Cell. 2008 Jun 20;30(6):755–766. PubMed PMID: 18514006.
- Reddington JP, Pennings S, Meehan RR Non-canonical functions of the DNA methylome in gene regulation. Biochem J. 2013 Apr 1;451(1):13–23. PubMed PMID: 23489368.
- Manzo M, Wirz J, Ambrosi C, et al. Isoform-specific localization of DNMT3A regulates DNA methylation fidelity at bivalent CpG islands. Embo J. 2017 Dec 1;36(23):3421–3434. PubMed PMID: 29074627; PubMed Central PMCID: PMCPMC5709737.
- Easwaran H, Johnstone SE, Van Neste L, et al. A DNA hypermethylation module for the stem/progenitor cell signature of cancer. Genome Res. 2012 May;22(5):837–849. PubMed PMID: 22391556; PubMed Central PMCID: PMCPMC3337430.
- Ong CT, Corces VG CTCF: an architectural protein bridging genome topology and function. Nat Rev Genet. 2014 Apr;15(4):234–246. PubMed PMID: 24614316; PubMed Central PMCID: PMCPMC4610363.
- Yin Y, Morgunova E, Jolma A, et al. Impact of cytosine methylation on DNA binding specificities of human transcription factors. Science. 2017 May 05;356(6337). doi: 10.1126/science.aaj2239. PubMed PMID: 28473536.
- Flavahan WA, Drier Y, Liau BB, et al. Insulator dysfunction and oncogene activation in IDH mutant gliomas. Nature. 2016 Jan 07;529(7584):110–114. PubMed PMID: 26700815; PubMed Central PMCID: PMCPMC4831574.
- Wang H, Maurano MT, Qu H, et al. Widespread plasticity in CTCF occupancy linked to DNA methylation. Genome Res. 2012 Sep;22(9):1680–1688. PubMed PMID: 22955980; PubMed Central PMCID: PMCPMC3431485.
- Yan H, Tang G, Wang H, et al. DNA methylation reactivates GAD1 expression in cancer by preventing CTCF-mediated polycomb repressive complex 2 recruitment. Oncogene. 2016 Jul 28;35(30):3995–4008. PubMed PMID: 26549033.
- Neri F, Rapelli S, Krepelova A, et al. Intragenic DNA methylation prevents spurious transcription initiation. Nature. 2017 Mar 2;543(7643):72–77. PubMed PMID: 28225755.
- Maunakea AK, Nagarajan RP, Bilenky M, et al. Conserved role of intragenic DNA methylation in regulating alternative promoters. Nature. 2010 Jul 8;466(7303):253–257. PubMed PMID: 20613842; PubMed Central PMCID: PMCPMC3998662.
- Kim JH, Kim KJ, Rhee YY, et al. Gastric-type expression signature in serrated pathway-associated colorectal tumors. Hum Pathol. 2015 May;46(5):643–656. PubMed PMID: 25704805.
- Delker DA, McGettigan BM, Kanth P, et al. RNA sequencing of sessile serrated colon polyps identifies differentially expressed genes and immunohistochemical markers. PLoS One. 2014;9(2):e88367. PubMed PMID: 24533081; PubMed Central PMCID: PMCPMC3922809.
- Sajanti SA, Vayrynen JP, Sirnio P, et al. Annexin A10 is a marker for the serrated pathway of colorectal carcinoma. Virchows Arch. 2015 Jan;466(1):5–12. PubMed PMID: 25395067.
- Caruso M, Moore J, Goodall GJ, et al. Over-expression of cathepsin E and trefoil factor 1 in sessile serrated adenomas of the colorectum identified by gene expression analysis. Virchows Arch. 2009 Mar;454(3):291–302. PubMed PMID: 19172291.
- Gonzalo DH, Lai KK, Shadrach B, et al. Gene expression profiling of serrated polyps identifies annexin A10 as a marker of a sessile serrated adenoma/polyp. J Pathol. 2013 Aug;230(4):420–429. PubMed PMID: 23595865.
- De Sousa E Melo F, Wang X, Jansen M, et al. Poor-prognosis colon cancer is defined by a molecularly distinct subtype and develops from serrated precursor lesions. Nat Med. 2013 May;19(5):614–618. PubMed PMID: 23584090.
- Kanth P, Bronner MP, Boucher KM, et al. Gene signature in sessile serrated polyps identifies colon cancer subtype. Cancer Prev Res (Phila). 2016 Jun;9(6):456–465. doi: 10.1158/1940-6207.CAPR-15-0363. PubMed PMID: 27026680; PubMed Central PMCID: PMCPMC4941619.
- Rahmatallah Y, Khaidakov M, Lai KK, et al. Platform-independent gene expression signature differentiates sessile serrated adenomas/polyps and hyperplastic polyps of the colon. BMC Med Genomics. 2017 Dec 28;10(1):81. doi: 10.1186/s12920-017-0317-7. PubMed PMID: 29284484; PubMed Central PMCID: PMCPMC5745747.
- Endoscopic Classification Review Group. Update on the Paris classification of superficial neoplastic lesions in the digestive tract. Endoscopy. 2005 Jun;37(6):570–578. PubMed PMID: 15933932.
- Krueger F, Andrews SR Bismark: a flexible aligner and methylation caller for bisulfite-seq applications. Bioinformatics. 2011 Jun 1;27(11):1571–1572. PubMed PMID: 21493656; PubMed Central PMCID: PMCPMC3102221.
- Patro R, Duggal G, Love MI, et al. Salmon provides fast and bias-aware quantification of transcript expression. Nat Methods. 2017 Apr;14(4):417–419. PubMed PMID: 28263959; PubMed Central PMCID: PMCPMC5600148.
- Hebestreit K, Dugas M, Klein HU. Detection of significantly differentially methylated regions in targeted bisulfite sequencing data. Bioinformatics. 2013 Jul 1;29(13):1647–1653. PubMed PMID: 23658421.
- Robinson MD, McCarthy DJ, Smyth GK edgeR: a Bioconductor package for differential expression analysis of digital gene expression data. Bioinformatics. 2010 Jan 1;26(1):139–140. PubMed PMID: 19910308; PubMed Central PMCID: PMCPMC2796818.