
ABSTRACT
Epigenetic mechanisms generate plastic phenotypes that can become locally adapted across environments. Disentangling genomic from epigenomic variation is challenging in sexual species due to genetic variation among individuals, but it is easier in self-fertilizing species. We analysed DNA methylation patterns of two highly inbred strains of a naturally self-fertilizing fish reared in two contrasting environments to investigate the obligatory (genotype-dependent), facilitated (partially depend on the genotype) or pure (genotype-independent) nature of the epigenetic variation. We found higher methylation differentiation between genotypes than between environments. Most methylation differences between environments common to both strains followed a pattern where the two genotypes (inbred lines) responded to the same environmental context with contrasting DNA methylation levels (facilitated epialleles). Our findings suggest that, at least in part, DNA methylation could depend on the dynamic interaction between the genotype and the environment, which could explain the plasticity of epigenetically mediated phenotypes.
Introduction
Epigenetic modifications are one of the potential molecular mechanisms to explain phenotypically plastic responses within genotypes [Citation1,Citation2]. This is because epigenetic markers can be altered by environmental variation and shape gene expression without changing nucleotide sequences [Citation3], and ultimately affect phenotypic variation [Citation1,Citation4,Citation5]. In phenotypic plasticity studies, the genome and epigenome are often experimentally confounded [Citation6], and an implicit assumption is made that they react to environmental variation following similar norms of reaction. However, this may not necessarily be the case and genomes and epigenomes may respond differently to environmental change, thereby generating additional phenotypic variation [Citation3,Citation7].
To what extent epigenetic modifications act independently of genomic variation is key to understanding the potential role of epigenetics in evolution [Citation3,Citation7,Citation8], as epigenetic variation completely under genetic control would not contribute any additional adaptive value [Citation3]. Richards [Citation9] classified epigenetic variation in obligatory, facilitated or pure epialleles, based on their degree of autonomy from the underlying genotype. Obligatory epialleles would be fully dependent on genetic variation and should show no variation across environmental change [Citation10], whereas facilitated and pure epigenetic variation would differ in their degree of autonomy from the genotype (from partially dependent to independent) [Citation10], acting as potential intermediaries between environmental conditions and genome responses.
Among the epigenetic modifications, DNA methylation is the best studied and plays an important role in the pre-transcriptional control of several biological processes, such as cell differentiation and genomic imprinting [Citation11,Citation12]. While correlations among DNA methylation patterns, environmental conditions and phenotypic traits have been widely investigated [Citation8,Citation13,Citation14], the relative contributions of the genetic background and environmental variation to DNA methylation plasticity are still unclear [Citation4,Citation15]. Studies in humans and model organisms suggest that DNA methylation is influenced by the genotype, the environment and also by their interaction [Citation15,Citation16], but quantifying their relative influences is particularly challenging in natural populations with high levels of genetic variation [Citation17]. In particular, there is little information on the basis of DNA methylation plasticity beyond model organisms [Citation3], specially in teleost fishes, as most of the fish studies are done on zebrafish or salmonids [Citation18].
The self-fertilizing hermaphroditic mangrove killifish (Kryptolebias marmoratus) [Citation19] has naturally inbred lines [Citation20] which inhabit mangroves that vary markedly depending on tidal conditions, ranging from temporary pools to mangrove leaf litter and crab burrows [Citation21,Citation22]. The species displays considerable plasticity in behaviour [Citation23] and reproduction (mixed-mating with different degrees of self-fertilization and outcrossing) [Citation24], both between and within self-fertilizing lines [Citation25], and it has been suggested that regulation of gene expression through DNA methylation could play a role in its plastic response to environmental variation [Citation26,Citation27].
Inbred organisms provide a unique opportunity to detangle genetic from epigenetic variation [Citation2,Citation28]. Here, we investigated the relative roles of the genotype and the rearing environment (with or without physical enrichment) in DNA methylation plasticity of two genetically different and naturally inbred self-fertilizing lines of Krytolebias marmoratus. We hypothesized that if DNA methylation was mostly autonomous and shaped by environmental change, a higher number of different epialleles would be found between environments, regardless of the genetic background, than if DNA methylation was mostly under genetic control, where most of the epigenetic differences would occur between genotypes.
Results
We compared DNA methylation patterns in the brain of fish from two highly inbred mangrove killifish lines (DAN and R, originally collected in Belize mangroves but maintained under laboratory conditions for at least 20 generations) reared under physically enriched (with log and plants) or impoverished conditions (barren) for 10 months. By using Reduced Representation Bisulphite Sequencing (RRBS) we identified 5.5 million cytosine sites, of which 139.908 CpG sites fulfilled the minimum coverage requirement, representing 1.2% of the total number of cytosines of the mangrove killifish genome. This result is similar to recent RRBS studies in other fish (1% in rainbow trout [Citation13]; 1.5–2% in guppies [Citation29]).
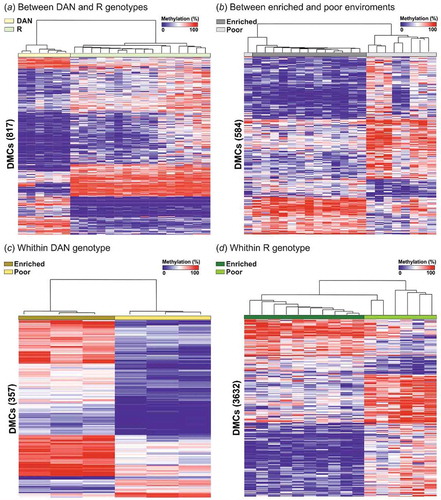
The majority of cytosines surveyed mapped gene bodies (71.32%) or intergenic regions (19.10%), while only 2.54% were located on putative promoters. Linear models using the PCA scores for 1064 DMCs and 194 DMRs identified between genotypes and environments revealed that genotypes explained more of the variance for PC1 (54% of overall variation for both DMCs and DMRs) than environment (Figure S2; Table S1). When predictors were analysed individually, differences between genotypes also corresponded to a higher number of DMCs (817 vs 594, four DMCs shared) and DMRs (43 vs 17, no DMR shared) than differences between environments ( and S2). Within genotypes, 357 and 3632 DMCs (25 and 373 DMRs) were identified between environments, for DAN and R, respectively. An additional analysis on three different subsets of six randomly selected R individuals (to match the number of DAN individuals) was carried out to assess possible biases due to differences in sample sizes. This analysis identified similar number of DMCs between lines, suggesting that the difference between lines was not due to sampling bias (Table S2). Unsupervised hierarchical clustering revealed distinctive methylation profiles between groups, except for comparisons between environments, where one and two individuals from the poor environment clustered with individuals from the enriched environment for DMCs and DMRs, respectively ( and S3).
Figure 1. Heat map illustrating percentage of methylation for all differentially methylated cytosines (DMCs) identified (a) between genotypes, (b) between environments, (c) between environments for DAN strain, and (d) between environments for R strain (logistic regression q < 0.01 and |ΔM|>20%, and t.test p < 0.01) using unsupervised hierarchical clustering. Rows represent a unique CpG site and columns individual fish.
Twenty-five annotated DMCs and four DMRs between environments were shared across genotypes, potentially representing environmentally affected DMCs, independently of genetic background. Of these, based on the direction of methylation across environments, 22 out 25 DMCs were classified as potentially facilitated, with methylation scores following a genotype-specific pattern under similar environments (). This pattern was supported by the PCA results based on the DMCs methylation scores, which indicated different methylation profiles between environments (PC1 explaining 55.8% of variation), as well as genotypes (PC2 explaining 22.4% of variation) ()). PC1 loadings were significantly influenced by the environment (t = 1.63, df = 1, p = 0.003) and the interaction between genotype and environment (t = −11.25, df = 1, p < 0.001), while PC2 loadings were only significantly influenced by the genotype (t = −1.64, df = 1, p < 0.001) (). Methylation differences (with a lower threshold of 20%) for the facilitated DMCs ranged from 20.2% to 48.6% (). The potentially facilitated DMCs were mostly hypermethylated on enriched environments with respect to poor environments for DAN fish, while the opposite pattern was found for R fish (; ) and S4). The four DMRs between environments and shared by genotypes were also classified as facilitated, following the same methylation pattern found on the facilitated DMCs (Figure S5; Table S3)
Table 1. Methylation differences averaged (percentage) for differentially methylated cytosines (DMCs) between environments (poor, enriched), shared between genotypes (DAN, R) which overlap annotated genes (reference genome ASM164957v1, GCA_00164975.1). Epiallele classification (pure or facilitated) followed [Citation9]. Positive and negative values represent increased and decreased methylation in enriched and poor environments, respectively. Q-value is the p-value adjusted by false discovery rate (FDR = 0.05).
Table 2. Linear model of principal component scores for mangrove killifish epialleles shared between genotypes (R, DAN) and environments (poor, enriched).
Figure 2. Principal component analysis (PCA) and reaction norms of epialleles across genotypes and environments. PCAs were based on individual scores of methylation across either (a) facilitated or (b) pure annotated DMCs. Dark yellow for DAN individuals on enriched environments; light yellow for DAN genotype on poor environments; dark green for R individuals on enriched environments; light green for R genotype on poor environments. Each reaction norm represents the change on averaged methylation scores (in percentage) for (c) facilitated and (d) pure epialelles annotated DMCs across environments. Different colours represent the genotypes (yellow for DAN; green for R). Different shapes (d) represent different annotated DMCs. Epialelles were classified according to Richards (2006). Detailed information for each annotated DMCs methylation score across genotypes is available in .
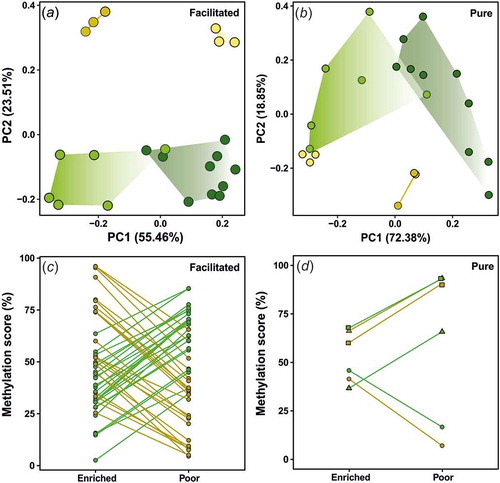
Only three of the annotated DMCs within or neighbouring gene bodies were considered pure (; Figure S6). Average methylation differences for pure DMCs ranged from 25.4% to 34.37% (). The PCA only using pure DMCs showed a different pattern from the facilitated DMCs, with the PC1 separating environments explaining 72.38% of the variation, and the PC2 partially differentiating genotypes explaining 18.85% of the variation ()). PC1 loadings were significantly affected by the environment (t = −2.81, df = 1, p < 0.001) and the genotype (t = −2.28, df = 1, p = 0.008), while PC2 loadings were only significantly influenced by the genotype (t = 0.29, df = 1, p = 0.003) (, ) and S6).
Molecular network analysis revealed a highly connected network linked by genetic interactions and co-expression interactions, that was composed by 23 input-annotated DMCs (the uncharacterized LOC108245430 and ubald1 with no identified connections were removed) and 20 neighbouring genes (Figure S7). Centrality parameters, such as average degree (mean = 10.55; SD ± 5.89), closeness (mean = 0.53 ± 0.06), and radiality (mean = 0.77 ± 0.06) (Table S4), suggested that any alteration of the expression of the genes contained in the network might have major effects on genetic interactions and gene expression levels.
Twelve of the 15 most connected genes within the network (>10 connections) were input genes (i.e. genes affected by DMCs between environments and shared by genotypes). Gene ontology analysis showed that some of these genes are involved on important cellular and metabolic processes in zebrafish, such as regulation of transcription by RNA polymerase and gene expression (myc), RNA modification (trit1), intracellular calcium content (ryr3), and lipid metabolism (sorcs2), as well as pathways related to angiogenesis and stress response (ryr3 and myc) (Table S5).
Discussion
The potential adaptive role of epigenetically mediated plasticity depends on the relationship between the genome, the epigenome and the environment [Citation6,Citation7]. By using two naturally inbred strains of the mangrove killifish reared under contrasting environmental conditions, we have identified significant methylation differences among genotypes and environments, with different levels of autonomy from the genetic background.
Environmental enrichment affects the brain structure of fish [Citation30–Citation32], however few studies have investigated the molecular mechanisms underlying these changes [Citation33,Citation34] or whether the effects of enrichment vary across different genetic backgrounds. Kryptolebias marmoratus populations are composed by naturally inbred lines living in highly variable habitats [Citation21,Citation25], which display remarkable phenotypic variation (e.g. in reproductive output [Citation24,Citation35], behaviour [Citation23,Citation36,Citation37] or sexual differentiation [Citation35]), even under identical environmental conditions [Citation25]. For example, the strains we used here were previously shown to display different sex-ratios in response to temperature variation [Citation20], as well as differences in gene expression in response to parasitic infection [Citation38], suggesting a potential combination of genetic and non-genetic mechanisms in mediating phenotypic variation [Citation2]. Our results indicate that genotypes have an overriding influence on brain DNA methylation patterns and that their effect is greater than that caused by environmental enrichment. We only found a few DMCs that could be considered facilitated or pure epialleles, supporting the idea that environmentally induced autonomous DNA methylation may be limited [Citation2]. Yet, the DNA methylation patterns of these putative independent epialleles indicated that DNA methylation outcomes could depend on specific combinations of the genotype and environmental conditions, although we cannot fully rule out the potential contribution of heritable epigenetic states independent of the genotypes [Citation7] and/or brain cell heterogeneity.
The large differences in number of DMCs we found between lines could be explained by their genetic differences [Citation39]. Studies in model organisms indicate that DNA methylation, and potentially other layers of chromatin organization, are strongly influenced by genomic variants [Citation40–Citation42]. For example, the spontaneous mutation in a gene related to methyltransferase1 activity increased by 40% the methylation differences among inbred lines of Arabidopsis thaliana [Citation43], and in humans, 25% of variation in neonates’ methylomes can be explained by their genotype, while the remaining 75% is related to interactions between the genotype and maternal factors (i.e. smoking, age, intra-uterine environment) [Citation15].
Most of the DMCs that we detected between environments and that were shared by both genotypes were located in gene bodies and were highly integrated within a gene network of genetic interactions and co-expression. Recent evidence in plants [Citation44] indicates that gene body methylation can reduce erroneous transcription, and in oyster [Citation45] and zebrafish [Citation46] there seems to be a positive correlation between gene body methylation, gene expression and transcriptional regulation. Here, some of the genes affected by the DMCs found in gene bodies were related to the regulation of RNA polymerase activity and gene expression patterns (myc and trit1) [Citation45,Citation46], suggesting that these changes in methylation could be involved in biological and cellular processes.
DNA methylation is a good candidate for mediating phenotypic plasticity, given its responsiveness to environmental change, effects on downstream phenotypes, and transgenerational stability [Citation3,Citation4,Citation47]. Our results suggest that, at least in part, DNA methylation patterns are influenced by a dynamic interaction between genotypes and the environment. Further research to investigate whether the patterns found here might influence transcription is warranted to assess the generality of our results, as this might provide a potential mechanistic explanation for the genotype-by-environment patterns often observed in phenotypically plastic responses [Citation6,Citation48].
Methods
We used hermaphrodite fish from two highly inbred strains (R and DAN) of Kryptolebias marmoratus originally collected from Belize [Citation49,Citation50] and kept under laboratory conditions (25–27°C, 16–18‰ ppm salinity under a 12 h light:12 h dark photoperiod), for at least 20 selfing generations [Citation51]. The R (also called 50.91) strain was collected in Belize (Twin Cayes) in the early 1990s while the DAN (Dan06) strain was also collected from Belize in the early 2000s [Citation49]. These selfing lines had previously shown different DNA methylation responses to environment (temperature) variation [Citation20].
We compared brain methylation of fish reared under enriched and impoverished conditions, as previous studies had shown environmental enrichment can affect behavioural flexibility [Citation52], brain size and cognition [Citation53], and induce epigenetic modifications during early development [Citation54]. We used two different habitats with different levels of environmental enrichment: 1) a physically enriched habitat, where individual fish were placed in contiguous rectangular tanks (9 cm depth x 12 cm width x 8 cm length) filled with 400 ml of brackish water and fitted with one artificial log (3 cm depth x 4 cm width x 4 cm length) and three artificial plants to simulate a complex habitat, and 2) a barren habitat (hereafter called poor) with the same tank conditions but without physical enrichment (Figure S1). Tanks were separated by opaque screens to prevent visual contact between individuals. For both strains, five initial lab-reared hermaphrodite parents of similar size (mean = 3.8 cm, SD = ±0.12) and age (mean = 417.3 days post-hatch, SD = ±13.4) were chosen. Eggs from these parents were maintained individually in circular plastic pots containing 100 ml of brackish water and checked daily (Figure S1). Upon hatching, individual alevins were randomly assigned to treatment tanks (enriched and poor), with one fish in each tank. Hatching success was 90%. The initial experimental set-up consisted of 29 R fish (18 in enriched habitat, 11 in poor habitat) and 21 DAN fish (10 in enriched, 11 in poor). Fish were maintained under standard laboratory conditions as above and fed three times a week with live brine shrimp (1 ml for the first two months post-hatch, and 2 ml thereafter). Fish were maintained in the experimental tanks for 10 months before being euthanized for brain methylation analysis. At 7 months post-hatch all fish in the experiment had laid at least one egg indicating that they were all sexually mature self-fertilizing hermaphrodites.
Genome-wide DNA methylation data
Fish were euthanized using tricaine methane-sulfonate (MS-222) following UK Home Office Schedule 1 and their brains kept in molecular biology grade ethanol (99%) for DNA extraction. Brain DNA was extracted from 22 individuals for epigenetic analysis (6 DANs: 3 from each environment; 16 Rs: 6 from poor, 10 from enriched environment) using Qiagen DNeasy Blood and tissue kit (Qiagen). Fish were genotyped for 23 microsatellites [Citation55]. Genetic differences were identified between inbred lines (FST=1.00, Table S6), but not within lines. All individuals tested were homozygotes and identical within each line for all the markers analysed (Table S6).
Bisulphite converted genomic DNA libraries were prepared using Diagenode Premium Reduced Representation Bisulphite Sequencing (RRBS) kit according to manufacturer’s indications and sequenced on an Illumina NextSeq 500 platform using a 1x75pb single-end run, with PCR fully methylated and unmethylated spike controls added.
Quality assessment was performed using FastQC [Citation56]. TrimGalore! [Citation57] was used to trim low-quality base calls and adapters. Trimmed reads were aligned to the Kryptolebias marmoratus reference genome (ASM164957v1, GCA_00164975.1: source NCBI) prior in-silico bisulphite conversion using Bismark v0.17.0 [Citation58], which was also used for cytosine methylation calls. Only methylation within CpG context [Citation59] with a minimum coverage of 10 reads in each sample across the 22 individuals sequenced [Citation60] was considered for subsequent analysis. Samples were divided into four experimental groups: ‘DAN enriched’, ‘DAN poor’, ‘R enriched’, ‘R poor’. Mapped reads were processed using SeqMonk [Citation61]. After quality filtering, approximately 273 million reads were retained, averaging 12 million reads per sample. Of those, ~ 62.9% were uniquely mapped reads to the reference genome (Table S7). Overall bisulfite conversion was 99.6%.
Differentially methylated cytosines and regions
To identify differentially methylated cytosines (DMCs) across experimental groups, we used logistic regression on quantitated normalized data using α = 0.01 after multiple testing correction (Benjamini-Hochberg) and >20% minimal CpG methylation difference (|ΔM|), using R bridge in SeqMonk. We also performed t-tests across experimental group replicates, to generate a more conservative list of DMCs, only considering those shared by both statistical approaches. To identify differently methylated regions (DMRs), we performed a genome-wide unbiased DMR detection using tilling windows of 1000 bp on windows with at least five CpGs with ≥10 reads across all individuals.
We used the scores of methylation for DMCs and DMRs between genotypes and environments for principal component analysis (PCA) using ggfortify package [Citation62] in R v. 3. 4. 3 (R Core Team 2014). To test for the effect of the genotype, environment and their interaction on the methylation scores, we used linear models with the scores for the first two PCA axis (>70% of the total variation) as a function of genotype, environment and their interaction. We then individually compared DMCs and DMRs between genotypes, followed by a comparison between environments. Subsequently, a comparison within each genotype between environments was carried out to identify potential environment-dependent DMCs and DMRs. From these comparisons, we identified annotated DMCs and DMRs shared between genotypes, which should represent commonly affected DMCs regardless of the genetic background.
We classified the DMCs and DMRs shared across genotypes between environments as facilitated, when displaying different directions of variation (non-parallel) on methylation scores across genotypes in the same environment (i.e. hypermethylated in an environment for one strain and hypomethylated in the other) or pure when displaying the same direction of variation (parallel) across genotypes and environments (i. e. hypermethylated or hypomethylated for both genotypes in the same environment) [Citation9].
Molecular network analysis and centrality metrics
To identify potential functional implications of variation in DNA methylation for the annotated DMCs identified across genotypes between environments, we built a functional gene network using GeneMANIA [Citation63]. To identify central genes [Citation64] within the molecular network, we used NetworkAnalyzer [Citation65] plugin into Cytoscape v. 3.7.1 [Citation65]. Panther GO terms [Citation66] was used to identify biological process and pathways for the most connected genes (>10 connections) within the network.
Authors’ contributions
SC, WMBF designed the experiment. WMBF, NB, DRB performed the experiment. WMBF, CGL, DRB analysed the data. WMBF, SC wrote the manuscript with participation of all authors.
Data accessibility
Sequences are accessible from https://www.ncbi.nlm.nih.gov/bioproject/506827.
Ethics
Work was carried out under Swansea University Animal Ethics Committee permit STU_BIOL_30484_110717192024_3.
Supplemental Material
Download MS Word (1.5 MB)Disclosure statement
No potential conflict of interest was reported by the authors.
Supplementary material
Supplemental data for this article can be accessed here.
Additional information
Funding
Related Research Data
References
- Bossdorf O, Arcuri D, Richards CL, et al. Experimental alteration of DNA methylation affects the phenotypic plasticity of ecologically relevant traits in Arabidopsis thaliana. Evol Ecol. 2010;24:541–553.
- Verhoeven KJF, Preite V. Epigenetic variation in asexually reproducing organisms. Evolution. 2013;68:644–655.
- Verhoeven KJF, vonHoldt BM, Sork VL. Epigenetics in ecology and evolution: what we know and what we need to know. Mol Ecol. 2016;25:1631–1638.
- Herman JJ, Sultan SE. DNA methylation mediates genetic variation for adaptive transgenerational plasticity. Proc R Soc B. 2016;283:20160988.
- Vergeer P, Wagemaker N, Ouborg NJ. Evidence for an epigenetic role in inbreeding depression. Biol Lett. 2012;8:798–801.
- Sultan SE. Organism and environment: ecological development, niche construction, and adaptation. USA: Oxford University Press; 2015.
- Richards CL, Alonso C, Becker C, et al. Ecological plant epigenetics: evidence from model and non‐model species, and the way forward. Ecol Lett. 2017;20:1576–1590.
- Duncan EJ, Gluckman PD, Dearden PK. Epigenetics, plasticity, and evolution: how do we link epigenetic change to phenotype? J Exp Zool Part B. 2014;322:208–220.
- Richards EJ. Inherited epigenetic variation – revisiting soft inheritance. Nat Rev Genet. 2006;7:395.
- Schmitz RJ, He Y, Valdés-López O, et al. Epigenome-wide inheritance of cytosine methylation variants in a recombinant inbred population. Genome Res. 2013;23:1663–1674.
- Koch IJ, Clark MM, Thompson MJ, et al. The concerted impact of domestication and transposon insertions on methylation patterns between dogs and grey wolves. Mol Ecol. 2016;25:1838–1855.
- Moore LD, Le T, Fan G. DNA methylation and its basic function. Neuropsychopharmacology. 2013;38:23–38.
- Baerwald MR, Meek MH, Stephens MR, et al. Migration‐related phenotypic divergence is associated with epigenetic modifications in rainbow trout. Mol Ecol. 2016;25:1785–1800.
- Jeremias G, Barbosa J, Marques SM, et al. Synthesizing the role of epigenetics in the response and adaptation of species to climate change in freshwater ecosystems. Mol Ecol. 2018;27:2790–2806.
- Teh AL, Pan H, Chen L, et al. The effect of genotype and in utero environment on interindividual variation in neonate DNA methylomes. Genome Res. 2014;24:1064–1074.
- Dubin MJ, Zhang P, Meng D, et al. DNA methylation in Arabidopsis has a genetic basis and shows evidence of local adaptation. eLife. 2015;4:e05255.
- Verhoeven KJF, Vonholdt BM, Sork VL. Epigenetics in ecology and evolution: what we know and what we need to know. Mol Ecol. 2016;25:1631–1638.
- Best C, Ikert H, Kostyniuk DJ, et al. Epigenetics in teleost fish: from molecular mechanisms to physiological phenotypes. Comp Biochem Physiol Part B Biochem Mol Biol. 2018;224:210–244.
- Tatarenkov A, Lima SMQ, Earley RL, et al. Deep and concordant subdivisions in the self-fertilizing mangrove killifishes (Kryptolebias) revealed by nuclear and mtDNA markers. Biol J Linn Soc. 2017;122:558–578.
- Ellison A, Rodríguez-López CM, Moran P, et al. Epigenetic regulation of sex ratios may explain natural variation in self-fertilization rates. Proc Biol Sci. 2015;282:20151900.
- Ellison A, Wright P, Taylor DS, et al. Environmental diel variation, parasite loads, and local population structuring of a mixed-mating mangrove fish. Ecol Evol. 2012;2:1682–1695.
- Taylor DS. Twenty-four years in the mud: what have we learned about the natural history and ecology of the mangrove rivulus, Kryptolebias marmoratus? Integr Comp Biol. 2012; 52:724-736.
- Edenbrow M, Croft DP. Environmental and genetic effects shape the development of personality traits in the mangrove killifish Kryptolebias marmoratus. Oikos. 2013;122:667–681.
- Lin H-C, Dunson WA. An explanation of the high strain diversity of a self‐fertilizing hermaphroditic fish. Ecology. 1995;76:593–605.
- Earley RL, Hanninen AF, Fuller A, et al. Phenotypic plasticity and integration in the mangrove rivulus (Kryptolebias marmoratus): a prospectus. Integr Comp Biol. 2012;52:814–827.
- Fellous A, Labed‐Veydert T, Locrel M, et al. DNA methylation in adults and during development of the self‐fertilizing mangrove rivulus, Kryptolebias marmoratus. Ecol Evol. 2018;8:6016–6033.
- Fellous A, Earley RL, Silvestre F. The Kdm/Kmt gene families in the self-fertilizing mangrove rivulus fish, Kryptolebias marmoratus, suggest involvement of histone methylation machinery in development and reproduction. Gene. 2019;687:173–187.
- Laskowski KL, Doran C, Bierbach D, et al. Naturally clonal vertebrates are an untapped resource in ecology and evolution research. Nat Ecol Evol. 2019;3:161–169.
- Hu J, Pérez‐Jvostov F, Blondel L, et al. Genome‐wide DNA methylation signatures of infection status in Trinidadian guppies (Poecilia reticulata). Mol Ecol. 2018;27:3087–3102.
- Näslund J, Aarestrup K, Thomassen ST, et al. Early enrichment effects on brain development in hatchery-reared Atlantic salmon (Salmo salar): no evidence for a critical period. Can J Fish Aquat Sci. 2012;69:1481–1490.
- Kihslinger RL, Lema SC, Nevitt GA. Environmental rearing conditions produce forebrain differences in wild Chinook salmon Oncorhynchus tshawytscha. Comp Biochem Physiol Part A Mol Integr Physiol. 2006;145:145–151.
- von Krogh K, Sørensen C, Nilsson GE, et al. Forebrain cell proliferation, behavior, and physiology of zebrafish, Danio rerio, kept in enriched or barren environments. Physiol Behav. 2010;101:32–39.
- Lema SC, Hodges MJ, Marchetti MP, et al. Proliferation zones in the salmon telencephalon and evidence for environmental influence on proliferation rate. Comp Biochem Physiol Part A. 2005;141:327–335.
- Salvanes AG, Moberg O, Ebbesson LO, et al. Environmental enrichment promotes neural plasticity and cognitive ability in fish. Proc Biol Sci. 2013;280:20131331.
- Turner BJ, Fisher MT, Taylor DS, et al. Evolution of ‘maleness’ and outcrossing in a population of the self-fertilizing killifish, Kryptolebias marmoratus. Evol Ecol Res. 2006;8:1475–1486.
- Wells MW, Wright PA. Do not eat your kids: embryonic kin recognition in an amphibious fish. Behav Ecol Sociobiol. 2017;71:140.
- Earley RL, Hsu Y. Reciprocity between endocrine state and contest behavior in the killifish, Kryptolebias marmoratus. Horm Behav. 2008;53:442–451.
- Pawluk RJ, Uren Webster TM, Cable J, et al. Immune-related transcriptional responses to parasitic infection in a naturally inbred fish: roles of genotype and individual variation. Genome Biol Evol. 2018;10:319–327.
- Gibson G, Dworkin I. Uncovering cryptic genetic variation. Nat Rev Genet. 2004;5:681.
- Li X, Zhu J, Hu F, et al. Single-base resolution maps of cultivated and wild rice methylomes and regulatory roles of DNA methylation in plant gene expression. BMC Genomics. 2012;13:300.
- Gutierrez-Arcelus M, Lappalainen T, Montgomery SB, et al. Passive and active DNA methylation and the interplay with genetic variation in gene regulation. Elife. 2013;2:e00523.
- van der Graaf A, Wardenaar R, Neumann DA, et al. Rate, spectrum, and evolutionary dynamics of spontaneous epimutations. Proc Natl Acad Sci 2015; 112:6676–6681.
- Becker C, Hagmann J, Müller J, et al. Spontaneous epigenetic variation in the Arabidopsis thaliana methylome. Nature. 2011;480:245.
- Horvath R, Laenen B, Takuno S, et al. Single-cell expression noise and gene-body methylation in Arabidopsis thaliana. Heredity (Edinb). 2019;1.
- Riviere G, He Y, Tecchio S, et al. Dynamics of DNA methylomes underlie oyster development. PLoS Genet. 2017;13:e1006807.
- McGaughey DM, Abaan HO, Miller RM, et al. Genomics of CpG methylation in developing and developed zebrafish. G3 (Bethesda). 2014;4:861–869.
- Eichten SR, Briskine R, Song J, et al. Epigenetic and genetic influences on DNA methylation variation in maize populations. Plant Cell. 2013;tpc:113.114793.
- Des Marais DL, Hernandez KM, Juenger TE. Genotype-by-environment interaction and plasticity: exploring genomic responses of plants to the abiotic environment. Annu Rev Ecol Evol Syst. 2013;44:5–29.
- Tatarenkov A, Ring BC, Elder JF, Bechler DL, Avise JC. Genetic composition of laboratory stocks of the self-fertilizing fish Kryptolebias marmoratus: a valuable resource for experimental research. PLoS ONE. 2010;5:e12863.
- Lins LSF, Trojahn S, Sockell A, et al. Whole-genome sequencing reveals the extent of heterozygosity in a preferentially self-fertilizing hermaphroditic vertebrate. Genome. 2017.61:241–247.
- Ellison A, Allainguillaume J, Girdwood S, et al. Maintaining functional major histocompatibility complex diversity under inbreeding: the case of a selfing vertebrate. Proc R Soc London B 2012; 279:5004–5013.
- Roberts L, Taylor J, de Leaniz CG. Environmental enrichment reduces maladaptive risk-taking behavior in salmon reared for conservation. Biol Conserv. 2011;144:1972–1979.
- KihslingerRL, Lema SC, Nevitt GA. Environmental rearing conditions produce forebrain differences in wild Chinook salmon Oncorhynchus tshawytscha. Comp Biochem Physiol Part A. 2006;145:145–151
- Champagne FA. Epigenetic mechanisms and the transgenerational effects of maternal care. Front Neuroendocrinol. 2008;29:386–397.
- Ellison A, Cable J, Consuegra S. Best of both worlds? Association between outcrossing and parasite loads in a selfing fish. Evolution. 2011;65:3021–3026.
- Andrews S FastQC: a quality control tool for high throughput sequence data. Available from: http://wwwbioinformaticsbabrahamacuk/projects/fastqc/2010.
- Krueger F TrimGalore! A wrapper around cutadapt and FastQC to consistently apply adapter and quality trimming to FastQ files, with extra functionality for RRBS data. Available from: https://wwwbioinformaticsbabrahamacuk/projects/trim_galore/2016.
- Krueger F, Andrews SR. Bismark: a flexible aligner and methylation caller for Bisulfite-Seq applications. Bioinformatics. 2011;27:1571–1572.
- Feng S, Cokus SJ, Zhang X, et al. Conservation and divergence of methylation patterning in plants and animals. Proc Natl Acad Sci 2010; 107:8689–8694.
- Shafi A, Mitrea C, Nguyen T, et al. A survey of the approaches for identifying differential methylation using bisulfite sequencing data. Brief Bioinform. 2018;19:737–753.
- Andrews S SeqMonk: A tool to visualise and analyse high throughput mapped sequence data. Available from: https://wwwbioinformaticsbabrahamacuk/projects/seqmonk/2007.
- Tang Y, Horikoshi M, Li W. ggfortify: unified interface to visualize statistical results of popular R Packages. R J. 2016;8:478–489.
- Warde-Farley D, Donaldson SL, Comes O, et al. The GeneMANIA prediction server: biological network integration for gene prioritization and predicting gene function. Nucleic Acids Res. 2010;38:W214–W20.
- Del Rio G, Koschützki D, Coello G. How to identify essential genes from molecular networks? BMC Syst Biol. 2009;3:102.
- Assenov Y, Ramirez F, Schelhorn SE, et al. Computing topological parameters of biological networks. Bioinformatics. 2008;24:282–284.
- Mi H, Huang X, Muruganujan A, et al. PANTHER version 11: expanded annotation data from gene ontology and reactome pathways, and data analysis tool enhancements. Nucleic Acids Res. 2016;45:D183–D9.