
ABSTRACT
Replacing fish meal and oil in trout diets with plant-derived ingredients is a contemporary challenge to move towards more sustainable aquaculture practices. However, such dietary replacement causes hepatic metabolic changes that have not yet been elucidated. Here, we aimed to decipher the effect of a 100% plant-based diet on the hepatic global DNA methylation landscape in trout and assess whether changes depend on fish genetic background. We analysed the global methylome and the expression of DNA (de)methylation-related genes of three isogenic lines that exhibit similar growth when fed a marine resource-based diet (M diet), but differ in their responses to a plant-based diet (V diet). Our results revealed that the V diet induced a decrease in 5-cytosine combined with an increase in 5-hydroxymethylcytosine in two of the three analysed lines. For one of these 2 affected lines, when fed the M diet but at the same feed intake of the V diet (MR), no methylome differences were highlighted between M and MR or between MR and V-fed trout whereas for the other affected line, M fed trout displayed a divergent methylome profile from MR and V fed fish. DNA (de)methylation-related genes were also affected by the V or MR diets. Our findings showed that the global hepatic methylome of trout is affected by a V diet, depending on genetic background. This latter effect seems to be due to either a decreased feed intake alone or combined with the effect of the dietary composition per se.
Introduction
Replacing fish meal (FM) and fish oil (FO) in the aquafeed formula of carnivorous farmed fish species, such as rainbow trout (RBT), to move towards more sustainable aquaculture practices is a contemporary challenge. One solution consists of substituting FM and/or FO with plant-based ingredients. The effects of these ingredients on biological parameters (e.g., growth, feed intake, feed efficiency) and metabolism at the molecular level have been widely studied, and some adverse outcomes have been overcome [Citation1–6]. More recently, genetic variability in the capacity to grow with plant-based diets has been demonstrated in the RBT population. In particular, three isogenic lines (i.e., trout within the same line having the same genome) produced at INRAE [Citation7] have previously demonstrated identical growth performance when fed an FM-FO based diet, but exhibit a wide range of different performance characteristics when fed a 100% plant-based diet [Citation8–10]. RBT from two lines (R23h and AB1h) appear to have superior capacity to grow and survive with this diet than fish from the third line (A22h). Whether these different abilities to use a 100% plant-based diet could be linked to modifications involving the DNA methylation landscape remains to be explored, as epigenetic mechanisms are known to mediate environmentally induced phenotypic variation [Citation11].
Indeed, the DNA methylation landscape is known to be highly sensitive to the environment, including changes in nutrition, and can be modified throughout life to tackle such changes in order to lead to new adaptive phenotypes [Citation12,Citation13]. Over the past decade, this epigenetic mechanism has been revealed to be more complex than the addition of only a methyl group to the 5th position of the pyrimidine ring of cytosine (5-mC). First, this modification can occur at both CpG and non-CpG sites. Although non-CpG methylation accounts for a small fraction of mammalian genomes and their functional roles remain less understood than CpG methylation, evidence has proven that they may also participate in the transcriptional regulation of genes, mostly following metabolic modifications [Citation14]. Second, even if less well-studied, several lines of evidence indicate that DNA methylation derivatives cannot be reduced to inert intermediates in the demethylation process. These are formed by the active demethylation pathway accomplished through the ten-eleven translocation (Tet) dioxygenase family-mediated iterative oxidation of 5-mC into 5–hydroxymethylcytosine (5-hmC), 5-formylcytosine (5-fC), and 5-carboxylcytosine (5-caC) derivatives, followed by thymine DNA glycosylase (Tdg)-dependent base excision repair or replication-dependent dilution [Citation15,Citation16], which leads to cytosine. Indeed, such alterations are now recognized to play a role in the regulation of transcriptional activity [Citation17–21] and have been shown to be stable DNA modifications [Citation22].
These findings demonstrate the importance of considering all components of the DNA methylation process to better understand the impact of environmental parameters on this mechanism, and to not only limit investigations of CpG sites and methyl-cytosines.
In addition to their distinct phenotypes when fed a 100% plant-based diet, isogenic lines are unique and powerful tools to study environmentally induced epigenetic modifications as they allow genetic and environmental impacts on the epigenetic landscape to be disentangled, and also to eliminate inter-individual genetic variability within the same line [Citation23]. The present study aimed to decipher the effect of a 100% plant-based diet (hereafter V diet) on the hepatic DNA methylation landscape of the previously cited isogenic lines fed such a diet from first feeding to the juvenile stage (6-month growth trial). We have taken into account the different aspects of DNA methylation processes, that is, an overview of CpG and non-CpG methylation and of all DNA methylation derivatives allowed by HPLC-UV analysis. In addition to tet-and tdg-encoding genes involved in active demethylation processes, mRNA levels of orthologous DNA methyl transferase (dnmt) genes was also assessed by qPCR to highlight their potential roles in the observed DNA modifications. Indeed, the DNA methylation process is mediated by members of the DNA Dnmt family composed of the maintenance methyltransferase Dnmt1 [Citation24] and de novo methyltransferase Dnmt3 [Citation25].
Materials and methods
The experimental plan, diets, and animals were previously described by Callet et al. (2021 [Citation10]). Investigations were focused on the liver as this organ is considered to be the centre of intermediate metabolism.
Experimental diets and animals
The two experimental diets, formulated to be isoproteic, isolipidic, and isoenergetic, were produced at the INRAE facilities (UMR NuMea, Donzacq, France). Formula and composition of the experimental diets are listed in . The marine resource-based diet (M diet) contained FM, FO, and whole wheat as the major ingredients. The V diet contained only plant products and was devoid of marine products. Both diets were extruded as pellets. The pellet size was changed during the experiment to adapt to fish body size, but the composition remained unchanged.
Table 1. Ingredients and proximal composition of experimental diets V and M (DM: dry matter). Previously published in callet et al. 2021 [Citation10].
The study was conducted with three heterozygous isogenic lines denoted as R23h, AB1h, and A22h that were produced in the experimental PEIMA facilities (INRAE, Sizun, France). These lines used for scientific research (not for commercial production) were obtained by mating homozygous females from a single isogenic line with individual males from three other homozygous isogenic lines. Homozygous lines were obtained after two generations of gynogenesis and were maintained by within-line pair-mating [Citation7]. All the oocytes were collected from 33 females from the B57 isogenic line (thus sharing the same genome), were mixed and then randomly divided in three batches. Each batch was then fertilized with milt from an individual male from three other homozygous isogenic lines, namely R23, AB1, and A22. Since eggs from all the females were mixed, there was no potential maternal effect between the different groups, which then only differed from paternal effect (for information, the mean weight of oocytes was 40.34 mg ± 3.04).
Experimental plan
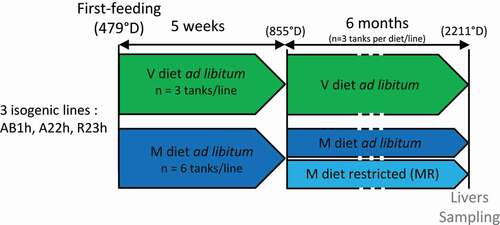
Experiments were performed in the experimental PEIMA facilities and are presented in . Before the first feeding, fry (330 fish ± 199) from the three lines were randomly distributed into 27 tanks (0.25 m3, 9 tanks per isogenic line). At this stage, alevins were not individually weighed in order to prevent them from being stressed. Alevins mass was estimated based on known growth curves. The tank water volume was gradually increased from 0.08 to 0.20 m3 according to the biomass of each tank. Water was maintained at a constant temperature of 11.6°C ± 0.5°C and fish were maintained over an 8-h lighting period at 300 lux. From first feeding (479°D), fish were fed ad libitum with either the M diet (n = 6 tanks/line) or the V diet (n = 3 tanks/line). Phenotypic differences observed in RBT fed a FM/FO-based diet ad libitum (termed M diet for ‘marine’ diet) versus a V diet can stem from feed intake (FI) [Citation10] or the capacity to grow with such a diet. In order to be able to distinguish the effects of the composition of the V diet from the effects of decreased FI on DNA methylation, trout were thus fed with either the V diet ad libitum, the M diet ad libitum, and the M diet distributed as a restricted ration in order to obtain M-fed fish with a similar FI as fish fed the V diet (this last condition will be referred to as MR for ‘marine restricted’ diet). Thus, five weeks after first feeding (855°D), half of the fish previously fed the M diet ad libitum were restricted (MR dietary treatment) in order to provide the fish fed the M diet the same amount of food than that spontaneously consumed by the fish of the same line fed the V diet (n = 3 tanks/line). The feed was distributed with automatic feeders over 8-h of the lighting period. Six months after feeding (2211°D), six fish per condition (V, M, or MR, two fish per tank replicate) and line (R23h, AB1h, or A22h) were caught randomly and anesthetized and then euthanized with benzocaine at least 8-h after the last meal. Livers were sampled and immediately snap-frozen in liquid nitrogen for further analysis.
Figure 1. Experimental plan. Three isogenic lines of rainbow trout were fed during 5 weeks from the first feeding (479 degrees days, °D) with either a plant-based diet (v) or a marine resources-based diet (m). Fish fed the M diet were then split into 2 groups, with the first continuing to be fed the M diet ad libitum, the second being restricted to follow the same FI as fish fed the V diet. The livers of fish were then sampled after 6 months of feeding.
RNA extraction and gene abundance analysis
Liver samples were ground and then homogenized in Trizol reagent (Invitrogen, Waltham, MA USA) with Precellys®24 (Bertin Technologies, Montigny-le-Bretonneux, France), and total RNA was extracted according to the manufacturer’s instructions. Subsequently, 1 µg of total RNA was reverse-transcribed to cDNA in duplicate using the Super-Script III RNase H-Reverse transcriptase kit (Invitrogen) with random primers (Promega, Charbonniéres, France).
The primers used in quantitative real-time PCR (qPCR) assays were reported in a previous study [Citation26]. qPCR assays were performed using the Roche LightCycler 480 system (Roche Diagnostics, Neuilly-sur-Seine, France). The reaction volume was 6 µL per sample, including 2 µL of diluted cDNA template (1:76), 0.12 µL of each primer (10 µmol L−1), 3 µL of Light Cycler 480 SYBR® Green I Master mix and 0.76 µL of DNase/RNase-free water (5 Prime GmbH, Hamburg, Germany). The qPCR protocol was initiated at 95°C for 10 min for initial denaturation of the cDNA and hot-start Taq polymerase activation, followed by 45 cycles of a two-step amplification programme (15 s at 95°C, 10 s at 60°C). Amplicon melting curves were monitored systematically (temperature gradient 0.11°C per s from 65°C to 97°C) at the end of the last amplification cycle to confirm specificity of the amplification reaction. Each qPCR assay included replicate samples (duplicates of reverse transcription and PCR amplification) and negative controls (reverse transcriptase- and cDNA template-free samples). The relative quantification of mRNA levels of target genes (i.e., dnmt, tet and tdg-encoding genes) was normalized to the transcript abundance of ef1α, as previously described using the E-method and Light Cycler software [Citation27].
DNA extraction
Approximately 10 mg of frozen-grounded liver (from the same homogenate used for RNA extraction) was digested for 1 h at 57°C in 800 µL of guanidine thiocyanate buffer pH 8 (1 M guanidine thiocyanate, 50 mM TRIS base, 0.01 mM EDTA, 5% Tween, 0.5% Triton X100, 0.1 mM deferoxamine, 16 mM histidine, and 3 mM glutathione) with 0.25 mg/mL of proteinase K. Then, 800 µL of chloroform-isoamyl alcohol (24:1) was added including 0.1 mM deferoxamine, 16 mM histidine, and 3 mM reduced glutathione. Samples were placed on a rotating wheel for 15 min at room temperature, followed by centrifugation for 15 min at 10,000 × g at room temperature. For each sample, 300 µL of the upper phase was recovered and 75 µL of 5 M NaCl and 937 µL of 100% cold ethanol were added. Samples were mixed by inversion and held at least 15 min at −20°C to precipitate DNA, then centrifuged for 15 min at 10,000 × g at 4°C. Ethanol was removed, and the pellets were washed with 70% ice-cold ethanol. Ethanol was removed, and the pellets were resuspended in ultrapure water. All reagents were purchased from Sigma (St. Louis, MO, USA). DNA was quantified using a Nanodrop instrument (Thermo Fisher Scientific, Waltham, MA, USA), and quality (i.e., high molecular weight) was verified by electrophoresis on 1% agarose gels.
Global DNA methylation analysis using HPLC-UV
According to the manufacturer’s recommendations, 1.5 µg of DNA (as measured by Nanodrop) was digested with 0.5 µL of RNase Cocktail (Ambion, Austin, Texas, USA) containing 500 U/mL of RNaseA and 20,000 U/mL of RNase T1 to avoid nucleoside contamination. Digestion was performed for 30 min at 37°C. Nucleosides were obtained through a single-step hydrolysis process using DNA Degradase Plus (Zymo Research, Orange, CA, USA) following the manufacturer’s protocol. Briefly, the reaction mix consisted of 1.5 µg DNA sample, 2.5 µL 10X DNA Degradase Plus Reaction Buffer, 1 µL DNA Degradase Plus (5 U/μL) and ultrapure H2O to 25 µL. The reaction mixtures were incubated at 37°C for 2 h, followed by heat-inactivation at 70°C for 20 min. Samples were subjected to ultrafiltration using Amicon Ultra 0.5 mL 3 kDa units (Merck Millipore, Billerica, MA, USA) according to the manufacturer’s instructions. LC-UV analysis was based on a previously described protocol [Citation28] with major modifications. The system consisted of an Alliance 2695 separation module (Waters, Milford, MA, USA), a 2487 dual absorbance detector (Waters), and a column oven. Chromatographic separation was performed on a Luna C8 column (3 µm, 100 × 3 mm) (Phenomenex, Torrance, CA, USA). The mobile phase was composed as follows: solvent A: 10 mM potassium phosphate buffer, pH = 5.9 ± 0.1, solvent B: 100% methanol. Linear gradient elution was employed as follows: 0 min, 100% A; 0–8 min, 90% A; 8–8.5 min, 73% A; 8.5–13.5 min, 65% A. The flow rate was set at 0.5 mL/min. Column oven temperature was maintained at 25°C. The UV detection wavelength was 277 nm. Nucleosides were identified and quantified using external standards purchased from Berry and Associates (Dexter, MI, USA). The monitored nucleosides were 2’-deoxycytidine (dC), 5-methyl-2’-deoxycytidine (5-mdC), 5-hydroxymethyl-2’-deoxycytidine (5-hmdC), 5-formyl-2’-deoxycytidine (5-fdC), and 5-carboethoxy-2’ deoxycytidine (5-cadC). The global levels of 5-mdC, 5-hmdC, 5-fdC, and 5-cadC were calculated as the percentage of each individual molar quantity divided by the total molar quantity of all the detected cytosine forms. Using 5-mC as an example, the percentage of 5-mC was calculated using the following equations: 5-mdC% = 100 × Q5-mdC/(QdC +Q5-mdC + Q5-hmdC + Q5-fdC + Q5-cadC), where QdC, Q5-mdC, Q5-hmdC, Q5-fdC, Q5-cadC are the molar quantities of 5-mdC, 5-hmdC, 5-fdC, and 5-cadC, respectively.
Statistical analysis
The results are presented as means ± standard deviation (SD). Tank-to-tank differences were tested for each measured parameters using a Kruskal–Wallis non-parametric test. No significant tank-to-tank variations was identified, regardless of the tested condition/analysis. Normality distribution was evaluated using the Shapiro–Wilk test. Data were then analysed using a non-parametric Mann–Whitney test followed by a Bonferroni (as normality was not confirmed) for post hoc analysis. Statistical analyses were performed using R software (v3.1.0)/R Commander with the level of statistical significance set at p < 0.05.
Results
Global hepatic DNA methylation profiles of A22h, AB1h, and R23h RBT fed M, MR, or V diets
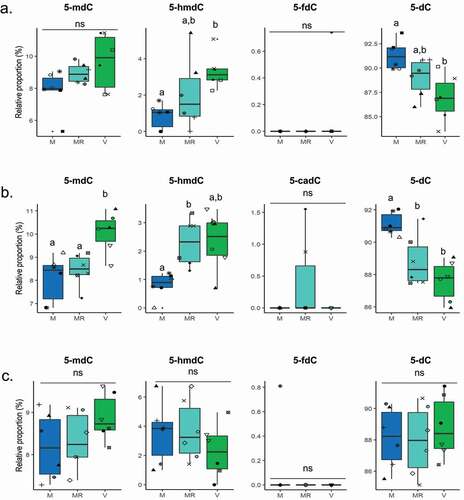
Using the HPLC-UV method, we obtained the profiles of DNA methylation derivatives in the livers of the three isogenic RBT lines fed with the M diet ad libitum, a restricted ration of M diet (MR), or the V diet ad libitum (). For A22h ()), dC level was significantly higher in the livers of trout fed the M diet than in those fed the V diet whereas the reverse profile was observed for 5-hmdC. No significant difference was highlighted for 5-mdC nor 5-fdC. For AB1h ()), 5-dC levels was significantly lower in the liver of trout fed the MR and V diets compared to trout fed the M diet whereas the reverse profile was observed for 5-mdC. 5-hmdC level was significantly lower in the liver of trout fed the M diet than in those fed the MR diet. No significant difference was found for 5-cadC levels for AB1h. For R23h ()), no differences were highlighted regardless of dietary conditions or the DNA methylation derivatives considered. Finally, 5-cadC in A22H and R23h livers as well as 5-fdC in AB1h livers were not detected by HPLC-UV.
Figure 2. Profiles of DNA methylation derivatives in the livers of A22h (a) AB1h (b) and R23h (c) isogenic rainbow trout lines fed either a plant-based diet (V, green) ad libitum, a marine resources-based diet (M, blue) ad libitum, or a restricted M diet (MR, light blue). Data are presented as means ± SD (n = 6 fish per condition, 2 fish per tank: the 2 sampled individuals from the same tank are represented by the same symbol in each box plot) and analysed using a Mann–Whitney test followed by a Bonferroni post hoc test. Bars bearing the same letter were not significantly different to each other (p > 0.05). ns, not significant. 5-mdC, 5-methyl-2’-deoxycytidine; 5-hmdC, 5-hydroxymethyl-2’-deoxycytidine; 5-fdC, 5-formyl-2’-deoxycytidine; 5-cadC, 5-carboethoxy- 2’ deoxycytidine; dC, deoxycytidine.
mRNA levels of DNA methylation-related genes in A22h, AB1h, and R23h lines fed either the M, MR, or V diets
mRNA levels of Dnmt-, Tet-, and Tdg-encoding genes were analysed in the livers of the three isogenic lines fed either of the three dietary conditions (M, MR, or V; ). We analysed the effects of diet on each RBT isogenic line. The mRNA levels of dnmt3ab1 in A22h, tet1a in A22h and AB1h, tet3a in all lines, tdgba in A22h and R23h, and tdgbb in R23h were all significantly higher in trout fed the V diet than in fish fed the M diet ad libitum and with restricted rations (in green in ). In contrast, mRNA level of dnmt3ba2 in R23h was significantly lower in trout fed the V diet than in fish fed M or MR diets (in pink in ). In addition, trout fed the V diet had lower mRNA levels compared to fish fed the M diet for dnmt3aa, dnmt3ba2 and dnmt3bba2 in A22h or dnmt1b in AB1h and A22h (in red in ), whereas tdgba and tdgaa in AB1h, tet1b in A22h and R23h, and tet1a in R23h (in grey in ) displayed reverse profiles. In addition, tet2a/b in R23h, and tdgaa in A22h and R23h mRNA levels were significantly higher in trout fed the V diet than in those fed the MR diet (in brown in ). Concerning trout fed MR compared to trout fed the V or M diets ad libitum, they displayed lower dnmt3aa mRNA levels in AB1h and dnmt3ab2 mRNA levels in both AB1h and R23h fish (in blue in ). Furthermore, dnmt3ba2 mRNA levels in AB1h were significantly higher in fish fed the M diet than in fish fed the V or MR diets (in purple in ). Also, in R23h, dnmt3ab1 mRNA level was significantly lower in trout fed the MR diet than in those fed the M diet (in orange in ). Finally, mRNA levels of dnmt3ab2, dnmt3bba1, dnmt3bbb, tet2a/b, tdgab, and tdgbb in A22h; dnmt3ab1, dnmt3bba1, dnmt3bba2, dnmt3bbb, tet1b, tet2a/b, tec2c, tdgab, and tdgbb in AB1h; and dnmt1b, dnmt3aa, dnmt3bba1, dnmt3bba2, dnmt3bbb and tdgab in R23h remained stable independent of diet (in black in ). Interestingly, tet2c was detected only in the AB1h line.
Figure 3. Hepatic mRNA levels of DNA (de)methylation-related genes (dnmt: DNA methyltransferase, tet: ten-eleven translocation dioxygenase, tdg: thymine DNA glycosylase) in A22h, AB1h and R23h isogenic lines fed either the marine resources-based diet ad libitum (M, blue), restricted (MR, light blue), or a plant-based diet (V, green). Data are expressed as means ± SD (n = 6 fish per condition, 2 fish per tank: the 2 sampled individuals from the same tank are represented by the same symbol in each box plot) and analysed by a Mann–Whitney test followed by a Bonferroni post hoc test. Different letters denote significant statistical differences, p < 0.05. ns: not significant; nd: not detected. Same colour circling the name of lines stands for a similar variation into mRNA level (red: M = MR,V = MR M > V; black: ns; blue: [M = V]>MR; green: [M = MR]<V; Orange: M = V, MR = V, MR<M; purple: [MR = V]<M; pink: [M = MR]>V; grey: M = MR; V = MR, M < V; brown: M = MR, M = V, MR<V; not circled: nd).
![Figure 3. Hepatic mRNA levels of DNA (de)methylation-related genes (dnmt: DNA methyltransferase, tet: ten-eleven translocation dioxygenase, tdg: thymine DNA glycosylase) in A22h, AB1h and R23h isogenic lines fed either the marine resources-based diet ad libitum (M, blue), restricted (MR, light blue), or a plant-based diet (V, green). Data are expressed as means ± SD (n = 6 fish per condition, 2 fish per tank: the 2 sampled individuals from the same tank are represented by the same symbol in each box plot) and analysed by a Mann–Whitney test followed by a Bonferroni post hoc test. Different letters denote significant statistical differences, p < 0.05. ns: not significant; nd: not detected. Same colour circling the name of lines stands for a similar variation into mRNA level (red: M = MR,V = MR M > V; black: ns; blue: [M = V]>MR; green: [M = MR]<V; Orange: M = V, MR = V, MR<M; purple: [MR = V]<M; pink: [M = MR]>V; grey: M = MR; V = MR, M < V; brown: M = MR, M = V, MR<V; not circled: nd).](/cms/asset/57529124-c99e-4da9-88eb-318359fd0803/kepi_a_2058226_f0003_oc.jpg)
Discussion
The present study aimed to decipher for the first time the effect of a 100% plant-based diet (V diet) on the hepatic DNA methylation landscape of three isogenic rainbow trout lines fed from the first feeding until the juvenile stage (6-month growth trial).
The overall profile of 5-methylcytosine derivatives is affected by the V diet in an isogenic-line dependent manner
Our study revealed that the global profile of 5-methylcytosine derivatives differed in the A22h and AB1h lines depending on the diet, but not in R23h. This result strongly suggests that genetic background may influence the global profile of 5-mdC derivatives. Indeed, the HPLC-UV technique used here covered modifications occurring at all cytosine sites, including CpG and non-CpG sites. Cytosine residues across the whole genome can be subjected to polymorphism, which consequently may influence global methylation levels detected by HPLC-UV. Such an effect of genetic background on responses by the methylome to an environmental change has previously been described in trout exposed to different temperatures during embryonic development [Citation23]. In the present study, after 7 months of V-diet feeding, A22h seemed to be an inefficient user of this diet, with lower growth performance than AB1h and R23h fish (Supplementary Table 1); the latter two lines displaying an equivalent growth performance and nutritional index and had similar transcriptomic modifications [Citation10]. Indeed, fish with these genotypes were able to maintain a high level of energy production and protein synthesis. They were also able to activate pathways linked to lipid and cholesterol metabolisms, such as the biosynthesis of long-chain polyunsaturated fatty acids. AB1h also differed from R23h in the use of the V-diet, but mainly during the early stages of nutrition [Citation6]. Indeed, during the 5 weeks of first feeding with the V diet, R23h had a better acceptance of the diet and a better commencement of growth compared to A22h and AB1h. These early phenotypic differences may explain why the global profile of 5-mC derivatives is affected in the long term by the V-diet in A22h and AB1h but not in R23h. Indeed, epigenetic mechanisms, including DNA methylation, are highlighted as mechanisms of adaptation and response to environmental factors, and which, if persistent, have the potential to reflect previous exposure to stressful environmental changes [Citation29].
Concerning changes monitored in A22h and AB1h fish, our analysis of the overall 5-methylcytosine derivatives profile revealed global hepatic decrease in 5-dC level induced by the V diet in general, concomitant with a significant hypermethylation as evidenced by the increase in 5-mdC levels in AB1h but only a trend in A22h. Such hypermethylation was also reported using the same HPLC-UV technique in triploid juvenile salmon fed a vegetable-based diet for 6 weeks [Citation30]. However, in contrast to this previous study, we analysed all identified DNA demethylation derivatives and demonstrated that the V diet also induced an increase in hepatic 5-hmdC. There are accumulating evidences that this particular derivative is an environmental biosensor that is sensitive to nutritional and metabolic modifications [Citation31]. The prevalence of 5-hmdC in the mitochondrial epigenome has been reported in non-alcoholic fatty liver, a complex, metabolic-related disease [Citation32]. Similarly, a decreased level of 5-hmdC was shown to lead to metabolic disorders by enhancing mitochondrial respiratory activity in high-fat diet-induced diabetic mice [Citation33]. Interestingly, and in accordance with the latter correlation, by investigating the hepatic transcriptome of the same trout analysed in the present study (AB1h and A22h), Callet et al. (2021 [Citation10],) showed that genes coding for the mitochondrial respiratory chain were generally less expressed in trout fed the V diet, which presented higher 5-hmdC levels. Interestingly, recent findings in Nile Tilapia [Citation20] suggests that 5-hmdC may be involved in the regulation of liver metabolism- and growth-related genes highlighted a negative correlation between gene expression and 5hmC levels in muscle of fish.
In addition, results obtained in A22h fish revealed that the decrease in FI alone (M versus MR) or the composition of the V diet alone (MR versus V) appeared to have no effect on the modification of the overall profile of 5-methylcytosine derivatives. Changes observed in A22h RBT between M-and V-fed fish were thus due in all likelihood to a combined effect of both the composition per se of the diet and the decreased FI. By contrast in AB1h the decrease in FI alone has in all likelihood an impact on 5-dC level which was significantly different between M fed fish and MR/V fed fish. Despite higher growth performances than A22h (Suppl. ), AB1h had a lower FI when fed the MR or V diet than A22h which may explain the direct impact of the FI on DNA methylation in this line compared to A22h. Moreover, a decrease in FI leads to a decrease in caloric intake. To our knowledge, the influence of caloric/food restriction on DNA methylation has been poorly documented in fish, whereas in mammals, nutritional stress seems to induce differential responses (no changes in baboon liver [Citation34] or hepatic hypomethylation in rats [Citation35]). The effect of the V diet per se can probably be linked to its nutrient composition. Indeed, diet gives rise to nutrients after digestion, which are metabolized through the main metabolic pathways. Diet may influence global DNA methylation by providing or modifying the availability of methyl donor compounds or cofactors that regulate one-carbon metabolism [Citation12] or DNA (de)methylation reactions [Citation36] (such as α-ketoglutarate for TET action). With complex dietary composition, such as that of the V diet strongly differing from the M diet composition, it is difficult to discern which component(s) could be involved in methylome modification. For instance, the free methionine added to the V diet could act as a direct methyl donor group through one-carbon metabolism [Citation37]. Other nominated micronutrients include folates present in corn, which are also metabolized through one-carbon metabolism [Citation12] and may constitute an indirect reserve of S-adenosylmethionine.
mRNA levels of DNA (de)methylation-related genes are affected by the V diet depending on the isogenic line
Diet may influence global DNA methylation by regulating enzymes that catalyse or reverse methylation, such as Dnmt, Tet, or Tdg. Because of the 4th whole-genome duplication occurring at the radiation of salmonids [Citation38], many duplicated genes coding for Dnmt, Tet, or Tdg enzymes were retained in the genome of the RBT [Citation26] complicating the interpretation of gene expression analyses. In the present study, our results firstly showed that three of the analysed genes displayed no response to the diet conditions in none of the lines (tdgab, dnmt3bba1 and dnmt3bbb) whereas tet3a showed a similar pattern of response to the diet in the 3 lines (e.g., V> MR = M). Except from these 4 genes, the other studied genes revealed different responses to diets in at least one of the three RBT lines. This suggested that the expression of DNA (de)methylation-related genes in response to dietary modification may depend on genetic background. Such modulation depending on genetic background was also previously described for dnmt3 genes in trout subjected to environmental modification (temperature) during early development [Citation23]. The influence of the genetic background on expression of such genes is highlighted by our results concerning tet2c, which was found to be expressed only in AB1h fish, which may suggest profound genetic modification involving this gene between isogenic lines.
In addition, our results showed that the methylome of R23h was not affected by the diet conditions in contrast to AB1h and A22h (). Interestingly, mRNA levels of Dnmt-encoding genes were, overall, less affected by diet in R23h than in AB1h or A22h fish. Even if it is difficult to relate the methylome and gene expression pattern due to the high number of genes in trout and the fact that functions of duplicated genes are still unknown, our result suggests that dnmt-related genes can be, by their line-specific response to diets, involved in the methylome phenotype observed in the related lines.
Regarding the influence of diet on genes mRNA levels, overall tet and tdg mRNA levels were mainly higher in trout fed the V diet than in fish fed the M diet ad libitum or under restricted conditions. These results are coherent with the increase in 5-hmdc levels in A22h and AB1h animals at least for tet encoding genes. In contrast, the results obtained for the Dnmt coding genes remained difficult to interpret overall. Most of these genes were found to be downregulated in trout fed the V diet in A22h, whereas some were found to be up-regulated in AB1h trout fed the V diet, but most of the time, no difference was found with the M diet. Nutrients, such as dietary polyphenols, present in vegetal ingredients are known to impact the expression of DNA (de)methylation-related genes [Citation39]. To be able to better elucidate whether the action of Dnmt, Tet, and Tdg could underline modifications to the global methylation profiles observed in our experiments, enzymatic activities may be more relevant for analysis. However, the high percentage of identity shared by paralogous genes in trout [Citation26] does not allow for the moment to isolate their products and evaluate individual enzymatic activity resulting from each gene. In addition, these duplicated genes were only recently identified [Citation40] and there is currently a lack of knowledge concerning their functions.
Overall, we report here a fine-tuned analysis of the variation in mRNA levels of paralogous genes related to DNA (de)methylation in trout undergoing both modification of dietary composition and FI level. To our knowledge, our findings are the first to show that such genes are sensitive to nutritional changes in trout and that these changes appear to be genotype-dependent.
Conclusion
In conclusion, we highlighted for the first time that the global hepatic methylome in trout is affected by a plant-based diet, depending on RBT genetic background. Depending on the line, this latter effect appeared to be due to a decreased feed intake alone or combined with the effect of dietary composition per se. In addition, genes related to DNA (de)methylation processes have been shown to be sensitive to nutritional changes and for some of them in a line-dependent manner. These data improve our understanding of the differences observed between genotypes in trout in response to a 100% plant-based diet previously suggested by zootechnical and transcriptomic data.
Author contributions
FM, MDN, and LM conceived and designed the experiments. TC, JL, VV, and CH performed the analyses. LM and CH analysed the HPLC-UV data. LM wrote the manuscript, all authors have read and commented on the manuscript, and agreed with the final version.
Supplemental Material
Download MS Word (14.6 KB)Acknowledgments
We thank C. Burel for the diet formula and F. Sandres and F. Terrier for manufacturing the experimental diets (INRAE, Donzaq, France). We thank the PEIMA team for rearing fish.
Disclosure statement
No potential conflict of interest was reported by the author(s).
Data Availability Statement
The data that support the findings of this study are available from the corresponding author, LM ([email protected]), upon reasonable request.
Supplementary material
Supplemental data for this article can be accessed here
Additional information
Funding
References
- Council NR. Nutrient requirements of fish and shrimp. 2011. Doi:10.17226/13039.
- Panserat S, Hortopan G.A., Plagnes-Juan E, Kolditz C, Lansard M, et al. Differential gene expression after total replacement of dietary fish meal and fish oil by plant products in rainbow trout (Oncorhynchus mykiss) liver. Aquaculture. 2009;294:123–131.
- Panserat S, Kolditz C, Richard N, et al. Hepatic gene expression profiles in juvenile rainbow trout (Oncorhynchus mykiss) fed fishmeal or fish oil-free diets. Br J Nutr. 2008;100:953–967.
- Leaver MJ, Villeneuve LA, Obach A, et al. Functional genomics reveals increases in cholesterol biosynthetic genes and highly unsaturated fatty acid biosynthesis after dietary substitution of fish oil with vegetable oils in Atlantic salmon (Salmo salar). BMC Genomics. 2008;9:299.
- Tacchi L, Secombes CJ, Bickerdike R, et al. Transcriptomic and physiological responses to fishmeal substitution with plant proteins in formulated feed in farmed Atlantic salmon (Salmo salar). BMC Genomics. 2012;13:363.
- Callet T, Mathilde Dupont-Nivet, Morgane D, Christine B, Marianne C, et al. Detection of new pathways involved in the acceptance and the utilisation of a plant-based diet in isogenic lines of rainbow trout fry. PLoS ONE. 2018;13:e0201462.
- Quillet E, Dorson M, Le Guillou S, et al. Wide range of susceptibility to rhabdoviruses in homozygous clones of rainbow trout. Fish Shellfish Immunol. 2007;22:510–519.
- Balasubramanian MN, Panserat S, Dupont-Nivet M, et al. Molecular pathways associated with the nutritional programming of plant-based diet acceptance in rainbow trout following an early feeding exposure. BMC Genomics. 2016;17:449.
- Geurden I, Borchert P, Balasubramanian MN, et al. The positive impact of the early-feeding of a plant-based diet on its future acceptance and utilisation in rainbow trout. PLoS One. 2013;8:e83162.
- Callet T, Dupont-Nivet M, Danion M, Burel C, Cluzeaud M, et al. Why do some rainbow trout genotypes grow better with a complete plant-based diet? Transcriptomic and physiological analyses on three isogenic lines. Front Physiol. 2021. DOI:10.3389/fphys.2021.732321.
- Angers B, Castonguay E, Massicotte R. Environmentally induced phenotypes and DNA methylation: how to deal with unpredictable conditions until the next generation and after. Mol Ecol. 2010;19:1283–1295.
- Anderson OS, Sant KE, Dolinoy DC. Nutrition and epigenetics: an interplay of dietary methyl donors, one-carbon metabolism and DNA methylation. J Nutr Biochem. 2012;23:853–859.
- Zhang N. Epigenetic modulation of DNA methylation by nutrition and its mechanisms in animals. Anim Nutr. 2015;1:144–151.
- Barrès R, Osler ME, Yan J, et al. Non-CpG methylation of the PGC-1alpha promoter through DNMT3B controls mitochondrial density. Cell Metab. 2009;10:189–198.
- He Y-F, Bin-Zhong L, Zheng L, Peng L, Yang W, Qingyu T, Jianping D, et al. Tet-mediated formation of 5-carboxylcytosine and its excision by TDG in mammalian DNA. Science. 2011;333:1303–1307.
- Kagiwada S, Kurimoto K, Hirota T, et al. Replication-coupled passive DNA demethylation for the erasure of genome imprints in mice. EMBO J. 2013;32:340–353.
- Kellinger MW, Song C-X, Chong J, et al. 5-formylcytosine and 5-carboxylcytosine reduce the rate and substrate specificity of RNA polymerase II transcription. Nat Struct Mol Biol. 2012;19:831–833.
- Song C-X HC. Potential functional roles of DNA demethylation intermediates. Trends Biochem Sci. 2013;38:480–484.
- Sun W, Zang L, Shu Q, et al. From development to diseases: the role of 5hmC in brain. Genomics. 2014;104:347–351.
- Konstantinidis I, Anastasiadi D, Sætrom P, et al. Epigenetic mapping of the somatotropic axis in Nile tilapia reveals differential DNA hydroxymethylation marks associated with growth. Genomics. 2021;113:2953–2964.
- Konstantinidis I, Sætrom P, Mjelle R, et al. Major gene expression changes and epigenetic remodelling in Nile tilapia muscle after just one generation of domestication. Epigenetics. 2020;15:1052–1067.
- Bachman M, Uribe-Lewis S, Yang X, et al. 5-Formylcytosine can be a stable DNA modification in mammals. Nat Chem Biol. 2015;11:555–557.
- Lallias D, et al. Sources of variation of DNA methylation in rainbow trout: combined effects of temperature and genetic background. Epigenetics. 2020;1–22. DOI:10.1080/15592294.2020.1834924.
- Hermann A, Goyal R, Jeltsch A. The Dnmt1 DNA-(cytosine-C5)-methyltransferase methylates DNA processively with high preference for hemimethylated target sites. J Biol Chem. 2004;279:48350–48359.
- Okano M, Xie S, Li E. Cloning and characterization of a family of novel mammalian DNA (cytosine-5) methyltransferases. Nat Genet. 1998;19:219–220.
- Liu J, Hu H, Panserat S, et al. Evolutionary history of DNA methylation related genes in chordates: new insights from multiple whole genome duplications. Scientific Reports. 2020;10:970.
- Marandel L, Seiliez I, Véron V, et al. New insights into the nutritional regulation of gluconeogenesis in carnivorous rainbow trout (Oncorhynchus mykiss): a gene duplication trail. Physiol Genomics. 2015;47:253–263.
- Kovatsi L, Fragou D, Samanidou V, et al. Evaluation of 5-methyl-2’-deoxycytidine stability in hydrolyzed and nonhydrolyzed DNA by HPLC-UV. Bioanalysis. 2012;4:367–372.
- Mirbahai L, Chipman JK. Epigenetic memory of environmental organisms: a reflection of lifetime stressor exposures. Mutat Res Genet Toxicol Environ Mutagen. 2014;764–765:10–17.
- Vera LM, Metochis C, Taylor JF, et al. Early nutritional programming affects liver transcriptome in diploid and triploid Atlantic salmon, Salmo salar. BMC Genomics. 2017;18:886.
- Dao T, Cheng RYS, Revelo MP, et al. Hydroxymethylation as a novel environmental biosensor. Curr Environ Health Rep. 2014;1:1–10.
- Pirola CJ, Scian R, Gianotti TF, et al. Epigenetic modifications in the Biology of Nonalcoholic fatty liver disease: the role of DNA Hydroxymethylation and TET proteins. Medicine (Baltimore). 2015;94:e1480.
- Liu R, Chen L, Wang Z, et al. Downregulation of the DNA 5-hydroxymethylcytosine is involved in mitochondrial dysfunction and neuronal impairment in high fat diet-induced diabetic mice. Free Radic Biol Med. 2020;148:42–51.
- Unterberger A, Szyf M, Nathanielsz PW, et al. Organ and gestational age effects of maternal nutrient restriction on global methylation in fetal baboons. J Med Primatol. 2009;38:219–227.
- MacLennan NK, James SJ, Melnyk S, et al. Uteroplacental insufficiency alters DNA methylation, one-carbon metabolism, and histone acetylation in IUGR rats. Physiol Genomics. 2004;18:43–50.
- Gut P, Verdin E. The nexus of chromatin regulation and intermediary metabolism. Nature. 2013;502:489–498.
- Niculescu MD, Zeisel SH. Diet, methyl donors and DNA methylation: interactions between dietary folate, methionine and choline. J Nutr. 2002;132:2333S–2335S.
- Berthelot C, Brunet F, Chalopin D, Juanchich A, Bernard M, et al. The rainbow trout genome provides novel insights into evolution after whole-genome duplication in vertebrates. Nat Commun. 2014;5:3657.
- Russo GL, Vastolo V, Ciccarelli M, et al. Dietary polyphenols and chromatin remodeling. Crit Rev Food Sci Nutr. 2017;57:2589–2599.
- Liu J, Hu H, Panserat S, et al. Evolutionary history of DNA methylation related genes in chordates: new insights from multiple whole genome duplications. Sci Rep. 2020;10:970.